
95% of researchers rate our articles as excellent or good
Learn more about the work of our research integrity team to safeguard the quality of each article we publish.
Find out more
ORIGINAL RESEARCH article
Front. Earth Sci. , 30 May 2022
Sec. Structural Geology and Tectonics
Volume 10 - 2022 | https://doi.org/10.3389/feart.2022.893558
This article is part of the Research Topic Active Faults and Earthquake due to Continental Deformation View all 25 articles
 Liguo Li1,2
 Zhigang Li1,2*
 Chuang Sun1,2
 Weitao Wang1,2
 Xiangming Dai1,2Yipeng Zhang1,2
 Hao Liang1,2
 Binbin Xu1,2Xiancan Wu1,2Liangwei Lv1,2
The arc-shaped tectonic belt, located in the northeastern margin of the Tibetan Plateau, is one of the leading edges of the plateau’s outward growth and uplift expansion, with a large number of active faults and frequent seismic activity. Researchers have carried out numerous studies on active faults in this region, and a wealth of reliable basic data has been accumulated. However, integrating multidisciplinary data to establish a 3D geometrical structure model that is concerned about seismogenic tectonics and can be tested, has become the key to restricting the regional seismic hazard evaluation. Based on a series of published active tectonic research, we analyze in detail the surface and deep coupling relationships of the major active faults in this region and establish three sets of 3D fault structure models, which are built respectively by active fault mapping and dip angles (the V1 model), 7 magnetotelluric profiles and 7 auxiliary profiles (the V2 model), and multi-source data (the V3 model) and continuously close to the real geological facts. From the model perspective, it is suggested that the controversial Haiyuan fault is a crustal-scale left-slip fault and the shape of the Liupanshan fault reflects the absorption of the left-slip component of the Haiyuan fault. Comparing the same fault plane of these three models, we find that the V3 model is more consistent with geological facts, showing that by assisting the multi-source data 3D geological modeling technique we can establish a 3D geological model closest to the real regional structure. Finally, combining the V3 model, the fault segmentation, and the empirical formulas of the moment magnitude-rupture parameters, we segment the faults and calculate the potential moment magnitudes of the major active faults in the study region. The faults with relatively higher seismic hazards are the Liupanshan fault, the southeastern segment of the Xiangshan-Tianjingshan fault, the westernmost segment of the Haiyuan fault, and the West Qinling fault, of which the estimated potential moment magnitudes are generally more than 7.0. Our study provides a referenced 3D geological model for exploring the deep structures of the region, regional geological research, and earthquake disaster prevention.
A large number of studies have shown that faults have non-single planes and complex geometric structures in 3D space, which control the rupture behavior of strong and large earthquakes (e.g., Evans et al., 2020; Ross et al., 2020). How to visually describe the fine 3D geometry of the fault underground has always been an unavoidable problem for structural geologists (e.g., Fischer and Wilkerson, 2000; Plesch et al., 2007; Guan et al., 2010). Since the concept of 3D geological modeling was proposed in the 1990’s (Houlding, 1994), with the rapid development of computer technology, the establishment of 3D geological models that can reveal information about rock mass structure relationships and strata spatial distribution in computers has also become more and more sophisticated. 3D geological models have been the product of the mutual intersection of geography, geology, computer graphics, mathematics, computational geometry, environmental science, and other disciplines (Li et al., 2016b).
3D geological modeling methods are classified according to model data sources and can be divided into drilling-based, field-based geological data, geological section, and multi-source data modeling (eg, Carena and Suppe, 2002; Riesner et al., 2017; Yue et al., 2005; Wu et al., 2015, Wu et al., 2016). If it is only explained by the geometrically constrained fault structure, the results are generally uncertain and diversified (Evans et al., 2020; Li et al., 2007; Li et al., 2019b; Ramsay and Huber, 1987; Ross et al., 2020; Tavani et al., 2005). At present, the technology of building 3D geological structure models by comprehensively using a series of multi-source data such as shallow geology, artificial earthquake, and drilling data has become increasingly mature, and it has great application value whether it is for a single geological structure or complex regional active faults (e.g., Hubbard et al., 2016; Jia et al., 2010; Li et al., 2010, Li et al., 2013, Li et al., 2014; Li et al., 2019a; Li et al., 2021; Plesch et al., 2007; Shaw and Plesch, 2012; Shaw et al., 2015; Wang et al., 2020), which provides a new idea for the study of geometric forms and distribution in the 3D underground space of faults.
The arc-shaped tectonic belt in the northeastern margin of the Tibetan Plateau is one of the frontal parts of the entire plateau growing outward and uplifting expansion (e.g., Tapponnier et al., 2001; Zhang et al., 2003), located at the northernmost of the North-South seismic zone and has bred numerous active faults (Deng, 2007). Researchers have carried out a large number of active fault surveys, geophysical explorations, and seismological research in this area, so abundant and reliable original data has been accumulated. But at present, no researcher has used these data to carry out detailed 3D geological modeling work of this region. In addition, due to the boundaries of multiple active blocks in this area, the intracontinental tectonic movement and fault activity is strong, and a series of historical strong earthquakes have occurred, such as the 734 A.D. Tianshui M 71/2 earthquake, the 1125 A.D. Lanzhou M 7 earthquake, the 1622 A.D. North Guyuan M 7 earthquake and the 1920 A.D. Haiyuan M 81/2 earthquake (Lei et al., 2007; Mei et al., 2012; Yuan et al., 2013).
At present, some of the structures of the arc-shaped tectonic belt in the northeastern margin of the Tibetan Plateau are still somewhat controversial. For example, for the extended depth of the Haiyuan fault, different researchers have used different methods to reveal whether it cuts through the Moho, and the deep structure of the Haiyuan fault needs further research. Zhan et al. (2005) and Jin et al. (2012) revealed that the Haiyuan fault is a deep fault that cuts the Moho by magnetotelluric profiles, the comprehensive geophysical profile shows that the Moho beneath the Haiyuan fault is a complex transition zone (Li et al., 2002), and the offset of the Moho beneath the Haiyuan fault can be directly observed by receiver function profile (Ye et al., 2015). Based on field geological investigation, Burchfiel et al. (1991) conclude that the Haiyuan fault is a fault terminating at the base of the upper crust, and some seismic reflection profiles (Gao et al., 2013; Guo et al., 2016) and magnetotelluric profiles (Min, 2012; Xia, 2019) also indicate that the Haiyuan fault does not cut through the Moho. Through 3D geological modeling, we can effectively clear the structure of the arc-shaped tectonic belt in the northeastern margin of the Tibetan Plateau and provide the most credible 3D geological model of this region, providing a basis for subsequent regional research work. Similar to the above problem, although there is a large amount of data accumulated in the region, a paradox of uncoupled data in the modeling process. How to efficiently integrate multiple sources of data to make the model close to reality is also a key challenge in the multi-source data 3D geological modeling technology. Ultimately, our model will serve earthquake prevention and disaster reduction in the study area with frequent earthquakes. Use the 3D geological model to study the seismic activity of major active faults, then focus on the prevention in advance in cities with large earthquake risks to reduce the loss of life and property. Therefore, the arc-shaped tectonic belt in the northeastern margin of the Tibetan Plateau has become an ideal area for studying 3D geological modeling and fault activity of active faults.
To establish the 3D fault model of the main active faults in the arc-shaped tectonic belt in the northeastern margin of the Tibetan Plateau, we will collect 2D profiles revealing the coupling relationship between the surface and deep in the study area, geological surveys of active faults, and regional Digital Elevation Model (DEM) data. Then we will use the above data to extract the 3D information of faults and detachment layers, assist the SKUA-GOCAD software to generate models, and explore the reasonable method of integrating multi-source data to generate the 3D geological models. Based on the models, we will update the geological understanding of the relevant active faults, analyze the deep segmental properties of the main active faults in the study area, and estimate the seismic moment magnitude of each segment of the fault, to provide a theoretical basis for regional seismic risk assessment.
In this research, 3D geological modeling will focus on the main active faults developed in the arc-shaped tectonic belt in the northeastern margin of the Tibetan Plateau, including the West Qinling fault (WQLF), the Maxianshan fault (MXSF), the Haiyuan fault (HYF), the Xiangshan-Tianjingshan fault (XS-TJSF), the Yantongshan fault (YTSF), the Liupanshan fault (LPSF), and the Xiaoguanshan fault (XGSF) and the Qishan-Mazhao fault (QS-MZF) (Figure 1). Due to the special geographical location and strong Late Quaternary tectonic deformation in this area, it has always been a hotspot for the study of neotectonics and active tectonics (Zheng et al., 2016). Researchers have studied the geometric structure, motion properties, activity periods, and historical earthquakes of the above-mentioned faults to a considerable extent.

FIGURE 1. Topography and major active faults in the arc-shaped tectonic belt in the northeastern margin of the Tibetan Plateau [modified from Zheng et al. (2016); Zheng et al. (2019)]. The major main faults are shown as fine black lines, whereas the modeling faults are shown by thick gray lines. Recorded historical earthquakes (i.e., M ≥ 5) are shown as red circles [modified from Zheng et al. (2019)] The locations of profiles (Figures 2A,B, solid red lines) are indicated. XS-TJSF, Xiangshan-Tianjingshan fault; HYF, Haiyuan fault; YTSF, Yantongshan fault; XGSF, Xiaoguanshan fault; LPSF, Liupanshan fault; MXSF, Maxianshan fault; WQLF, West Qinling fault; QS-MZF, Qishan-Mazhao fault; LX-BJFZ, Longxian-Baoji fault zone (The following abbreviations have the same meaning).
The WQLF is located between the HYF and the eastern Kunlun fault, which is an ultra-crust fault that cuts through the Moho in the southern part of the study area, with a depth of about 50 km (Guo et al., 2016; Huang et al., 2017; Ye et al., 2015; Zhan et al., 2014). The fault extends from the vicinity of Baoji in the west of the Weihe Basin to Tongren, Qinghai Province in the west of Linxia, with a total length of about 420 km, a general strike of 280°–310°, and dip angles of 50°–85° (Shao et al., 2011). Since the Quaternary, it has been mainly dominated by left-slip with a relatively small dip-slip component. According to historical records, there have been eight historical strong earthquakes along the WQLF, including five earthquakes of magnitude 6 or higher, which are the 128 A.D. Gangu M 61/2 earthquake, the 143 A.D. Gangu M 71/4 earthquake, the 734 A.D. Tianshui M 71/2 earthquake, the 1765 A.D. Gangu-Wushan M 61/2 earthquake, and the 1936 A.D. Kangle M 63/4 earthquake (Lei et al., 2007; Yuan et al., 2007; Zhang, 2020b).
The MXSF zone is located in the southern mountainous area of Lanzhou and consists of four secondary faults, of which the northern margin fault of the Maxianshan is the main fault, with the largest scale and the strongest activity (Yuan et al., 2003; Yuan et al., 2013). The northern margin fault of the Maxianshan has a total length of about 115 km, a general strike of N60°W, a tendency of SW, and a steep dip, which is a lower crustal-scale left-slip fault extending to about 40 km with a thrust component (Gao et al., 2013; Guo et al., 2016; Huang, 2017; Xin et al., 2021; Yuan et al., 2003; Yuan et al., 2013; Zhao, 2014). According to the textual research of historical seismic data, many earthquakes of moderate strength or above have occurred in this area, such as the 1125 A.D. Lanzhou M 7 earthquake, the 1590 A.D. Southeast Yongjing M 61/2 earthquake, the 1524 A.D. Maxianshan M 5 earthquake, the 1629 A.D. Lanzhou M 51/2 earthquake, the 1901 A.D. West Lanzhou M 5 earthquake, and others (Yuan et al., 2013).
The HYF starts from Xiaokou, Guyuan in the eastern Liupanshan piedmont, passes through Haiyuan, crosses the Yellow River, and extends northwest to the Xijishui left-stepped pull-apart basin in Jingtai, with a total length of about 240 km. The HYF is mainly left-slip motion with thrust component and dips to SSW with a large dip angle, of which the strike gradually changes from NNW to NWW from east to west and generally presents a slight arc protruding NE. The 1920 A.D. Haiyuan M 81/2 earthquake occurred on this fault, forming a maximum left-lateral displacement of 10 m and a 230 km long surface rupture zone.
The XS-TJSF is also known as the Zhongwei-Tongxin fault with a total length of about 200 km, whose overall shape is similar to the HYF, presenting an arc slightly protruding NE in the middle. In this study, taking the compression stage area of two secondary faults intersecting at an angle of 17° at Shuangjingzi, Zhongwei as the boundary, the fault is divided into the northwest segment and the southeast segment (Li, 2014). The northwestern segment of the XS-TJSF strikes near E-W, dipping to S with steep dip angles, and is dominated by left-slip motion with either normal or thrust component, which also was the seismogenic fault of the 1709 A.D. Zhongwei M 71/2 earthquake. The southeastern segment is a thrust fault dipping to SW with left-slip property, and the general strike is near NW (Min et al., 2001; Li, 2014; Li et al., 2016a).
The YTSF is the third arc-shaped fault protruding northeastward in the northeastern margin of the Tibetan Plateau. The fault is mainly dominated by thrusting motion with a total length of over 150 km, a tendency of NW-NNW, a dip direction of SW, and dip angles of 40°–70° (Li and Shen, 2001; Qin et al., 2017). The linear contour of the fault is not obvious, and there are no active profiles and various geomorphological manifestations in the Holocene, indicating that the activity has been weak since the Late Quaternary (Min, 1998).
The LPSF is NNW-near SN as a whole with a length of about 175 km. The northernmost end of the fault is connected to the left-slip HYF near Xiaokou, Guyuan, and extends southward through Huating, Gansu Province to the vicinity of Longxian, Shaanxi Province, and is connected to the Longxian-Baoji fault zone. The LPSF is the main active fault in the Liupanshan area, dipping to SW and mainly dominated by thrust motion. The measured dip angles in the north are about 50°–55° and those in the south are 40°–60° (Shi, 2011b; Wang, 2018). The Liupanshan area has experienced the 600 A.D. Qinlong M 63/4 earthquake, the 1219 A.D. Guyuan M 7 earthquake, the 1306 A.D. Guyuan M 7 earthquake, and the 1622 A.D. North Guyuan M 7 earthquake, which are mainly concentrated in the northern segment of the fault. There are few historical records of strong earthquakes in the middle and south segments, which are unbroken active faults with the potential risk of strong earthquakes (Du et al., 2018; Lei et al., 2007; Mei et al., 2012; Wang et al., 2018).
The XGSF is located on the eastern side of the Liupanshan, nearly parallel to the eastern Liupanshan piedmont fault. It is a W-dipping thrust fault with a length of about 60 km and dip angles of 40°–50°. The Cretaceous Liupanshan group thrusts onto the Tertiary red bed (Zhang, 1990).
Located on the southwestern edge of Ordos, the QS-MZF is the largest, longest, and most active fault in the Longxian-Baoji fault zone (Shi, 2011a; Li, 2017). The fault has a total length of about 180 km, a strike 300°–320°, and dip angles of 70°–85°. According to field surveys, the features of various geomorphological bodies along the QS-MZF trace show that the fault movement mode is mainly left-slip, with a normal fault motion component (Li, 2017).
The data used in this study can be mainly divided into two parts: 1) surface traces of active faults, and 2) deep structures of active faults. The surface traces are derived from the accurate and reliable geological mapping of active faults (Deng et al., 2002; Zheng et al., 2016, Zheng et al., 2019). The deep structures of active faults come from published research of seismic reflection profiles, geological profiles, magnetotelluric profiles, tomographic imaging profiles, receiver function profiles, accurate location of small earthquakes, and focal mechanism solutions in the arc-shaped tectonic belt in the northeastern margin of the Tibetan Plateau. The geological mapping of active faults provides accurate fault surface traces for this study, which is not only the highest priority data for limiting fault surface locations but also the prerequisite for constraining the deep structural profile data of faults. With current technology, it is impossible to directly observe the deep structure of the earth. The indirect observation of the deep geometric structures of the faults through numerous 2D profiles published by researchers is the main way to constrain the deep structures of active faults in this study.
Before the establishment of the 3D geological models, this study fully collected a series of data revealing the deep geometric structures of active faults in the study area, mainly including digital image data of the profile locations and the 2D profiles. Digital image data involves multiple disciplines, technical equipment updates, and different processing institutions, making the collected data have the properties of multiple sources, multiple resolutions, and multiple standards. Therefore, through the evaluation and weighting of multi-source data, this research takes the data closer to the true deep geometric structure of the fault as the main body, extracts control points at a density of about 2 km horizontally, and extracts control points of low-priority data at a horizontal interval of about 4 km, to obtain the 3D space coordinate sets corresponding to the faults and detachment layers.
According to the most accurate geological mapping of active faults, the surface traces of each active fault are outlined in the geological map. Considering that each active fault has segmental properties, and the current resolution of the 2D profiles cannot reach the accuracy of revealing the segmental structure of deep fault sections, the fault trace of each fault is fitted into a continuous trace distribution in this study (Figure 1). The geological map is registered through ArcGIS software and corrected to the CGCS2000 GK CM 105E projection coordinate system. Add control points according to the surface trace, add latitude and longitude coordinates for the control points and export the coordinate point set. Combined with DEM data, the elevation information is added to the control points of the corresponding surface trace to obtain complete 3D data.
Firstly, the profile locations are usually indicated in regional geological maps of the published literature, by which we can locate the specific distribution of each profile. Through ArcGIS software, register the corresponding regional geological map, project the longitude and latitude coordinate point set of active fault surface trace control points extracted in step (1), correct the profile location, and extract the profile distribution coordinates. Secondly, import 2D profile images into Adobe Illustrator software, add active fault control points with the corresponding horizontal point density according to the proportional scale in the figures and count the depth information (Figure 2). Then, the 2D profile images are registered with the profile distribution coordinates, and the latitude and longitude coordinates of the control points are extracted via ArcGIS software. Data processing in ArcGIS software is unified to CGCS2000 GK CM 105E projected coordinate system. Finally, based on the above data, 3D coordinate point set files of the control points of each corresponding fault and detachment layer are sorted out.
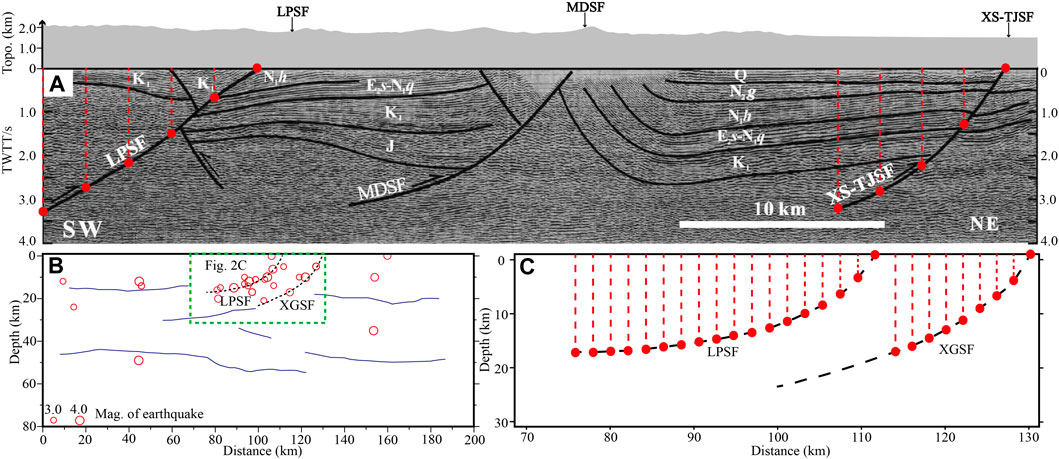
FIGURE 2. (A) Extraction of fault control points in seismic reflection profile [modified from Wang (2011); Wang et al. (2014)]; (B) Receiver function profile [modified from Tian et al. (2021)]; (C) Extraction of fault control points in receiver function profile. The locations of profiles are shown in Figure 1. The range of (C) is shown in (B). Red dashed lines represent auxiliary lines, red solid circles represent control point locations, and red hollow circles represent earthquakes of magnitude 3.0 and 4.0. MDSF, Madongshan fault.
The extracted 3D data point set was imported into SKUA-GOCAD software (Figure 3). Then assist the function of the “Structure and Stratigraphy” module to draw strata and fault planes (Li et al., 2016b). Due to the possible sparsity of the modeling data sources, the constructed 3D geological fault plane model is relatively rough. The SKUA-GOCAD software uses a combination of discrete smoothing and Kriging interpolation methods to interpolate the sparse and empty area of the data to smooth the fault plane model (Franke, 1982; Mallet, 1992).
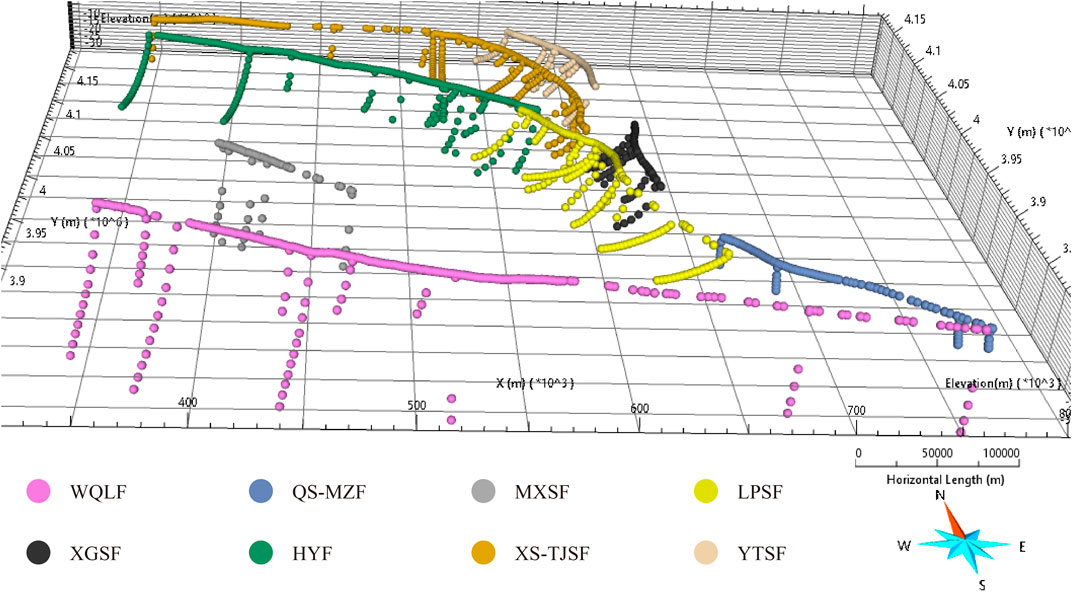
FIGURE 3. 3D point set of the V3 model in SKUA-GOCAD software. The control points of different faults are represented by different colored spheres.
In the past decades, to analyze the potential seismic hazards, a series of formulas of the moment magnitude-rupture parameters have been proposed by researchers, among which the most widely used is the empirical formulas proposed by Wells and Coppersmith (1994) that the earthquake magnitude corresponds to the surface rupture length (SRL), subsurface rupture length (RLD), rupture area (RA), and average displacement (AD) respectively. Cheng et al. (2020) collected seismic data from 91 earthquakes in mainland China and adjacent areas and used general orthogonal regression to derive the magnitude-rupture scaling relations. Their results were close to the statistical results given by global data without considering the five major earthquakes in eastern China before 1900 (Blaser et al., 2010; Hanks and Bakun, 2002; Wells and Coppersmith, 1994). Therefore, in this study, Eqs 1–5, which are more representative of the empirical seismic magnitude-rupture scale relationship in China, were used to estimate the seismic moment magnitudes (Cheng et al., 2020).
For strike-slip earthquakes
For thrust earthquakes
At the early stage of this study, the initial 3D fault model V1 of active faults in the arc-shaped tectonic belt in the northeastern margin of the Tibetan Plateau was established (Figure 4, hereinafter referred to as the “V1 model”). The V1 model involves the deep structures of four large-scale active faults, namely, the HYF, the XS-TJSF, the LPSF, and the WQLF, and a set of detachment layers with continuously changing depths is also set up. The surface part of the initial V1 model is controlled by the main 3D control points extracted from the fault surface trace. The deep structure setting of the model is as follows. For the HYF, the WQLF, and the northwestern segment of the XS-TJSF, which are left-slip in nature, the dip angle is uniformly set to 90°. For the LPSF and the southeastern segment of the XS-TJSF with a thrust nature, the dip angle variation along the strike of the faults is determined according to the actual geological surveys. In this model, it is considered that the detachment layer with a depth of about 24 km controls the development of all faults in this region.
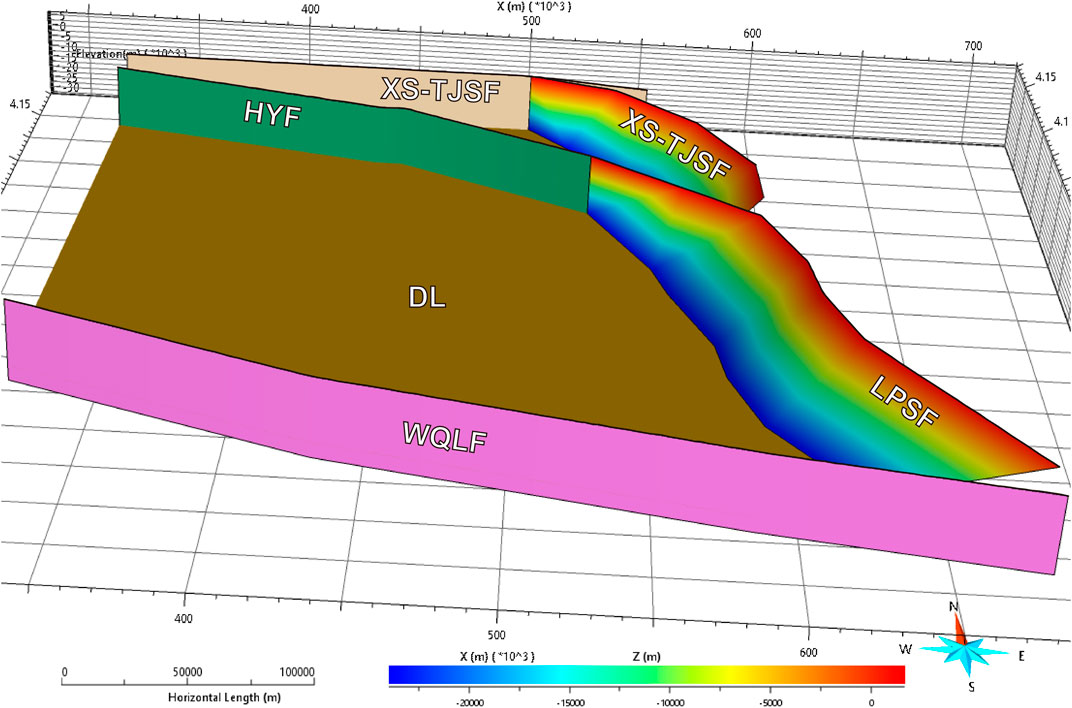
FIGURE 4. Side view of the initial 3D fault model V1 of the active faults in the arc-shaped tectonic belt in the northeastern margin of the Tibetan Plateau. The color of thrust faults varies with depth, and the left-slip faults are indicated by a single color (The fault colors in Figure 6 and Figure 7 have the same meaning). DL, detachment layer of 24 km deep.
In the initial V1 model, firstly, the density of control points extracted from the surface traces of each fault is insufficient, which cannot accurately reflect the surface strike change of each fault, and secondly, the deep structures of each fault are only constrained by the geological dip angles. Therefore, the constraints at all levels of the V1 model are not accurate enough, and only the structure of active faults in the region can be briefly displayed. The model is still far from reaching our modeling goal, but it verifies for us the feasibility of establishing the 3D fault model of major active faults in the arc-shaped tectonic belt in the northeastern margin of the Tibetan Plateau.
Given the shortcomings of the V1 model mentioned in Section 3.1 above, rational optimization of this model is the main direction of this research. The most effective way to optimize the fault surface trace is to encrypt the control points, to improve the accuracy of the fault surface trace. Therefore, we encrypt and extract the latitude and longitude coordinates of the control points at the turning points and curvature changes of the trace, then project them onto DEM to obtain the complete 3D spatial coordinates with depth information. For the deep structure information of each fault, this study combines published geological, geophysical, and seismic data to interpret the deep structures of main active faults and detachment layers in 7 magnetotelluric profiles and 7 auxiliary profiles (Figure 5) in the study area. Then extract 3D spatial coordinates of the deep structures, and obtain the accurate location of small earthquakes in the study area simultaneously (Zhan et al., 2020). Finally, with the aid of the SKUA-GOCAD software modeling function, the 3D fault model V2 of the active faults in the arc-shaped tectonic belt in the northeastern margin of the Tibetan Plateau was obtained (Figure 6, hereinafter referred to as the “V2 model”).
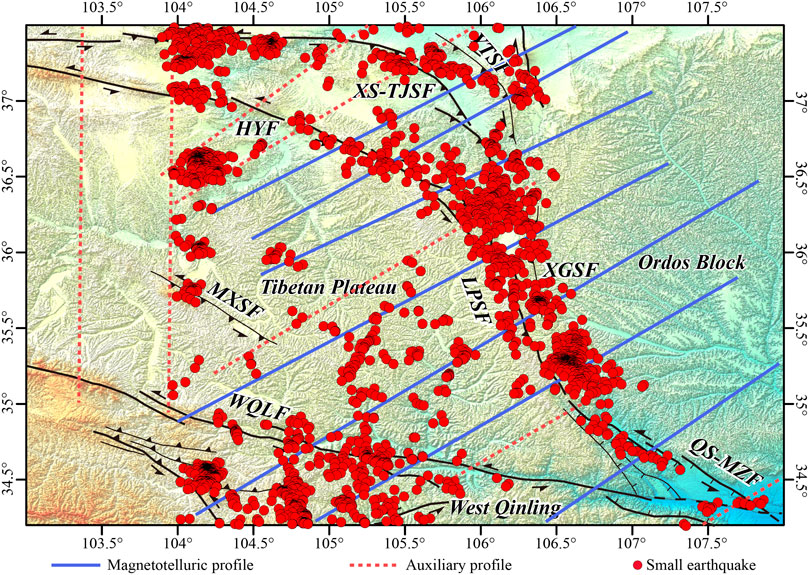
FIGURE 5. Distribution of modeling profiles and small earthquakes in the V2 model. Small earthquakes occurred from 1 January 1990 to 30 June 2018, with magnitudes less than 6.7 (Zhan et al., 2020).
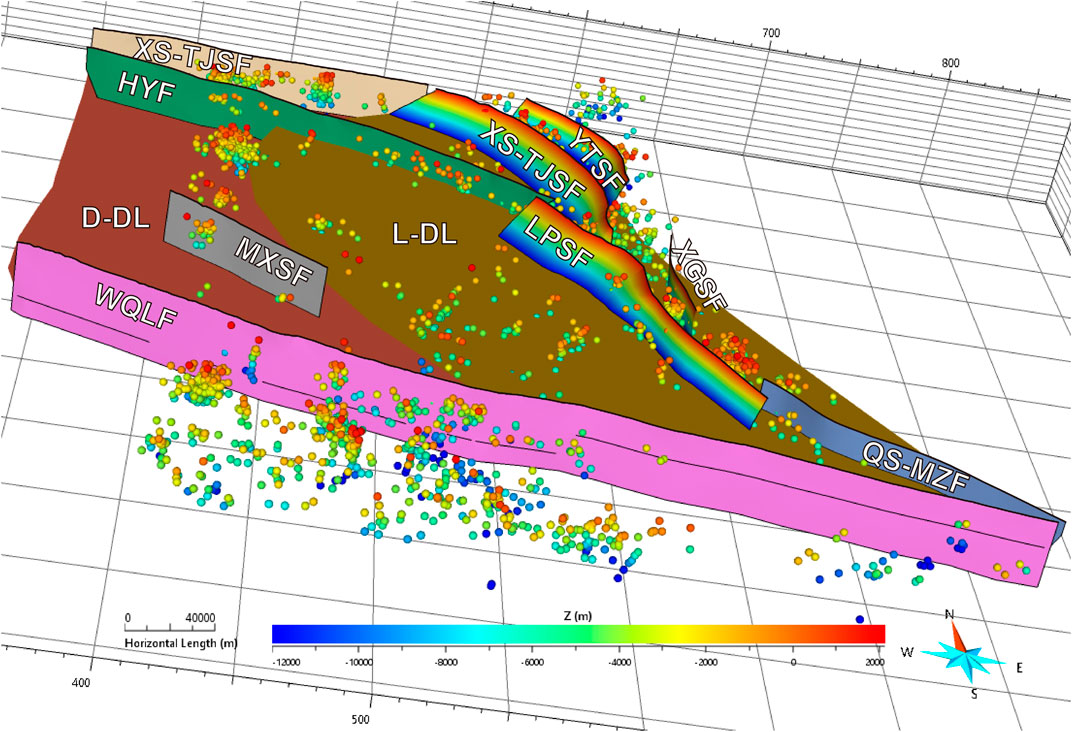
FIGURE 6. Side view of 3D fault model V2 of the active faults in the arc-shaped tectonic belt in the northeastern margin of the Tibetan Plateau. The different colored spheres represent the accurate locations of small earthquakes at different depths (The spheres in Figure 7 and Figure 13 have the same meaning). L-DL, detachment layer of 12 km deep; D-DL, detachment layer of 22 km deep (The abbreviations in Figure 7 and Figure 12 have the same meaning).
The modeling scope of the V2 model has been extended to more active faults in the study area, such as the MXSF, the YTSF, the XGSF, and the QS-MZF, which are relatively small-scale faults. According to the published research, two sets of detachment layers with depths of 12 and 24 km were installed in the V2 model to replace the detachment layer with a depth of 24 km in the V1 model (Du et al., 2018; Tian et al., 2021; Xia, 2019). In addition, the accurate locations of small earthquakes are added to the model to visualize the relationship between the deep geometry of active faults and the distribution of small earthquakes, which provides model support for studying the relationship between the fault structure and earthquakes and evaluating the regional seismic risk.
The optimization direction of the third model is mainly about the deep structure of the relevant active faults. To achieve this purpose, we searched a large number of published literature and obtained a series of 2D profiles passing through the arc-shaped tectonic belt in the northeastern margin of the Tibetan Plateau. The surface traces, accurate location of small earthquakes, and detachment layers distribution of the third model follow the extracted information of the V2 model. For the deep structures of the faults, this study adopts 7 seismic reflection profiles, 3 geological profiles, 22 magnetotelluric profiles, 9 accurate location profiles of small earthquakes, 4 tomographic imaging profiles, and 1 receiver function profile from many collected profiles (Figure 7, Table 1), aiming to use multidisciplinary data to finely characterize the 3D subsurface structures of active faults. Based on the above data, we built the 3D fault model V3 of the active faults in the arc-shaped tectonic belt in the northeastern margin of the Tibetan Plateau (Figure 8, hereinafter referred to as the “V3 model”).
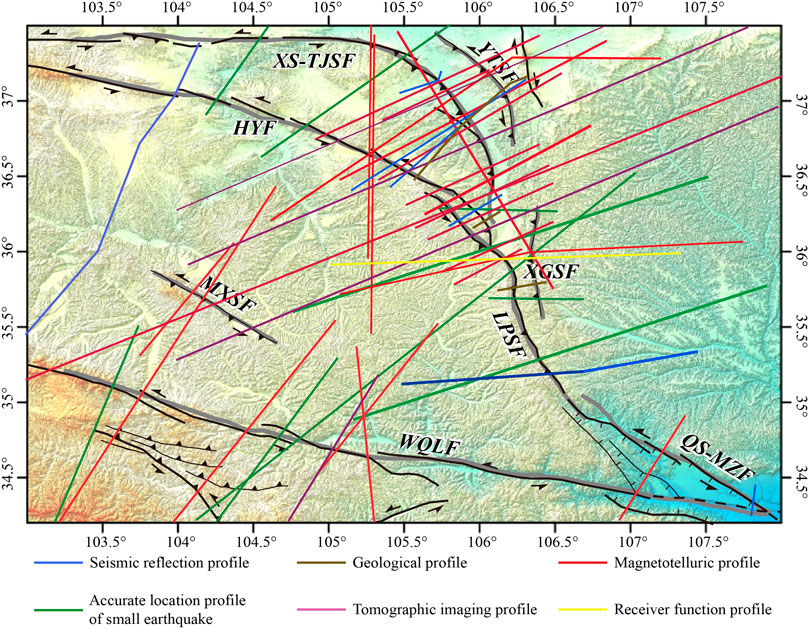
FIGURE 7. Distribution of modeling profiles in the V3 model. The modeling profiles corresponding to each fault, profile types, and references are shown in the Table 1.
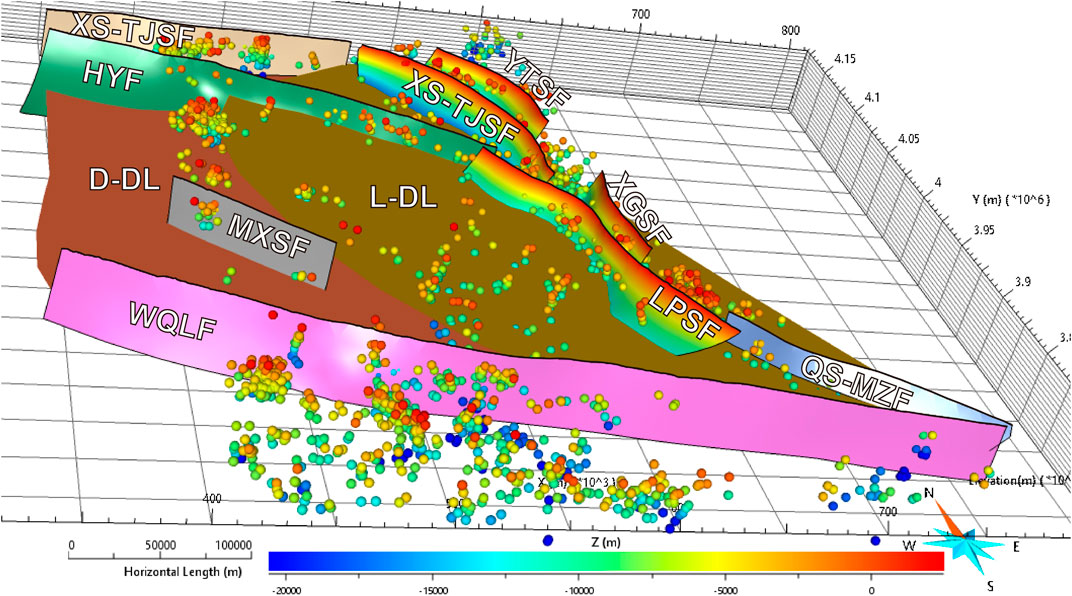
FIGURE 8. Side view of 3D fault model V3 of the active faults in the arc-shaped tectonic belt in the northeastern margin of the Tibetan Plateau.
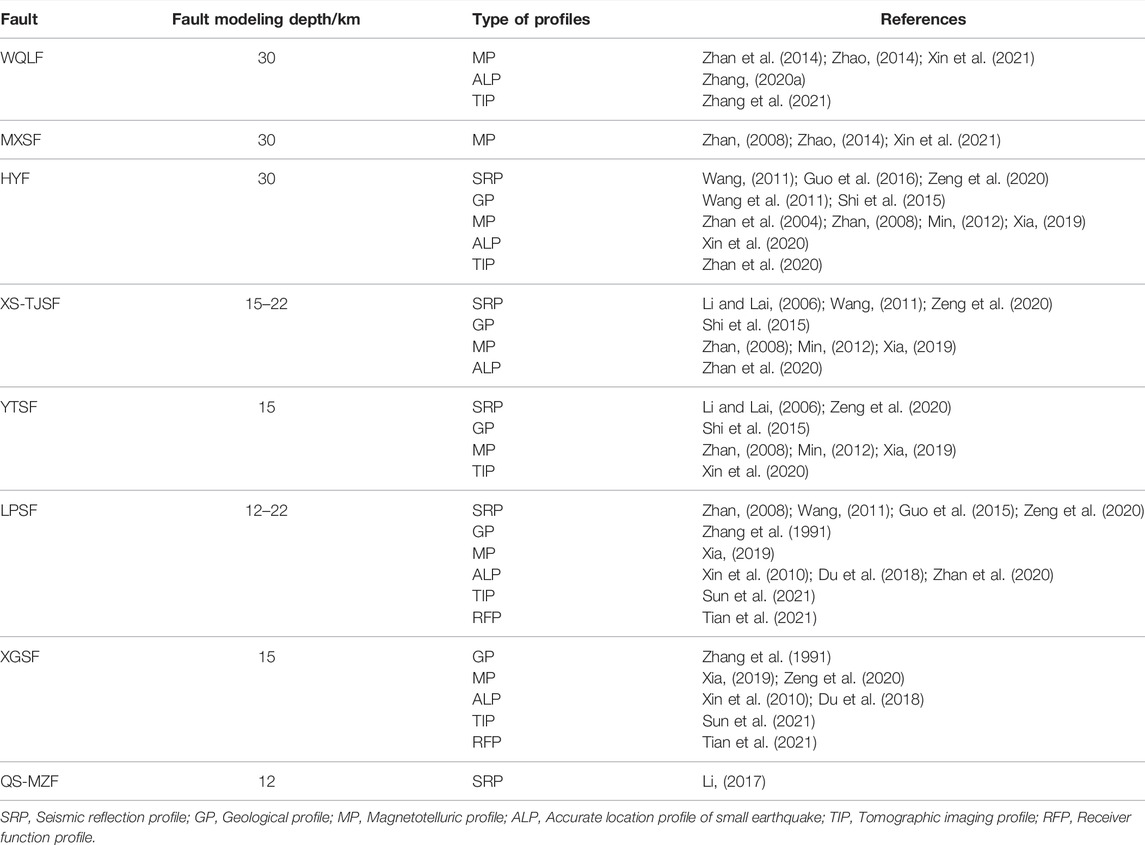
TABLE 1. Modeling profiles in the V3 model.
Through three versions of the models established successively, it is not difficult to see that our results have been gradually transformed from simple modeling to a 3D fine model under multiple constraints. First, from the view of the whole model, the major active faults in the arc-shaped tectonic belt in the northeastern margin of the Tibetan Plateau have been all involved in the modeling process from the V1 model to the V3 model, whether it is a large-scale active block boundary fault across the study area or a small-scale fault that is only under the control of local neotectonic movement. Secondly, starting from the V2 model, referring to the accurate geological mapping of active faults, the surface traces of main active faults in the model are constrained by more 3D control points along the fault strike. Meanwhile, the accurate locations of small earthquakes are considered, and the relative positions are visualized in the model. Finally, the most important deep geometric structure, their constraints are gradually strengthened. The V1 model only depends on the geological profiles, the dip angles of left-slip faults are set to 90° uniformly, and thrust faults refer to the surface dip angles to infer the deep extension of faults. The V2 model mainly refers to a series of magnetotelluric profiles and auxiliary profiles to reveal the deep geometry of active faults. The deep structure of each fault in the V3 model is constrained by multi-source 2D profiles. In general, our current V3 model has meticulously depicted the distribution along the strike and extension along the longitudinal direction of the main active faults in the arc-shaped tectonic belt in the northeastern margin of the Tibetan Plateau from surface to subsurface.
During our model optimization process, the interpolated formed fault planes have also changed dramatically with more detailed changes as the constraint data increased. Given the fact that in the V1 model only the dip angles from the geological field survey can hardly outline the deep geometric structures of each fault, the following fault plane comparisons only involve the V2 model and the V3 model.
The WQLF with left-slip nature is a deep boundary fault that divides the Tibetan Plateau block from the West Qinling block in the southern part of the study area. The fault cuts through the Moho and extends much deeper than our modeling scale. The top of the WQLF plane constructed by fault surface traces, geological profiles, and DEM data shows the elevation variation of the fault surface trace along the strike. The WQLF planes of the V2 model and V3 model are established from different deep geometric information and the plane of the V3 model has more abundant changes in dip angles by contrast (Figures 9A,B). By analyzing and comparing the normal distribution of dip angles on the two fault planes, the dip angles are mainly distributed in the high-angle area (Figure 9C). For the dip angles of the WQLF plane in the V2 model, the average value is 88.8°, the standard deviation is 1.15°, and 99.7% of the dip angles are distributed in the range of 85.4°–90.0°. It shows that the distribution of dip angles is concentrated the nearly vertical. For the dip angles of the WQLF plane in the V3 model, the average value is 77.4°, the standard deviation is 6.99°, and 99.7% of the dip angles are distributed in the range of 60.0°–87.3°. Although the dip angles of the WQLF plane in the V2 model have a more concentrated distribution, the dip angles of the WQLF plane in the V3 model constrained by multi-source data are more in line with the geological surveys (Shao et al., 2011).
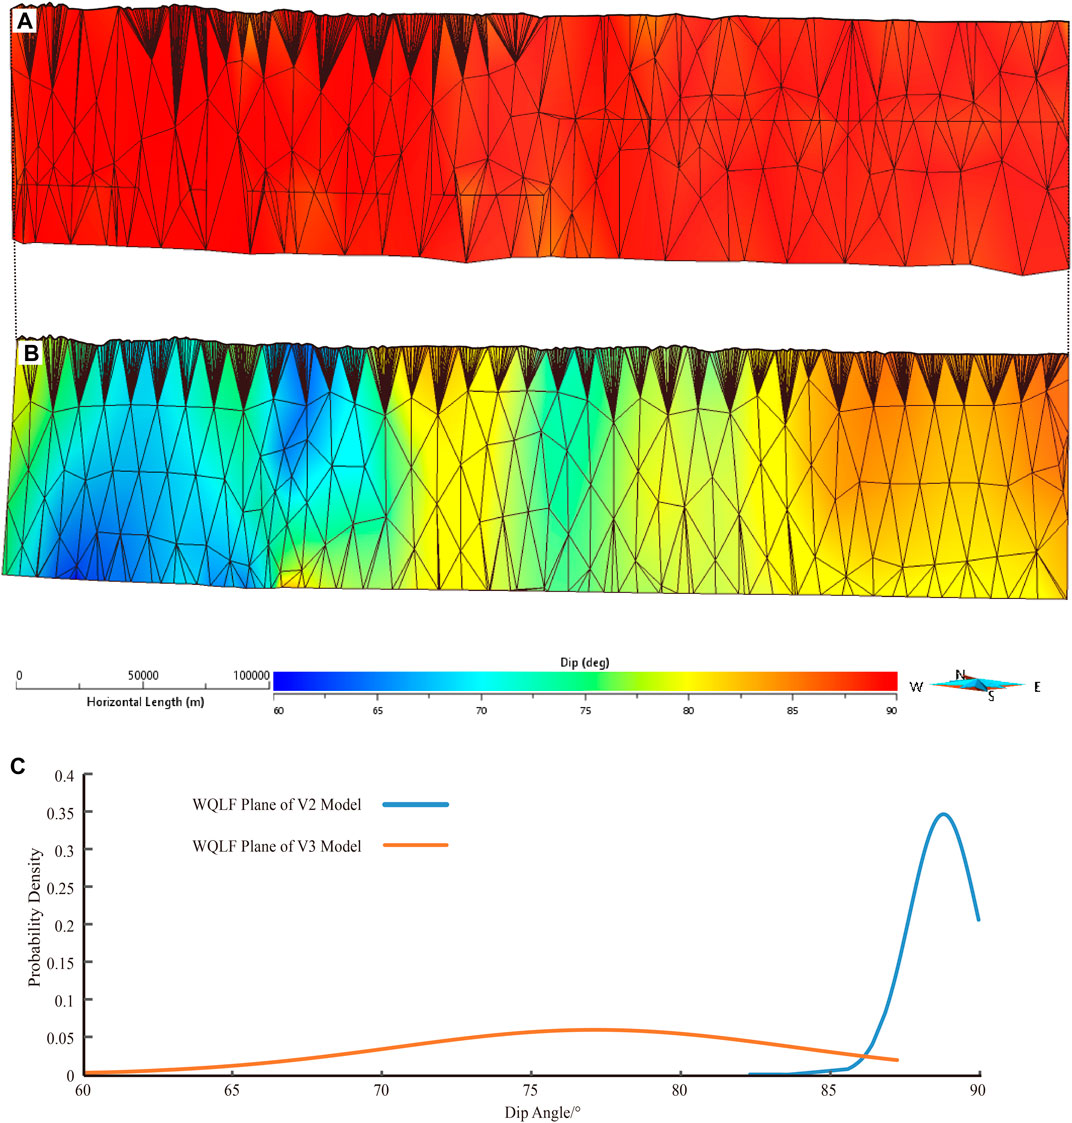
FIGURE 9. (A) Dip angles of the West Qinling fault planes in the V2 model; (B) Dip angles of the West Qinling fault planes in the V3 model; (C) Normal distribution statistics of dip angles of the West Qinling fault planes in the V2 model and V3 model. The top of the fault planes is outlined with black lines, the original triangular mesh is shown, and the colors of the fault planes represent the change of dip angles in (A,B).
The LPSF with a thrust nature is the boundary fault, which divides the Tibetan Plateau block from the Ordos stable block in the east of the study area. Similar to the analysis of the WQLF plane above, the LPSF surface traces of the V2 model and V3 model show consistent elevation relief, and the shape of fault planes is significantly different (Figures 10A,B). The normal distribution of dip angles shows that the distribution center of dip angles in the V3 model is about 16° higher than that of the V2 model, but the distribution widths of dip angles are extremely similar (Figure 10C). For the dip angles of the LPSF plane in the V2 model, the average value is 37.3°, the standard deviation is 12.17°, and 99.7% of the fault dip angles are distributed in the range of 27.9°–70.0°. For the dip angles of the LPSF plane in the V3 model, the average value is 53.6°, the standard deviation is 12.05°, and 99.7% of the fault dip angles are distributed in the range of 19.1°–72.3°.
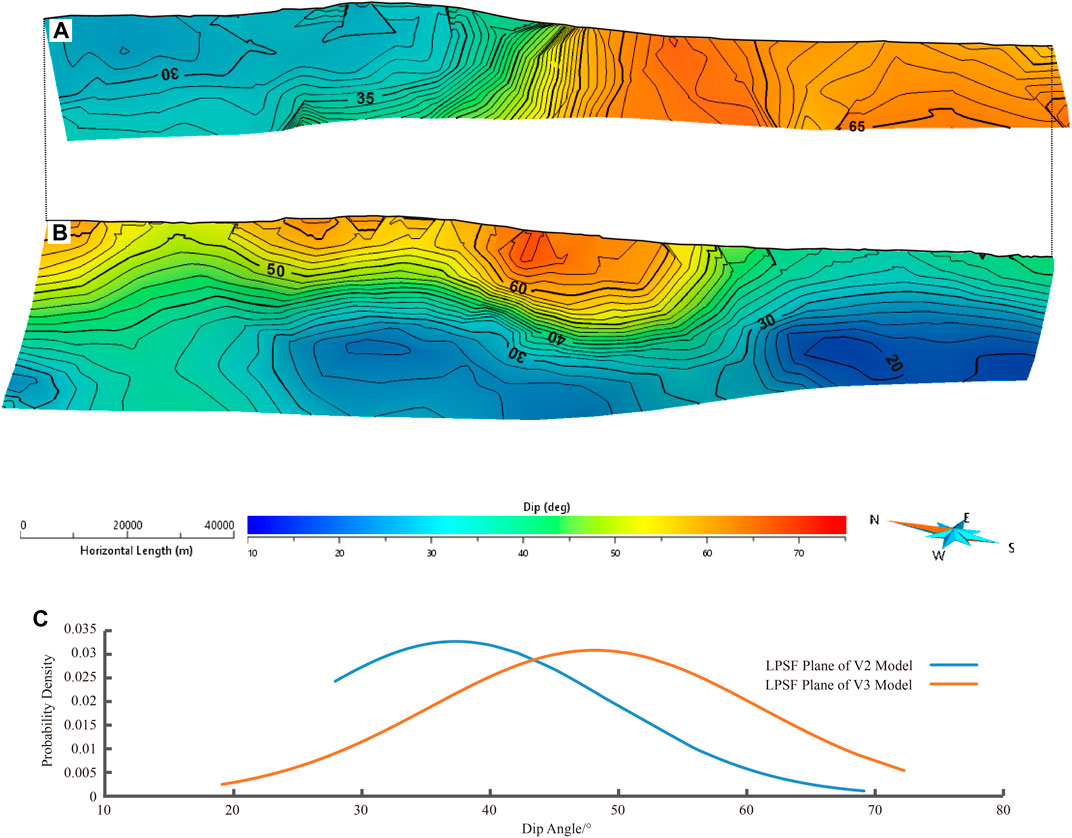
FIGURE 10. (A) Dip angles of the Liupanshan fault planes in the V2 model; (B) Dip angles of the Liupanshan fault planes in the V3 model; (C) Normal distribution statistics of dip angles of the Liupanshan fault planes in the V2 model and V3 model. The top of the fault planes is outlined with black lines, the colors of fault planes represent the change of dip angles, and there are dip angle contour lines on the fault planes in (A,B).
In the V2 model, the near-surface dip angles of northern LPSF are about 40°, and those of southern LPSF are about 60°. The dip angles of the LPSF gradually increase southward along the strike. Meanwhile, as the LPSF extends deeper, the dip angles decrease, and the LPSF plane gradually merges into the detachment layer with a depth of about 12 km (Figure 10A). However, there is a completely different situation in the V3 model. The dip angles of LPSF gradually decrease southward along the strike. The near-surface dip angles of northern LPSF are about 60° and the northern LPSF plane gradually merges into the detachment layer with a depth of about 22 km. The near-surface dip angles of southern LPSF are about 40°, and the southern LPSF plane gradually merges into the detachment layer at a depth of about 12 km. According to geological investigations (Shi, 2011b; Wang, 2018), the shallow dip angles in the V3 model are more in line with geological facts.
Through the establishment from the V1 model to the V3 model, we have the following insights into the main active faults in the arc-shaped tectonic belt in the northeastern margin of the Tibetan Plateau.
(1) The WQLF is a large left-slip fault cutting the Moho, which has a depth of about 50 km, a total length of about 443.94 km, an overall strike of 278°–287°, a tendency of SSW, and the overall dip angles of 60°–90°. Along the strike, the near-surface dip angles show the characteristics of low in the west and high in the east. Vertically, the dip angles do not change much and the fault plane extends deeper maintaining the original trend.
(2) The MXSF is at least a lower crustal-scale left-slip fault, extending to about 40 km deep near the Moho, which has a total length of about 91.26 km, a strike of 300°, and a tendency of SW. The dip angles are distributed between 73° and 87° with a decreasing trend towards deeper, and the overall shape of the fault plane is steep.
(3) The HYF is a crustal-scale left-slip fault, with a depth of about 30 km and a total length of about 248.36 km. The surface trace is slightly convex to NE as a whole and the strike gradually changes from 297° in the easternmost end to 280° in the westernmost end, dipping to SW. The dip angles of the HYF are generally distributed at 30°–83°. From west to east, the near-surface dip angles increase from 60° to about 80°, and the fault plane becomes steeper. The dip angles of the HYF gradually decrease towards the deeper part, from 60° to 30° in the western segment of the HYF, and from 80° to 50° in the middle-eastern segment. It is suggested that the HYF has been influenced by the thrust component, forming a gentle west-east steep, nearly shovel-shaped fault plane.
(4) The LPSF is a thrust fault with a total length of about 194.25 km, a tendency of SW, and an overall strike of 310°–328°. However, the fault strike changes near Guyuan, and the surface trace shows a slightly NE convex arc. About north of 35.5°N, the near-surface dip angles of LPSF range from 50° to 70°. With increasing depth, the LPSF finally merges into the deep detachment layer with a depth of about 22 km, and the dip angles gradually decrease to about 30°. About south of 35.5°N, the near-surface dip angles of LPSF are about 40°. With the extension deeper, the LPSF finally merges into the shallow detachment layer with a depth of about 12 km, and the dip angles gradually decrease to about 20°.
(5) The QS-MZF is an upper crustal-scale left-slip fault, approximately 145.88 km in length, with a strike of 300°, a tendency of SW, and overall dip angles of 60°–70°. The fault plane extends down to the shallow detachment layer with a depth of about 12 km.
(6) In this study, the XS-TJSF is divided into two segments, the northwestern and the southeastern segments. The northwestern segment is an upper crustal-scale left-slip fault, with a total length of about 170.30 km, a strike of E-W, a tendency of S, and dip angles of 70°–80°. The extended depth is mainly about 22 km, but it gradually decreases to about 18 km towards the easternmost end. The southeastern segment is an SW dipping thrust fault, with a total length of about 171.72 km. The surface trace is an arc of NE convexity, with the northernmost trending 298° and gradually deflecting clockwise to the southernmost trending near S-N. The dip angles of the near-surface fault are about 40° as a whole, but the southern tail of the southeastern segment has larger dip angles of about 60°. Extending to the deeper part, the dip angles eventually decrease to 20°–30° and the fault plane terminates at a depth of about 15 km.
(7) The YTSF is an SW dipping thrust fault, with a total length of about 101.57 km. The surface trace is an arc of NE convexity, with a strike of 305° at the northernmost end and gradually deflecting clockwise to the southernmost end near S-N. The northern segment of the YTSF has near-surface dip angles of 50°–60°, while the dip angles decrease southward and finally are up to 40°–50°. With increasing depth, the YTSF plane slows down, extending to about 15 km deep, and the dip angles decrease to about 30°.
(8) The XGSF is a W dipping thrust fault, with a total length of about 81.55 km and a strike of near S-N. The dip angles are about 60° near-surface, which gradually decrease to about 30° as the fault extends deeper, and the fault plane ultimately terminates at the depth of about 15 km.
We suggest that the major active faults in the arc-shaped tectonic belt in the northeastern margin of the Tibetan Plateau are largely controlled by two sets of detachment layers at depths of about 12 and 22 km. Except for the WQLF in the scale of super crust and the HYF and the MXSF in the scale of at least lower crust, thrust faults terminate between 12 and 22 km in depth, indicating that they are mainly controlled by the above two sets of detachment layers. And the QS-MZF and the northwestern segment of the XS-TJSF with left-slip nature extend to about 12 and 22 km, respectively. In this paper, our research is limited to the HYF (narrow sense), through which most of the 2D profiles show that it has not yet cut through the Moho. However, some researchers have suggested that the western segment of the HYF (broad sense) may be a deep fault cutting through the Moho (Shi et al., 2017; Zhan et al., 2008; Zhao et al., 2019, Zhao et al.,2020). The LPSF continues southeastward along the tail of the HYF, of which the northwestern segment has a similar extended depth to the tail of the HYF and surface dip angles of about 60°, while the southeastern segment has an extended depth of only about 12 km and gentler dip angles of about 40°. The change of the deep structure of the LPSF from northwest to southeast probably reflects the fact that the strike-slip component of the near E-W trending HYF is absorbed by the near NW-SE trending LPSF, and the nature changes from predominantly left-slip to predominantly thrust (Zhang et al., 1991; Zheng et al., 2013, Zheng et al., 2016).
To a certain extent, the V3 model has visualized the geometric structure of main active faults in the study area from the overall model. However, there are still a series of uncertainties in the V3 model, which affect the accuracy of the V3 model and determine whether it has practical application value. First of all, the multi-source 2D profiles, which are the basis for establishing the V3 model, have different geological interpretations for the same fault, and the resolution of profiles obtained by different methods is different. Through unified evaluation and screening of these data in the early stage, we can slightly reduce the impact of these uncertainties. Secondly, as the ordinate of some seismic profiles is the two-way travel time, we uniformly adopt the empirical seismic wave velocity of 5 km/s to make the time-depth conversion, instead of using the actual seismic wave velocity. This approach will inevitably distort the converted fault plane in the model and cannot make it closest to the real structure of the fault plane. Finally, during the modeling process, we found that the density of control profiles in different parts of the study area is different, such as 2D profiles through the convergence area of the LPSF, HYF, and southeastern segment of the XS-TJSF are extremely dense. In contrast, the control profiles through the northwestern segment of the XS-TJSF and the western HYF are relatively sparse. As a result, the control points in different areas of the V3 model are unevenly distributed, and different parts of the fault plane constructed by interpolation also have different accuracy.
Through the visual V3 model, we can easily obtain the cutting profiles of the arc-shaped tectonic belt in the northeastern margin of the Tibetan Plateau in any direction, which reflects the deep geometry of regional active faults (Figures 11, 12). Therefore, the V3 model can provide pre-study results for subsequent researchers who plan to carry out relevant geological research in this area, such as collecting long-distance 2D profiles in a certain direction, helping them to arrange and adjust subsequent fieldwork.
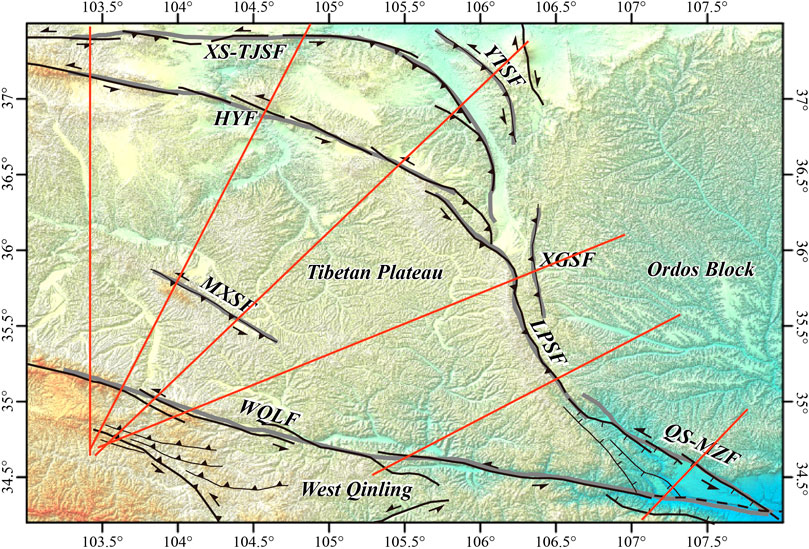
FIGURE 11. Figure cut profile distribution of the V3 model. Red solid lines represent the locations of profiles.
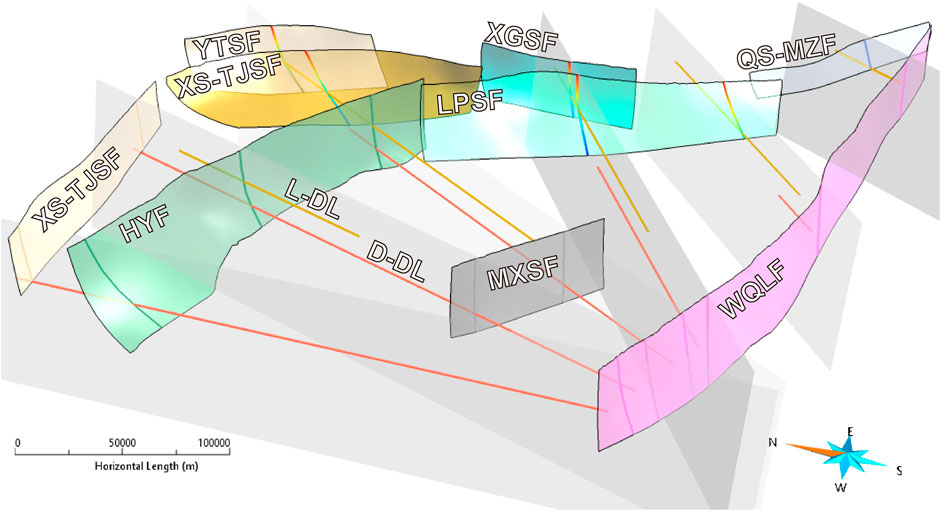
FIGURE 12. Cut into slices of the V3 model. The fault planes are transparent displays and their contours are outlined by black lines.
In addition, the arc-shaped tectonic belt in the northeastern margin of the Tibetan Plateau is the front of the northeastward expansion of the plateau with active tectonic movements, developing a series of active faults. The evolutionary history of this region since the late Cenozoic is of great significance for studying the expansion of the Tibetan Plateau. At present, the geological research of this area is only limited to the regional surface geological evolution and the deep structures of several active faults (Lei et al., 2016; Shi et al., 2013; Wang et al., 2013; Wang et al., 2014; Zheng et al., 2013), and have not combined the deep structures of the overall active fault and surface geology to jointly explain the regional geological evolution history. The 3D fault model may serve as a bridge to combine the two, effectively linking regional surface geology, deep structures, most of the active faults, and so on. However, if we want to study the small-scale geological structures and the finer structure of a single fault in this area, our model is far from reaching the corresponding resolution and accuracy. The actual distribution of active faults in this region is far more complex than the V3 model. To reveal the deep segmental and geometric features of active faults more precisely in the 3D fault model depends on the improvement of the regional 2D profiles coverage density.
In the modeling process of this study, considering that the resolution and density of the modeling data cannot identify the segmental properties of active faults, the discontinuous surface traces of the faults are fitted into continuous traces. However, in the earthquake occurrence, not the entire fault is active at the same time, but only the energy release of the partial fault. Given this, it is necessary to clarify the segmentation of faults before quantifying the potential seismic hazard (Ding, 1993; Ding, 1995). For strike-slip faults, this study segments the fault planes according to the segmentation of fault surface traces (Howarth et al., 2021; Wesnouky, 1988; Wesnouky, 2006). For thrust faults, the dip angle contour of the fault planes was generated based on SKUA-GOCAD software, and the changing interfaces of dip angles are used to segment the fault planes (Qiu et al., 2016) (Figure 13). The accurate locations of small earthquakes indicate that there are still a considerable number of small-earthquake distributions within the region at least 30 km deep (Du et al., 2018; Sheng, 2015; Xin et al., 2010; Zhan et al., 2020; Zhang B., 2020), whereas our model sets a uniform cut-off of the fault plane extension depth to 30 km, for which the statistical fault plane area can be used to quantify the potential seismic moment magnitude.
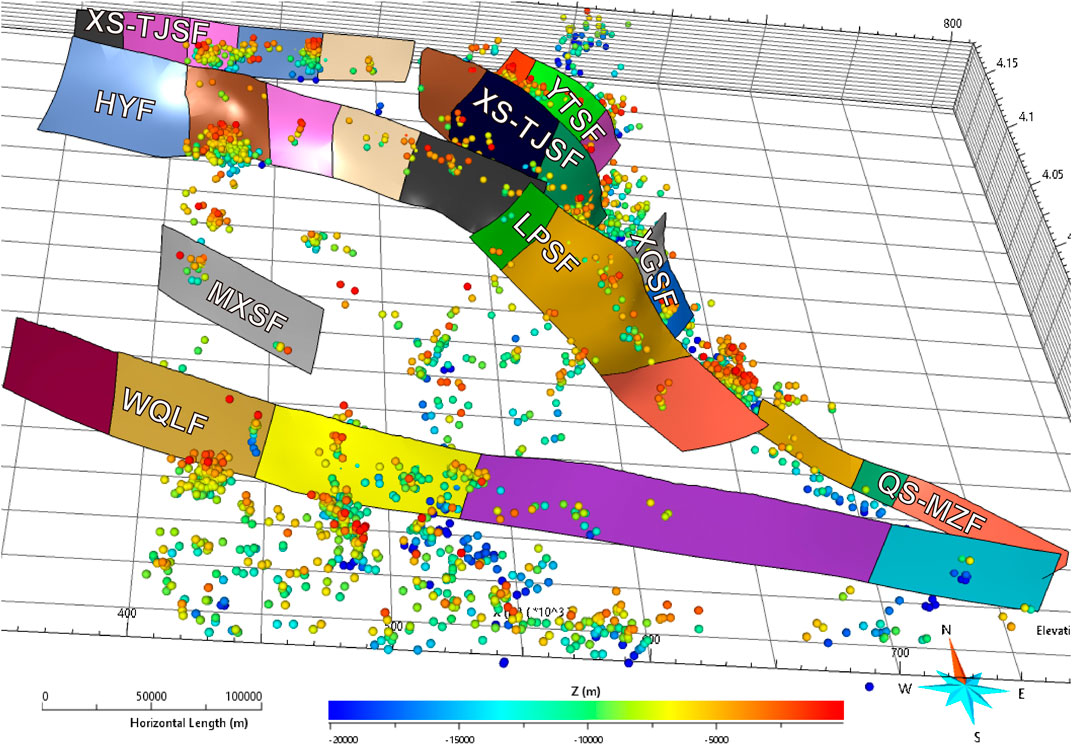
FIGURE 13. V3 model fault segmentation. The different colored parts of each fault represent the segmentation of this fault in the V3 model.
Assuming that the planes and surface traces of the seismogenic faults all rupture during an earthquake, we can calculate the potential seismic moment magnitude of each fault segment according to the empirical formulas proposed by Cheng et al. (2020) (Figure 14). If the major active faults in the arc-shaped tectonic belt in the northeastern margin of the Tibetan Plateau produce earthquakes, the estimated moment magnitudes are generally higher than magnitude 6.0.
(1) The WQLF can be divided into five segments. From W to E, the moment magnitudes of each segment are 6.4, 6.6, 6.6, 6.8, and 6.0 deduced from the RAF (RAF = rupture area-moment magnitude empirical formula), and 6.7, 7.1, 7.0, 7.6, and 7.0 according to the RLF (RLF = rupture length-moment magnitude empirical formula).
(2) The MXSF is unsegmented as a whole. The moment magnitude is inferred to be 6.4 by the RAF, and 7.2 inferred by the RLF.
(3) The HYF can be divided into five segments. From SWW to SE, the moment magnitudes of each segment are 7.3, 6.7, 6.4, 6.4, and 6.6 deduced from the RAF, and 7.0, 6.4, 6.5, 6.8, and 6.9 according to the RLF.
(4) The LPSF can be divided into three segments. From NNW to SSE, the moment magnitudes of each segment are 6.7, 7.3, and 7.1 deduced from the RAF, and 6.5, 7.3, and 6.9 according to the RLF.
(5) The QS-MZF can be divided into three segments. From NW to SE, the moment magnitudes of each segment are 6.1, 5.8, and 6.4 deduced from the RAF, and 6.8, 6.3, and 7.0 according to the RLF.
(6) The northwestern segment of the XS-TJSF can be divided into five segments. From W to E, the moment magnitudes of each segment are 5.9, 6.1, 5.9, 6.1, and 6.1 deduced from the RAF, and 6.4, 6.4, 6.2, 6.6, and 6.7 according to the RLF.
(7) The southeastern segment of the XS-TJSF can be divided into three segments. From NW to SSE, the moment magnitudes of each segment are 6.8, 7.2, and 7.0 deduced from the RAF, and 6.7, 7.0, and 7.1 according to the RLF.
(8) The YTSF can be divided into three segments. From NW to SSE, the moment magnitudes of each segment are 6.5, 7.0, and 6.7 deduced from the RAF, and 6.3, 6.9, and 6.6 according to the RLF.
(9) The XGSF can be divided into two segments. From NW to SSE, the moment magnitudes of each segment are 6.8 and 6.8 deduced from the RAF, and 6.8 and 6.7 according to the RLF.
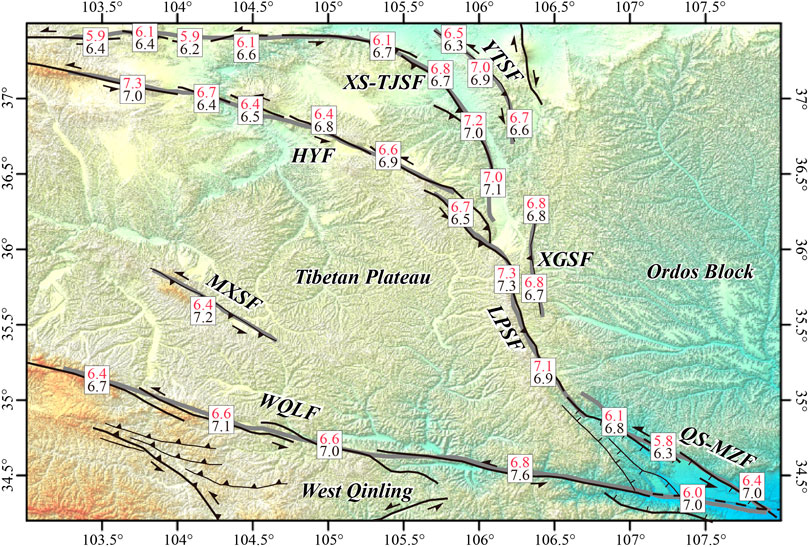
FIGURE 14. Estimated moment magnitude of major active faults in the northeastern margin of the Tibetan Plateau. Red numbers represent results from the rupture area-moment magnitude empirical formula, and black numbers represent results from the rupture length-moment magnitude empirical formula.
The moment magnitudes respectively estimated from the rupture area and rupture length of thrust faults are in good agreement, with the difference basically within ±0.3, while for left-slip faults the moment magnitudes calculated from the rupture length are mostly larger than those calculated from the rupture area, with significant deviation. In combination with the deep structures of the main active faults shown in the V3 model, the thrust faults are relatively shallow in extended depth. The potential seismic hazards of thrust faults in this region are greater than those of left-slip faults with high dip angles. Therefore, we pay more attention to the possible seismic hazards caused by thrust faults in this region.
For thrust faults, the estimated moment magnitudes are all less than or equal to 7.3. Except for the southernmost part of the southeastern segment of the XS-TJSF, all moment magnitudes estimated from the RAF are greater than or equal to those estimated from the RLF. These thrust faults, which have experienced many historical strong earthquakes (Figure 1), have the potential for large earthquakes of magnitude 7 or greater. Therefore, the estimations based on the RAF are closer to reality and more reliable. Among thrust faults, the LPSF and the southeastern segment of the XS-TJSF, where the maximum seismic moment magnitude can be respectively up to 7.3 and 7.2. Moreover, the historical records of strong earthquakes in the middle and south segments of the LPSF are few and the passing time is long, so there is a risk of strong earthquakes (Du et al., 2018; Lei et al., 2007; Mei et al., 2012; Wang et al., 2018).
At the same time, the seismic hazards caused by left-slip faults, which also have the potential for a strong earthquake of magnitude 7 or more, should not be ignored. For the WQLF, the QS-MZF, the MXSF, and the northwestern segment of the XS-TJSF, all moment magnitudes estimated from the RLF are greater than those estimated from the RAF. The eastern segment of the HYF is consistent with this phenomenon, but the western segment is opposite. We suggest that this may be because the western segment of the HYF, which is constrained by seismic reflection profile, has smaller dip angles of about 60° compared to other left-slip faults (Guo et al., 2016). Therefore, the estimations based on the RLF are more reliable for the left-slip faults with steep planes, and conversely, the estimations based on the RAF are more reliable. Among the left-slip faults, the westernmost segment of the HYF and the WQLF are at relatively higher seismic risks. The potential moment magnitudes of the westernmost segment of the HYF can reach up to 7.3. Considering that the WQLF is beyond the modeling range, it extends continuously to the west of the model, and the surface trace is fitted into a continuous trace. Therefore, the V3 model underestimates the length of the westernmost segment of the WQLF, and the moment magnitude calculated by the RLF is small, which is most likely larger than 7.0. All segments of the WQLF have potential seismic risks of moment magnitude 7.0 or greater, and one segment can reach a maximum of magnitude 7.6.
Compared with the historical earthquake records, we find that the moment magnitudes estimated by the V3 model are small. We believe that this error mainly comes from the following two reasons. Firstly, the fault traces are simplified in the model, and the rupture length and rupture area of the seismogenic fault are underestimated. Secondly, we calculate the moment magnitudes under the assumption that only a single fault segment ruptures, without considering the cascade rupture of active faults, and the seismogenic structure generally involves more than a single fault segment. At present, the accuracy of the V3 model is not yet sufficient to solve the problem. However, our result reveals the relative seismic hazard and the minimum seismogenic potential of each rupture in the region, which is of the reference value.
In this paper, three versions of 3D fault models of the arc-shaped tectonic belt in the northeastern margin of the Tibetan Plateau have been successfully established separately using geological data, magnetotelluric profiles, and multi-source data. Comparing these three models, it is suggested that the multi-source data 3D geological modeling technology is more advantageous in establishing 3D models close to the real regional structure than the single-source data 3D geological modeling technology. Meanwhile, the structures of the main active faults in the study area are reconnoitered from the model perspective. In particular, the V3 model shows that the Haiyuan fault does not cut through the Moho and is a crustal-scale left-slip fault. The shape of the Liupanshan fault plane, which is steep and deep in the north and opposite in the south, may reflect that the left-slip component of the Haiyuan fault with nearly E-W strike is absorbed by the near NW-SE trending Liupanshan thrust fault. Based on the V3 model, the fault segmentation, and the empirical formulas of moment magnitude-rupture parameters, the modeling faults are segmented and the potential moment magnitudes of each segment are calculated. The thrust faults with relatively higher seismic hazards are the Liupanshan fault and the southeastern segment of the Xiangshan-Tianjingshan fault, of which the maximum moment magnitudes are respectively estimated to be 7.3 and 7.2. Among the left-slip faults in the study region, the most westernmost segment of the Haiyuan fault has a potential moment magnitude of 7.3, and potential moment magnitudes of each segment of the West Qinling fault are at least 7.0, of which one segment can be up to 7.6.
The original contributions presented in the study are included in the article/Supplementary Material, further inquiries can be directed to the corresponding author.
LGL: modeling, drawing the figures, and writing. ZL: modeling, writing, and verification. WW, CS, YZ, and HL: guidance and suggestion. BX, XW, XD, and LWL: suggestion and communication.
This study was jointly funded by the National Key Research and Development Program of China (2017YFC1500100), the National Natural Science Foundation of China (42172233, 41772209, and 41902201), and Guangdong Province Introduced Innovative R&D Team of Geological Processes and Natural Disasters around the South China Sea (2016ZT06N331).
The authors declare that the research was conducted in the absence of any commercial or financial relationships that could be construed as a potential conflict of interest.
The handling editor ZZ declared a shared research program with the author ZL at the time of review.
All claims expressed in this article are solely those of the authors and do not necessarily represent those of their affiliated organizations, or those of the publisher, the editors and the reviewers. Any product that may be evaluated in this article, or claim that may be made by its manufacturer, is not guaranteed or endorsed by the publisher.
We especially thank the two reviewers Renqi Lu and Zhongtai He, Profs. Wenjun Zheng and Zhuqi Zhang gave us vitally important suggestions to improve the manuscript. We thank GEBCO Compilation Group (2021) GEBCO 2021 Grid (doi:10.5285/c6612cbe-50b3-0cff-e053-6c86abc09f8f) and Geospatial Data Cloud site, Computer Network Information Center, Chinese Academy of Sciences (http://www.gscloud.cn) for providing the high-resolution DEM data and satellite images for this study.
Blaser, L., Kruger, F., Ohrnberger, M., and Scherbaum, F. (2010). Scaling Relations of Earthquake Source Parameter Estimates with Special Focus on Subduction Environment. Bull. Seismol. Soc. Am. 100 (6), 2914–2926. doi:10.1785/0120100111
Burchfiel, B. C., Zhang, P., Wang, Y., Zhang, W., Song, F., Deng, Q., et al. (1991). Geology of the Haiyuan Fault Zone, Ningxia-Hui Autonomous Region, China, and its Relation to the Evolution of the Northeastern Margin of the Tibetan Plateau. Tectonics 10 (6), 1091–1110. doi:10.1029/90tc02685
Carena, S., and Suppe, J. (2002). Three-dimensional Imaging of Active Structures Using Earthquake Aftershocks: the Northridge Thrust, California. J. Struct. Geol. 24 (4), 887–904. doi:10.1016/s0191-8141(01)00110-9
Cheng, J., Rong, Y., Magistrale, H., Chen, G., and Xu, X. (2020). Earthquake Rupture Scaling Relations for Mainland China. Seismol. Res. Lett. 91 (1), 248–261. doi:10.1785/0220190129
Deng, Q. D. (2007). Map of Active Tectonics in China. Beijing: Seismological Press, 4000000. in Chinese.
Deng, Q. D., Zhang, P. Z., Ran, K. Y., Yang, X. P., Min, W., and Chu, Q. Z. (2002). Basic Characteristic of Active Tectonics of China (In Chinese). Sci. China(Series D Earth Sci. 32 (12), 1020–1030+1057. doi:10.3969/j.issn.1674-7240.2002.12.007
Ding, G. Y. (1993). Earthquake Prediction and Active Fault Segmentation (In Chinese). J. Seismol. 1, 8–10+85.
Ding, G. Y. (1995). The Segmentation Model of Active Fault (In Chinese). Earth Sci. Front. 2 (1-2), 195–202. doi:10.3321/j.issn:1005-2321.1995.01.024
Du, F., Wen, X. Z., Feng, J. G., Liang, M. J., Long, F., and Wu, J. (2018). Seismo-tectonics and Seismic Potential of the Liupanshan Fault Zone(LPSFZ), China (In Chinese). Chin. J. Geophys. 61 (2), 545–559. doi:10.4401/ag-7636
Evans, W. S., Plesch, A., Shaw, J. H., Pillai, N. L., Yu, E., Meier, M.-A., et al. (2020). A Statistical Method for Associating Earthquakes with Their Source Faults in Southern California. Bull. Seismol. Soc. Am. 110 (1), 213–225. doi:10.1785/0120190115
Fischer, M. P., and Wilkerson, M. S. (2000). Predicting the Orientation of Joints from Fold Shape: Results of Pseudo-three-dimensional Modeling and Curvature Analysis. Geology 28 (1), 15–18. doi:10.1130/0091-7613(2000)028<0015:ptoojf>2.3.co;2
Franke, R. (1982). Scattered Data Interpolation: Tests of Some Method. Math. Comput. 38 (157), 181–200. doi:10.2307/2007474
Gao, R., Wang, H., Yin, A., Dong, S., Kuang, Z., Zuza, A. V., et al. (2013). Tectonic Development of the Northeastern Tibetan Plateau as Constrained by High-Resolution Deep Seismic-Reflection Data. Lithosphere 5 (6), 555–574. doi:10.1130/l293.1
Guan, S. W., Plesch, A., Li, B. L., Cheng, Z. X., and He, D. F. (2010). Volumetric Structural Restorations Based on Mechanical Constraints and its Geological Significance (In Chinese). Earth Sci. Front. 17 (4), 140–150.
Guo, X., Gao, R., Li, S., Xu, X., Huang, X., Wang, H., et al. (2016). Lithospheric Architecture and Deformation of NE Tibet: New Insights on the Interplay of Regional Tectonic Processes. Earth Planet. Sci. Lett. 449, 89–95. doi:10.1016/j.epsl.2016.05.045
Guo, X. Y., Gao, R., Wang, H. Y., Li, W. H., Keller, G. R., Xu, X., et al. (2015). Crustal Architecture beneath the Tibet-Ordos Transition Zone, NE Tibet, and the Implications for Plateau Expansion. Geophys. Res. Lett. 42 (24), 10631–10639. doi:10.1002/2015gl066668
Hanks, T. C., and Bakun, W. H. (2002). A Bilinear Source-Scaling Model for M-Log A Observations of Continental Earthquakes. Bull. Seismol. Soc. Am. 92 (5), 1841–1846. doi:10.1785/0120010148
Houlding, S. W. (1994). 3D Geoscience Modeling: Computer Techniques for Geological Characterization. Berlin: Springer-Verlag.
Howarth, J. D., Barth, N. C., Fitzsimons, S. J., Richards-Dinger, K., Clark, K. J., Biasi, G. P., et al. (2021). Spatiotemporal Clustering of Great Earthquakes on a Transform Fault Controlled by Geometry. Nat. Geosci. 14 (5), 314–320. doi:10.1038/s41561-021-00721-4
Huang, X. F. (2017). Study on Crust-Scale Deformation in Tectonic Transition Zone, in Qilian Shan, the Northern Margin of the Qinghai-Tibet Plateau (In Chinese). Doctor Dissertation thesis (Beijing: Chinese Academy of Geological Sciences).
Huang, Z., Tilmann, F., Xu, M., Wang, L., Ding, Z., Mi, N., et al. (2017). Insight into NE Tibetan Plateau Expansion from Crustal and Upper Mantle Anisotropy Revealed by Shear-Wave Splitting. Earth Planet. Sci. Lett. 478, 66–75. doi:10.1016/j.epsl.2017.08.030
Hubbard, J., Almeida, R., Foster, A., Sapkota, S. N., Bürgi, P., and Tapponnier, P. (2016). Structural Segmentation Controlled the 2015 Mw7.8 Gorkha Earthquake Rupture in Nepal. Geology 44 (8), 639–642. doi:10.1130/g38077.1
Jia, D., Li, Y. Q., Lin, A. M., Wang, M. M., Chen, W., Wu, X. J., et al. (2010). Structural Model of 2008 Mw 7.9 Wenchuan Earthquakes in the Rejuvenated Longmen Shan Thrust Belt, China. Tectonophysics 491 (1-4), 174–184. doi:10.1016/j.tecto.2009.08.040
Jin, S., Zhang, L. T., Jin, Y. J., Wei, W. B., and Ye, G. F. (2012). Crustal Electrical Structure along the Hezuo-Dajing Profile across Northeastern Margin of the Tibet Plateau (In Chinese). Chin. J. Geophys. 55 (12), 3979–1990. doi:10.1002/cjg2.1710
Lei, Q. Y., Zhang, P. Z., Zheng, W. J., Chai, C. Z., Wang, W. T., Du, P., et al. (2016). Dextral Strike-Slip of Sanguankou-Niushoushan Fault Zone and Extension of Arc Tectonic Belt in the Northeastern Margin of the Tibet Plateau (In Chinese). Sci. China Earth Sci. 46 (5), 691–705. doi:10.1360/N072015-00254
Lei, Z. S., Yuan, D. Y., Ge, W. P., He, W. G., and Liu, X. W. (2007). Textual Research on the Tianshui M7 Earthquake in 734 AD and Analysis of its Causative Structure (In Chinese). Seismol. Geol. 29 (1), 51–62. doi:10.3969/j.issn.0253-4967.2007.01.004
Li, J. H., and Shen, X. H. (2001). Syntaxis Faults at the Northeastern Corner of the Tibetan Plateau and the Annular Tectonics in Southern Ordos (In Chinese). Seismol. Geol. 23 (1), 116–121. doi:10.3969/j.issn.0253-4967.2001.01.015
Li, S. L., and Lai, X. L. (2006). Preliminary Study on Quasi Tri-junction in Northeastern Margin of Qinghai-Tibet Plateau (In Chinese). J. Geodesy Geodyn. 26 (2), 10–14. doi:10.3969/j.issn.1671-5942.2006.02.003
Li, S. L., Zhang, X. K., Zhang, C. K., Zhao, J. R., and Cheng, S. X. (2002). A Preliminary Study on the Crustal Velocity Structure of Maqin-Lanzhou-Jingbian by Means of Deep Seismic Sounding Profile (In Chinese). Chin. J. Geophys. 45 (2), 210–217. doi:10.1002/cjg2.233
Li, T., Zhang, Y., Lu, R., Gao, J., Sun, J., Zhao, X., et al. (2021). 3D Geometry of the Lanliao Fault Revealed by Seismic Reflection Profiles: Implications for Earthquake Clustering in the Dongpu Sag, North China. Tectonophysics 806, 228798. doi:10.1016/j.tecto.2021.228798
Li, X. N. (2017). Deformation Pattern Based on Geometry and Kinematics of Active Tectonics in the Southwestern Ordos Block (In Chinese). Doctor Dissertation thesis (BeijingChina Earthquake Administration: Institute of Geology).
Li, X. N. (2014). Late Quaternary Kinematic Characteristics and Paleoearthquakes along the Western Segment of the Xiangshan-Tianjingshan Fault (In Chinese). Master Dissertation thesis (BeijingChina Earthquake Administration: Institute of Geology).
Li, X. N., Li, C. Y., Zhang, P. Z., Wang, X. G., and Zhang, L. S. (2016a). Changes in Fault Movement Property and Genetic Mechanism on the Western Segment of the Xiangshan-Tianjingshan Fault Zone (In Chinese). Seismol. Geol. 38 (3), 732–746. doi:10.3969/j.issn.0253-4967.2016.03.018
Li, Y., Jia, D., Luo, L., Jia, Q., Chen, Z., Deng, F., et al. (2007). Three Dimension Construction and Magnetic Fabric Analysis of the Yanjinggou Fault-Propagation Fold in Western Sichuan, China. Earth Sci. Front. 14 (4), 74–84. doi:10.1016/s1872-5791(07)60029-3
Li, Y., Jia, D., Plesch, A., Hubbard, J., Shaw, J. H., and Wang, M. (2013). 3-D Geomechanical Restoration and Paleomagnetic Analysis of Fault-Related Folds: An Example from the Yanjinggou Anticline, Southern Sichuan Basin. J. Struct. Geol. 54, 199–214. doi:10.1016/j.jsg.2013.06.009
Li, Y., Jia, D., Shaw, J. H., Hubbard, J., Lin, A., Wang, M., et al. (2010). Structural Interpretation of the Coseismic Faults of the Wenchuan Earthquake: Three-Dimensional Modeling of the Longmen Shan Fold-And-Thrust Belt. J. Geophys. Res. 115 (B4), B04317. doi:10.1029/2009jb006824
Li, Y., Jia, D., Wang, M., Shaw, J. H., He, J., Lin, A., et al. (2014). Structural Geometry of the Source Region for the 2013 Mw 6.6 Lushan Earthquake: Implication for Earthquake Hazard Assessment along the Longmen Shan. Earth Planet. Sci. Lett. 390, 275–286. doi:10.1016/j.epsl.2014.01.018
Li, Z., Li, T., Almeida, R., Zhang, P., Zheng, W., Sun, C., et al. (2019a). Lateral Fault Growth in the Kashi Anticline (Chinese Tian Shan): Insights from Seismic Interpretation, Shortening Distribution, and Trishear Methods. J. Geophys. Res. Solid Earth 124 (7), 7303–7319. doi:10.1029/2018jb017186
Li, Z. L., Pan, M., Han, D. K., Liu, W. L., Hu, S. Q., Liu, P. G., et al. (2016b). Three-dimensional Structural Modeling Technique (In Chinese). Earth Sci. 41 (12), 2136–2146. doi:10.3799/dqkx.2016.149
Li, Z., Zhang, P., Jia, D., Zheng, W., Sun, C., Li, Y., et al. (2019b). 3D Geometric Modeling for the Yanjinggou Anticline in the Longmen Shan Fold-And-Thrust Belt, China: Oblique Thrusting Kinematic Implications. J. Asian Earth Sci. 179, 99–111. doi:10.1016/j.jseaes.2019.04.005
Mallet, J. L. (1992). Discrete Smooth Interpolation in Geometric Modelling. Computer-Aided Des. 24 (4), 178–191. doi:10.1016/0010-4485(92)90054-e
Mei, X. P., Shao, Z. G., Zhang, L. P., Feng, J. G., and Dai, W. (2012). Study on Potential Earthquake Risk of Unbroken Active Faults in the Northern Segment of the North-South Seismic Zone (In Chinese). Acta Seismol. Sin. 34 (4), 509–525. doi:10.3969/j.issn.0253-3782.2012.04.008
Min, G. (2012). The Electrical Structure of Middle&upper Crust of Ningxia Arc-Shaped Structural Belt and its Tectonic Implications (In Chinese). Doctor Dissertation thesis (Chengdu, Sichuan: Chengdu University of Technology).
Min, W. (1998). Region Paleoearthquake Research - an Example in the Northeastern Margin of Tibet and Western Margin of Huabei (In Chinese). Doctor Dissertation thesis (BeijingChina Earthquake Administration: Institute of Geology).
Min, W., Zhang, P. Z., and Deng, Q. D. (2001). The Study of Holocene Paleoearthquakes on Zhongwei-Tongxin Fault Zone (In Chinese). Seismol. Geol. 23 (3), 357–366. doi:10.3969/j.issn.0253-4967.2001.03.003
Plesch, A., Shaw, J. H., Benson, C., Bryant, W. A., Carena, S., Cooke, M., et al. (2007). Community Fault Model (CFM) for Southern California. Bull. Seismol. Soc. Am. 97 (6), 1793–1802. doi:10.1785/0120050211
Qin, X., Shi, W., Li, H. Q., and Zhang, Y. (2017). Tectonic Differences of the Southern Ningxia Arc-Shape Faults in the Northeast Tibetan Plateau Based on Digital Elevation Model (In Chinese). Quat. Sci. 37 (2), 213–223. doi:10.11928/j.issn.1001-7410.2017.02.01
Qiu, Q., Hill, E. M., Barbot, S., Hubbard, J., Feng, W., Lindsey, E. O., et al. (2016). The Mechanism of Partial Rupture of a Locked Megathrust: The Role of Fault Morphology. Geology 44 (10), 875–878. doi:10.1130/g38178.1
Ramsay, J. G., and Huber, M. I. (1987). The Techniques of Modern Structural Geology, Vol. 2. London: Academic Press. Folds and Fractures.
Riesner, M., Durand‐Riard, P., Hubbard, J., Plesch, A., and Shaw, J. H. (2017). Building Objective 3D Fault Representations in Active Tectonic Settings. Seismol. Res. Lett. 88 (3), 831–839. doi:10.1785/0220160192
Ross, Z. E., Cochran, E. S., Trugman, D. T., and Smith, J. D. (2020). 3D Fault Architecture Controls the Dynamism of Earthquake Swarms. Science 368, 1357–1361. doi:10.1126/science.abb0779
Shao, Y. X., Yuan, D. Y., Wang, A. G., Liang, M. J., Liu, K., and Feng, J. G. (2011). The Segmentation of Rupture and Estimate of Earthquake Risk along the North Margin of Western Qinling Fault Zone (In Chinese). Seismol. Geol. 33 (1), 79–90.
Shaw, J. H., and Plesch, A. (2012). 3D Structural Velocity Model of the Santa Maria Basin, CA, for Improved Strong Ground Motion Prediction National Earthquake, Hazards Reduction Program (NEHRP). Final Technical Report, Grant G12AP20020.
Shaw, J. H., Plesch, A., Tape, C., Suess, M. P., Jordan, T. H., Ely, G., et al. (2015). Unified Structural Representation of the Southern California Crust and Upper Mantle. Earth Planet. Sci. Lett. 415, 1–15. doi:10.1016/j.epsl.2015.01.016
Sheng, S. Z. (2015). Study on the Crustal Stress Field and the Fault Plane Parameter of Circum-Ordos Block Region (In Chinese). Doctor Dissertation thesis (Beijing: Institute of Geophysics, China Earthquake Administration).
Shi, J., Shi, D., Shen, Y., Zhao, W., Xue, G., Su, H., et al. (2017). Growth of the Northeastern Margin of the Tibetan Plateau by Squeezing up of the Crust at the Boundaries. Sci. Rep. 7, 10591. doi:10.1038/s41598-017-09640-0
Shi, W., Dong, S., Liu, Y., Hu, J., Chen, X., and Chen, P. (2015). Cenozoic Tectonic Evolution of the South Ningxia Region, Northeastern Tibetan Plateau Inferred from New Structural Investigations and Fault Kinematic Analyses. Tectonophysics 649, 139–164. doi:10.1016/j.tecto.2015.02.024
Shi, W., Liu, Y., Liu, Y., Chen, P., Chen, L., Cen, M., et al. (2013). Cenozoic Evolution of the Haiyuan Fault Zone in the Northeast Margin of the Tibetan Plateau (In Chinese). Earth Sci. Front. 20 (4), 1–17.
Shi, W. (2011a). The Analysis of the Developmental Characteristics and Activity about Fault Zone of Longxian-Baoji (In Chinese). Master Dissertation thesis (Xi’an, Shaanxi: Chang`an University).
Shi, Z. G. (2011b). The Recent Activity Features of Faults and Risk Trend of Strong Earthquake in Liupanshan Region (In Chinese). Master Dissertation thesis (Lanzhou, GansuChina Earthquake Administration: Lanzhou Institute of Seismology).
Sun, Q., Pei, S., Cui, Z., Chen, Y. J., Liu, Y., Xue, X., et al. (2021). A New Growth Model of the Northeastern Tibetan Plateau from High-Resolution Seismic Imaging by Improved Double-Difference Tomography. Tectonophysics 798, 228699. doi:10.1016/j.tecto.2020.228699
Tapponnier, P., Zhiqin, X., Roger, F., Meyer, B., Arnaud, N., Wittlinger, G., et al. (2001). Oblique Stepwise Rise and Growth of the Tibet Plateau. Science 294 (5547), 1671–1677. doi:10.1126/science.105978
Tavani, S., Storti, F., and Salvini, F. (2005). Rounding Hinges to Fault-Bend Folding: Geometric and Kinematic Implications. J. Struct. Geol. 27 (1), 3–22. doi:10.1016/j.jsg.2004.07.005
Tian, X., Bai, Z., Klemperer, S. L., Liang, X., Liu, Z., Wang, X., et al. (2021). Crustal-scale Wedge Tectonics at the Narrow Boundary between the Tibetan Plateau and Ordos Block. Earth Planet. Sci. Lett. 554, 116700. doi:10.1016/j.epsl.2020.116700
Wang, M., Feng, W., Jiang, D., Yan, B., Chen, Z., Song, G., et al. (2020). Interactions between Thin- and Thick-Skinned Tectonics at the Western Sichuan Basin, China. Tectonophysics 796, 228628. doi:10.1016/j.tecto.2020.228628
Wang, S. D., Shi, Y. Q., and Ren, F. W. (2018). Analysis and Textual Research of the Seismogenic Structure of the Qin-Long Earthquake in 600 A.D. (In Chinese). J. Geomechanics 24 (2), 157–168. doi:10.12090/j.issn.1006-6616.2018.24.02.017
Wang, S. D. (2018). Tectonic Deformation in Late Cenozoic of Liupanshan-Baoji Fault Zone in the NE Margin of Tibet Plateau (In Chinese). Doctor Dissertation thesis (Xi’an, Shaanxi: Northwest University).
Wang, W. T., Kirby, E., Zhang, P. Z., Zheng, D. W., Zhang, G. L., Zhang, H. P., et al. (2013). Tertiary Basin Evolution along the Northeastern Margin of the Tibetan Plateau: Evidence for Basin Formation during Oligocene Transtension. Geol. Soc. Am. Bull. 125 (3-4), 377–400. doi:10.1130/b30611.1
Wang, W. T. (2011). Sedimentary Responses to the Cenozoic Tectonic Evolution of the Northeastern Corner of the Tibetan Plateau (In Chinese). Doctor Dissertation thesis (BeijingChina Earthquake Administration: Institute of Geology).
Wang, W. T., Zhang, P. Z., Kirby, E., Wang, L. H., Zhang, G. L., Zheng, D. W., et al. (2011). A Revised Chronology for Tertiary Sedimentation in the Sikouzi Basin: Implications for the Tectonic Evolution of the Northeastern Corner of the Tibetan Plateau. Tectonophysics 505 (1-4), 100–114. doi:10.1016/j.tecto.2011.04.006
Wang, W. T., Zhang, P. Z., Zheng, D. W., and Pang, J. Z. (2014). Late Cenozoic Tectonic Deformation of the Haiyuan Fault Zone in the Northeastern Margin of the Tibetan Plateau (In Chinese). Earth Sci. Front. 21 (4), 266–274. doi:10.13745/j.esf.2014.04.027
Wells, D. L., and Coppersmith, K. J. (1994). New Empirical Relationships Among Magnitude, Rupture Length, Rupture Width, Rupture Area, and Surface Displacement. Bull. Seismol. Soc. Am. 84 (4), 974–1002. doi:10.1785/BSSA0840040974
Wesnousky, S. G. (2006). Predicting the Endpoints of Earthquake Ruptures. Nature 444 (7117), 358–360. doi:10.1038/nature05275
Wesnousky, S. G. (1988). Seismological and Structural Evolution of Strike-Slip Faults. Nature 335 (6188), 340–343. doi:10.1038/335340a0
Wu, Z. C., Guo, F. S., Lin, Z. Y., Hou, Q. M., and Luo, J. Q. (2016). Technology and Method of Multi-Data Merging in 3D Modeling (In Chinese). J. Jilin Univ. (Earth Sci. Ed. 46 (6), 1895–1913. doi:10.3969/j.issn.0001-5717.2015.07.014
Wu, Z. C., Guo, F. S., Zheng, X., Zhang, Y. Y., Luo, J. Q., and Hou, Q. M. (2015). The Technical Methods of Three-Dimension Geological Modeling Based on PRB Data (In Chinese). Acta Geol. Sin. 89 (7), 1318–1330. doi:10.13278/j.cnki.jjuese.201606308
Xia, S. B. (2019). Crust and Uppermost Mantle Electrical Structure beneath Haiyuan Arc Tectonic Belt and its Adjacent Areas in Northeastern Margin of the Tibetan Plateau (In Chinese). Doctor Dissertation thesis (Chengdu, Sichuan: Chengdu University of Technology).
Xin, H. L., Liu, M. J., Zhang, Y. S., Zeng, X. W., and Hu, Z. M. (2010). Relocation of the Earthquakes in the Southeast Area of Gansu (In Chinese). J. Seismol. Res. 33 (3), 292–299. doi:10.3969/j.issn.1000-0666.2010.03.009
Xin, H. L., Zeng, X. W., Kang, M., and Gao, J. (2020). Crustal Fine Velocity Structure of the Haiyuan Arcuate Tectonic Zone from Double-Difference Tomography (In Chinese). Chin. J. Geophys. 63 (3), 897–914. doi:10.6038/cjg2020N0067
Xin, Z., Han, J., Gao, R., Guo, X., Liang, H., Kang, J., et al. (2021). Electrical Structure of the Eastern Segment of the Qilian Orogenic Belt Revealed by 3-D Inversion of Magnetotelluric Data: New Insights into the Evolution of the Northeastern Margin of the Qinghai-Tibet Plateau. J. Asian Earth Sci. 210, 104707. doi:10.1016/j.jseaes.2021.104707
Ye, Z., Gao, R., Li, Q., Zhang, H., Shen, X., Liu, X., et al. (2015). Seismic Evidence for the North China Plate Underthrusting beneath Northeastern Tibet and its Implications for Plateau Growth. Earth Planet. Sci. Lett. 426, 109–117. doi:10.1016/j.epsl.2015.06.024
Yuan, D. Y., Lei, Z. S., Ge, W. P., Liu, X. W., Liu, B. C., and Zhang, J. L. (2007). A New Opinion about the West of Gangu M 7.0 Earthquake in 143 A.D. In Gansu Province (In Chinese). Northwest. Seismol. J. 29 (1), 58–63. doi:10.3969/j.issn.1000-0844.2007.01.012
Yuan, D. Y., Liang, M. J., Lei, Z. S., and Liu, X. W. (2013). New Evidence for Late Quaternary Activity in the Middle Segment of the Northern Margin Fault of Maxian Shan in Lanzhou (In Chinese). China Earthq. Eng. J. 35 (1), 145–153. doi:10.3969/j.issn.1000-0844.2013.01.0145
Yuan, D. Y., Liu, X. F., Zheng, W. J., Liu, X. L., and Liu, B. C. (2003). Tectonic Deformation Feature and Mechanism of the Maxianshan-Xinglongshan Active Fault System in the Lanzhou Area (In Chinese). Earthq. Res. China 19 (2), 23–29. doi:10.3969/j.issn.1001-4683.2003.02.004
Yue, L. F., Suppe, J., and Hung, J.-H. (2005). Structural Geology of a Classic Thrust Belt Earthquake: the 1999 Chi-Chi Earthquake Taiwan (Mw=7.6). J. Struct. Geol. 27 (11), 2058–2083. doi:10.1016/j.jsg.2005.05.020
Zeng, J. P., An, B. Z., Hu, X. J., and Chen, T. T. (2020). Structural Interpretation and Characteristic Analysis of Liupanshan Basin (In Chinese). Ningxia Eng. Technol. 19 (2), 185–192. doi:10.3969/j.issn.1671-7244.2020.02.020
Zhan, H. L., Zhang, D. L., He, X. H., Shen, X. Z., Zheng, W. J., and Li, Z. G. (2020). Limitation of Current Tectonic Deformation Modes in the Western Margin of Ordos Based on Seismic Activity Characteristics (In Chinese). Seismol. Geol. 42 (2), 346–365. doi:10.3969/j.issn.0253-4967.2020.02.007
Zhan, Y. (2008). Deep Electric Structures beneath the Northeastern Margin of the Tibetan Plateau and its Tectonic Implications (In Chinese). Doctor Dissertation thesis (BeijingChina Earthquake Administration: Institute of Geology).
Zhan, Y., Zhao, G. Z., Chen, X. B., Tang, J., Wang, J. J., and Deng, Q. H. (2004). Crustal Structure from Magnetotelluric Profiling in the Haiyuan Earthquake Area, Ningxia Hui Autonomous Region, China (In Chinese). Chin. J. Geophys. 47 (2), 274–281. doi:10.1002/cjg2.486
Zhan, Y., Zhao, G. Z., Wang, J. J., Chen, X. B., Xiao, Q. B., Huang, Z., et al. (2008). Deep Electric Structure beneath the Epicentre of the 1927 Gulang M8 Earthquake and its Adjacent Areas from Magnetotelluric Sounding (In Chinese). Chin. J. Geophys. 51 (2), 511–520. doi:10.1002/cjg2.1225
Zhan, Y., Zhao, G. Z., Wang, J. J., Tang, J., Chen, X. B., Deng, Q. H., et al. (2005). Crustal Electric Structure of Haiyuan Arcuate Tectonic Region in the Northeastern Margin of Qinghai-Xizang Plateau, China (In Chinese). Acta Seismol. Sin. 27 (4), 431–440. doi:10.3321/j.issn:0253-3782.2005.04.010
Zhan, Y., Zhao, G. Z., Wang, L. F., Wang, J. J., Chen, X. B., Zhao, L. Q., et al. (2014). Deep Electric Structure beneath the Intersection Area of West Qinling Orogenic with North-South Seismic Tectonic Zone in China (In Chinese). Chin. J. Geophys. 51 (2), 511–520. doi:10.6038/cjg20140819
Zhang, B. (2020a). Fault Geometry and Deformation Partition of WNW-Trending Faults in the West Qinling Mountain (In Chinese). Doctor Dissertation thesis (BeijingChina Earthquake Administration: Institute of Geology).
Zhang, P., Burchfiel, B. C., Molnar, P., Zhang, W., Jiao, D., Deng, Q., et al. (1991). Amount and Style of Late Cenozoic Deformation in the Liupan Shan Area, Ningxia Autonomous Region, China. Tectonics 10 (6), 1111–1129. doi:10.1029/90tc02686
Zhang, P. Z., Deng, Q. D., Zhang, G. M., Ma, J., Gan, W. J., Min, W., et al. (2003). Strong Seismicity and Active Crust Blocks of China Continent (In Chinese). Sci. China (Series D) 33 (S1), 12–20. doi:10.3969/j.issn.1674-7240.2003.z1.002
Zhang, P. Z. (1990). Tectonic Characteristics and Crustal Shortening in the Liupanshan Area (In Chinese). Beijing: Seismological Press.
Zhang, Y. P., Zheng, W. J., Yuan, D. Y., Wang, W. T., and Zhang, P. Z. (2021). Geometrical Imagery and Kinematic Dissipation of the Late Cenozoic Active Faults in the West Qinling Belt: Implications for the Growth of the Tibetan Plateau (In Chinese). J. Geomechanics 27 (2), 159–177. doi:10.12090/j.issn.1006-6616.2021.27.02.017
Zhang, Z. L. (2020b). The Activity of the West End of the Western Qinling Fault Zone and its Influence on the Railway Project from Xining to Chengdu (In Chinese). South China J. Seismol. 40 (2), 85–91. doi:10.13512/j.hndz.2020.02.013
Zhao, L. Q. (2014). Deep Electrical Structure and Dynamic Background of Central West Qin Ling and Blocks on its Either Side (In Chinese). Master Dissertation thesis (BeijingChina Earthquake Administration: Institute of Geology).
Zhao, L. Q., Zhan, Y., Sun, X. Y., Hao, M., Zhu, Y. Q., Chen, X. B., et al. (2019). The Hidden Seismogenic Structure and Dynamic Environment of the 21 January Menyuan, Qinghai, MS6.4 Earthquake Derived from Magnetotelluric Imaging (In Chinese). Chin. J. Geophys. 62 (6), 2088–2100. doi:10.6038/cjg2019M0204
Zhao, L. Q., Zhan, Y., Wang, Q. L., Sun, X. Y., Hao, M., Zhu, Y. Q., et al. (2020). The Deep Electrical Structure and Seismigenic Background of Lenglongling Uplift and its Adjacent Areas in the Eastern End of Qilian Mountains (In Chinese). Chin. J. Geophys. 63 (3), 1014–1025. doi:10.6038/cjg2020N0257
Zheng, W.-j., Zhang, P.-z., He, W.-g., Yuan, D.-y., Shao, Y.-x., Zheng, D.-w., et al. (2013). Transformation of Displacement between Strike-Slip and Crustal Shortening in the Northern Margin of the Tibetan Plateau: Evidence from Decadal GPS Measurements and Late Quaternary Slip Rates on Faults. Tectonophysics 584, 267–280. doi:10.1016/j.tecto.2012.01.006
Zheng, W. J., Yuan, D. Y., Zhang, P. Z., Yu, J. X., Lei, Q. Y., Wang, W. T., et al. (2016). Tectonic Geometry and Kinematic Dissipation of the Active Faults for Understanding Northeastward Growth of the Plateau (In Chinese). Quat. Sci. 36 (4), 775–788. doi:10.11928/j.issn.1001-7410.2016.04.01
Keywords: active fault, 3D fault structure, 3D structural modeling, seismic hazard, Tibetan Plateau
Citation: Li L, Li Z, Sun C, Wang W, Dai X, Zhang Y, Liang H, Xu B, Wu X and Lv L (2022) Three-Dimensional Fault Model and Activity in the Arc-Shaped Tectonic Belt in the Northeastern Margin of the Tibetan Plateau. Front. Earth Sci. 10:893558. doi: 10.3389/feart.2022.893558
Received: 10 March 2022; Accepted: 10 May 2022;
Published: 30 May 2022.
Edited by:
Zhuqi Zhang, China Earthquake Administration, ChinaReviewed by:
Renqi Lu, China Earthquake Administration, ChinaCopyright © 2022 Li, Li, Sun, Wang, Dai, Zhang, Liang, Xu, Wu and Lv. This is an open-access article distributed under the terms of the Creative Commons Attribution License (CC BY). The use, distribution or reproduction in other forums is permitted, provided the original author(s) and the copyright owner(s) are credited and that the original publication in this journal is cited, in accordance with accepted academic practice. No use, distribution or reproduction is permitted which does not comply with these terms.
*Correspondence: Zhigang Li, bGl6aGlnYW5nQG1haWwuc3lzdS5lZHUuY24=
Disclaimer: All claims expressed in this article are solely those of the authors and do not necessarily represent those of their affiliated organizations, or those of the publisher, the editors and the reviewers. Any product that may be evaluated in this article or claim that may be made by its manufacturer is not guaranteed or endorsed by the publisher.
Research integrity at Frontiers
Learn more about the work of our research integrity team to safeguard the quality of each article we publish.