 Ming Sun
 Qingxiang Meng*
- School of Landscape, Northeast Forestry University, Harbin, China
The discourse about urban planning, urban design, urban management, and many other basic urban planning issues are related to identifying the spatial heterogeneity in the main urban area (MUA). Road networks are important infrastructure for social and economic development and also an important driving factor for urban land use. Therefore, the topological characteristics of the urban road network can be used as an important basis for the space of the division of the MUA. This study takes the MUA space in the Harbin Ring Expressway as the research object. The findings of this research establish a city model to identify the spatial heterogeneity, through a method of “Spatial essential attribute—Spatial autocorrelation analysis—Establishment of urban model.” In this model, spatial essential attributes are obtained from the analysis of space syntax. The spatial autocorrelation analysis is a method to calculate spatial clustering, and building the urban model is a kind of computer visualization method. Using this method, this research constructs a spatial heterogeneity model (SHM) of the urban built-up area in Harbin, which consists of three layers of spatial circles and two prominent regional structures. Then, it analyzes the spatial distribution of infrastructure and population agglomeration through nuclear density. We gain three conclusions: first, in addition to educational and greening facilities, the spatial distribution of infrastructure is correlated with the regional structure of SHM in Harbin’s MUA. Second, there are differences in the spatial attraction of population agglomeration between the different areas in the SHM of Harbin’s MUA. Finally, the new identification model of the SHM is scientific, but it has some advantages and demerits. Using spatial topological values to construct the SHM, it provides a new city model in urban spatial heterogeneity region recognition. Through the research results, the identification method of the SHM improves the traditional method which identifies urban heterogeneity areas according to people’s subjective wishes in urban planning. Therefore, the SHM helps relevant practitioners and scholars practice urban planning, urban analysis, urban protection, and urban management.
1 Background
Since Castells defined urban space as “flow space,” urban space was regarded as a complex organic whole that interacts with “fluid” variables such as human flow, traffic flow, and information flow. As a result, more and more urban researchers paid more attention to the flow and network relationship of urban interior space (Castells, 1996; Xi, 2014; Wang, 2017). Recently, with the deepening of urban research and the rapid development of new urban science, the following variables were widely accepted, the urban network division model, such as urban epidemic transmission and prevention, urban grade and scale, urban agglomeration effect, urban life circle, urban traffic isochronous line, and so on (Batty, 2013; Hu et al., 2014; West, 2017; Rybski et al., 2019; Chai et al., 2020; Liu, 2020).
In the study of urban cyberspace, three important problems were identified. First, with the identification of urban regions, definitions were problematic as well as connections. Professors Zhou and Shi (1995) pointed out that urban areas could be divided into an administrative area, a built-up area, and a functional area. The professors cautioned that within the specific geographical identification, administrative areas and built-up areas were often difficult to fully match.
Second, the lack of attention in relation to the heterogeneity of urban space was highlighted. Alexander proposed the city non-tree and introduced the semi-network theory which was later developed into an urban network. Because urban space consists of traditional tree structures but was overturned, Alexander regarded the city as a complex giant system (Alexander, 2015). As a result of this phenomenon, nonlinear theories continued to emerge. Thereafter, a paradigm shift occurred and the urban paradigm based on self-organization theory, topology theory, and nonlinear theory was gradually formed. As a result, this showed that urban space had complexity and heterogeneity. The phenomena of heterogeneity of urban space were contextualized within time, physical environment, and space, which was reflected in the frequency and vitality of people’s use of urban space at different times and places. The differentiation studies identified, include global environment and resources, urban vitality, urban Spatio-temporal, big data, etc. (Zhang et al., 2020; Shi et al., 2021a; Luo et al., 2021; Cui et al., 2022).
The method of zoning is an important strategy to divide the urban built-up areas and this method is based on the spatial heterogeneity in urban planning and management. American scholar E.·W.·Burgess coined the theory as early as 1923, of the urban concentric zone, which extends outward in concentric circles around the urban center according to different functional areas. This urban concentric zone formed different urban structural patterns. Furthermore, in 1939, the American scholar H.·Hoyt contextualized the sector theory under the condition of emphasizing the traffic function. Moreover, the sector theory made a step forward in the concentric zone theory, but these theories remain in empiricism and lack a mathematical basis (Ye, 1985). However, since the 20th century, a few studies included the division of territory that has been widely used in the field of urban resources, urban ecosystem, urban landscape, urban spatial planning, etc.
These studies among others include Chen et al. (2014) who identified critical source areas (CSAs) with the soil and water assessment tool (SWAT) model; Brown and Quinn (2019) who used integrated valuation of ecosystem services and tradeoffs (invest) to compare the function of zoning and the relationship between development and ecosystem services across 65 waters in South Carolina, United States; Rodriguez et al. (2015) who used ecosystem services to divide the cities and regions of Basque country; Liu and Zhou (2021) who discussed the spatial division of China’s territorial spatial planning.
However, despite internal differences, such zoning results ignored these differences and could not meet the needs of accurate zoning management in rapidly urbanized areas. This in turn reduced the applicability and effectiveness of zoning management and spatial planning applicable to the fields of resource landscape (Fei et al., 2017; Liu et al., 2020; Yin et al., 2022). On the other hand, there are relevant studies focusing on the spatial heterogeneity of urban zoning. For example, Gu and You (2022) discussed the spatial heterogeneity model least squares (OLS) model and the spatial autoregression model (SAM), and constructed the spatial quantitative expression (SQR) model to identify the differentiation characteristics of Beijing, China; Liu et al. 2022 used the geographically weighted quantitative expression (GWQR) model to identify the spatial heterogeneity of taxi demand in Shenzhen, China. However, as a result of these studies, the findings show that the zoning of urban built-up areas divided by this kind of research that emphasizes zoning is very fragmented, and there is a great lack of integrity in urban space.
Third, exploring the heterogeneity of urban space and the division of urban built-up areas, identification of urban boundaries is inseparable from it. In the academic environment, variables in relation to the boundaries identification of urban spatial heterogeneity were usually based on population size and density, infrastructure improvement, building density, population employment structure, etc. (Hou et al., 2010; Liu et al., 2021a; Zhao et al., 2021). Methods that were applied for specific technical means include census investigation, remote sensing, the fractal method, density analysis, improved algorithm, nighttime light identification, the POI data, and so on (Zhou and Shi, 1995; Ahmadi et al., 2010; Tannier et al., 2011; Li et al., 2015; Xu and Gao, 2016; Yao et al., 2016; Li et al., 2021a; Li et al., 2021b; Yan et al., 2021; Li et al., 2022). Arriving at the results, there were many shortcomings in the aforementioned technical methods, such as the need for large amounts of data and knowledge support, and high labor and time costs. Furthermore, it was extremely inconvenient with the use of specific planning and design practice. Therefore, in the practice of specific urban spatial analysis and design, the Chinese planner’s strategy usually has taken roads or natural boundaries as the basis for the division of urban built-up areas (Zhang et al., 2019). Thus, there was a “circle layer, group” at the MUA level and “neighborhood unit, service radius, and living circle” at the community level.
Another analysis by Shi et al. (2021b) revealed variables that do not conform to the boundary characteristics of the urban built-up area. The author uses the spatial economic model in the business circles in Shanghai (kernel density estimation, standard deviational ellipses, and the spatial economic model), with the result that the spatial boundary is circular or elliptical. A further result is that the identification of urban boundaries had a great asymmetry in academic research and urban design. Moreover, the use of spatial syntax provides dawn for the identification of urban built-up area boundaries and spatial heterogeneity. In another study by Vaughan (2007), she reviewed the application of spatial syntax in the identification of urban boundaries and affirmed that the use of urban road network spatial essential attributes to divide urban built-up area boundaries reflects the social, economic, and other spatial imbalances. A further study by Xia et al. (2019) presents an urban growth boundary model (UGBM) using space syntax and a multivariable region model, exploring the great potential of the essential attributes of road network space in identifying urban boundaries. Whereas Zerouati and Bellal (2020) use space syntax analysis and snapshot observations to analyze the spatial imbalance of the four communities of Setif and Algeria and discuss the central area of the city defined according to the essential attributes of the urban road network. However, the existing methods of spatial syntax to identify spatial boundaries are limited to using the extreme value of spatial essential attributes, while ignoring the general value of spatial essential attributes.
Inspired by space syntax, this study focused on the essential attributes of urban space, adopted the method of spatial clustering analysis, and established a city model of urban spatial heterogeneity (SHM), which consist of three layers of spatial circles and two prominent regional structures. As a result, through the spatial distribution of infrastructure and population agglomeration in Harbin, it has been found that SHM has a good effect on identifying urban population agglomeration and infrastructure distribution (except for educational and greening facilities). Hence, this model of identifying spatial heterogeneity in urban built-up areas can be applied to urban planning and research, geographical science, urban morphology, urban environmental science, urban surveying and mapping, urban disaster prevention, urban economy, and other fields. This study is a new application of spatial syntax and the identification method of SHM will improve the traditional method which identifies urban areas according to people’s subjective wishes in urban planning. This new city model will have a significant meaning. In conclusion, in this study, spatial clustering technology based on spatial autocorrelation can make full use of all values of spatial essential attributes, and provide a new application for the use of spatial syntax.
2 Methods
2.1 Research scope
Harbin is the provincial capital of Heilongjiang Province (east longitude 125° 42–130° 10 min, north latitude 44° 04–46° 40 min) and one of the megacities in China. The traditional spatial structure was the form of loop radiation of Harbin’s MUA. According to the current road network planning, it could be divided into the pattern of “4 loop and 11 radiation”. Among them, the “4 loop” was the road loop: the inner ring road (Tiandi Street, Antarctic Street, Kuancheng Street, the southern section of Xuanhua Street, the northeastern section of Wenchang Street, Jiaohua Street and the northeastern section of Xinyang Road, with a total length of about 12.8 km); the second ring road (composed of Kangan Road, Hexing Road, the three major power roads, Tata Street, Gongbin Road, Nanzhi Road, Friendship East Road, Friendship Road, Hetu Street and Qianjin Road, which runs through the southern bank of the Songhua River and the four districts of Nangang, Daoli, Daowai and Xiangfang, with a total length of 30.38 km); the third ring road (Zhongyuan Road, Yangmingtan Bridge, Wanggang Street, Harbin South Station, Harbin-Aa Expressway, Chemical Road, Crossing River Bridge, with a total length of 66.23 km); the fourth ring road (City Expressway); “11 radiation” meant the radial roads connecting the loops: Airport Road, Changjiang Road, Harbin Shuangbei Line, Harbin Shuangnan Line, Beijing-Harbin Highway, Harbin Fifth Road, Ha’a Road, Ha Cheng Road, Ha Tong Road, Ha Tong Second Exit, Ha Hei Road.
The MUA was distributed on the fourth ring road, which has been expanding in the north and south directions of the circular expressway. The overflow part was composed of two groups, which were assembled by industry, housing, commerce, and public service facilities. The northern group and Harbin’s MUA were connected by the Ha Hei Road in the “11 radiation” road. The southern group was mainly connected with Harbin’s MUA by the Beijing-Harbin Highway and Harbin Fifth Road in the “11 radiation” road. The two groups had certain independence. Under the condition of retaining the road network “4 loop, 11 radiation” pattern, the MUA space in the Harbin Fourth Ring Road carried the main information of Harbin, which could represent the actual MUA space. This study took the urban built-up area in MUA as the research scope (Figure 1).
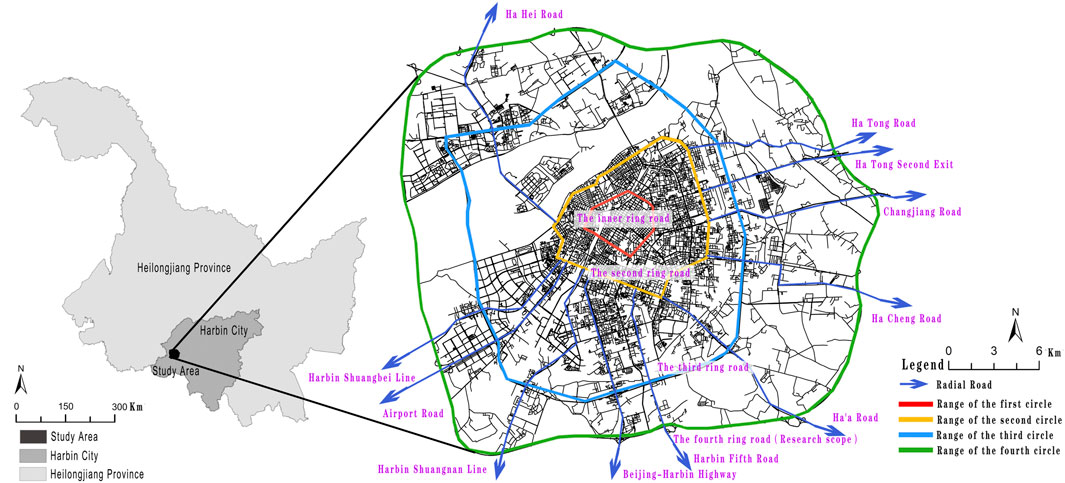
FIGURE 1. The location and study area (the 4th ring road, Harbin, China).
2.2 Methodology
In the first section, the background, the fluidity and complexity of urban space, and three basic problems of urban space, urban region identification, spatial imbalance, and spatial boundary are introduced. The relevant literature is reviewed and previous research deficiencies are discussed. Furthermore, the content, innovation, and application fields of this study are described. In the second part, the research scope, research methods, and research data are described. The third part of the experimental results analyzes the topological values of roads by space syntax, which has been widely applied in the research fields of street planning, spatial pattern, route planning, street vitality, and so on (Hillier and Zhao, 1985; Liu et al., 2017; Chun et al., 2021; Guo and Cao, 2021; Liao et al., 2021). Among these research fields, the topological value of road mainly includes integration, total depth, connectivity, control, and choice (Xu et al., 2016; Liu et al., 2021b; Li et al., 2021c; Du et al., 2021). Representing the accessibility of space, the topological value of roads can reflect the global depth of space and reflect the following variables, the difficulty, cost, time, and even energy of reaching a certain space (Hillier, 1996). Therefore, this study argues for the use of the spatial essential attribute of the road network, which is an important basis for the division of the different spaces. The topology value attribute clustering is acquired through the spatial autocorrelation analysis to obtain the spatial heterogeneity model (SHM). Furthermore, the experimental result is obtained by using the kernel density analysis method to observe the spatial distribution characteristics of population agglomeration and infrastructure, which reflect spatial heterogeneity in Harbin MUA. In the fourth part, the practical effects, application fields, advantages, and disadvantages of SHM are discussed. The fifth part is the conclusion where a new data model for SHM is further discussed. Last, the research process and framework are shown in Figure 2.

FIGURE 2. Flow of method framework.
This new method only needs the CAD road map of the city and learning-related software, such as Depthmap and GIS. This study provides a city model of SHM identification, which is “Spatial essential attribute—Spatial autocorrelation analysis—Establishment of urban model”. This model is an improvement from the traditional identification method and the design is convenient for planners to use. Moreover, the experiment is also a new attempt at the application of space syntax in spatial region recognition.
2.2.1 Space syntax
The spatial syntax is a quantitative research technology of urban space based on the principle of topology. It analyzes the urban spatial form based on the characteristics of the urban road network and objectively expresses the relationship between the topological attribute of the urban road network and the urban spatial network. Assuming that there are line elements in the road system, which are numbered successively from a1 to obtain the global depth Total Depth (a1) of a1. Formula 1, 2 are obtained after excluding the influence of central elements and element numbers:
2.2.2 Spatial autocorrelation analysis
Spatial autocorrelation, compared with the ordinary dimension-reduction clustering method, considering the correlation of variables in different spatial positions, is a quantitative data clustering analysis method based on spatial positions, and Formulas 3, 4, 5, 6.
The Moran’s I statistical formula is
Statistical Z(I), E(I), and V(I) score formula:
Among them, Zi is the bias of elements i and (Xi-
2.2.3 Nuclear density analysis
The nuclear density analysis method is an algorithm for quantifying the distribution characteristics of urban spatial elements, and the analyzed elements are mainly POI elements.
Formula 7 is obtained as follows:
Among them, f (x) is the position density estimation, n is the number of POI, h is the search radius, (X-Xi) is the distance from the analysis element to the center point, and C is the kernel function.
2.3 Experimental data
The basic experimental data is divided into three categories: road data, infrastructure data, and mobile phone signaling card data. Moreover, road data are the LOI data, infrastructure data, and mobile phone signaling card data is POI data.
2.3.1 Road data
A total of 40,467 road data were obtained by processing the CAD road network base map within the research scope of Harbin MUA in 2020. Through field investigation and road space network simulation, 28,909 road data were acquired. This road data restored the real 3D connection network relationship of the urban road space network, which improved the authenticity and accuracy of the experiment.
2.3.2 Infrastructure data
Infrastructure data refers to all kinds of urban construction service facilities, which can analyze the heterogeneity of urban space in the MUA of Harbin. Infrastructure data came from the 2020 large map website of Baidu map. The study used the web crawl to get a total of 18,015 Harbin city infrastructure data (Table 1). According to the research of Liu and Long (2016), the selected data are divided into eight categories: government agencies (2.0%), transportation (11.0%), commerce (44.4%), education (2.8%), companies and enterprises (34.9%), residence (1.6%), green space (3.4%), others (not counted).
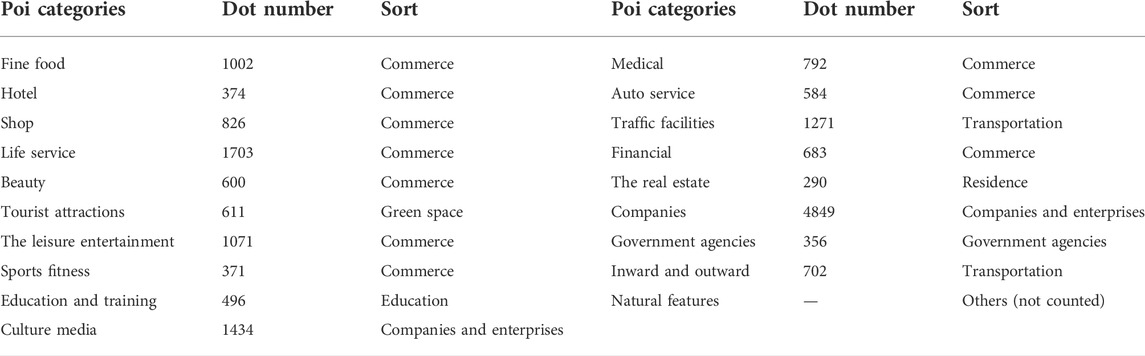
TABLE 1. Infrastructure data classification.
2.3.3 Mobile phone signaling card data
These data are based on the annual check-in data of urban positioning cards in TIK TOK. Then, 3,296,810 check-in data were obtained after the data process, which is preserved field ID, longitude, dimension, card number, and coordinate system verification. Mobile phone signaling card data can reflect the use of urban space by urban people and objectively show spatial heterogeneity in the MUA of Harbin.
3 Experimental results
According to the experimental method, the experimental data are carried out. The first result is to quantitatively analyze the essential attributes of the street network space in the MUA of Harbin through the spatial syntax; the second result is that the essential attributes of the streets in the first result are used as the analysis elements to carry out spatial autocorrelation cluster analysis as the basis for the establishment of SHM in Harbin MUA; the third result is to establish SHM in Harbin MUA; the fourth result is that according to the classification of Harbin infrastructure data, infrastructure distribution in the MUA of Harbin is analyzed by nuclear density; the fifth experiment is to analyze the relationship between the population concentration in the MUA of Harbin and SHM; finally, we find that SHM of Harbin MUA applies to the urban built-up area. In addition to the single educational infrastructure and green space, the single infrastructure and comprehensive infrastructure are mainly concentrated in the prominent area, the core circle layer, the transition circle layer, and its surrounding areas. These urban areas are very attractive to people and are prominent areas in the center of urban vitality. This also indirectly shows that the urban built-up area identification of SHM can reflect the distribution of facilities and resources, the attractiveness of urban space, and population concentration to a certain extent.
3.1 Experimental result 1: spatial essential attribute
It can be seen from the representation diagram that the spatial topological value of road network space forms a relatively stable spatial hierarchy (Figure 3). Spatial topological value shows the connection order of the topological structure of road elements, mainly reflecting the difficulty of reaching urban network space, which provides a morphological basis for the classification of urban spatial heterogeneity. Through the illustration, the red color indicates that the topology connection order is high and it is difficult to reach the space from the core of the city. On the contrary, the blue color indicates that the topology connection order is low and it is easy to reach the space from the core of the city.
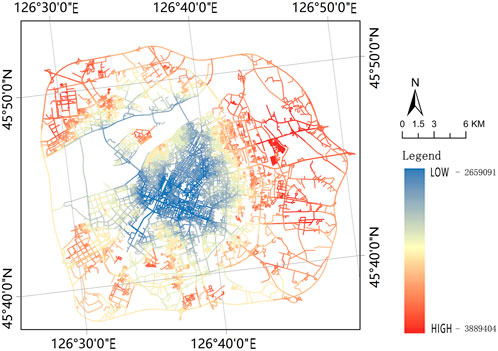
FIGURE 3. The road network spatial topological value of Harbin’s MUA. The spatial topological value (total depth) is obtained through the spatial syntax analysis. The higher the spatial topology value, the worse the accessibility of the urban space. The lower the spatial topology value, the better the accessibility.
3.2 Experimental result 2: spatial autocorrelation analysis
Based on the analysis result of total depth, it shows road network spatial topological value in Harbin’s main urban area. The spatial hierarchy clustering analysis used the spatial autocorrelation analysis method (Li et al., 2004; Ke et al., 2021). Finally, the spatial hierarchy clustering map of the road network in Harbin MUA with five spatial hierarchy clustering attributes: High clustering (HH), low clustering (LL), high and low isolation (HL), low and high isolation (HL), and random distribution (all other values) was obtained as shown in Figure 4.
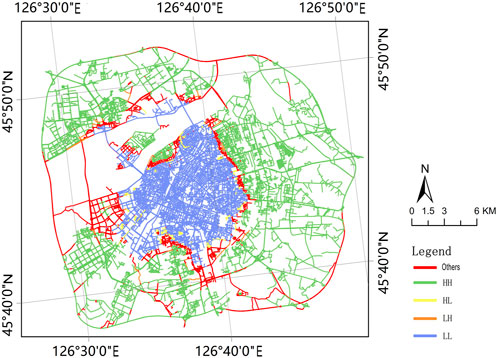
FIGURE 4. Spatial autocorrelation of road network in Harbin’s MUA.
According to the analysis of the experimental data report in Table 2, Moran’s I of the global autocorrelation analysis of the total depth space is 0.8542 > 0, the global Z (l) is 465.3739 > 1.65, and the global and part p values are 0.0000, which proves that the spatial structure of the road network tends to converge in space. The clustering effect is obvious. It also formed a good spatial heterogeneity in the MUA of Harbin. There is a significant positive correlation between the spatial network structure and the road network structure in Harbin’s MUA. The part Z (l) is −64.4778, which shows that there is a significant negative correlation between the spatial network structure and the total depth of the road network structure in Harbin’s MUA.
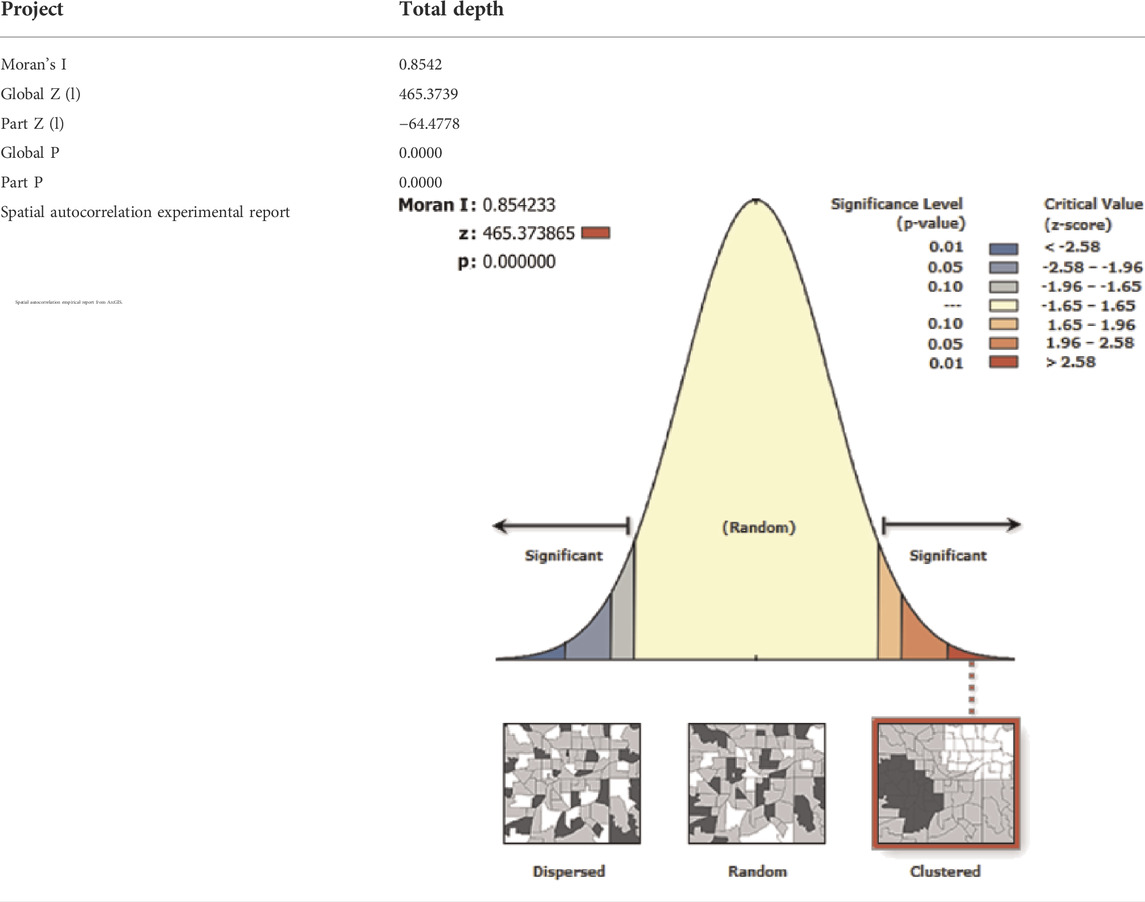
TABLE 2. Experimental data report of road network spatial autocorrelation in Harbin’s MUA.
The spatial topological value and the spatial autocorrelation data analysis have good inclusion (experimental results 1 and 2), indicating that the spatial autocorrelation clustering analysis is based on topological values of the road network structure, which obtain SHM through “Spatial essential attribute—Spatial autocorrelation analysis—Establishment of urban model”. The design of this experiment is a new attempt at the application of space syntax in spatial region recognition.
3.3 Experimental result 3: analysis of the spatial heterogeneity structure of the Harbin main urban area
Based on the aforementioned spatial data analysis, we established the Spatial Heterogeneity Model (SHM) in the Harbin main urban area (Figure 5), which is the three-level physical space circle layer of the ‘Core Circle Layer, Transition Circle Layer, and Peripheral Circle Layer’ and the area of ‘Prominent Area A + Prominent Area B’. However, it should be noted that the circle layer here is a spatial hierarchical attribute clustering division region based on spatial essential attribute and spatial location and the Salient region is a clustering of outliers whose spatial position is obvious in a certain clustering spatial hierarchy in the spatial attribute distribution.
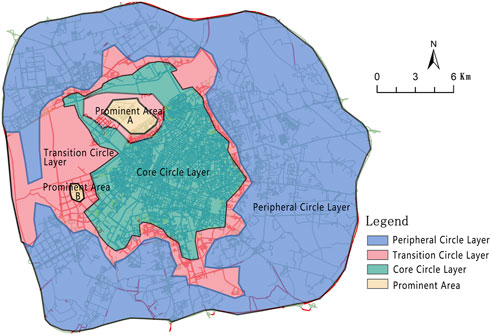
FIGURE 5. The spatial heterogeneity model (SHM) of Harbin’s MUA.
Based on this context, generally speaking, in urban built-up areas, the Core Circle Layer is the central area of a city with high road density and compact urban texture. Accordingly, the Core Circle Layer represents better convenience and flow attraction and the Peripheral Circle Layer represents low road density and low regularity of urban fabric. It further contextualizes the Transition Circle Layer which stands for the transition space between the Core Circle Layer and the Periphery Circle Layer, which plays the role of space integration and space transition. It is argued that the new method is more accurate if compared with the traditional method. Thus, under the constraints of urban land use and socio-economic development, the new identification method does not depend on specific road divisions. According to the outliers, two areas with prominence are screened out, and these areas are worthy of study.
3.4 Experimental result 4: analysis of infrastructure distribution in the main urban area of Harbin
The spatial distribution of infrastructure, for instance, government agencies, transportation, commerce, education, companies and enterprises, housing and green space, and comprehensive infrastructure in Harbin’s main urban area (MUA) is analyzed through its nuclear density. According to the geographical location, the spatial distribution of the analyzed infrastructure is displayed in SHM. It can be found that
1) In terms of the spatial distribution of spatial heterogeneity, government agencies were most concentrated in prominent area A and the core circle layer of SHM in Harbin’s MUA (Table 3).
2) According to the spatial distribution of Harbin’s MUA, the transportation infrastructures were mainly distributed in the core circle and transition circle of the non-prominent area of SHM (Table 4).
3) The commercial and corporate infrastructures were mainly distributed in the core circle layer, transition circle layer, and their surroundings of SHM, and commerce. Company and enterprises were most concentrated in prominent area A and prominent area B, as shown in Table 5.
4) The distribution of educational infrastructures in urban natural areas was relatively balanced. This indicates that SHM had a poor ability to screen educational infrastructure, as shown in Table 6.
5) The spatial distribution of residential infrastructures in the urban entity region was mainly concentrated in the core circle layer, transition circle layer, and its surrounding areas of SHM, as shown in Table 7.
6) Based on spatial distribution, green space infrastructures were most concentrated in highlighting area A and highlighting area B of SHM, and the rest of the spatial distribution was balanced as shown in Table 8.
7) Based on the comprehensive spatial distribution analysis of all the infrastructures in the Harbin urban area, it was found that the infrastructures were mainly distributed in the core circle layer, transition circle layer, and its surroundings in SHM. In addition, all the infrastructures in MUA were most concentrated in highlighting area A and highlighting area B, as shown in Table 9.
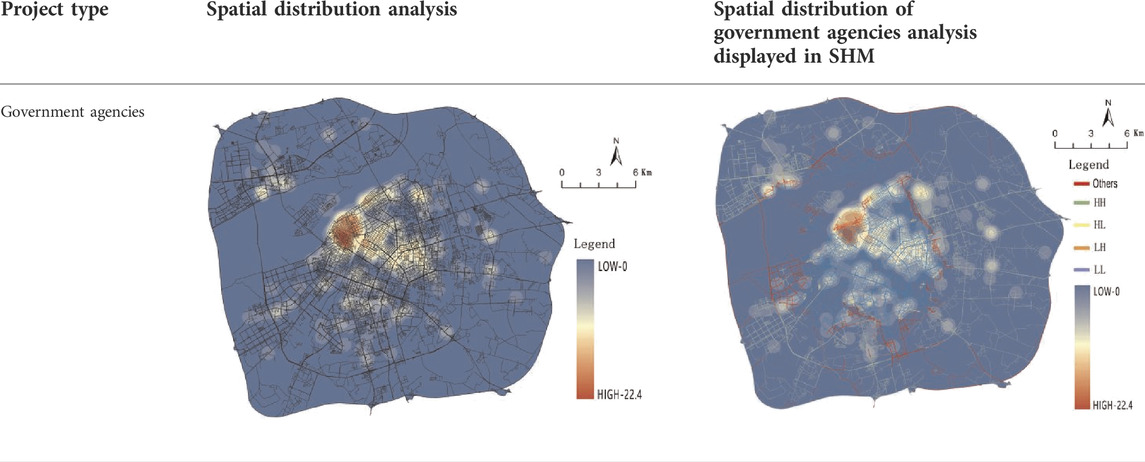
TABLE 3. Spatial distribution of single infrastructure (Government agencies) in SHM.
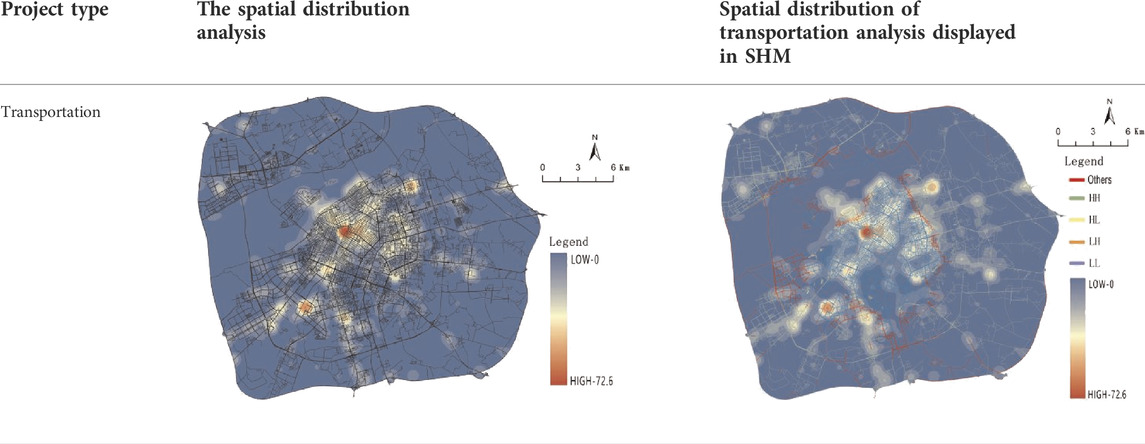
TABLE 4. Spatial distribution of single infrastructure (Transportation) in SHM.
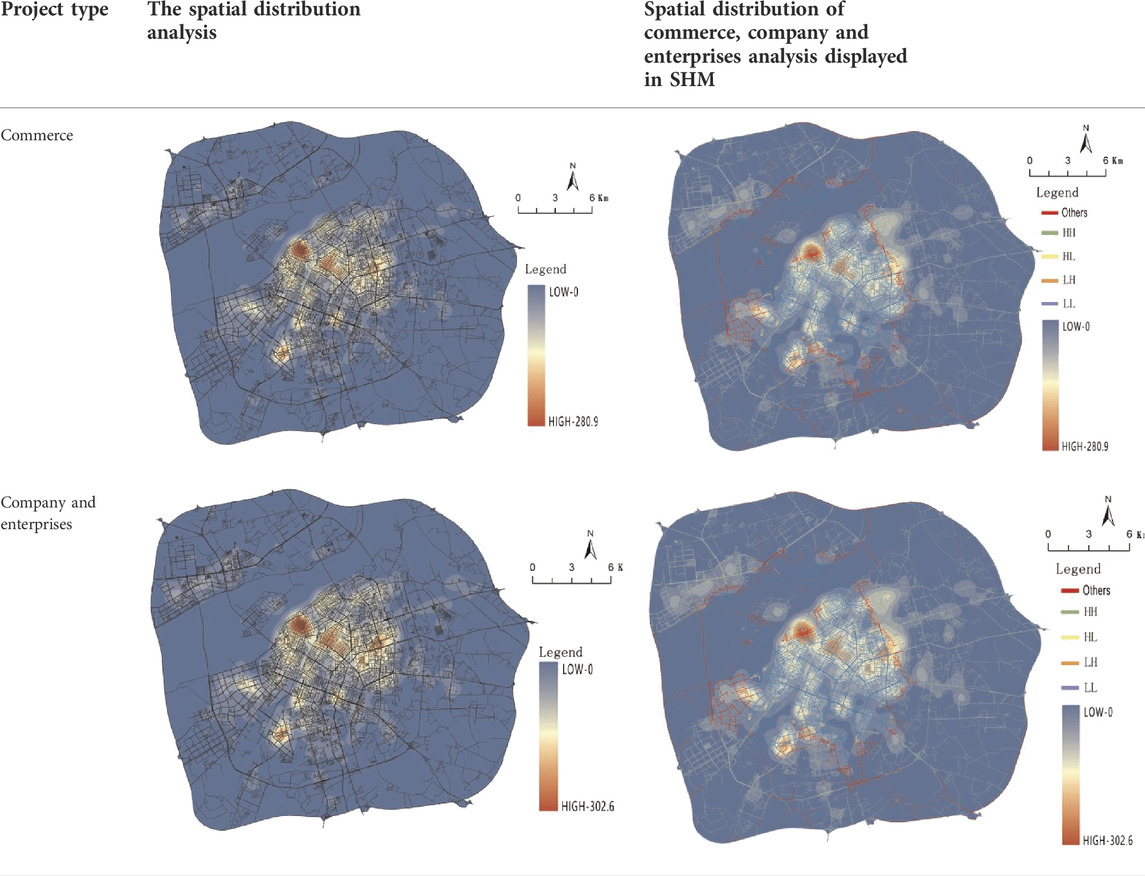
TABLE 5. Spatial distribution of single infrastructure (Commerce, Company, and enterprises) in SHM.

TABLE 6. Spatial distribution of single infrastructure (Education) in SHM.
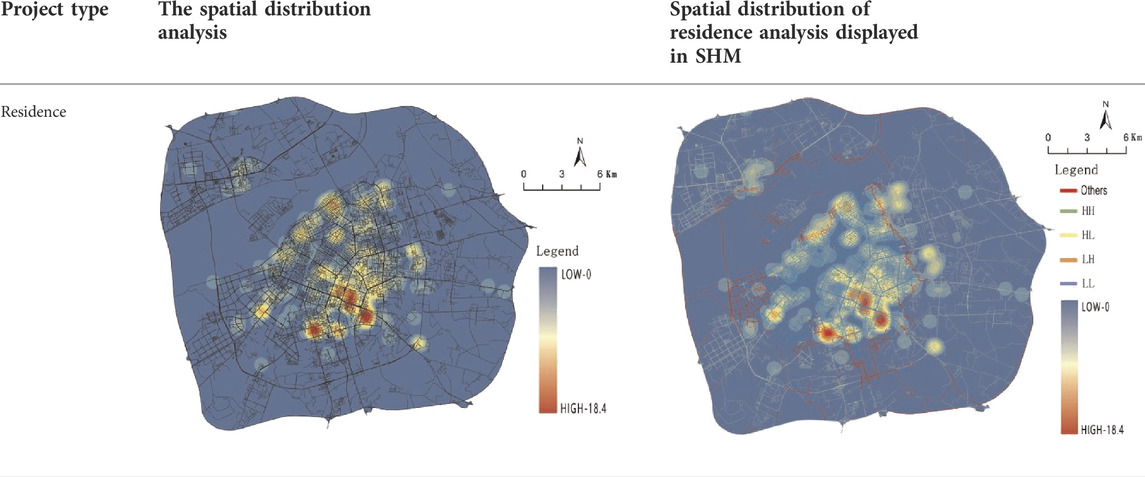
TABLE 7. Spatial distribution of single infrastructure (Residence) in SHM.
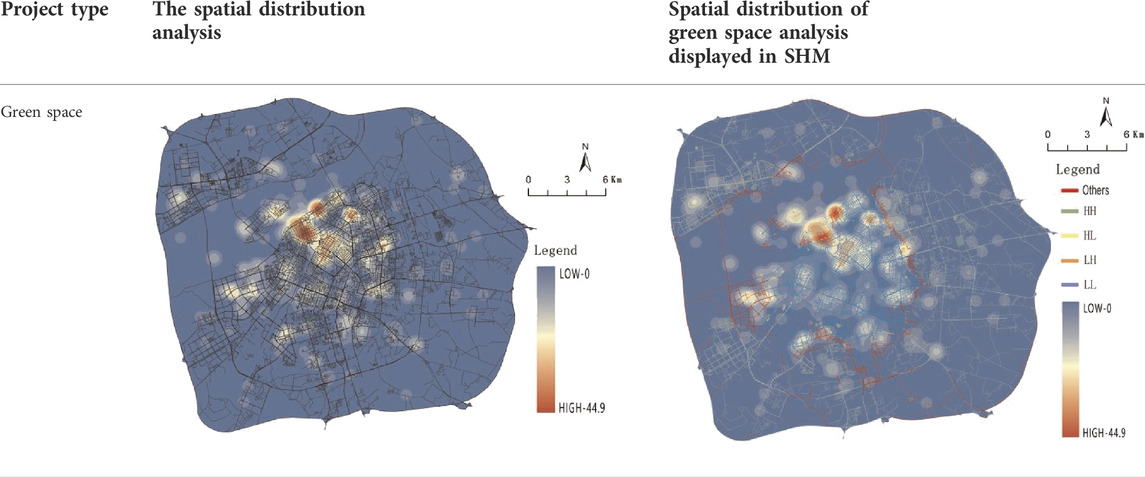
TABLE 8. Spatial distribution of single infrastructure (Green space) in SHM.
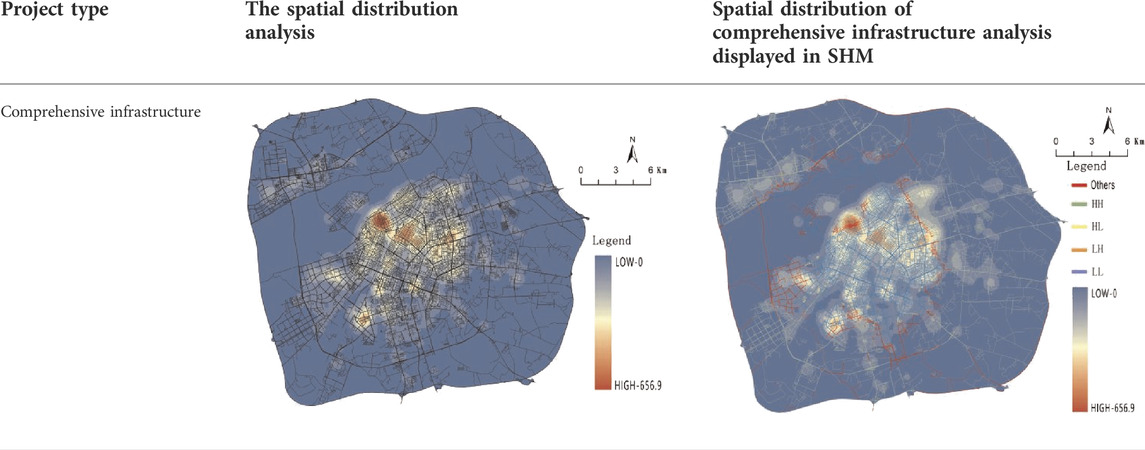
TABLE 9. Spatial distribution of comprehensive infrastructure in SHM.
3.5 Experimental result 5: analysis of population concentration in the main urban area of Harbin
The sign-in data of Tik Tok in the Harbin MUA mainly provides the analysis of urban population agglomeration, which is obtained by nuclear density analysis according to the sign-in location and number. The sign-in position mainly reflects the urban space distribution being selected by people. The quality of sign-in reflects the number of times that urban space is selected, which can objectively reflect the urban vitality.
The spatial selection of Harbin MUA is measured by nuclear density analysis through GIS and the sign-in position of the “Tik Tok” APP data. It could be found that in SHM, the attractiveness of the city space was mainly distributed in the core circle layer, the transition circle layer, and its surroundings, among which, it was mainly concentrated in the highlighted area A, as shown in Table 10.
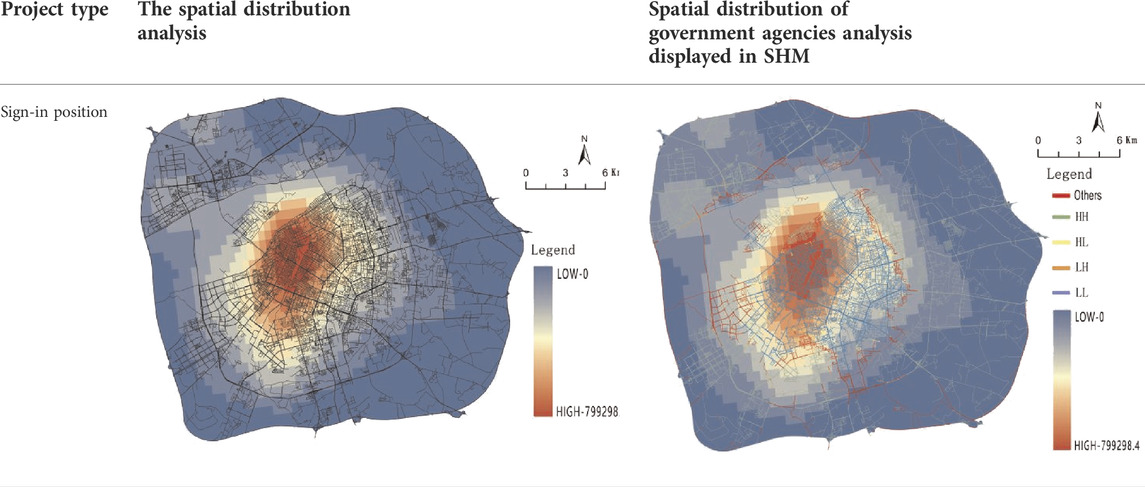
TABLE 10. Spatial distribution of sign-in position in SHM.
Through nuclear density, analyzing the spatial distribution of “Tik Tok” APP sign-in volume in the main urban area of Harbin is measured. In SHM, it could be found that urban vitality was concentrated in prominent area A and prominent area B. Moreover, urban vitality mainly was distributed in the inner and adjacent areas of the urban core circle layer and transition circle layer. In addition, new hot spots were formed in the east of the peripheral circle layer, as shown in Table 11.
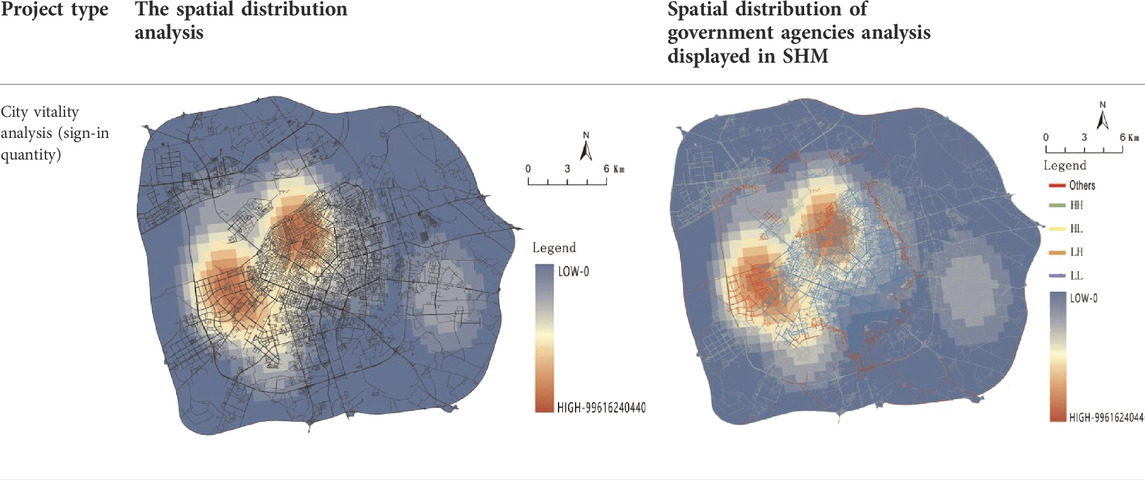
TABLE 11. Spatial distribution of sign-in quantity in SHM.
4 Discussion
The findings of this study establish a city model (SHM) to identify the spatial heterogeneity, through the method of “Spatial essential attribute—Spatial autocorrelation analysis—Establishment of urban model”. Next, we will discuss the practical effects, advantages, limitations, and application scope of SHM.
4.1 Recognition effect and application area of the spatial heterogeneity model
Taking Harbin MUA as an example, this study use SHM to get the spatial heterogeneity of the ‘core circle layer, transition circle layer, and peripheral circle layer’ and ‘highlighting area A + highlighting area B’ area structure in Harbin. Then, the spatial distribution of infrastructure and population aggregation are analyzed through kernel density, and the actual effect of SHM is analyzed. We find that the regional structure of SHM is ineffective in dividing the spatial heterogeneity of education and greening facilities. Fortunately, in terms of government agencies, transportation, commerce, companies and enterprises, housing, comprehensive infrastructure, and population agglomeration, SHM is effective in identifying spatial heterogeneity. Therefore, SHM can divide the spatial heterogeneity of urban facility distribution, urban population agglomeration, and urban spatial attractiveness.
SHM can be applied to urban planning and research, geographical science, urban morphology, urban environmental science, urban surveying and mapping, urban disaster prevention, urban economy, and other fields. This study is a new application of spatial syntax.
4.2 Advantages of the spatial heterogeneity model
This section describes the six advantages of SHM:
1) The application of SHM to spatial topological values provides a new application field for the study of spatial syntax. In the application of conventional spatial syntax to identify spatial heterogeneity and spatial boundaries, the extreme value of the spatial essential attribute is preferred, while the role of general value is ignored. SHM makes full use of all the analysis results of spatial syntax and provides a new idea for spatial heterogeneity recognition.
2) In identifying the spatial heterogeneity in urban built-up areas, compared with the theory of urban concentrated zone (proposed by E.·W.·Burgess) and the sector theory (proposed by H.·Hoyt), SHM is more in line with the current urban situation, and the divided urban areas have a scientific basis.
3) Spatial identification methods such as the soil and water assessment tool (SWAT) model, ecosystem services, and tradeoffs (invest) do not value the internal differences of spatial areas, so suitable for application in rough and non-urbanized areas. SHM predominates over them in the identification of urban regional heterogeneity.
4) Compared with the fragmented partitions identified by the least squares (OLS) model, the spatial quantitative expression (SQR) model, and the geographically weighted quantitative expression (GWQR) model, the spatial partitions divided by SHM are more complete and conducive to planning and design.
5) In terms of identifying space boundary, the spatial economic model, kernel density estimation, standard deviational ellipses, DEM, and other models identify smooth circles or ellipses, which do not conform to the actual situation of urban built-up areas, so SHM has more advantages in boundary recognition.
6) Compared with other models that need to establish comprehensive indicators first, SHM only needs road network characteristics, which is more convenient and effective in identifying urban population agglomeration and infrastructure (excluding education and greening facilities).
4.3 Shortcomings of the spatial heterogeneity model
Although this experiment had achieved good results in the exploration of new methods for identifying urban built-up areas, there were still some shortcomings:
1) This experiment was only a verification and exploration of a single city in the main urban area (MUA) of Harbin. Therefore, it will be necessary to carry out the same experimental verification on a variety of cities with other road network structures and similar cities to ensure the reliability of the experimental conclusions.
2) Because SHM identifies urban spatial heterogeneity according to the characteristics of the road network, it has a certain lag in time. However, in the stage of urban planning and design, SHM can be used as one of the quantitative judgment tools of urban design to assist urban planning.
3) SHM fails to identify the education of urban space and the imbalance of green infrastructure, so it cannot be used to judge the spatial heterogeneity of education and green infrastructure in urban areas.
4) At present, SHM is only applicable to urban built-up areas, not to rural and wilderness areas lacking a road network.
5 Conclusion
First, the study reviewed the fluidity and networking of urban network structure. Second, three basic problems in the study of urban network space were proposed, which were the urban regional identification, the heterogeneity of space, and urban boundaries. Third, by thinking about the essential attributes of urban space, this study proposed a new identification model of SHM based on “Spatial essential attribute—Spatial autocorrelation analysis—Establishment of urban model”. Finally, the verification and analysis of urban infrastructure data and mobile phone signaling card data, discuss the practical effects, advantages, limitations, and application scope of SHM.
This kind of experimental operation and verification operation provided a new theoretical approach for the identification of SHM of MUA. This access is a new, accurate, maneuverable, and scientific method that saves money and manpower. This method enhanced the traditional method of arbitrarily determining spatial boundaries and areas according to people’s subjective wishes in planning and construction. The implementation of this new model is convenient for relevant practitioners and scholars to execute urban planning and construction, urban analysis, urban protection, and urban management in the urban built-up area. In addition, the new recognition method provides a new reference for the application of space syntax in urban spatial region recognition.
Data availability statement
The original contributions presented in the study are included in the article/supplementary material; further inquiries can be directed to the corresponding author.
Author contributions
MS and QM contributed to the conception and design of the study. MS organized the database. QM performed the statistical analysis. MS wrote the first draft of the manuscript. QM wrote sections of the manuscript. All authors contributed to manuscript revision and read and approved the submitted version.
Funding
This work was supported by the 2021 Key Project of Education Science Planning, Heilongjiang, China (Project Number GJB1421230), and the Opening Fund of Key Laboratory of Interactive Media Design and Equipment Service Innovation, Ministry of Culture and Tourism, China (Project Number 2020+11).
Acknowledgments
The authors also thank Professor Long Ying and Shang Jin for providing feedback on the research. They thank all reviewers and editors for their time and efforts.
Conflict of interest
The reviewer PC declared a shared affiliation with the authors to the handling editor at the time of review.
The authors declare that the research was conducted in the absence of any commercial or financial relationships that could be construed as a potential conflict of interest.
Publisher’s note
All claims expressed in this article are solely those of the authors and do not necessarily represent those of their affiliated organizations, or those of the publisher, the editors, and the reviewers. Any product that may be evaluated in this article, or claim that may be made by its manufacturer, is not guaranteed or endorsed by the publisher.
References
Ahmadi, S., Zoej, M. J. V., Ebadi, H., Moghaddam, H. A., and Mohammadzadeh, A. (2010). Automatic urban building boundary extraction from high resolution aerial images using an innovative model of active contours. Int. J. Appl. Earth Observation Geoinformation 12 (3), 150–157. doi:10.1016/j.jag.2010.02.001
Alexander, C. (2015). A city is not a tree: 50th anniversary edition. Berkeley, CA: Sustasis Press and Center for Environmental Structure.
Brown, M., and Quinn, J. (2019). Zoning does not improve the availability of ecosystem services in urban watersheds. A case study from Upstate South Carolina, USA. Ecosyst. Serv. 34 (B), 254–265. doi:10.1016/j.ecoser.2018.04.009
Castells, M. (1996). The rise of the network society (the information age): Economy, society and culture. New Jersey: Wiley-Blackwell.
Chai, Y. W., Li, C. J., and Zhang, Y., and 1. College of Urban and Environmental Sciences, Peking University, Beijing 100871, China2. Institute of Beijing Studies, Beijing Union University, Beijing 100191, China. (2020). A new time-geography research framework of community life circle. Prog. Geogr. 39 (12), 1961–1971. doi:10.18306/dlkxjz.2020.12.001
Chen, Y., Shuai, J. B., Zhang, Z., Shi, P., and Tao, F. (2014). Simulating the impact of watershed management for surface water quality protection: A case study on reducing inorganic nitrogen load at a watershed scale. Ecol. Eng. 62 (1), 61–70. doi:10.1016/j.ecoleng.2013.10.023
Chun, H., Wang, N., and Liu, Y. X. (2021). Disaster prevention route planning of Fenglin ancient village based on space syntax analysis. IOP Conf. Ser. Earth Environ. Sci. 781 (3), 032009. doi:10.1088/1755-1315/781/3/032009
Cui, P., Dai, C. Y., and Zhang, J. (2022). Assessing the effects of urban morphology parameters on PM2.5 distribution in northeast China based on gradient boosted regression trees method. Sustainability 14 (5), 2618. doi:10.3390/su14052618
Du, Y., Qin, B., Zhao, C., Zhu, Y., Cao, J., and Ji, Y. (2021). A novel spatio-temporal synchronization method of roadside asynchronous MMW radar-camera for sensor fusion. IEEE Trans. Intell. Transp. Syst., 1–12. doi:10.1109/TITS.2021.3119079
Fei, D., Chen, Q., Mao, X., Liu, F., and Zhou, Q. (2017). Land use zoning using a coupled gridding-self-organizing feature maps method: A case study in China. J. Clean. Prod. 161, 1162–1170. doi:10.1016/j.jclepro.2017.05.028
Gu, Y. L., and You, X. Y. (2022). A spatial quantile regression model for driving mechanism of urban heat island by considering the spatial dependence and heterogeneity: An example of Beijing, China. Sustain. Cities Soc. 79, 103692. doi:10.1016/j.scs.2022.103692
Guo, K. X., and Cao, Y. X. (2021). Application of planning evaluation of historical block based on space syntax —— Case study: Third streets and two alleys historical block, nanning. IOP Conf. Ser. Earth Environ. Sci. 768 (1), 012139. doi:10.1088/1755-1315/768/1/012139
Hillier, B., and Zhao, B. (1985). Space syntax: A new view of the city. New Archit. 1985 (01), 62–72.
Hou, Y. C., Han, J., and Liu, Y. Z., (2010). International experience and enlightenment on the demarcation of urban and rural spatial boundaries. China Dev. Obs. (7), 54–57.
Hu, H. F., Zhai, M. W., and Feng, Z. X., (2014). The division of urban economic regions based on urban flow and equal time interval transportation circle. J. Northeast Normal Univ. Nat. Sci. Ed. 46 (1), 143–149.
Ke, X. L., Wang, X. Y., Guo, H. X., Yang, C., Zhou, Q., and Mougharbel, A. (2021). Urban ecological security evaluation and spatial correlation research——Based on data analysis of 16 cities in hubei Province of China. J. Clean. Prod. 311, 127613. doi:10.1016/j.jclepro.2021.127613
Li, B., Tong, D., Wu, Y., and Li, G. (2021). Government-backed ‘laundering of the grey’ in upgrading urban village properties. Prog. Plan. 146, 100436. doi:10.1016/j.progress.2019.100436
Li, B., Yang, J., Yang, Y., Li, C., and Zhang, Y. (2021). Sign language/gesture recognition based on cumulative distribution density features using UWB radar. IEEE Trans. Instrum. Meas. 70, 1–13. doi:10.1109/tim.2021.3092072
Li, H. J., Liu, Y. L., Tan, R. H., and Qiu, L. (2015). A new algorithm of urban built-up area boundary extraction based on high-resolution panchromatic image. Bull. Surv. Mapp. 2015 (07), 36–41.doi:10.13474/j.cnki.11-2246.2015.0206
Li, X. Y., Zheng, X. Q., and Yan, H. W. (2004). On spatial clustering of combination of coordinate and attribute. Geogr. Geo-Information Sci. 2004 (02), 38–40.
Li, Y., Che, P., Liu, C., Wu, D., and Du, Y. (2021). Cross‐scene pavement distress detection by a novel transfer learning framework. Computer‐Aided. Civ. Infrastructure Eng. 36 (11), 1398–1415. doi:10.1111/mice.12674
Li, Y., Du, L., and Wei, D. (2022). Multiscale CNN based on component analysis for SAR ATR. IEEE Trans. Geosci. Remote Sens. 60, 1–12. doi:10.1109/tgrs.2021.3100137
Liao, P., Gu, N., Yu, R., and Brisbin, C. (2021). Exploring the spatial pattern of historic Chinese towns and cities: A syntactical approach. Front. Archit. Res. 10 (3), 598–613. doi:10.1016/j.foar.2021.04.002
Liu, C. C. (2020). Community grid management against the background of corona virus disease 2019 prevention and control. J. Jiangnan Univ. Humanit. Soc. Sci. 19 (2), 5–13.
Liu, C., Wu, D., Li, Y., and Du, Y. (2021). Large-scale pavement roughness measurements with vehicle crowdsourced data using semi-supervised learning. Transp. Res. Part C Emerg. Technol. 125, 103048. doi:10.1016/j.trc.2021.103048
Liu, F., Gao, F., Yang, L. C., Han, C., Hao, W., and Tang, J. (2022). Exploring the spatially heterogeneous effect of the built environment on ride-hailing travel demand: A geographically weighted quantile regression model. Travel Behav. Soc. 29, 22–33. doi:10.1016/j.tbs.2022.05.004
Liu, H., Shi, Z., Li, J., Liu, C., Meng, X., and Du, Y., (2021). Detection of road cavities in urban cities by 3D ground-penetrating radar. Geophysics 86 (3), A25–A33. doi:10.1190/geo2020-0384.1
Liu, X. J., and Long, Y. (2016). Automated identification and characterization of parcels with OpenStreetMap and points of interest. Environ. Plann. B. Plann. Des. 43 (2), 341–360. doi:10.1177/0265813515604767
Liu, X., Sheng, Q., and Yang, Z. S. (2017). Influence of pedestrian accessibility on street space activity and communication. Shanghai Urban Plan. Rev. 2017 (01), 56–61.
Liu, Y., Zhang, K., Li, Z., Liu, Z., Wang, J., and Huang, P. (2020). A hybrid runoff generation modelling framework based on spatial combination of three runoff generation schemes for semi-humid and semi-arid watersheds. J. Hydrology 590, 125440. doi:10.1016/j.jhydrol.2020.125440
Liu, Y., and Zhou, Y. (2021). Territory spatial planning and national governance system in China. Land Use Policy 102, 105288. doi:10.1016/j.landusepol.2021.105288
Luo, W., Kuang, Y. Q., and Zhou, M. D., (2021). Research on the influence of functional diversity of business district on its vitality: A case study of guangzhou. J. Geo-information Sci. 23 (7), 1259–1271.
Rodriguez, G., Alday, J. G., and Onaindia, M. (2015). Multiple ecosystem services landscape index: A tool for multifunctional landscapes conservation. J. Environ. Manag. 147, 152–163. doi:10.1016/j.jenvman.2014.09.001
Rybski, D., Arcaute, E., and Batty, M. (2019). Urban scaling laws. Environ. Plan. B Urban Anal. City Sci. 46 (9), 1605–1610. doi:10.1177/2399808319886125
Shi, Y., Li, T., and Yang, J. Y. (2021). Research on urban waterfront space vitality based on mobile phone signaling data — A case study of jinji lake in suzhou. Landsc. Archit. 28 (1), 31–38.
Shi, Y. S., Tao, T. H., Cao, X. Y., and Pei, X. (2021). The association between spatial attributes and neighborhood characteristics based on Meituan take-out data: Evidence from shanghai business circles. J. Retail. Consumer Serv. 58, 102302. doi:10.1016/j.jretconser.2020.102302
Tannier, C., Thomas, I., Vuidel, G., and Frankhauser, P. (2011). A fractal approach to identifying urban boundaries. Geogr. Anal. 43 (2), 211–227. doi:10.1111/j.1538-4632.2011.00814.x
Vaughan, L. (2007). The spatial syntax of urban segregation. Prog. Plan. 67 (3), 205–294. doi:10.1016/j.progress.2007.03.001
Wang, L. S. (2017). Flow and form: Formation mechanism of the space development of urban center in metropolitan periphery area and its control measures. China. Tianjin University.
West, G. (2017). Scale: The universal laws of growth, innovation, sustainability, and the pace of life in organisms, cities, economies, and companies. New York: Penguin Press.
Xia, C., Zhang, A. Q., Wang, H. J., and Yeh, A. G. (2019). Predicting the expansion of urban boundary using space syntax and multivariate regression model. Habitat Int. 86, 126–134. doi:10.1016/j.habitatint.2019.03.001
Xu, H., Zhao, H. S., and Liu, F. (2016). Preliminary study in syntactical of the spatial form of traditional villages: A case study of jiangshan hejia-wujia village in guchen town, gaochun county, nanjing. Mod. Urban Res. 1, 24–29.
Xu, Z. N., and Gao, X. L. (2016). A novel method for identifying the boundary of urban built-up areas with POI data. Acta Geogr. Sin. 71 (6), 928–939. doi:10.11821/dlxb201606003
Yan, S. Q., Zhan, Q. M., and Fan, Y. L. (2021). Spatial expansion of Wuhan metropolitan built up areas and their driving factors based on nighttime light data. J. Geomatics 46 (5), 71–77. doi:10.3390/ijerph19073760
Yao, J. L., Wang, H., and Hu, B. (2016). Urban built-up area extraction based on vector data. Bull. Surv. Mapp. 2016 (05), 84–87. doi:10.23953/cloud.ijarsg.67
Ye, J. Y. (1985). A brief introduction to foreign theories of urban spatial structure. Foreign Econ. Manag. 1985 (06), 22–24. doi:10.16538/j.cnki.fem.1985.06.011
Yin, L., Wang, L., Keim, B. D., Konsoer, K., and Zheng, W. (2022). Wavelet analysis of dam injection and discharge in three gorges dam and reservoir with precipitation and river discharge. Water 14 (4), 567. doi:10.3390/w14040567
Zerouati, W., and Bellal, T. (2020). Evaluating the impact of mass housings' in-between spaces' spatial configuration on users' social interaction. Front. Archit. Res. 9 (1), 34–53. doi:10.1016/j.foar.2019.05.005
Zhang, J., Cui, P., and Song, H. (2020). Impact of urban morphology on outdoor air temperature and microclimate optimization strategy base on Pareto optimality in northeast China. Build. Environ. 180 (1101), 107035. doi:10.1016/j.buildenv.2020.107035
Zhang, X. H., Liu, J. P., Chen, D., and Wang, Y. (2019). A habitation coarse matching method using seeded trees index under road network constraints. Sci. Surv. Mapp. 44 (2), 56–62+82.
Zhao, C., Liao, F., Li, X., and Du, Y. (2021). Macroscopic modeling and dynamic control of on-street cruising-for-parking of autonomous vehicles in a multi-region urban road network. Transp. Res. Part C Emerg. Technol. 128, 103176. doi:10.1016/j.trc.2021.103176
Keywords: spatial heterogeneity, spatial recognition, computational clustering, space syntax, GIS
Citation: Sun M and Meng Q (2022) Using spatial syntax and GIS to identify spatial heterogeneity in the main urban area of Harbin, China. Front. Earth Sci. 10:893414. doi: 10.3389/feart.2022.893414
Received: 10 March 2022; Accepted: 29 June 2022;
Published: 09 August 2022.
Edited by:
Juergen Pilz, University of Klagenfurt, AustriaReviewed by:
Ionut Cristi Nicu, Norwegian Institute for Cultural Heritage Research, NorwayPeng Cui, Northeast Forestry University, China
Enjia Zhang, Tsinghua University, China
Copyright © 2022 Sun and Meng. This is an open-access article distributed under the terms of the Creative Commons Attribution License (CC BY). The use, distribution or reproduction in other forums is permitted, provided the original author(s) and the copyright owner(s) are credited and that the original publication in this journal is cited, in accordance with accepted academic practice. No use, distribution or reproduction is permitted which does not comply with these terms.
*Correspondence: Qingxiang Meng, bXF4LTE5OTdAbmVmdS5lZHUuY24=