 Qiang Ma1
 Huijun Jin1,2,3*
 Qingbai Wu1*
 Yuzhong Yang1
 Qingfeng Wang1
 Dongliang Luo1
 Yadong Huang1
 Yan Li1
 Xiaoying Li3
 Raul D. Serban4
 Sihai Liang5
 Shuhui Gao1,6
 Sergey S. Marchenko1,7
- 1State Key Laboratory of Frozen Soil Engineering, Northwest Institute of Eco-Environment and Resources, Chinese Academy of Sciences, Lanzhou, China
- 2School of Civil Engineering, Ministry of Education Observational and Research Station of Permafrost Geo-Environment in Northeast China, Institute of Cold-Regions Science and Engineering, Northeast Forestry University, Harbin, China
- 3Key Laboratory of Sustainable Forest Ecosystem Management-Ministry of Education, School of Forestry, Northeast Forestry University, Harbin, China
- 4Institute for Alpine Environment, Eurac Research, Bolzano, Italy
- 5School of Water Resources and Environment, China University of Geosciences, Beijing, China
- 6School of Civil Engineering, Lanzhou Jiaotong University, Lanzhou, China
- 7Geophysical Institute, University of Alaska Fairbanks, Fairbanks, AK, United States
Dissolved organic carbon (DOC) is the main participant in carbon cycles through water pathways. Recent studies have highlighted the roles of aquatic systems in landscape and watershed carbon budgets. This study is based on 261 samples collected between 2016 and 2017, from individual water types (e.g., river/stream, lake/pond, icing/spring, snow/rain, groundwater/ice, and others) in the source area of the Yellow River (SAYR). These samples were analyzed for examining the distributive features of DOC in aquatic systems, especially in relation to environmental factors. It shows that: 1) DOC concentrations in permafrost-related waters (7.2–234.4 mg C·L−1) were often the highest among all aquatic DOC sources (lakes/ponds: 21.3 ± 34.1 mg C·L−1, rivers/streams: 4.3 ± 3.7 mg C·L−1, and groundwater: 1.8 ± 1.4 mg C·L−1); 2) the seasonality of riverine DOC showed declining features in 2016 and high in summer/autumn, followed by a spring freshet in 2017, and a close association with intra-annual precipitation modes; 3) the main controls of aquatic DOC are permafrost presence, precipitation, and NDVI, and they contribute to 38% of variances of environmental variables in affecting variations in aquatic DOC in the SAYR; and 4) a literature review on biodegradable DOC (BDOC) of varied aquatic DOC pools indicates the highest DOC concentrations (48–1,548 mg C·L−1) and BDOC (23–71%) of ground-ice meltwater. Thus, we suggest that in the SAYR, permafrost dynamics dominate aquatic DOC distribution, and permafrost thaw may alter aquatic DOC budgets, eventually becoming an additional source for atmospheric carbon emissions.
1 Introduction
Soils in permafrost regions store ∼60% organic carbon all over the globe, despite the limited areal extents of permafrost occupying less than 15% of currently exposed global land area (Hugelius et al., 2014; Schuur et al., 2015). Permafrost regions are globally important organic carbon reservoirs and play a key role in global carbon cycling (Schuur et al., 2008; Strauss et al., 2017; Jin and Ma, 2021). The Qinghai–Tibet Plateau (QTP) is underlain by the most extensive alpine and plateau permafrost (1.15 × 10⁶ km2) in the world, and the warm and thin high-elevational permafrost is very sensitive to climate change (Ran et al., 2020).
Aquatic ecosystems are important pathways of carbon cycling in permafrost regions (Frey and McClelland, 2009). Dissolved organic carbon (DOC) is the major organic carbon pool in aquatic ecosystems and an active participant in freshwater ecology, biogeochemistry, and carbon cycles in permafrost regions through lateral pathways (Hope et al., 1994; Eimers et al., 2008). Under a warming climate, DOC dynamics in aquatic systems (e.g., rivers/streams, lakes/ponds, groundwater, among many others) have been substantially shifted and have been frequently reported in permafrost regions (Schindler et al., 1997; Vonk et al., 2015a; Tank et al., 2016; Ma, 2020). A multi-decadal observation (1972–2012) of in-stream DOC dynamics in the Mackenzie River basin reported a general increasing trend of DOC flux (+39.9%) at the outlet and suggests the important roles of permafrost thaw in DOC fluxes according to seasonal and sub-catchment trends (Tank et al., 2016). Climate change, droughts, and forest fires have already caused a 15–20% decrease in DOC concentrations in boreal lakes, northeastern Ontario (Schindler et al., 1997). Thermokarst lakes formed by the thawing of ice-rich permafrost are generally characterized by high DOC concentrations (Shirokova et al., 2013; Matheus Carnevali et al., 2015; Matveev et al., 2016; Mu et al., 2016). Groundwater is projected to become an increasing source of freshwater and DOC to the Arctic Basin as permafrost thaws (Connolly et al., 2020). However, the distributive features of DOC in aquatic systems and individual water types (rivers/streams, lakes/ponds, groundwater, and others) are less investigated in permafrost regions, especially on the QTP.
Aquatic organic carbon pools are also sources of atmospheric carbon emissions (Cole et al., 2007; Serikova et al., 2018; Dean et al., 2020; Zhang et al., 2020; Rosentreter et al., 2021). Half of the global methane emissions originate from aquatic ecosystems, such as those in lakes/ponds, reservoirs, rivers/streams, wetlands, coastal regions, and oceans, among many others (Rosentreter et al., 2021). The Arctic, on average with a 16% areal extent of water bodies in all landscapes (Vonk et al., 2015a), may become a region of net carbon emission under a warming climate (Serikova et al., 2018). The QTP is also a water-abundant domain, originating from 13 major rivers in Eastern and Southern Asia (e.g., Yellow, Yangtze, and Mekong rivers), annually discharging about 6.56 trillion m3 (6,560 km3) of water, or 13% of global total annual discharge (Wang et al., 2021). In-stream average methane emission rates from the eastern QTP were also reported as high as 11.9 mmol CH4·m−2·d−1, six times higher than the concurrent global average (Zhang et al., 2020). Therefore, aquatic DOC pools are potentially important sources for atmospheric carbon emissions.
Extensively (34% of the areal extent of the catchment) underlain by permafrost, the source area of the Yellow River (SAYR) above the Tanag hydrological station on northeastern QTP presents various water types, such as rivers/streams, tectonic and thermokarst lakes, wetlands, icings, and springs. Aquatic systems are crucial pathways for regional carbon budgets, while distributive features of aquatic DOC and its regulators have been seldomly systematically explored. In this study, a total of 261 water samples from various waters across the SAYR were collected and analyzed for investigating the distribution of DOC concentrations in aquatic systems. Then, by employing principal component analysis (PCA), influencing environmental factors of DOC concentrations in individual water types are examined. In the end, by synthesizing globally published data on biodegradable DOC in varied water types, the release potentials of aquatic DOC to the atmosphere are briefly discussed.
2 Study Area and Methods
2.1 Study Area
The SAYR (32.2°–36.1°N, 95.9°–103.4°E; 2,629–6,235 m a. s. l.) is the up-reach catchment of the Yellow River basin above the Tanag hydrological station (35.5˚N, 100.2˚E; 2,629 m a. s. l.), on the northeastern QTP, China (Figure 1), covering an area of 1.212 × 10⁵ km2. The climate in the SAYR is characterized by long winters (November–April) and short summers (June–August). Mean annual air temperature (MAAT) and annual precipitation in the SAYR are 0.2°C and 507.7 mm (1960–2012), respectively (Lan et al., 2013). The climate in the up-reach SAYR above the Huanghe’yan hydrological station (34.9°N, 98.2°E; 4,215 m a. s. l.) is characterized by a dry–cold climate with a MAAT less than −3.5°C and annual precipitation of 300–400 mm (Jin et al., 2010). The growing season varies with elevation but mainly concentrates from May to September. With an areal extent of permafrost at 34% in the SAYR, permafrost occurs extensively (86%) in the up-reach SAYR, with rich manifestations in periglacial landforms and MAAT (1961–2019) varying from −3.5 to about 0°C. Alpine permafrost can be as thick as up to about 360 m on very high mountain tops on the peak of Mt. Maqên Gangri (6,235 m a. s. l.) in the Anye Maqên Mountains (Wang and French, 1995; Jin et al., 2009, 2020; Luo et al., 2020; Sheng et al., 2020). The lower reaches/basins of the SAYR between Huanghe’yan and Tanag hydrological stations are dominated by a relatively warm–wet climate, particularly in the southeastern SAYR (mainly on the Zoîgé Peat Plateau), where MAAT is at about 7.5°C and annual precipitation, about 654 mm (Yu et al., 2017). The snow-melt season generally extends from April to October in the lower reaches/basins of the SAYR. Glaciers are minimally presented in the SAYR (mainly in the Anye Maqên Mountains) (126.7 km2), or 2% of the SAYR in the areal extent (Blue et al., 2013; Jin et al., 2019).
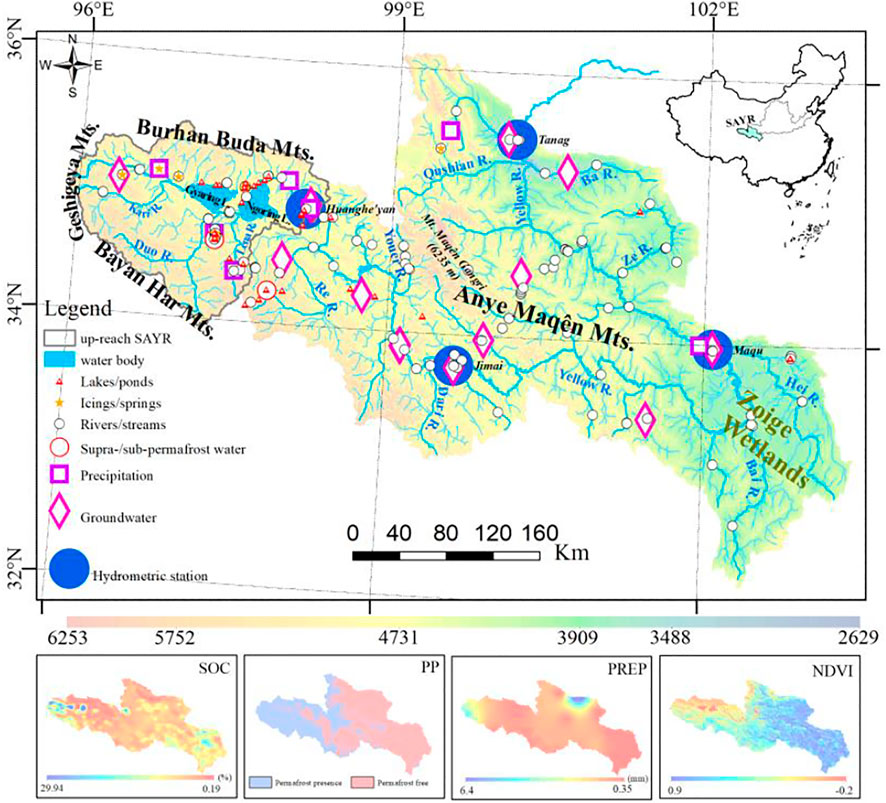
FIGURE 1. Map of sampling locations in the source area of the Yellow River (SAYR) on the northeastern Qinghai–Tibet Plateau, SW China. Notes: Sub-panel SOC shows the spatial distribution of soil organic carbon (SOC) content; sub-panel PP shows the distribution of permafrost presence; sub-panel PREP is the distribution of daily precipitation on 12 August 2016; and sub-panel NDVI is the normalized difference vegetation index on 12 August 2016.
The SAYR is characterized by a high-mountain surrounded by flat valleys and plains. The baseflow accounts for a large portion of annual streamflow (∼50% or more) (Ma et al., 2019a). Numerous meandering rivers in the valleys on the Zoîgé Peat Plateau, which are conducive to water conservancy, in addition to rich precipitation, have facilitated the accumulation of thick peat layers (0.5∼10.5 m) in the Holocene (mainly since 11.7 ka B.P.), particularly in the Megathermal period in the mid-Holocene at 8.5–4.0 ka B. P. (Yu et al., 2017; Jin et al., 2019, 2020). Alpine steppes and alpine meadows dominate alpine vegetation in the up-reach SAYR and the lower reaches/basins of SAYR; The SAYR is sporadically dotted with shrubs and forests at lower elevations. In alpine wetlands on the Zoîgé Peat Plateau, aquatic vegetation (e.g., Kobresia pygmaea and K. tibetica) is extensively observed (Brierley et al., 2016).
2.2 Methods
2.2.1 Sample Collection and Laboratory Analyses
The field data were collected from April 2016 to December 2017 in rivers/streams, lakes/ponds, commercial wells, precipitation, aufeis, and springs in the SAYR (Figure 1). A total of 261 water samples were collected during the sampling periods. The river/stream samples were mainly collected in the up-reach SAYR, such as the mainstream Yellow River and its tributaries (Kari Qu, Duo Qu, Lena Qu, Ze Qu, You’er Qu, and Hei’he and Bai’he rivers on the Zoîgé Peat Plateau) in the snow-melt season (April–May), summer–autumn season (July–October), and the freezing season (November–next March). The water samples of lakes/ponds were collected from thermokarst lakes, large-size tectonic lakes (e.g., Gyaring and Ngoring lakes), and lakes on the Zoîgé Plateau, among many others. Groundwater samples were collected from multiple commercial wells in villages and towns across the SAYR. A borehole was drilled on the northern shore of the Wanlong Worma Lake to the south of Ngöring Lake in the up-reach SAYR and the samples of supra- and sub-permafrost waters were collected during the field-work season of 29 April to 2 May 2017. In the lower reaches/basins of SAYR, a 25-m-deep borehole was drilled on 22 October 2017 near Maqu County, and the water samples were collected and labeled as phreatic groundwater. Precipitation samples were collected in both solid precipitation (snow/hail) and rain. Aufeis/icings were mainly collected in the up-reach SAYR in the winter of 2016 and 2017 (Figure 2). Detailed information on water sampling is provided in Table S1.
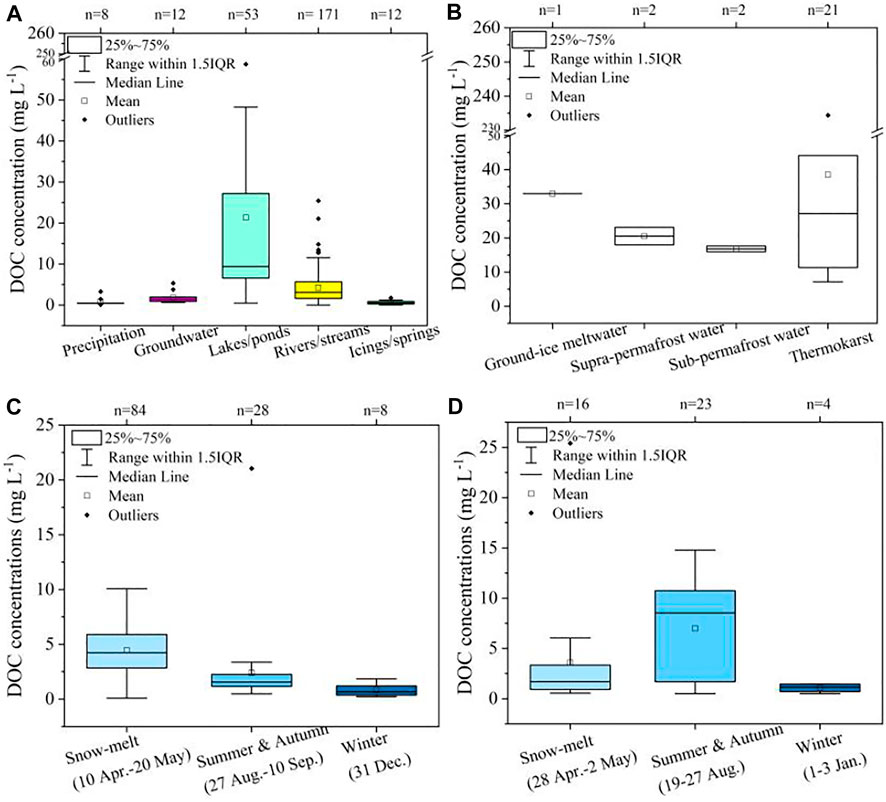
FIGURE 2. Dissolved organic carbon concentrations (mg C·L−1) in aquatic systems in the source area of the Yellow River (SAYR) above the Tanag hydrological station in Qinghai Province, SW China. Notes: “n” indicates the number of field samples. (A) DOC concentrations in individual water type (hail/snow/rain, groundwater, lakes/ponds, river/stream, and icing/spring); (B) permafrost-related aquatic DOC concentrations; (C) seasonal variations of in-stream DOC concentrations in 2016; (D) seasonal variations of in-stream DOC concentrations in 2017.
The water samples were taken to the State Key Laboratory of Frozen Soils Engineering, Lanzhou, China, after collection and kept at 4°C before laboratory pre-processing and analyses. The water samples were first filtered through the mixed cellulose ester (MCE) filters (0.45 µm pore size), and the content of DOC was determined using a total organic carbon analyzer (TOC analyzer, I. O. Corporation; precision: ± 0.5‰).
2.2.2 Statistical Analyses
To evaluate the environmental controllers for aquatic DOC concentrations, we employed the principal component analysis (PCA) (Kotz and Nadarajah, 2004). The presence of permafrost, SOC content, normalized difference vegetation index (NDVI), and precipitation were taken as the environmental controllers for aquatic DOC concentrations (Figure 1). Data information and sources are presented in Table 1.
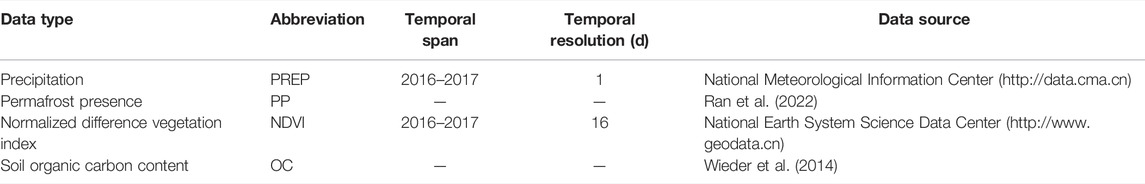
TABLE 1. List of environmental controllers for aquatic DOC concentrations in the source area of the Yellow River (SAYR) above the Tanag hydrological station in Qinghai Province, Southwest China.
Daily precipitation data were measured using the Chinese standard precipitation gauge without discriminating between liquid and solid precipitation forms. An error validation (wetting and evaporation losses, trace precipitation, and wind) was implemented for liquid and solid precipitation forms, respectively, by employing daily air temperature and wind speed data (Ye et al., 2004; Yang et al., 2005). The validated daily precipitation was then interpolated using the empirical Bayesian kriging method to obtain the spatial distribution of daily precipitation in the SAYR. Winter precipitation was calculated by accumulating daily solid precipitation in winter. Spring precipitation was calculated by accumulating winter snowfall, due to spring freshet was mainly impacted by melting accumulated snow in winter (Ma et al., 2019a). The site-specific data of the environmental variables were extracted from spatial data at the sampling sites (Figure 1). PCA was used to summarize the rescaled variables (PREP, PP, SOC, and NDVI) by reducing the dimensionality of the data while retaining most of the variability in the dataset to determine impacting environmental variables at aquatic DOC sampling sites and to find linear relationships between environmental variables. All statistical analyses were implemented in the Origin Pro 2021b.
2.2.3 Literature Synthesis
A meta-analysis of results of both seasonally in-stream dynamics and concentrations of DOC in various water types was implemented to compare DOC concentrations in various water types in the SAYR with those in other alpine/high-plateau and northern/Arctic permafrost regions to have a comprehensive understanding of aquatic DOC distributions. A synthesis of published data on biodegradable DOC in various water types in northern permafrost regions, in combination with the distribution of aquatic DOC concentrations, was analyzed to determine the releasing potentials of aquatic DOC to atmospheric carbon emissions. DOC concentrations and BDOC data were gathered by synthesizing relevant studies on the ISI Web of ScienceTM, as well as previous compilations on DOC in permafrost regions and the biodegradability of aquatic DOC (such as Vonk et al., 2015b; Ma et al., 2019b). A total of 19 studies on DOC concentrations and aquatic BDOC with experimental data were referred (Finlay et al., 2006, 2009; Guo and Macdonald, 2006; Petrone et al., 2006; Holmes et al., 2008; Balcarczyk et al., 2009; O’Donnell et al., 2012; Wickland et al., 2012; Olefeldt and Roulet, 2014; Abbott et al., 2014; Vonk et al., 2013; Ewing et al., 2015; Mann et al., 2015; Mu et al., 2016; Selvam et al., 2017; Textor et al., 2019; Connolly et al., 2020; Payandi-Rolland et al., 2020; Chen et al., 2021; Stolpmann et al., 2021). Among these results, we collect DOC concentrations and BDOC in literature works by following the criteria, as: 1) located in the alpine (e.g., QTP) or Arctic permafrost regions, 2) ranges of DOC concentrations and BDOC were adopted, and 3) using incubation experiments or chemical proxies to access BDOC.
3 Results and Discussions
3.1 Patterned DOC Concentrations in Aquatic Systems in the SAYR
DOC concentrations in aquatic systems show strong variations among individual water types in the SAYR (Figure 2A). The highest DOC concentration was found in thermokarst lakes with an average of 38.4 ± 48.5 mg C·L−1 (n = 171 samples; data are expressed as average ± one standard deviation) and a maximum of 234.4 mg C·L−1. Permafrost-related water types showed similarly high DOC concentrations (ground-ice meltwater: 32.94 mg C·L−1, supra-permafrost water: 20.54 ± 3.6 mg C·L−1, and sub-permafrost water: 16.8 ± 1.2 mg C·L−1) (Figure 2B). Thermokarst lakes/ponds (21.3 ± 34.1 mg C·L−1) were characterized by almost five times higher average DOC concentrations than those of rivers/streams (4.3 ± 3.7 mg C·L−1) and with a wide DOC range of ∼0.5–234.4 mg C·L−1. Other water types (hail/snow/rain, springs/icings, and groundwater) had low average DOC concentrations between 0.8 ± 1.0 and 1.8 ± 1.4 mg C·L−1, and their ranges were much narrower than those lakes/ponds and rivers/streams (Table 2). There are marked seasonal variations in in-stream DOC concentrations in the SAYR. The SAYR-average of DOC concentrations in winter is generally lower than those in spring (snow-melt season), summer, and autumn. In 2016, the greatest in-stream DOC concentration (4.5 ± 2.2 mg C·L−1) occurred during the spring snow-melt season, and decreased into summer–autumn (2.4 ± 3.7 mg C·L−1), and winter (0.8 ± 0.6 mg C·L−1) (Figure 2C). In 2017, DOC concentrations were the greatest in summer–autumn (7.0 ± 4.8 mg C·L−1), with a range of 0.5–13.4 mg C·L−1, followed by those of the snow-melt season (3.6 ± 6.0 mg C·L−1) and the winter season (1.1 ± 0.5 mg C·L−1) (Figure 2D).
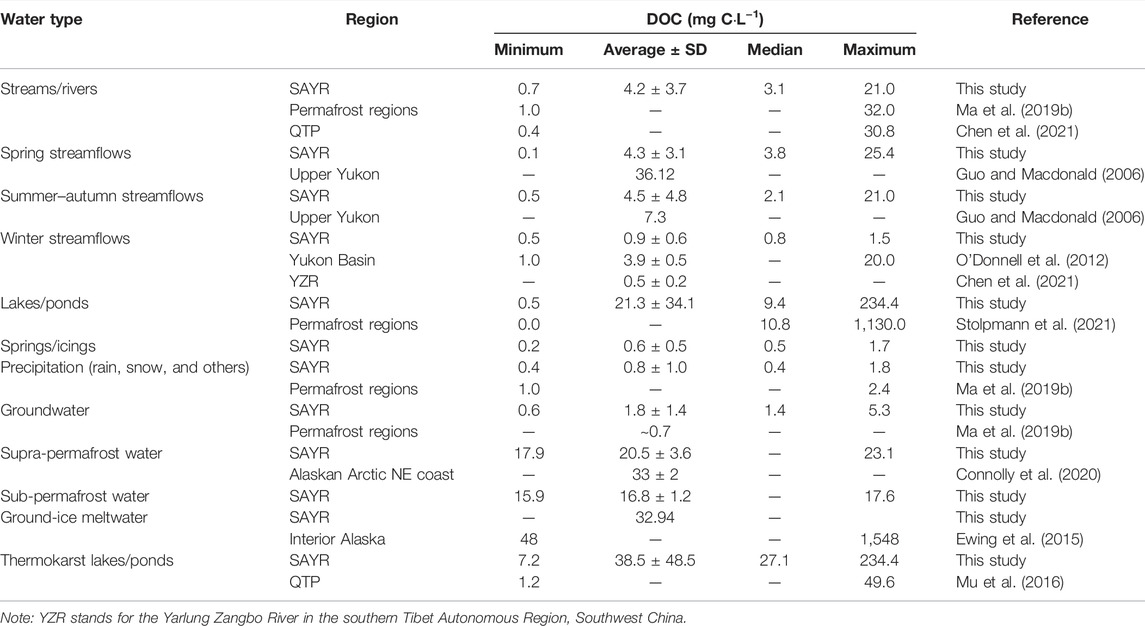
TABLE 2. List of minimum, average, median, and maximum values of dissolved organic carbon (DOC) concentrations in each water type in the source area of the Yellow River (SAYR) above the Tanag hydrological station in Qinghai Province, China.
In the SAYR, in-stream DOC concentrations are averaged at 4.2 ± 3.7 mg C·L−1, with a range of 0.7–21.0 mg C·L−1, comparable to DOC ranges in northern permafrost regions (1–32 mg C·L−1) and some other catchments on the QTP (0.4–30.8 mg C·L−1). In the SAYR, in-stream DOC concentrations were characterized by the greatest values (4.5 ± 2.2 mg C·L−1) during the spring snow-melt season, and decreased in summer–autumn (2.4 ± 3.7 mg C·L−1) and declined further in winter (0.8 ± 0.6 mg C·L−1) in 2016 (Figure 2C). In 2017, DOC concentrations were the greatest in summer–autumn (7.0 ± 4.8 mg C·L−1), followed by those in the snow-melt season (3.6 ± 6.0 mg C·L−1) and winter season (1.1 ± 0.5 mg C·L−1) (Figure 2D). In northern permafrost regions, such as the upper Yukon River Basin, seasonal DOC concentrations are characterized by the greatest average in-stream DOC (36.12 mg C·L−1) in the snow-melt season and decreased to that in summer–autumn (7.3 mg C·L−1) (Guo and Macdonald, 2006; Guo et al., 2018). It is generally proven that in-stream DOC concentrations are positively related with discharge. In the upper Yukon River, the yearly peak flow occurs in spring freshet and the discharge declines in the following seasons (Guo and Macdonald, 2006; Guo et al., 2018).
The Yellow River flow in the SAYR is dominated by the monsoonal climate and mainly recharged by summer precipitation from July to September. In 2017, the summer peak flow induced high in-stream DOC concentrations from July to September. However, in 2016, the SAYR underwent a dryer summer, and no peak flow was observed from July to September. Therefore, accumulated snowfall in winter merely induced a small spring freshet and relatively high snow-melt DOC concentrations. In winter, in-stream DOC concentrations in the SAYR were smaller than those in the summer–autumn and snow-melt season in both 2016 and 2017. They are consistent with those existing observations in northern permafrost regions. However, winter in-stream DOC concentrations in the SAYR (0.9 ± 0.6 mg C·L−1), comparable with those of the upper Yarlung Zangbo River (0.5 ± 0.2 mg C·L−1) on the southern Tibet Plateau, are smaller than those in northern permafrost regions (e.g., Yukon: 3.9 ± 0.5 mg C·L−1). Lacustrine DOC concentrations (0.5–234.4 mg C·L−1) in the SAYR are generally lower than those in northern permafrost regions (0–1,130 mg C·L−1), while comparable to those on the QTP (21.3 ± 34.1 mg C·L−1). DOC concentrations in the supra-permafrost water (20.5 ± 3.6 mg C·L−1) are higher than those in the sub-permafrost water (16.8 ± 1.2 mg C·L−1) (n = 4; north bank of the Wanlong Worma Lake in the Wanlong Worma River Basin of the Duo Qu River in the south-central SAYR). Along the Alaska Arctic coast, DOC concentrations of supra-permafrost water are reported as 33 ± 2 mg C·L−1 (Connolly et al., 2020), which is higher than those observed in the SAYR. DOC concentrations in ground-ice melt-water in the up-reach SAYR are much lower than those in northern permafrost regions, which may be resulted from the limited dataset. DOC concentrations in springs/icings waters, precipitation, and groundwater are generally low (∼1 mg C·L−1), with DOC in groundwater a bit higher than the other two water types.
3.2 Environmental Controllers for Aquatic DOC Concentrations in the SAYR
The site-specific data of environmental elements (PREP, NDVI, SOC, and PP) were extracted and the principle environmental controllers for aquatic DOC concentrations were examined by employing the standard PCA method. Data were binned into in-stream water samples collected in the snow-melt season, summer/autumn and winter, groundwater samples, lacustrine samples, and altogether binning of various aquatic samples for the PCAs (Table 3; Figure 3). In different water types, the sources and formations of DOC may differ, such as seasonally hydrological processes bringing in different DOC sources into streams/rivers. By binning environmental variables and DOC concentrations in different water types, the key environmental controllers can be determined for each water type.
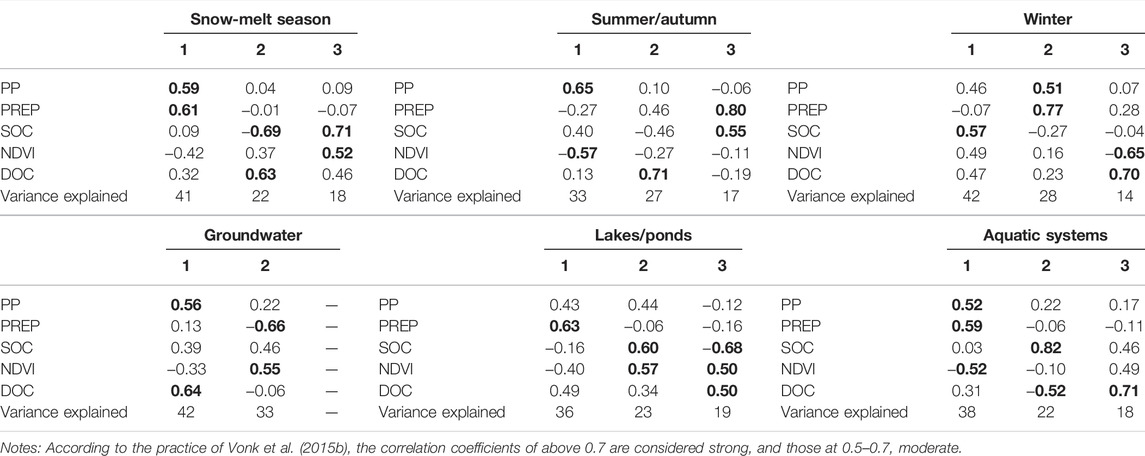
TABLE 3. Correlations between multi-environmental variables and aquatic DOC concentrations for each principal component in a PCA analysis.
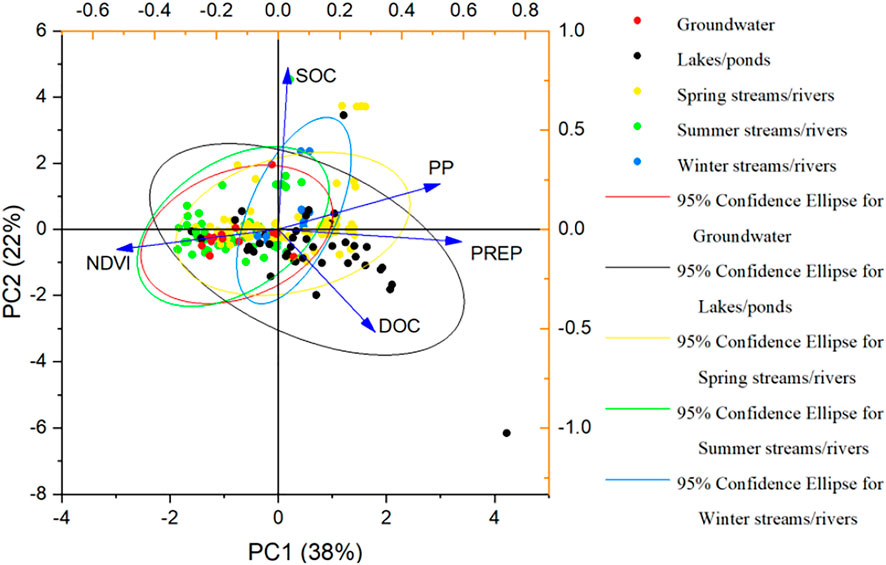
FIGURE 3. Biplot of the PCA of various water types in the source area of the Yellow River (SAYR) and variable correlation plot (blue arrow).
PC1, PC2, and PC3 together explained 81% of the variance among all environmental factors in the snow-melt season (Table 3). PC1 was moderately correlated with PREP (r = 0.61) and PP (r = 0.59), PC2 was moderately correlated with DOC (r = 0.63) and SOC (r = −0.69), and PC3 was strongly correlated with SOC (r = 0.71) and moderately with NDVI (r = 0.52) (Table 3). Due to the fact that we took accumulated solid precipitation in winter as precipitation in the snow-melt season, the positive correlation between PP and PREP illustrates higher accumulated snow in winter in permafrost regions than that in areas of seasonal frost or talik. In-stream DOC concentrations were negatively correlated with the SOC content, obviously inconsistent with those previous observations (Prokushkin et al., 2009; Kindler et al., 2011; Kicklighter et al., 2013). When the ground surface starts to thaw in the snow-melt season, SOC and litterfalls dominate the in-stream DOC (Prokushkin et al., 2010; Guo et al., 2018), possibly due to representativeness of sampling locations. Three components (PC1, PC2, and PC3) together (Table 3) explained 77% variance of all environmental factors in summer–autumn. PC1 was moderately correlated with PP (r = 0.65) and negatively correlated with NDVI (r = −0.57); PC2 was strongly correlated with DOC (r = 0.71); and PC3 was strongly correlated with PREP (r = 0.80) and moderately with SOC (r = 0.55). PP was negatively correlated with NDVI, possibly due to warmer climate and higher NDVI in the downstream SAYR compared to alpine steppes and meadows in upstream SAYR extensively underlain by alpine permafrost. PC1, PC2, and PC3 explained 84% of the variance of environmental factors in winter (Table 3). PC1 was moderately correlated with SOC (r = 0.57). PC2 was closely correlated with PREP (r = 0.77) and moderately with PP (r = 0.51). PC3 was closely correlated with DOC (r = 0.70) and moderately with NDVI (r = −0.65). The negative correlation of winter DOC with NDVI demonstrates relatively higher NDVI in downstream SAYR characterized by lower winter in-stream DOC concentrations.
Two principal components explained 75% of the variance in environmental factors in groundwater sampling sites (Table 3). PC1 was moderately correlated with DOC (r = 0.64) and negatively with PP (r = 0.56). PC2 was moderately correlated with PREP (r = −0.66) and NDVI (r = 0.55). The correlation of groundwater DOC with PP proves that groundwater has become an increasing source of DOC upon permafrost thaw (Moore, 2010). The negative correlation of PREP with NDVI disagrees with the environmental characteristics in the SAYR, likely due to specific sampling locations. PC1, PC2, and PC3 together explained 78% variations of environmental factors in lacustrine sampling sites (Table 3). PC1 was moderately correlated with PREP (r = 0.63), PC2 was moderately correlated with SOC (r = 0.60) and NDVI (r = 0.57), and PC3 was negatively correlated with SOC (r = -0.68) and moderately with NDVI (r = 0.50) and DOC (r = 0.50). Correlations between SOC and NDVI illustrate that a higher NDVI can accumulate more SOC. The correlation of NDVI and lacustrine DOC indicates that sampling plots with higher NDVI are likely to have higher DOC concentrations in lakes/ponds, similar to that reported in earlier studies (Schindler et al., 1997). However, the fact that they were negatively correlated with SOC contradicted those previous observations (De March et al., 1975; Schindler et al., 1997). This might have resulted from samples mostly collected in the up-reach SAYR and lower reaches of SAYR around the Zoîgé wetlands, where SOC was negatively correlated with PP and lacustrine DOC. PC1 explained 38% of the variation of all aquatic samples, with important contributions of PP (r = 0.52), PREP (r = 0.59), and NDVI (r = −0.52) (Table 3). The PC2 explained 22% of the variations, correlated with SOC (r = 0.82) and DOC (r = −0.52) (Table 3). SOC appeared to be grouped with PP, whereas NDVI was on the opposite side of the plot (Figure 3), implying the positive and negative correlations between SOC and NDVI, respectively, with PP. DOC and PREP were grouped together in the down-right quadrant of the plot, indicating the positive correlation between DOC and PREP among all aquatic types. Groundwater and summer streams/rivers were clustered on the left side of the plot, while other water types showed no clear separation.
3.3 Potentials of DOC Decomposition in Aquatic Systems
Aquatic organic carbon is also an important atmospheric carbon source. A meta-analysis of results for decomposability of DOC in varied aquatic systems (e.g., rivers/streams, groundwater, lakes/ponds, and soil solutions) and seasonal rivers/streams was performed for identifying the potentials of transformation from aquatic DOC into atmospheric carbon. Combined with results of DOC concentrations of varied water types and seasonal rivers/streams in northern and other permafrost regions through the method of literature synthesis, hotspots of atmospheric carbon emission from aquatic systems were preliminarily explored (Figure 4).
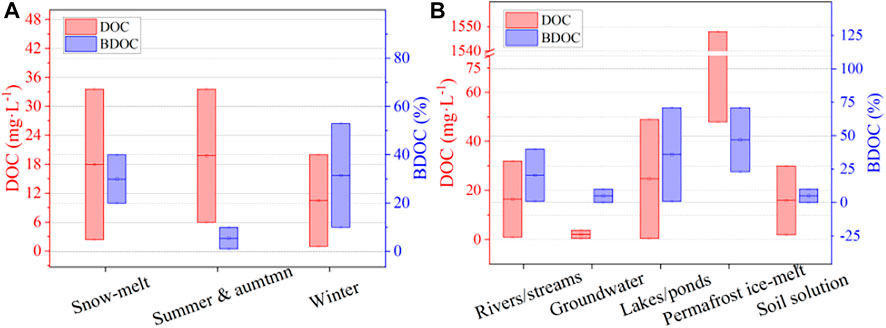
FIGURE 4. DOC concentrations and biodegradable DOC (BDOC) in aquatic systems in permafrost domains. (A) Seasonal distribution of in-stream DOC and BDOC (Finlay et al., 2006, 2009; Petrone et al., 2006; Holmes et al., 2008; O’donnell et al., 2012; Wickland et al., 2012; Olefeldt and Roulet, 2014; Abbott et al., 2014), and (B) DOC and BDOC in varied water types (Vonk et al., 2013, 2015b; Abbott et al., 2014; Mann et al., 2015; Selvam et al., 2017; Textor et al., 2019; Payandi-Rolland et al., 2020); Notes: BDOC can be calculated by either incubation experiment (7–40 d) (Holmes et al., 2008; Vonk et al., 2013; Abbott et al., 2014; Selvam et al., 2017; Textor et al., 2019) or proxies of chemical compositions, for example, hydrophilic compounds as a labile fraction of DOC mineralization (O'Donnell et al., 2012) and tyrosine- and tryptophan-like fluorophores (Finlay et al., 2006; Guo and Macdonald, 2006; Petrone et al., 2006; Balcarczyk et al., 2009).
The ranges of in-stream DOC concentrations are similar in the snow-melt season (2.4–33.6 mg C·L−1) and summer–autumn (6–44.0 mg C·L−1) across 10 sampling sites, in the Yukon River Basin and northeastern Siberia (Finlay et al., 2006, 2009; Guo and Macdonald, 2006; Petrone et al., 2006; Olefeldt and Roulet, 2014) (Figure 4A). In the SAYR, ranges of in-stream DOC concentrations in the snow-melt season (0.1–25.4 mg C·L−1) and summer/autumn (0.5–21.0 mg C·L−1) fell in the existing ranges. In-stream biodegradable DOC (BDOC) in the snow-melt season is 20–40% (Abbott et al., 2014), yet in-stream BDOC in summer–autumn is much smaller ranging from 1 to 10% (Wickland et al., 2012) (Figure 4A). In-stream DOC concentrations in winter range from 1 to 20 mg C·L−1, relatively lower than those in both the snow-melt seasons and summer–autumn (O’Donnell et al., 2012) (Figure 4A). Winter in-stream DOC concentrations in the SAYR ranged from 0.5 to 1.5 mg C·L−1 were also smaller than those in other seasons. In the winter season, in-stream BDOC reported across the Yukon River Basin ranges from 10 to 53%, higher than in-stream BDOC in other seasons (O'Donnell et al., 2012; Wickland et al., 2012) (Figure 4A). Thus, in-stream BDOC in the spring snow-melt season and winter with relatively higher DOC concentrations or BDOC are potentially important sources of atmospheric carbon emissions from aquatic systems. DOC concentrations in different water types have shown featured distributions. The ranges of DOC concentrations are the lowest in groundwater (0.5–3.9 mg C·L−1), and the highest in ground-ice melt-water (48–1,548 mg C·L−1) (Ma et al., 2019b) (Figure 4B). DOC ranges in lakes/ponds (0.5–49 mg C·L−1) are generally higher than those in rivers/streams (1–32 mg C·L−1) and soil solutions (2–30 mg C·L−1) (Abbott et al., 2014; Ma et al., 2019b). The distributive features of aquatic DOC in the SAYR are consistent with existing and latest research results. Correspondingly, the BDOC of ground-ice meltwater is the highest among all water types (23–71%), followed by lakes/ponds (1–71%), rivers/streams (1–40%), and soil solutions (0–10%) (Mann et al., 2015; Payandi-Rolland et al., 2020; Selvam et al., 2017; Textor et al., 2019; Vonk et al., 2013, 2015b) (Figure 4B). Therefore, DOC associated with ground-ice melt-water, lakes/ponds, and rivers/streams are relatively labile and potentially a major atmospheric carbon source among other aquatic water types in permafrost regions.
4 Conclusion
In permafrost regions, aquatic systems are important pathways of carbon cycling, and potentially acted as major atmospheric carbon sources. DOC concentrations in aquatic systems show strong variations among individual water types in the SAYR. Permafrost-related water types show higher DOC concentrations (ground-ice meltwater, 32.94 mg C·L−1; supra-permafrost water, 20.54 ± 3.6 mg C·L−1; and sub-permafrost water, 16.8 ± 1.2 mg C·L−1) than other water types (lakes/ponds, 21.3 ± 34.1 mg C·L−1; rivers/streams, 4.3 ± 3.7 mg C·L−1; and groundwater, 1.8 ± 1.4 mg C·L−1). Seasonal features of in-stream DOC concentrations were characterized by declining features in 2016 (snow-melt season: 4.5 ± 2.2 mg C·L−1 > summer–autumn: 2.4 ± 3.7 mg C·L−1 > winter: 0.8 ± 0.6 mg C·L−1) and the greatest in-stream DOC concentrations (7.0 ± 4.8 mg C·L−1) in summer–autumn, and they decreased in the spring snow-melt season (3.6 ± 6.0 mg C·L−1) and winter (1.1 ± 0.5 mg C·L−1) in 2017, and they were associated with intra-annual variations in precipitation modes. Aquatic DOC concentrations and their ranges in the SAYR are consistent with those observed in northern permafrost regions and other QTP sub-basins. PP, PREP, and NDVI explained 38% variance of environmental variables in aquatic DOC distribution in the SAYR, and the PCA analysis reveals that the presence of permafrost is correlated with groundwater DOC, which suggests that groundwater is becoming an additional source of DOC with progressive permafrost thaw in the SAYR. Relatively higher in-stream DOC concentrations in the snow-melt season and winter in combination with higher BDOC and higher DOC concentrations in ground-ice meltwater, lakes/ponds, and rivers/streams are potentially major sources of atmospheric carbon emission from aquatic systems in the SAYR.
Data Availability Statement
The original contributions presented in the study are included in the article/Supplementary Material, further inquiries can be directed to the corresponding authors.
Author Contributions
Conceptualization, QM and HJ; methodology, QM; software, RS and SM; validation, YY and SL; formal analysis, QM; investigation, DL, YH, XL, and SG; resources, HJ and QW; data curation, QM; writing—original draft preparation, QM; writing—review and editing, HJ; visualization, QM; supervision, project funding, and administration, HJ and QW. All authors have read and agreed to the published version of the manuscript.
Funding
This work was funded by the Chinese Academy of Sciences (CAS) Strategic Priority Research Program (Grant No. XDA20100103) and Consulting Project of Ministry of Natural Resources “Impacts of shrinking glaciers and degrading permafrost on ecosystems, Yellow River discharge and carbon sources and sinks in the Source Area of Yellow River on northeastern Qinghai–Tibet Plateau, China.” The article processing charges (APC) are funded by the CAS Strategic Priority Research Program (Grant No. XDA20100103).
Conflict of Interest
The authors declare that the research was conducted in the absence of any commercial or financial relationships that could be construed as a potential conflict of interest.
Publisher’s Note
All claims expressed in this article are solely those of the authors and do not necessarily represent those of their affiliated organizations, or those of the publisher, the editors, and the reviewers. Any product that may be evaluated in this article, or claim that may be made by its manufacturer, is not guaranteed or endorsed by the publisher.
Acknowledgments
The authors would like to express the sincere gratitude to the five unidentified reviewers for their kind comments and generous efforts in reviewing and improving the manuscript.
Supplementary Material
The Supplementary Material for this article can be found online at: https://www.frontiersin.org/articles/10.3389/feart.2022.892524/full#supplementary-material.
References
Abbott, B. W., Larouche, J. R., Jones, J. B., Bowden, W. B., and Balser, A. W. (2014). Elevated Dissolved Organic Carbon Biodegradability from Thawing and Collapsing Permafrost. J. Geophys. Res. Biogeosci. 119, 2049–2063. doi:10.1002/2014JG002678
Balcarczyk, K. L., Jones, J. B., Jaffé, R., and Maie, N. (2009). Stream Dissolved Organic Matter Bioavailability and Composition in Watersheds Underlain with Discontinuous Permafrost. Biogeochemistry 94, 255–270. doi:10.1007/s10533-009-9324-x
Blue, B., Brierley, G., and Yu, G.-a. (2013). Geodiversity in the Yellow River Source Zone. J. Geogr. Sci. 23, 775–792. doi:10.1007/s11442-013-1044-4
Brierley, G. J., Li, X. L., Cullum, C., and Gao, J. (2016). “Introduction: Landscape and Ecosystem Diversity in the Yellow River Source Zone,” in Landscape and Ecosystem Diversity, Dynamics and Management in the Yellow River Source Zone. Editors G. J. Brierley, X. Li, C. Cullum, and J. Gao (New York: Springer). doi:10.1007/978-3-319-30475-5_1
Chen, M., Li, C., Spencer, R. G. M., Maie, N., Hur, J., McKenna, A. M., et al. (2021). Climatic, Land Cover, and Anthropogenic Controls on Dissolved Organic Matter Quantity and Quality from Major Alpine Rivers across the Himalayan-Tibetan Plateau. Sci. Total Environ. 754, 142411. doi:10.1016/j.scitotenv.2020.142411
Cole, J. J., Prairie, Y. T., Caraco, N. F., McDowell, W. H., Tranvik, L. J., Striegl, R. G., et al. (2007). Plumbing the Global Carbon Cycle: Integrating Inland Waters into the Terrestrial Carbon Budget. Ecosystems 10, 171–184. doi:10.1007/s10021-006-9013-8
Connolly, C. T., Cardenas, M. B., Burkart, G. A., Spencer, R. G. M., and McClelland, J. W. (2020). Groundwater as a Major Source of Dissolved Organic Matter to Arctic Coastal Waters. Nat. Commun. 11, 1479. doi:10.1038/s41467-020-15250-8
De March, L. (1975). Nutrient Budgets and Sedimentation in Char Lake, N. W. T., 72°42΄N; 94°50΄W. Winnpeg: University of Manitoba.
Dean, J. F., Meisel, O. H., Martyn Rosco, M., Marchesini, L. B., Garnett, M. H., Lenderink, H., et al. (2020). East Siberian Arctic Inland Waters Emit Mostly Contemporary Carbon. Nat. Commun. 11, 1627. doi:10.1038/s41467-020-15511-6
Eimers, M. C., Watmough, S. A., and Buttle, J. M. (2008). Long-term Trends in Dissolved Organic Carbon Concentration: a Cautionary Note. Biogeochemistry 87, 71–81. doi:10.1007/s10533-007-9168-1
Ewing, S. A., O’Donnell, J. A., Aiken, G. R., Butler, K., Butman, D., Windham-Myers, L., et al. (2015). Long-term Anoxia and Release of Ancient, Labile Carbon upon Thaw of Pleistocene Permafrost. Geophys. Res. Lett. 42, 710–730. doi:10.1002/2015gl066296
Finlay, J., Neff, J., Zimov, S., Davydova, A., and Davydov, S. (2009). Impacts of Permafrost Degradation on Arctic River Biogeochemistry. Hydrol. Process. 23, 169–182. doi:10.1002/hyp.7196
Finlay, J., Neff, J., Zimov, S., Davydova, A., and Davydov, S. (2006). Snowmelt Dominance of Dissolved Organic Carbon in High-Latitude Watersheds: Implications for Characterization and Flux of River DOC. Geophys. Res. Lett. 33, a–n. doi:10.1029/2006GL025754
Guo, L., and Macdonald, R. W. (2006). Source and Transport of Terrigenous Organic Matter in the Upper Yukon River: Evidence from Isotope (δ13C, Δ14C, and δ15N) Composition of Dissolved, Colloidal, and Particulate Phases. Glob. Biogeochem. Cycles 20, a–n. doi:10.1029/2005GB002593
Guo, L., and Macdonald, R. W. (2006). Source and Transport of Terrigenous Organic Matter in the Upper Yukon River: Evidence from Isotope (δ13C, Δ14C, and δ15N) Composition of Dissolved, Colloidal, and Particulate Phases. Glob. Biogeochem. Cycles 20 (2), a–n. doi:10.1029/2005gb002593
Guo, Y., Song, C., Tan, W., Wang, X., and Lu, Y. (2018). Hydrological Processes and Permafrost Regulate Magnitude, Source and Chemical Characteristics of Dissolved Organic Carbon Export in a Peatland Catchment of Northeastern China. Hydrol. Earth Syst. Sci. 22, 1081–1093. doi:10.5194/hess-22-1081-2018
Holmes, R. M., McClelland, J. W., Raymond, P. A., Frazer, B. B., Peterson, B. J., and Stieglitz, M. (2008). Lability of DOC Transported by Alaskan Rivers to the Arctic Ocean. Geophys. Res. Lett. 35, L03402. doi:10.1029/2007GL032837
Hope, D., Billett, M. F., and Cresser, M. S. (1994). A Review of the Export of Carbon in River Water: Fluxes and Processes. Environ. Pollut. 84, 301–324. doi:10.1016/0269-7491(94)90142-2
Hugelius, G., Strauss, J., Zubrzycki, S., Harden, J. W., Schuur, E. A. G., Ping, C.-L., et al. (2014). Estimated Stocks of Circumpolar Permafrost Carbon with Quantified Uncertainty Ranges and Identified Data Gaps. Biogeosciences 11, 6573–6593. doi:10.5194/bg-11-6573-2014
Jin, H., He, R., Cheng, G., Wu, Q., Wang, S., Lü, L., et al. (2009). Changes in Frozen Ground in the Source Area of the Yellow River on the Qinghai-Tibet Plateau, China, and Their Eco-Environmental Impacts. Environ. Res. Lett. 4 (4), 045206. doi:10.1088/1748-9326/4/4/045206
Jin, H., Jin, X., He, R., Luo, D., Chang, X., Wang, S., et al. (2019). Evolution of Permafrost in China during the Last 20 Ka. Sci. China Earth Sci. 62 (8), 1207–1223. doi:10.1007/s11430-018-9272-0
Jin, H., and Ma, Q. (2021). Impacts of Permafrost Degradation on Carbon Stocks and Emissions under a Warming Climate: A Review. Atmosphere 12, 1425. doi:10.3390/atmos12111425
Jin, H., Vandenberghe, J., Luo, D., Harris, S. A., He, R., Chen, X., et al. (2020). Quaternary Permafrost in China: Framework and Discussions. Quaternary 3, 32. doi:10.3390/quat3040032
Jin, H., Wang, S., Lü, L., He, R., Chang, X., and Luo, D. (2010). Features and Degradation of Frozen Ground in the Sources Area of the Yellow River, China. J. Glociol. Geocryol. 32, 10–17. (In Chinese with English abstract).
Kicklighter, D. W., Hayes, D. J., Mcclelland, J. W., Peterson, B. J., Mcguire, A. D., and Melillo, J. M. (2013). Insights and Issues with Simulating Terrestrial DOC Loading of Arctic River Networks. Ecol. Appl. 23, 1817–1836. doi:10.1890/11-1050.1
Kindler, R., Siemens, J., Kaiser, K., Walmsley, D. C., Bernhofer, C., Buchmann, N., et al. (2011). Dissolved Carbon Leaching from Soil Is a Crucial Component of the Net Ecosystem Carbon Balance. Glob. Change Biol. 17, 1167–1185. doi:10.1111/j.1365-2486.2010.02282.x
Kotz, S., and Nadarajah, S. (2004). Multivariate T‐distributions and Their Applications. Cambridge: Cambridge University Press.
Lan, Y., Jin, H., Lu, C., La, C., Shen, Y., Song, J., et al. (2013). The Fact of Climate Shift to Warm-Humid in the Source Regions of the Yellow River and its Hydrologic Response. J. Glociol. Geocryol. 35, 920–928. (In Chinese with English abstract). doi:10.7522/j.issn.1000-0240.2013.0104
Luo, D., Liu, L., Jin, H., Wang, X., and Chen, F. (2020). Characteristics of Ground Surface Temperature at Chalaping in the Source Area of the Yellow River, Northeastern Tibetan Plateau. Agric. For. Meteorology 281, 107819. doi:10.1016/j.agrformet.2019.107819
Ma, Q., Jin, H.-J., Bense, V. F., Luo, D.-L., Marchenko, S. S., Harris, S. A., et al. (2019a). Impacts of Degrading Permafrost on Streamflow in the Source Area of Yellow River on the Qinghai-Tibet Plateau, China. Adv. Clim. Change Res. 10, 225–239. doi:10.1016/j.accre.2020.02.001
Ma, Q., Jin, H., Yu, C., and Bense, V. F. (2019b). Dissolved Organic Carbon in Permafrost Regions: A Review. Sci. China Earth Sci. 62 (2), 349–364. doi:10.1007/s11430-018-9309-6
Ma, Q. (2020). Research on In-Stream Dissolved Organic Carbon Dynamics and Mechanisms in the Source Area of the Yellow River on the Northeastern Qinghai-Tibet Plateau, Southwest China. Lanzhou, China: Chinese Academy of Sciences. (In Chinese with English abstract).
Mann, P. J., Eglinton, T. I., McIntyre, C. P., Zimov, N., Davydova, A., Vonk, J. E., et al. (2015). Utilization of Ancient Permafrost Carbon in Headwaters of Arctic Fluvial Networks. Nat. Commun. 6, 7856. doi:10.1038/ncomms8856
Matheus Carnevali, P. B., Rohrssen, M., Williams, M. R., Michaud, A. B., Adams, H., Berisford, D., et al. (2015). Methane Sources in Arctic Thermokarst Lake Sediments on the North Slope of Alaska. Geobiology 13, 181–197. doi:10.1111/gbi.12124
Matveev, A., Laurion, I., Deshpande, B. N., Bhiry, N., and Vincent, W. F. (2016). High Methane Emissions from Thermokarst Lakes in Subarctic Peatlands. Limnol. Oceanogr. 61, S150–S164. doi:10.1002/lno.10311
Moore, W. S. (2010). The Effect of Submarine Groundwater Discharge on the Ocean. Annu. Rev. Mar. Sci. 2, 59–88. doi:10.1146/annurev-marine-120308-081019
Mu, C., Zhang, T., Wu, Q., Peng, X., Zhang, P., Yang, Y., et al. (2016). Dissolved Organic Carbon, CO2, and CH4 Concentrations and Their Stable Isotope Ratios in Thermokarst Lakes on the Qinghai-Tibetan Plateau. J. Limnol. 75 (2), 313–319. doi:10.4081/jlimnol.2016.1346
O'Donnell, J. A., Aiken, G. R., Walvoord, M. A., and Butler, K. D. (2012). Dissolved Organic Matter Composition of Winter Flow in the Yukon River Basin: Implications of Permafrost Thaw and Increased Groundwater Discharge. Glob. Biogeochem. Cycles 26, GB0E06. doi:10.1029/2012GB004341
Olefeldt, D., and Roulet, N. T. (2014). Permafrost Conditions in Peatlands Regulate Magnitude, Timing, and Chemical Composition of Catchment Dissolved Organic Carbon Export. Glob. Change Biol. 20, 3122–3136. doi:10.1111/gcb.12607
Panneer Selvam, B., Lapierre, J.-F., Guillemette, F., Voigt, C., Lamprecht, R. E., Biasi, C., et al. (2017). Degradation Potentials of Dissolved Organic Carbon (DOC) from Thawed Permafrost Peat. Sci. Rep. 7, 45811. doi:10.1038/srep45811
Payandi-Rolland, D., Shirokova, L. S., Tesfa, M., Bénézeth, P., Lim, A. G., Kuzmina, D., et al. (2020). Dissolved Organic Matter Biodegradation along a Hydrological Continuum in Permafrost Peatlands. Sci. Total Environ. 749, 141463. doi:10.1016/j.scitotenv.2020.141463
Petrone, K. C., Jones, J. B., Hinzman, L. D., and Boone, R. D. (2006). Seasonal Export of Carbon, Nitrogen, and Major Solutes from Alaskan Catchments with Discontinuous Permafrost. J. Geophys. Res. 111, a–n. doi:10.1029/2005JG000055
Prokushkin, A. S., Hobara, S., and Prokushkin, S. G. (2010). “Behavior of Dissolvedorganiccarbon in Larch Ecosystems,” in Permafrost Ecosystems Siberian Larch Forests. Editors A. Osawa, O. A. Zyryanova, Y. Matsuura, T. Kajimoto, and R. W. Wein (Springer). doi:10.1007/978-1-4020-9693-8_11
Prokushkin, A. S., Hobara, S., and Prokushkin, S. G. (2009). “Global Warming and Dissolved Organic Carbon Release from Permafrost Soils,” in Permafrost Soils. Editor R. Margesin (Berlin: Springer-Verlag).
Ran, Y., Li, X., Cheng, G., Che, J., Aalto, J., Karjalainen, O., et al. (2022). New High-Resolution Estimates of the Permafrost Thermal State and Hydrothermal Conditions over the Northern Hemisphere. Earth Syst. Sci. Data 14, 865–884. doi:10.5194/essd-14-865-2022
Ran, Y., Li, X., Cheng, G., Nan, Z., Che, J., Sheng, Y., et al. (2020). Mapping the Permafrost Stability on the Tibetan Plateau for 2005-2015. Sci. China Earth Sci. 64 (1), 62–79. doi:10.1007/s11430-020-9685-3
Rosentreter, J. A., Borges, A. V., Deemer, B. R., Holgerson, M. A., Liu, S., Song, C., et al. (2021). Half of Global Methane Emissions Come from Highly Variable Aquatic Ecosystem Sources. Nat. Geosci. 14, 225–230. doi:10.1038/s41561-021-00715-2
Schindler, D. W., Curtis, P. J., Bayley, S. E., Parker, B. R., Beaty, K. G., and Stainton, M. P. (1997). Climate-induced Changes in the Dissolved Organic Carbon Budgets of Boreal Lakes. Biogeochemistry 36, 9–28. doi:10.1023/a:1005792014547
Schuur, E. A. G., Bockheim, J., Canadell, J. G., Euskirchen, E., Field, C. B., Goryachkin, S. V., et al. (2008). Vulnerability of Permafrost Carbon to Climate Change: Implications for the Global Carbon Cycle. Biosciences 58, 701–714. doi:10.1641/b580807
Schuur, E. A. G., McGuire, A. D., Schädel, C., Grosse, G., Harden, J. W., Hayes, D. J., et al. (2015). Climate Change and the Permafrost Carbon Feedback. Nature 520, 171–179. doi:10.1038/nature14338
Serikova, S., Pokrovsky, O. S., Ala-Aho, P., Kazantsev, V., Kirpotin, S. N., Kopysov, S. G., et al. (2018). High Riverine CO2 Emissions at the Permafrost Boundary of Western Siberia. Nat. Geosci. 11, 825–829. doi:10.1038/s41561-018-0218-1
Sheng, Y., Ma, S., Cao, W., and Wu, J. (2020). Spatiotemporal Changes of Permafrost in the Headwater Area of the Yellow River under a Changing Climate. Land Degrad. Dev. 31 (1), 133–152. doi:10.1002/ldr.3434
Shirokova, L. S., Pokrovsky, O. S., Kirpotin, S. N., Desmukh, C., Pokrovsky, B. G., Audry, S., et al. (2013). Biogeochemistry of Organic Carbon, CO2, CH4, and Trace Elements in Thermokarst Water Bodies in Discontinuous Permafrost Zones of Western Siberia. Biogeochemistry 113, 573–593. doi:10.1007/s10533-012-9790-4
Stolpmann, L., Coch, C., Morgenstern, A., Boike, J., Fritz, M., Herzschuh, U., et al. (2021). First Pan-Arctic Assessment of Dissolved Organic Carbon in Lakes of the Permafrost Region. Biogeosciences 18, 3917–3936. doi:10.5194/bg-18-3917-2021
Strauss, J., Schirrmeister, L., Grosse, G., Fortier, D., Hugelius, G., Knoblauch, C., et al. (2017). Deep Yedoma Permafrost: A Synthesis of Depositional Characteristics and Carbon Vulnerability. Earth-Science Rev. 172, 75–86. doi:10.1016/j.earscirev.2017.07.007
Tank, S. E., Striegl, R. G., McClelland, J. W., and Kokelj, S. V. (2016). Multi-decadal Increases in Dissolved Organic Carbon and Alkalinity Flux from the Mackenzie Drainage Basin to the Arctic Ocean. Environ. Res. Lett. 11, 054015. doi:10.1088/1748-9326/11/5/054015
Textor, S. R., Wickland, K. P., Podgorski, D. C., Johnston, S. E., and Spencer, R. G. M. (2019). Dissolved Organic Carbon Turnover in Permafrost-Influenced Watersheds of Interior Alaska: Molecular Insights and the Priming Effect. Front. Earth Sci. 7, 275. doi:10.3389/feart.2019.00275
Vonk, J. E., Mann, P. J., Davydov, S., Davydova, A., Spencer, R. G. M., Schade, J., et al. (2013). High Biolability of Ancient Permafrost Carbon upon Thaw. Geophys. Res. Lett. 40, 2689–2693. doi:10.1002/grl.50348
Vonk, J. E., Tank, S. E., Bowden, W. B., Laurion, I., Vincent, W. F., Alekseychik, P., et al. (2015a). Reviews and Syntheses: Effects of Permafrost Thaw on Arctic Aquatic Ecosystems. Biogeosciences 12, 7129–7167. doi:10.5194/bg-12-7129-2015
Vonk, J. E., Tank, S. E., Mann, P. J., Spencer, R. G. M., Treat, C. C., Striegl, R. G., et al. (2015b). Biodegradability of Dissolved Organic Carbon in Permafrost Soils and Aquatic Systems: a Meta-Analysis. Biogeosciences 12, 6915–6930. doi:10.5194/bg-12-6915-2015
Wang, B., and French, H. M. (1995). Permafrost on the Tibet Plateau, China. Quat. Sci. Rev. 14, 255–274. doi:10.1016/0277-3791(95)00006-b
Wang, L., Yao, T., Chai, C., Cuo, L., Su, F., Zhang, F., et al. (2021). TP-river: Monitoring and Quantifying Total River Runoff from the Third Pole. Bull. Am. Meteorol. Soc. 102 (5), E948–E965. doi:10.1175/bams-d-20-0207.1
Wickland, K. P., Aiken, G. R., Butler, K., Dornblaser, M. M., Spencer, R. G. M., and Striegl, R. G. (2012). Biodegradability of Dissolved Organic Carbon in the Yukon River and its Tributaries: Seasonality and Importance of Inorganic Nitrogen. Glob. Biogeochem. Cycles 26 (4), GB0E03. doi:10.1029/2012GB004342
Wieder, W. R., Boehnert, J., Bonan, G. B., and Langseth, M. (2014). Regridded Harmonized World Soil Database v1.2. Oak Ridge, Tennessee, USA: ORNL DAAC.
Yang, D., Kane, D., Zhang, Z., Legates, D., and Goodison, B. (2005). Bias Corrections of Long-Term (1973-2004) Daily Precipitation Data over the Northern Regions. Geophys. Res. Lett. 32, a–n. doi:10.1029/2005GL024057
Ye, B., Yang, D., Ding, Y., Han, T., and Koike, T. (2004). A Bias-Corrected Precipitation Climatology for China. J. Hydrometeorol. 5, 1147–1160. doi:10.1175/jhm-366.1
Yu, K.-f., Lehmkuhl, F., and Falk, D. (2017). Quantifying Land Degradation in the Zoige Basin, NE Tibetan Plateau Using Satellite Remote Sensing Data. J. Mt. Sci. 14, 77–93. doi:10.1007/s11629-016-3929-z
Keywords: alpine permafrost, source area of the Yellow River, dissolved organic carbon, DOC distribution, aquatic systems
Citation: Ma Q, Jin H, Wu Q, Yang Y, Wang Q, Luo D, Huang Y, Li Y, Li X, Serban RD, Liang S, Gao S and Marchenko SS (2022) Distributive Features of Dissolved Organic Carbon in Aquatic Systems in the Source Area of the Yellow River on the Northeastern Qinghai–Tibet Plateau, China. Front. Earth Sci. 10:892524. doi: 10.3389/feart.2022.892524
Received: 09 March 2022; Accepted: 19 April 2022;
Published: 08 June 2022.
Edited by:
Tommaso Tesi, National Research Council (CNR), ItalyCopyright © 2022 Ma, Jin, Wu, Yang, Wang, Luo, Huang, Li, Li, Serban, Liang, Gao and Marchenko. This is an open-access article distributed under the terms of the Creative Commons Attribution License (CC BY). The use, distribution or reproduction in other forums is permitted, provided the original author(s) and the copyright owner(s) are credited and that the original publication in this journal is cited, in accordance with accepted academic practice. No use, distribution or reproduction is permitted which does not comply with these terms.
*Correspondence: Huijun Jin, aGpqaW5AbHpiLmFjLmNu; Qingbai Wu, cWJ3dUBsemIuYWMuY24=