 Sean Kuanhsiang Chen
 Yih-Min Wu1,2,3
 Yu-Chang Chan
- 1Department of Geosciences, National Taiwan University, Taipei, Taiwan
- 2Institute of Earth Sciences, Academia Sinica, Taipei, Taiwan
- 3Research Center for Future Earth, National Taiwan University, Taipei, Taiwan
The southernmost Ryukyu subduction zone may have a geodetically inferred Mw 7.5 to 8.7 megathrust earthquake in a shallow locked region, the Ryukyu fault. Paleoseismological evidence of historical earthquakes available from the last 417 years indicates that only a 1920 Mw 7.7 earthquake occurred within this magnitude range, near the downdip end of the Ryukyu fault. As slow slip events downdip the locked seismogenic zone may trigger a large subduction earthquake, we investigate how the first observed slow slip events in 2005, 2009, and 2015 initiated downdip in the Ryukyu fault interface affect the occurrence of a megathrust. We establish possible megathrust earthquake cycles from Mw 7.5 to 8.7 on the Ryukyu fault using constraints from the magnitude-frequency relation based on local historical earthquakes. This analysis shows a b value of 1.2 for magnitudes greater than Mw 7.0, which is higher than the empirical 1.0 value. This indicates that the recurrence of an event up to Mw 8.7 is longer than previously thought if the megathrust events follow the observed magnitude-frequency relation. Then, we quantify the influence of slow slip events on the triggering of a potential megathrust earthquake by calculating the static stress increase. We find that stress perturbations caused by the three slow slip events are generally consistent with the values that have triggered the large interplate earthquakes in several subduction zones. However, a large earthquake has not yet been triggered on the Ryukyu fault after a sequence of slow slip events. If the 1920 Mw 7.7 earthquake is the last rupture of the Ryukyu fault, the earthquake cycle on the Ryukyu fault is very likely in an early stage. However, this is not true if the slow slip events occur toward the end of the earthquake cycle and there has been no megathrust earthquake at the fault interface in the last 417 years, as the 2011 Mw 9.0 Tohoku earthquake. Thus, higher potential for a megathrust earthquake may occur in the southernmost Ryukyu subduction zone.
Introduction
Slow slip events (SSEs) usually occur around a locked seismogenic zone in the updip, downdip, or at similar depths where the plate interface is weakly coupled (e.g., Schwartz and Rokosky, 2007; Avouac, 2015; Bürgmann, 2018). The regions where SSEs occur have time-dependent transitional friction from velocity weakening to velocity strengthening probably caused by high-pressure interface fluids (e.g., Saffer and Wallace, 2015; Obara and Kato, 2016; Behr and Bürgmann, 2021). Recent observations have shown that SSEs in the downdip of the seismogenic zone initiate immediately before seismogenic-zone earthquakes. e.g., the 2011 Mw 9.0 Tohoku earthquake (Kato et al., 2012; Ito et al., 2013), the 2014 Mw 8.1 Iquique earthquake (Ruiz et al., 2014; Kato et al., 2016; Socquet et al., 2017), the 2014 Mw 7.3 Papanoa earthquake (Radiguet et al., 2016), and the 2018 Mw 6.9 Zakynthos earthquake (Saltogianni et al., 2021). Scientists have interpreted the interaction between aseismic and seismic slip as the stress perturbations caused by the SSEs changing the state of stress in the seismogenic zone beyond the triggering stress threshold of those earthquakes. Generally, the potential of triggering such earthquakes depends on the frictional and stressed conditions at the fault interface (e.g., Mazzotti and Adams, 2004; Beeler et al., 2014; Kaneko et al., 2018). Mazzotti and Adams (2004) suggested that a large earthquake occurs immediately when the state of stress in the seismogenic zone exceeds the earthquake-triggering stress threshold caused by an SSE. Beeler et al. (2014) proposed that a large earthquake is postponed indefinitely after the stress perturbation because the seismogenic zone lacks an earthquake-triggering stress threshold, perhaps due to the earthquake nucleation process. The two hypotheses are opposite depending on whether the earthquake-triggering stress threshold represents the end of an earthquake cycle. The triggering stress threshold can explain why a large earthquake occurs after one local SSE in weeks to a few months during the SSE activity (e.g., Kato et al., 2012; Ito et al., 2013; Ruiz et al., 2014; Radiguet et al., 2016). It means the seismogenic zone is very close to the end of the earthquake cycle, and thus the earthquake can be triggered by the additional stress perturbation from the SSE. If a large earthquake occurs several months to years after the local SSE activity, the seismogenic zone is not yet very close to the end of the earthquake cycle. However, the SSE may have increased the likelihood of a large earthquake when it terminated, even if no earthquake is triggered immediately (e.g., Voss et al., 2018). In the southern Hikurangi subduction zone, New Zealand, the 2016 Kapiti SSE downdip the seismogenic zone did not trigger the large earthquake immediately. The stress perturbations caused by the SSE increased the probability of a megathrust earthquake with a maximum moment of Mw 8.6 on the seismogenic zone (Kaneko et al., 2018). The stress perturbations are at least twice that caused by the 2016 Mw 7.8 Kaikōura earthquake afterslip, which occurred approximately 100 km west of the 2016 Kapiti SSE source area. Thus, the occurrence of megathrust earthquakes linked to SSE activity cannot be ignored.
Geodetic evidence of the slip deficit rate of 8.6 cm/yr in the southernmost Ryukyu subduction zone reveals the potential of an Mw 7.5 to 8.7 earthquake in a locked region named the Ryukyu fault (Hsu et al., 2012). The occurrence of an Mw 8.15 megathrust earthquake will cause a tsunami with 7 m wave heights in the eastern Taiwan region (Sun et al., 2018). The 2002 Mw 7.1 Hualien offshore earthquake that occurred near the downdip end of the Ryukyu fault produced local destruction in the Taiwan region and a tsunami of 20 cm wave heights on Yonaguni Island (Figure 1). The Ryukyu fault extends from the Ryukyu Trench to the shallow depths of the subducting plate interface (Figure 1). The convergence rate across the Ryukyu Trench may be 125 mm/yr in the NS direction between the Philippine Sea Plate and Yonaguni Island on the Eurasian Plate (Hsu et al., 2012). The rate incorporates a back-arc rifting rate of 50 mm/yr in the NS direction from the Okinawa Trough relative to the Eurasian Plate (Nishimura et al., 2004) in a convergence rate of 80 mm/yr in the 310° direction between the two plates under Taiwan Island (Hsu et al., 2009; Chen et al., 2014; 2017). Considering the high convergence rate across the Ryukyu fault, the plate interface has not produced an earthquake with a magnitude greater than Mw 7.7 in the last 417 years, as revealed by the Taiwan historical earthquake catalog since 1,604 (Cheng and Yeh, 1989; Theunissen et al., 2010). The limitation of the earthquake size is atypical of universal observations and may imply the possibility of the seismogenic potential of a much larger event in the future. However, current knowledge of the Ryukyu fault regarding the likelihood of a megathrust event of Mw 8.7 remains unclear.
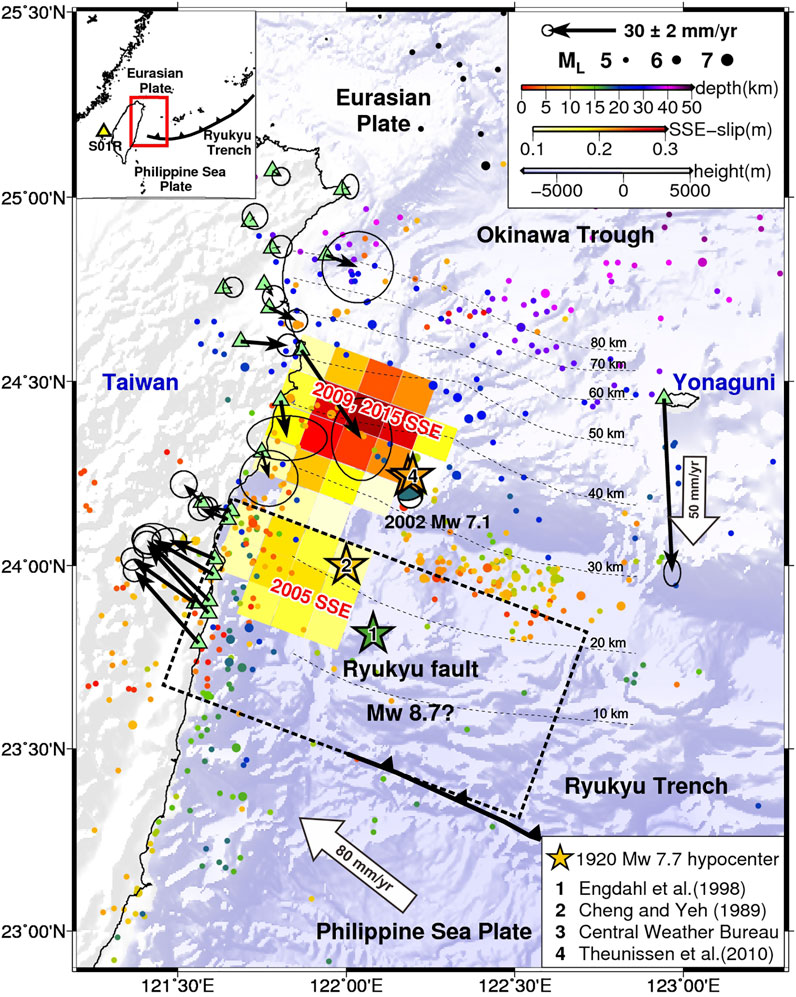
FIGURE 1. Overview of tectonics, SSEs, and seismicity in the southernmost Ryukyu subduction zone. The horizontal surface displacement at each GNSS station (green triangles) from 2007 to 2016 indicates a movement relative to the S01R station (yellow triangle) determined by Chen et al. (2018). The dotted contours show isodepths of the 3D plate interface (Wu et al., 2009). The Ryukyu fault is marked with a dotted rectangle indicating its maximum size with a seismogenic potential of Mw 8.7 (Hsu et al., 2012). Locations of the peak slip during the 2005, 2009, and 2015 slow slip events (Chen et al., 2018) are colored by the SSE-slip scale. Relocated seismicity from 1991 to 2018 based on the Central Weather Bureau earthquake catalog (Wu et al., 2008) is colored based on depth.
Tsunami deposits in the adjacent southernmost Ryukyu subduction zone have provided crucial evidence for tsunami floods from large historical earthquakes. The tsunami deposits in northern Taiwan have shown a possible recurrence interval of 100–400 years for the large earthquakes linked to the 1867 and 1,694 local events and the potential far-field events between 1,293 and 1,414, 1,090 and 1,235 (e.g., Konstantinou et al., 2013; Lin et al., 2014; Yu et al., 2020 and 2022). The two local events in 1867 and 1,694 (approximately Mw ∼7.0) in northern Taiwan are likely associated with normal faulting (e.g., Cheng et al., 2016; Sugawara et al., 2019; Yu et al., 2020) instead of the subduction-related thrusting in the study area. In the southern Ryukyu Islands, the tsunami deposits indicate a seismic recurrence interval of 150–400 years constrained by the 1771 and 1,625 local M ∼8.0 events (e.g., Araoka et al., 2013; Ando et al., 2018). The tsunami deposits also reveal a possible longer recurrence interval of 600–1,000 years that might correlate with the prehistoric tsunami in northern Taiwan (e.g., Ando et al., 2018; Yu et al., 2020). However, the age resolution of Taiwan and southern Ryukyu archives is insufficient for clear evidence of tsunami correlation between those events (Yu et al., 2022). So far, no tsunami deposits have been reported in the southernmost Ryukyu subduction zone to constrain the megathrust earthquake cycles.
The 1920 Mw 7.7 earthquake is the maximum event recorded in this subduction zone and is the only earthquake that satisfies the inferred magnitude over the Ryukyu fault. However, the hypocenter and the source region are poorly resolved and unclear. Engdahl et al. (1998) relocated this earthquake using teleseismic travel times at a location of 122.080° E, 23.813° N, and 35 km depth (Figure 1). Their relocation seems to imply a possible intraplate event of the Philippine Sea Plate. From a local travel-time phase perspective, the earthquake relocation is at 122.0° E, 24.0° N, and 20 km depth (Cheng and Yeh, 1989) and is more likely an interplate event (Figure 1). The relocations from the Central Weather Bureau of Taiwan and Theunissen et al. (2010) are a little northeastward and shallower than that of Cheng and Yeh (1989) (Figure 1). Theunissen et al. (2010) suggested that the 1920 Mw 7.7 earthquake was likely a rupture along the subducting plate interface with a possible splay fault in the Eurasian Plate. Although the debate regarding the origin of this large historical earthquake remains, the probability of it being an interplate event is high. The previous relocations reveal a possibility that the 1920 Mw 7.7 earthquake may have nucleated at the downdip end of the Ryukyu fault (Figure 1). If this earthquake is the last rupture of the Ryukyu fault, it is crucial to the timing of the megathrust earthquake cycle and the fault stress conditions.
Some studies have shown that SSEs can coexist at the edge of a locked fault region where traditional friction may occur (e.g., Ito et al., 2013; Dixon et al., 2014; Mallick et al., 2021). Chen et al. (2018) reported repeating SSEs in 2009 and 2015 that occurred deeper than the locked Ryukyu fault region at plate interface depths of 25–45 km. The SSE cumulative slip is likely complementary to the hypocenters of ML ≥ 5.0 earthquakes in the last 20 years (Figure 1). Another SSE in 2005 may have occurred within the Ryukyu fault at the downdip end. The three observed SSEs in the southernmost Ryukyu subduction zone did not trigger a large earthquake at the Ryukyu fault thus far. The question centers around the role of the sequence of SSEs in the seismogenic potential of the Ryukyu fault. In the adjacent southern Ryukyu Islands, the SSEs recurred every 6 to 7 months with seismic moments of Mw 5.6 to 6.8 at plate interface depths of 30–50 km (e.g., Heki and Kataoka, 2008; Nishimura, 2014). The static stress changes caused by the SSEs are 0.2–1.0 kPa on the eastern-half Ryukyu fault, which may have activated the very low-frequency earthquakes (VLFEs) at the edge of the Ryukyu fault, likely even on the eastern-half plane (Nakamura and Sunagawa, 2015). Onshore Global Navigation Satellite System (GNSS) observations in northeastern Taiwan revealed that the cumulative energy released by each SSE is equivalent to the seismic moments of Mw 6.4 to 6.6 (Chen et al., 2018; Chen S. K. et al., 2022). The SSE moment may have uncertainties hampered by a lack of near-field observations for offshore SSEs (Figure 1).
Here we estimate the likelihood of an Mw ≥ 7.5 earthquake with a maximum moment of Mw 8.7 on the Ryukyu fault and examine how that likelihood is affected by the SSEs activity. We establish possible earthquake cycle scenarios for the locked Ryukyu fault with the earthquake magnitude-frequency relation (Gutenberg and Richter, 1944) constrained by large historical earthquakes. Then, we calculate the shear stress changes caused by the three SSEs with synthetic SSE moments to simulate the potential of a megathrust earthquake triggered by the SSE downdip of the Ryukyu fault. This study provides insights into how much the stress perturbations from SSEs can affect a locked seismogenic region. The stressed conditions of the Ryukyu fault and its possible rupture behaviors are investigated for the first time.
Materials and Methods
We estimate the probability of a megathrust earthquake along the plate interface using the method of Kaneko et al. (2018) with three steps: 1) calculating stress changes on the Ryukyu fault due to SSEs, 2) establishing a synthetic shear stress earthquake cycle of megathrust events over millions of years for the Ryukyu fault, and 3) combining 1) with 2) to estimate the probability of triggering a megathrust event. First, we calculate static stress changes on the Ryukyu fault due to the observed SSEs from the two source depths in Figure 1 with synthetic moments from Mw 6.0 to 7.0. In contrast to Kaneko et al. (2018), we use the Coulomb stress criteria (e.g., King et al., 1994; Stein, 1999; Toda et al., 2011), which have been widely used to quantify the stress changes caused by SSEs (e.g., Radiguet et al., 2016; Voss et al., 2018; Cruz-Atienza et al., 2021). We calculate Coulomb stress changes from 2005, 2009, and 2015 Mw 6.4 to 6.6 SSEs and use those stress changes to scale the relative stress changes from synthetic Mw 6.0 to 7.0 SSEs. The fault dimensions and cumulative slip of SSEs on the receiver faults are scaled proportionally with the SSE moments (Michel et al., 2019; Dal Zilio et al., 2020). The moment is proportional to A3/2, where A is the source area of each SSE and obeys the earthquake magnitude-frequency relation. The strike, dip, and rake of each SSE are the same as the fault parameters of 2005, 2009, and 2015 SSEs (Chen et al., 2018). The computations include 10 × 10 km spatial grids parallel and perpendicular to the Ryukyu Trench while projecting them on the surface (Figure 1). We determine the cumulative slip and fault dimensions of each SSE from 200 bootstrap samples in a 0.1 magnitude bin for their mean values and the resulting Coulomb stress changes (Figure 2A). Note that the fault dimensions are not assigned and are scaled only by the SSE moments (Figure 2B). We perform a checkerboard test on the interface fault to confirm that the resolution of offshore cumulative slip of SSEs is valid. Here the input slip was assumed as 0.1 m homogeneously over the checkerboards of the entire subfault plane (Supplementary Figure S3A) to examine the reproduced slip pattern. We apply the resolution matrix (e.g., Yabuki and Matsu’ura 1992; Yokota et al., 2016) as below: R = (HTH +α2GTG)−1HTH, where H is the static-response-function matrix; α is the hyperparameter of smoothness determined by a Bayesian information criterion (ABIC; Akaike, 1980); G is the spatial smoothness matrix. T denotes the transposed matrix. The resolution value as diagonal elements of the resolution matrix shows a poor resolution (< 0.15) of the offshore slip when the slip area is 50 km away from the coastline (Figure 3). Thus, we determine the cumulative slip and fault dimensions of each SSE within a 50 km distance.
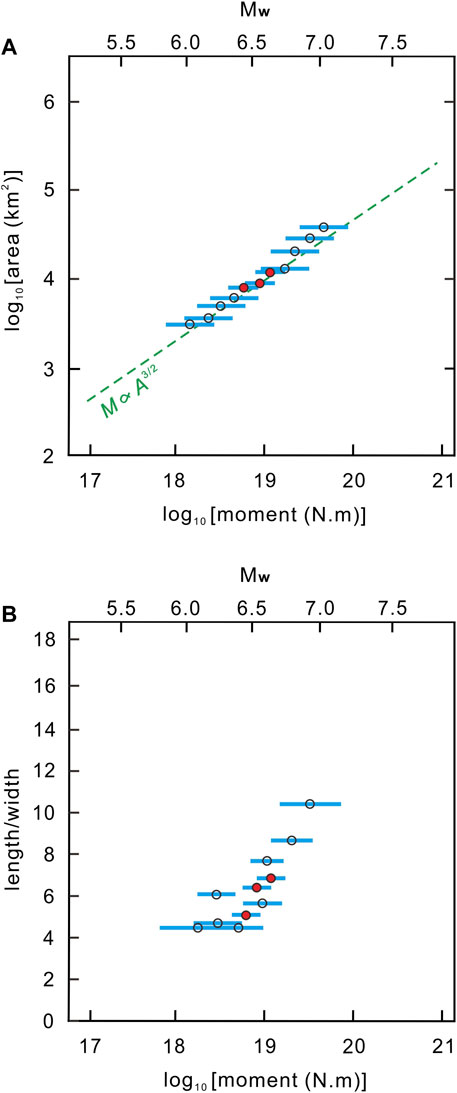
FIGURE 2. Relationship between the moment and fault dimension of SSEs in the southernmost Ryukyu subduction zone. The red and hollow circles represent the means of the observed and synthetic SSEs, respectively, which were derived from all bootstrapped samples. The 95 percent confidence intervals are shown by the blue horizontal bars. (A) Scaling of the fault area and moments of SSEs. (B) The aspect ratio of the fault area of SSEs.
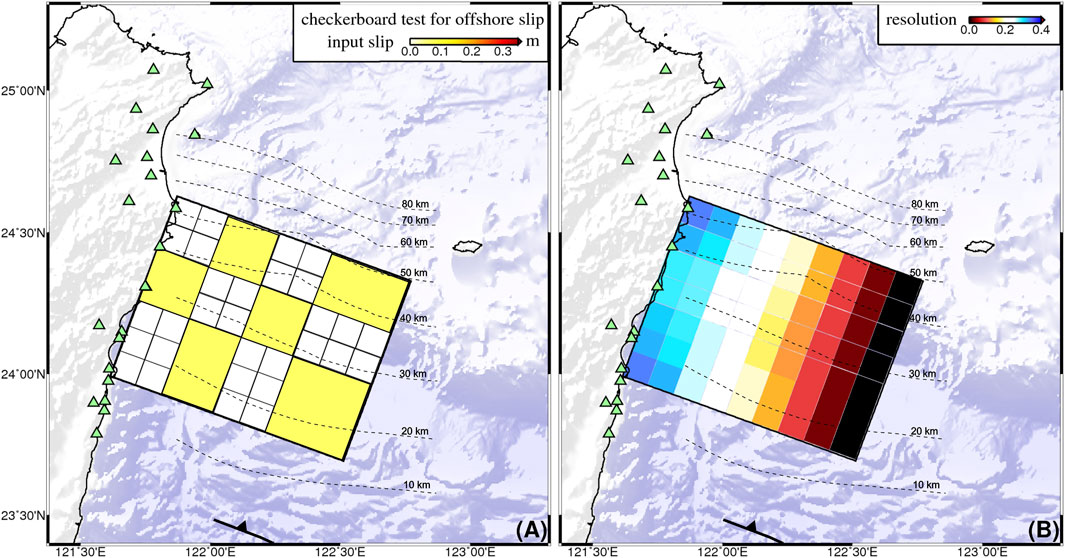
FIGURE 3. Checkerboard test for the offshore cumulative slip distribution of SSEs on the subducting plate interface. The onshore GNSS stations for the checkerboard test in (A) are the same as Figure 1 and are used for the resolution value estimation in (B). The resolution value of less than 0.15 indicates a poor resolution of the offshore slip.
The SSE moment greater than Mw 7.0 will produce an offshore slip 50 km away from the coastline. This would cause significant uncertainties in the following analysis, and thus we only determine the cumulative slip and fault dimensions smaller than the SSE moment of Mw 7.0. The Coulomb stress change Δαc is Δ̰σc = Δτ - μΔσn, where Δτ is the shear stress change, Δσn is the normal stress change, and μ is the effective friction coefficient. Δτ and Δσn are estimated from the 3D strain field on the specified receiver faults derived from the SSE cumulative slip on the subducting plate interface (the source fault). The SSE cumulative slip is multiplied by the elastic stiffness to obtain the 3D strain field and Δσc. Poisson’s ratio (PR) and Young’s modulus (E) are 0.25 and 80 GPa, respectively. The friction coefficients are 0.4 and 0.2 for the region of the 2005 SSE and the 2009/2015 SSEs, respectively, and are related to their different source depths along the oceanic subducting plate interface (Kaneki and Hirono, 2019). Thus, the shear modulus is G = E/[2(1 + PR)] = 30 GPa.
We designed a receiver fault where each subfault plane had a specified strike, dip, and rake, and combine them into the source fault model to calculate the SSE static stress transfer. The receiver faults begin from all patches outside of the primary SSE cumulative slip region, and thus the Coulomb stress change is positive on the receiver faults. In addition, the Coulomb failure is estimated from the SSE cumulative slip theoretically for the stress drop: Δσ ≈
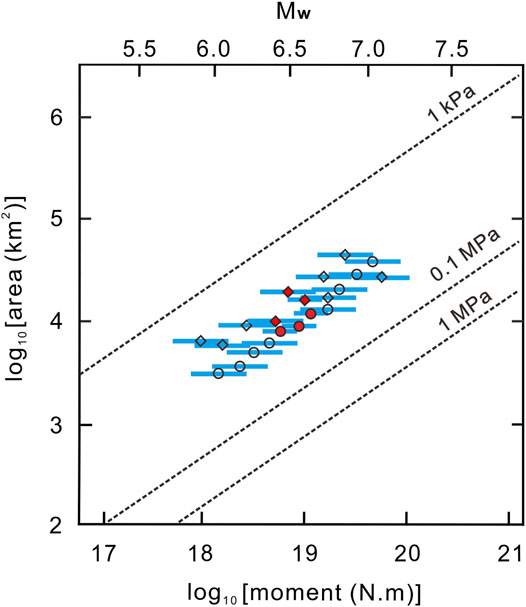
FIGURE 4. Comparison between the shear stress and normal stress changes of the observed and synthetic SSEs estimated from Figure 2. The circles and diamonds represent the shear stress and normal stress changes of SSEs, respectively, averaged over the entire fault region in Figure 1. The dotted isolines of the stress decrease are derived from the empirical circular crack model.
To evaluate the probability of a megathrust earthquake on the Ryukyu fault in a given time interval, we need to know the timing of the stressed conditions in the earthquake cycle. Establishing earthquake cycles requires the timing and size of large historical earthquakes. This modeling approach addresses the evolution of shear stress as earthquake cycles of many megathrust events averaged over the locked region. The total seismic moment released by all megathrust events equals the geodetically estimated moment deficit (Kaneko et al., 2018). Thus, stress changes caused by SSEs can be regarded as the amplitudes of stress perturbation relative to the stress accumulation and stress decreases in large earthquakes. This simple approach has been used for potential seismic hazard assessments in the Nankai, Himalayas, and Hikurangi subduction zones, where the records of historical earthquakes are incomplete (Parsons et al., 2012; Stevens and Avouac, 2016; Kaneko et al., 2018). The establishment of a synthetic shear stress earthquake cycle on the Ryukyu fault requires three parameters: the earthquake stress drop (Δσ), earthquake recurrence intervals (tr), and the background tectonic stress rate (τ). We used three assumptions for parameters to ensure that the synthetic earthquake cycles reproduced the natural characteristics. First, Δσ during the earthquake occurrences is a log-normal distribution with a standard deviation log10Δσ of 0.4 and a mean Δσ of 2.0 MPa, which is a general estimate of Δσ from global subduction earthquakes (e.g., Allmann and Shearer, 2009; Kaneko and Shearer, 2015; Courboulex et al., 2016). Δσ is randomly distributed over time and increases with the earthquake size, which means that the rupture dimension of each earthquake was not assigned and was scaled only by the earthquake size and stress decrease.
Second, tr increases with earthquake size following the GR Law: log10N = a - bM (Gutenberg and Richter, 1944). The earthquake magnitude-frequency relation means a megathrust earthquake has a longer tr and recurs less frequently than a large earthquake in many earthquake cycles. Kaneko et al. (2018) assumed the b value to be empirically 1.0 to establish tr for Mw ≥ 7.8 earthquakes in the southern Hikurangi-locked region. It has been shown that b values can change in different subduction zones from 0.7 to 1.4 and possibly vary with the stress state (Nishikawa and Ide, 2014; Scholz, 2015; Petruccelli et al., 2019). b values in the subduction locked region have been estimated to be lower than 1.0 in the Nankai Trough due to a higher stress state (Nanjo and Yoshida, 2018). However, the subduction zone offshore typically lacks constraints by large historical earthquakes for constraining b values in their megathrust earthquake cycles. We construct tr for geodetically estimated Mw ≥ 7.5 earthquakes on the locked Ryukyu fault (Hsu et al., 2012) using the past earthquakes in this subduction zone. There are sixteen Mw ≥ 7.0 earthquakes that have occurred in the last 120 years and have been relocated by two local earthquake catalogs: 1) Cheng and Yeh (1989) and Theunissen et al. (2010) and 2) Chang et al. (2016). The historical earthquake data provide preliminary constraints on the characteristics of the b value for the megathrust earthquake cycle. Figure 5 shows the hypocenters of the past Mw ≥ 7.0 earthquakes relocated from Cheng and Yeh (1989) and Theunissen et al. (2010). Most hypocenters are located along the subducting plate interface with a depth difference from the plate interface of fewer than 15 km (Figure 5). Since the difference is within the uncertainty of relocated hypocenters (Cheng and Yeh, 1989; Theunissen et al., 2010), we assume that the earthquakes are almost interplate events that can be used to estimate the b value along the subducting plate interface.
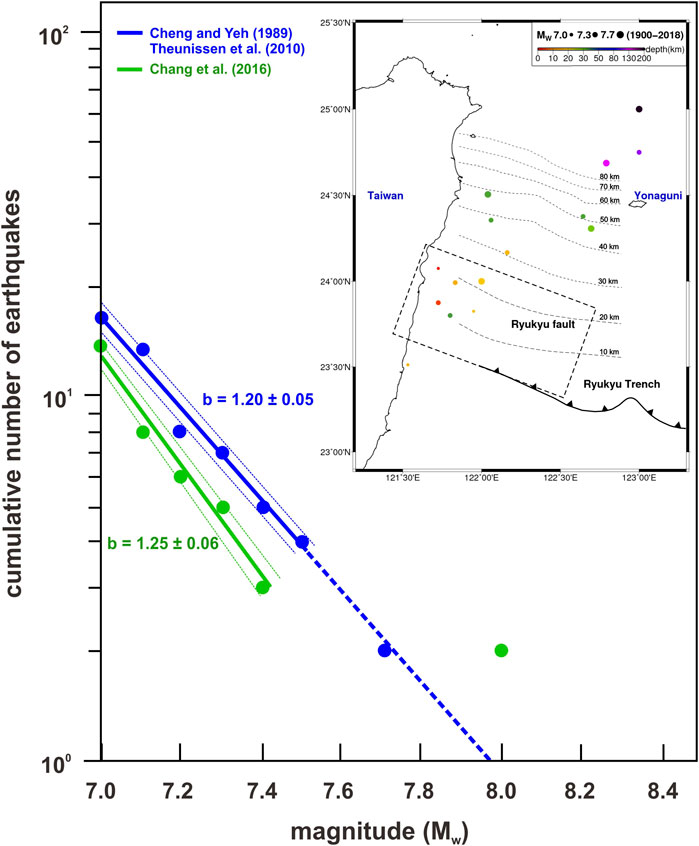
FIGURE 5. Earthquake magnitude-frequency relation (b value) in the southernmost Ryukyu subduction zone based on two historical earthquake catalogs in the last 120 years with magnitudes greater than Mw 7.0. The circles represent the cumulative number of earthquakes (y-axis) equal to/over the earthquake magnitude on the x-axis. The solid and dotted lines represent the regression lines and uncertainties of the b value, respectively. The extended dotted line from Mw 7.5 to 8.0 is assumed. The inset shows the earthquake hypocenters from Cheng and Yeh (1989) and Theunissen et al. (2010).
The b value is estimated by the maximum-likelihood method (Aki, 1965), and we quantify the uncertainty following Shi and Bolt (1982). The b value of the southernmost Ryukyu subduction zone is approximately 1.20–1.25, constrained by the historical earthquakes from Mw 7.0 to 7.4 in the two catalogs (Figure 5). The regression line of the b value is no longer constrained if we involve Mw ≥ 7.5 earthquakes in the b value estimation in both catalogs (Figure 5). We note that the two Mw 8.0 earthquakes in Chang et al. (2016) do not seem to follow the same magnitude-frequency relation as Mw 7.0 to 7.4 (Figure 5). Since no earthquakes are estimated within the range between Mw 7.4 to 8.0, we presume the magnitudes of the two Mw 8.0 earthquakes from Chang et al. (2016) may be overestimated. The regression line of the b value determined from the Cheng and Yeh, (1989) and Theunissen et al. (2010) catalog can explain the data in Mw 7.7 (Figure 5). The estimated b value of 1.2 is higher than the average of 1.0 in the entire Ryukyu subduction zone estimated from magnitudes of Mw 5.0 to 7.0 (e.g., Petruccelli et al., 2019).
Some studies have pointed out a change in the b values for larger earthquake magnitudes (e.g., Utsu, 1999; Wiemer and Wyss, 2000). Chang et al. (2016) have shown that b values are approximately 1.0 in the earthquake magnitudes from Mw 5.0 to 7.0 in their relocated historical catalog. The b values increase to over 1.2 in the earthquake magnitudes greater than Mw 7.0. It is consistent with our b value estimation for the past Mw ≥ 7.0 earthquakes that indicate a possible difference in earthquake magnitude-frequency relation across the magnitudes of Mw 7.0 in the southernmost Ryukyu subduction zone. The increase in the b value for larger earthquake magnitudes may result from either the short history of instrumental records or the nucleation process of large earthquakes. A complete historical earthquake catalog in the future will resolve whether the b values increase with larger earthquake magnitudes. At this stage, we use the current observations of the 1.2 b value to establish possible megathrust earthquake cycles on the Ryukyu fault. We assume the locked Ryukyu fault region shares the same earthquake magnitude-frequency relation as we observe in the southernmost Ryukyu subduction zone to establish tr for the Mw ≥ 7.5 earthquakes. Mw 7.5 is the minimum earthquake size of the Ryukyu fault in our synthetic earthquake cycles. This result is consistent with the geodetically estimated moment deficit for a minimum of Mw 7.5 in this locked region (Hsu et al., 2012). To evaluate the maximum Mw 8.7 event as suggested (Hsu et al., 2012), we assume that earthquakes with magnitudes from Mw 7.5 to 8.7 follow the same estimated b values (dotted line in Figure 5). Considering the uncertainties of the b value are approximately ± 0.05 to 0.06, the b value could range from 1.15 to 1.31 in both catalogs (Figure 5). However, if the two Mw 8.0 earthquakes from Chang et al. (2016) are not overestimated, the b value will be close to 1.0 with a 0.2 difference compared to our estimates. Thus, we tested the b values between 1.0 and 1.4 with an 0.2 interval to establish the tr on the Ryukyu fault.
After determining the b values, the tr and τ can thus be designed in the earthquake cycles. Here tr is the same as Δσ and is randomly distributed in the earthquake cycles, resulting in unpredictability using time and slip. In this sense, τ on the Ryukyu fault is the ratio of Δσ to tr, and
As the timing of the downdip SSEs is unknown in the Ryukyu fault earthquake cycle, we calculate the stress change caused by those SSEs in the synthetic earthquake cycles every tpert years, where tpert is the recurrence interval of the SSEs (Kaneko et al., 2018). It has been shown that Mw 6.0 SSEs recurred every 2 years, and Mw 7.0 SSEs recurred every 6 years in the Nankai, Hikurangi, and Guerrero subduction zones (Wallace et al., 2012; Obara and Kato, 2016; Radiguet et al., 2016). Since the recurrence interval of SSEs remains unclear in the study area (Chen S. K. et al., 2022), we assume that tpert is proportional to the moment of SSEs, as observed in those subduction zones. Note that the resulting probability of a large subduction earthquake is independent of the choice of tpert when the number of simulated megathrust events is designed to be large enough (Kaneko et al., 2018). As the observed duration of Mw ∼6.4 to 6.6 SSEs is two to 4 months (Chen et al., 2018), the Mw 6.0 to 7.0 SSEs are assumed to last 1 week to 6 months to agree with that observed in global subduction zones (e.g., Wallace et al., 2012; Obara and Kato, 2016; Cruz-Atienza et al., 2021). Taking tpert and SSE duration into consideration for the time resolution of probability estimation, we calculate the probability of an Mw ≥ 7.5 earthquake with a maximum moment of Mw 8.7 on the Ryukyu fault every year.
For the timing of the earthquake cycle of the Ryukyu fault, there was no paleoseismological evidence for a magnitude greater than our assumed minimum size of Mw 7.5. Only the 1920 Mw 7.7 earthquake occurred in proximity to the locked region (e.g., Theunissen et al., 2010). Since the hypocenter of historical earthquakes is poorly resolved, the 1920 earthquake cannot be ruled out as an interface slip event. Here, we assume that the 1920 earthquake was the last rupture on the Ryukyu fault. The timing of the first SSE in 2005 is at least 85 years into the earthquake cycle to obtain a specific resulting probability. For computing efficiency, we exclude the next 85 years following each Δσ from the probability calculations. We note the possibility that the 1920 earthquake was not the last rupture of the Ryukyu fault and the interface remained locked since 1,604. Thus, we also model the timing of the 2005 SSE that was 400 years into the earthquake cycle. Since the three SSEs have shown a time-dependent tpert, we evaluated whether the stress level of each tpert exceeds the triggering stress threshold of the next earthquake in a time interval of one to 2 years immediately after each tpert. We apply three possible scenarios that consider each tpert as positive stress in the timing advance. The closer the timing of the stress perturbation caused by the SSE is to the triggering stress threshold of the next event, the higher the seismogenic probability is. For the details and calculation of the resulting probability and uncertainties, refer to Section 2.3 in Kaneko et al. (2018).
Shear Stress Changes on the Ryukyu Fault and the Probability of a Megathrust Earthquake Caused by Slow Slip Event
Figure 6 shows shear stress changes of Mw 6.0 to 7.0 SSEs at the two source depths on the subducting plate interface. The regions of the shear stress decrease, i.e., stress drop, in each subfigure approximately correspond to the SSE cumulative slip regions. The size of the stress drop area is proportional to the moment of SSE. The shear stress increase may have occurred around the stress drop region, and the maximum stress increase appears at the edge of the stress drop region. For SSEs that occur downdip of the Ryukyu fault, a shear stress increase of 0.05 ± 0.02 MPa by an Mw 6.0 SSE is estimated within the downdip region (Figure 6A). There is no shear stress increase on the updip side since the slip dimension of the Mw 6.0 SSE is insufficient for a broader influence on the shear stress increase. When the moment of the SSE reaches Mw 6.5, the shear stress increase of 0.2 ± 0.03 MPa is visible within much of the fault region at northwest-downdip depths (Figure 6B). Note that shear stress decreases begin to appear at the downdip depth limit of the Ryukyu fault. This result is not surprising because the slip dimension of the SSE is proportional to the moment of the SSE, which changes the spatial distribution of the shear stress increase and decrease. The shear stress increase in an Mw 7.0 SSE reaches 0.3 ± 0.05 MPa within much of the fault region at northwest-downdip depths (Figure 6C). The above shear stress increases are less than one-tenth of the estimated values when averaged over the entire fault region (Figure 4). The results are thus not greater than 0.005–0.03 MPa, which is broadly consistent with the stress changes on locked faults caused by similar SSE sizes in large subduction zones (e.g., Nakamura and Sunagawa, 2015; Radiguet et al., 2016; Voss et al., 2018; Saltogianni et al., 2021). The shear stress increase is insignificant in each scenario where SSEs occur within much of the Ryukyu fault downdip region. We observed only a shear stress increase of 0.05 ± 0.04 MPa, estimated from an Mw 6.0 SSE (Figure 6D). Such slight stress increases of 0.10 ± 0.05 MPa and 0.15 ± 0.06 MPa are determined from Mw 6.5 and 7.0 SSEs, respectively (Figures 6E,F). The shear stress increase in the entire locked region does not seem proportional to the moment of the SSE.
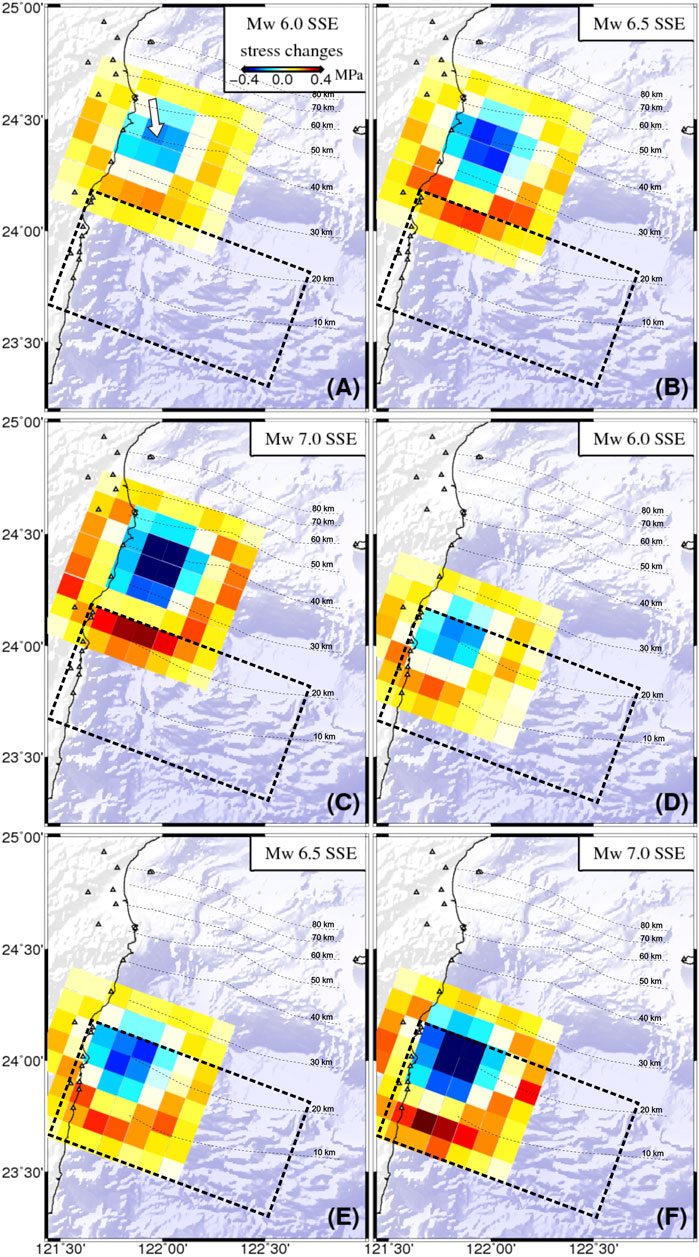
FIGURE 6. Examples of shear stress changes on the Ryukyu fault caused by synthetic SSEs with moments from Mw 6.0 to 7.0. The white arrow indicates the slip direction of each SSE. (A–C) Scenarios of SSEs from the downdip depths of the Ryukyu fault (black dotted rectangles). (D–F) SSEs within the downdip region.
Figure 7 shows the annual probability as a function of time since the first 2005 SSE based on each shear stress increase in Figure 6. Here, we demonstrate the probabilities of an Mw ≥ 7.5 earthquake with a maximum moment of Mw 8.7 and a magnitude frequency relation of a b value of 1.2 (blue curves, Figures 7A–C). The annual probability in the first year following the SSE in 2005 only increases slightly. The probability change is within the uncertainty of background probability in the 10 year sequence. Note that the resulting probability uncertainty is always the largest since the influence of both shear stress decrease and increase on the Ryukyu fault. We observed that the 2009 and 2015 SSEs show a significant probability increase over the uncertainty of background probability (Figures 7A–C). In each scenario, the annual probabilities in the first year following the SSEs are approximately 1.1–1.2 times the background probability. As expected, the ratio of the probability increase is governed by the amount of shear stress increase over the first year (Kaneko et al., 2018). Note that the probability increase looks small because the stress perturbations from the SSE in Figure 6 are averaged over the entire fault region in Figure 4. The annual probability reduces to the background level of 0.45% after 1 year in each case because we assumed the durations of all SSEs are less than half of a year. Thus, the probability does not change when the external stress perturbation is absent, relying on the failure criterion that a large earthquake occurs immediately at a stress threshold (e.g., Mazzotti and Adams, 2004).
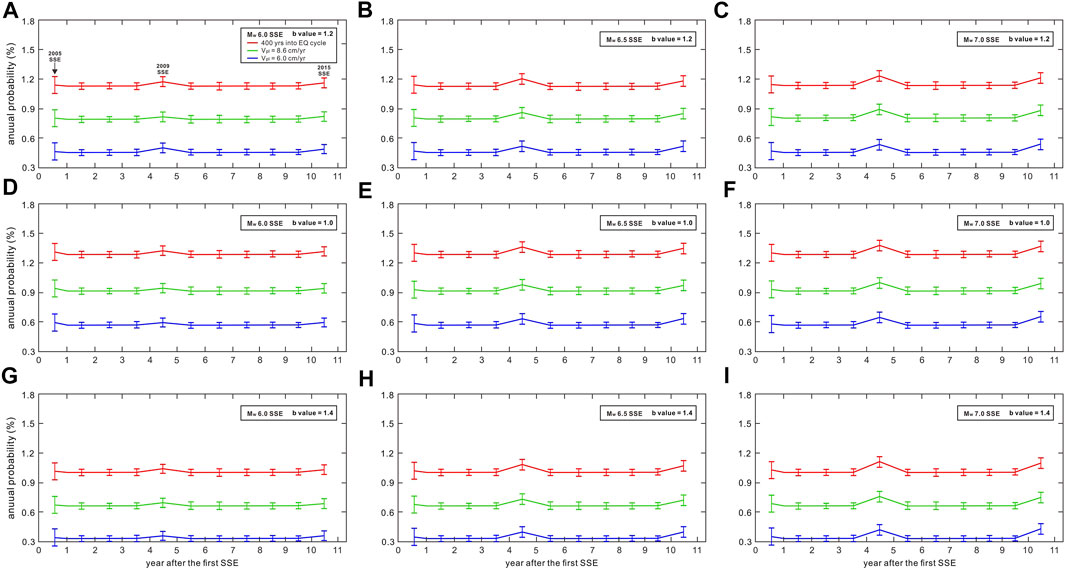
FIGURE 7. Annual probability of an Mw ≥ 7.5 earthquake with a maximum of Mw 8.7 on the Ryukyu fault following the 2005, 2009, and 2015 SSEs. The blue, green, and red curves represent the scenario of Vpl = 6.0 cm/yr, 8.6 cm/yr, and 400 years into the earthquake cycle, respectively. The vertical bars are the uncertainty of probability. (A–C) Probabilities under the frame of the observed b value of 1.2 in the earthquake cycles. (D–F) Same as (A–C) but for a b value of 1.0 and (G–I) for a b value of 1.4.
We also consider the annual probability for b values of 1.0 and 1.4 for the earthquake cycles. In both scenarios, the potential of a large earthquake is the highest over the first year of each SSE, namely the result of b values of 1.2. We find that the background probability is affected by the b value used for tr in synthetic shear stress earthquake cycles, which was found empirically in Kaneko et al. (2018). In the case of the b value of 1.0 (Figures 7D–F), the background probability increases to 0.60% and then slightly increases with the moments of SSEs. When the b value increases to 1.4, we observed a decrease in background probability to 0.30% and then slightly increases with the same ratios as Figures 7A–C. The background probability is dependent on the choice of the b value because τ is determined from
We find that the background probability of an Mw ≥ 7.5 subduction earthquake is small on the Ryukyu fault, between 0.30% and 0.60%, compared to the predictions in the Nankai and southern Hikurangi subduction zones (Kaneko et al., 2018). Kaenko et al. (2018) assumed that the total seismic moments in the two subduction zones were released by assumed Mw ≥ 7.8 earthquakes with an empirical b value of 1.0 in their earthquake cycles. The total Δσ is thus balanced by a higher frequency of megathrust events, which leads to a higher background probability than our results. Our results are more robust based on the geodetically estimated minimum earthquakes of Mw ≥ 7.5 on the Ryukyu fault (Hsu et al., 2012) and the historical earthquake b values. It has been shown that the background probability of a large subduction megathrust is not affected much by the Vpl value (Kaneko et al., 2018). Although we assumed a higher Vpl value than that assumed in Kaneko et al. (2018), our results show that in the case of the Vpl = 8.6 cm/yr (green curves, Figure 7): the background probability will be higher than Vpl = 6.0 cm/yr of only about 0.3%. We find the effect of Vpl is secondary to the probability increase compared to that of the timing of SSE into the earthquake cycle (red curves, Figure 7). It could be the case if the Vpl is very large enough to produce a similar probability increase in the case of 400 years into the earthquake cycle. However, the present observations in this subduction zone do not support this kind of scenario. Thus, Vpl is unlikely to be a critical parameter that results in the difference in background probability.
Discussion
The seismogenic potential of an Mw ≥ 7.5 earthquake on the Ryukyu fault is estimated to be very small when considering the fault zone can rupture entirely as an Mw 8.7 event. The low probability relies on the 1920 Mw 7.7 earthquake, which was assumed to be the last rupture of the Ryukyu fault. Thus, the timing of the first SSE in 2005 is 85 years in the early stage of the earthquake cycle relative to a 500 years recurrence of Mw 8.7 events on the Ryukyu fault. There is a possibility that the 1920 Mw 7.7 earthquake did not occur on the fault interface, which may imply that the Ryukyu fault has remained locked for at least the last 417 years because there are no records of a geodetically estimated minimum magnitude of Mw 7.5 during that period. The stress level of the Ryukyu fault is higher than this assumption, and the 2005 SSE may have changed into the late stage of the earthquake cycle, much closer to the end of the 500 years recurrence of Mw 8.7 events. In this scenario, we obtained a higher annual probability of the megathrust earthquake with a maximum of Mw 8.7, perhaps close to 1.2%, with the possibility of > 1.2% over the next decade (Figure 7). This scenario highlights the potential of a coming megathrust earthquake of Mw 7.5 to 8.7 in the next 100 years. Thus, we discuss three possible rupture scenarios of the Ryukyu fault (Figure 8): (A) regular and repeated ruptures with Mw 7.0 to 7.5 events on several segments of the entire locked region. (B) The Ryukyu fault ruptures separately in two to three main sections, with Mw 7.5 to 8.2 for each earthquake size in the locked area. (C) The entire Ryukyu fault ruptures coherently as an Mw 8.7 event (Hsu et al., 2012), even if we lack paleoseismological evidence to confirm the existence of such a large Mw 8.7 event in the past. Types (A) and (C) are the end-member scenarios, and type (B) is a mixture between them.
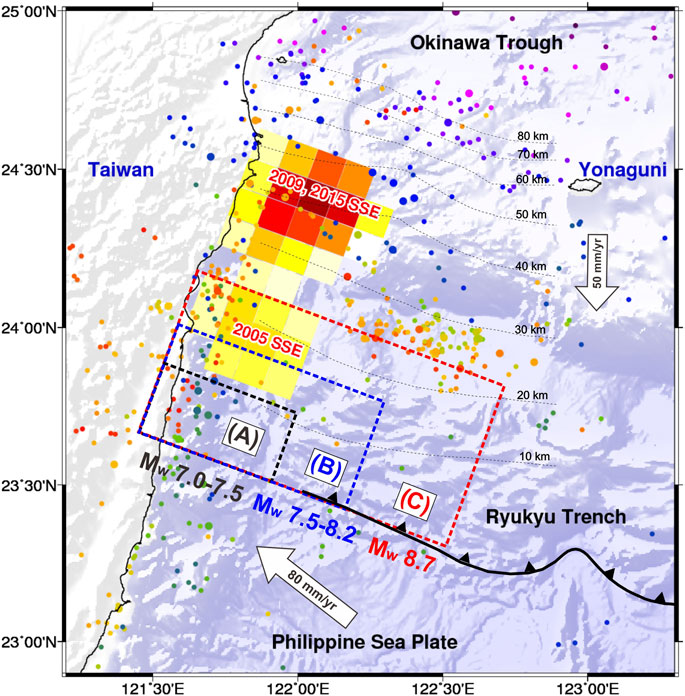
FIGURE 8. Schematic view of the three possible rupture scenarios of the Ryukyu fault. The black, blue, and red dotted rectangles represent the scenarios from types (A–C), respectively (refer to the discussion). The other captions are the same as in Figure 1.
If we consider only the hypocenters of the Mw ≥ 7.0 historical earthquakes in the last 120 years, the Mw 7.0 to 7.2 events occurred almost entirely in the western half of the Ryukyu fault (Figure 5). It may imply that the fault interface is locked on the western-half plane but not fully locked over the entire fault interface. In contrast, the fault interface of the eastern-half plane may be weakly locked since there were no frequent Mw ≥ 7.0 earthquakes but was replaced by very low frequency earthquakes (VLFEs) (Nakamura and Sunagawa, 2015). However, considering the uncertainties in the locations, those events in Figure 5 may not all have occurred on the slip interface linked to the Ryukyu fault. If they were, it could imply that the frictional properties on the fault interface exhibited a time-dependent difference in that period between the western and eastern half. Time-dependent frictional variations have been inferred from geodetically observed SSEs along the strike direction of the plate interface at depths of almost 25–45 km (Chen et al., 2018).
The evidence of VLFEs activity on the eastern-half plane only (Nakamura and Sunagawa, 2015) also supports the difference in the interface frictional behaviors. Recent seafloor geodetic evidence indicates that the convergence rate is likely to increase along the strike of the Ryukyu fault offshore from 92 to 123 mm/yr (Chen H.Y. et al., 2022). The new observations may reveal a strain partitioning between the western/eastern-half planes, complementary to the locations of Mw ≥ 7.0 historical earthquakes and VLFEs. If lateral frictional variation exists in the entire locked region, types (A) and (B) are more similar to the possible rupture behaviors of the Ryukyu fault as fault segmentation. The idea of fault segmentation is reasonable for the higher observed b value of 1.2 for the Mw 7.0 to 7.7 historical earthquakes, rather than the empirical 1.0 value. Seafloor geodetic measurements across the entire fault region will help us understand the frictional interface properties regarding possible fault segmentation. We propose that future Mw 7.0 to 7.5 earthquakes could occur frequently offshore eastern Taiwan, the same as the past events very close to the coastline (Figure 5). The close epicenter distances to the Taiwan region would lead to local destruction and a potential tsunami threat.
A large earthquake triggered by SSE activity is still an open question and has been extensively investigated in global subduction zones. The first observed cases regarding the triggering or delayed triggering of the large earthquakes were rare. The 2014 Mw 7.3 Papanoa earthquake was estimated to be triggered by a 0.04 MPa ongoing stress perturbation from the downdip SSE 2 months before the Mw 7.3 event (Radiguet et al., 2016). The 2018 Mw 6.9 Zakynthos earthquake was likely triggered by the downdip SSE with a 0.025 MPa stress perturbation, which terminated 2 months before the Mw 6.9 event (Saltogianni et al., 2021). In the Costa Rica subduction zone, the 2012 SSE that occurred downdip the 2012 Mw 7.6 Nicoya earthquake was delayed by at least 6 months (Voss et al., 2018). The stress perturbation of 0.01 MPa caused by the SSE on the entire Nicoya locked region may have been insufficient for the triggering stress threshold of the Nicoya earthquake, as could the delay (Voss et al., 2018). The common point is that they were very close to the end of their earthquake cycles. It means the stress levels of the locked faults were high enough, and thus, fault ruptures could have been triggered by small stress perturbations caused by SSEs. In the southernmost Ryukyu subduction zone, our estimated shear stress increase on the Ryukyu fault caused by the 2005, 2009, and 2015 SSEs is similar to those cases when averaged over the entire locked region (less than 0.005–0.04 MPa).
A megathrust earthquake has not yet been triggered on the Ryukyu fault after a sequence of SSEs; it is therefore very likely that the end of the earthquake cycle is not close as in those cases. However, this is not true if the SSEs are very close to the end of the earthquake cycle and there has been no large earthquake at the fault interface in the past 450 years, as in the case of the 2011 Mw 9.0 Tohoku earthquake (Kato et al., 2012; Ito et al., 2013). Our results suggest that the 2009 and 2015 SSEs can produce a significant probability increase in the seismogenic potential of the Ryukyu fault. Since the two SSEs occurred on the same patch, a future SSE recurring there with a similar moment can be expected. Note that our results only show the influence of Mw 6.0 to 7.0 SSEs on the triggering of the megathrust earthquake. If a future Mw > 7.0 SSE occurs down there and the offshore slip cannot be effectively detected (Figure 3), such SSE could produce more stress perturbations than our scenarios. We alert the Taiwan region to monitor the local SSE activity and notice the potential of a large earthquake triggered by the SSEs downdip the locked Ryukyu fault. In addition, the 2005 SSE located at the downdip depth limit of the locked Ryukyu fault seems to increase the potential of a large earthquake slightly. Time-dependent frictional variations at the fault interface could be a reason for SSE generation, as observed in the Japan Trench and Costa Rica subduction zones (e.g., Ito et al., 2013; Dixon et al., 2014). If so, it remains a subject of future work hampered by the limited observations in the southernmost Ryukyu subduction zone for the time-dependent frictional variations.
Conclusion
We report the likelihood of a megathrust earthquake on the Ryukyu fault in the southernmost Ryukyu subduction zone for the first time. The annual probability of an Mw ≥ 7.5 earthquake with a maximum earthquake size of Mw 8.7 is approximately 0.3 to 0.6%, constrained by the observed local b value. The b value for historical earthquakes with magnitudes from Mw 7.0 to 7.7 is 1.2, higher than the average of 1.0 b value derived from Mw 5.0 to 7.0 earthquakes in the entire Ryukyu subduction zone. It implies that the recurrence of megathrust earthquakes is longer than previously thought on the Ryukyu fault if the megathrust events follow the observed magnitude-frequency relation. We also estimate the stress changes on the Ryukyu fault caused by the SSEs in 2005, 2009, and 2015. The shear stress increases averaged over the entire locked zone for a megathrust event range from 0.005 to 0.04 MPa, broadly consistent with the previous observations. Such stress increases have caused the probabilities of a megathrust earthquake triggering over the 2009 and 2015 SSEs 1.1 to 1.2 times relative to the background probability. A future SSE recurring downdip the locked Ryukyu fault should be monitored for the triggering of the large earthquake. It is very likely the earthquake cycle is not close to the end; thus far, there has been no triggered megathrust earthquake after a sequence of SSEs. This work provides unique observation for the critical issue of slow slip-triggered large earthquakes.
Data Availability Statement
The original contributions presented in the study are included in the article/Supplementary Material, further inquiries can be directed to the corresponding author.
Author Contributions
SC conceptualized the project. SC analyzed the data. Y-MW, Y-CC validated the research. SC wrote the original manuscript. Y-MW, Y-CC edited and reviewed the manuscript.
Funding
This study was funded by the Ministry of Science and Technology (MOST) in Taiwan under grant number 109-2116-M-002-030-MY3 and by the NTU Research Center for Future Earth from the Featured Areas Research Center Program within the framework of the Higher Education Sprout Project by the Ministry of Education (MOE) in Taiwan.
Conflict of Interest
The authors declare that the research was conducted in the absence of any commercial or financial relationships that could be construed as a potential conflict of interest.
Publisher’s Note
All claims expressed in this article are solely those of the authors and do not necessarily represent those of their affiliated organizations, or those of the publisher, the editors and the reviewers. Any product that may be evaluated in this article, or claim that may be made by its manufacturer, is not guaranteed or endorsed by the publisher.
Acknowledgments
GNSS data are available at http://gdbweb.earth.sinica.edu.tw/. Coulomb stress change calculations were performed using Coulomb 3.3 software available from the U.S. Geological Survey (USGS) website at https://www.usgs.gov/node/279387. Numerical code for seismogenic probability estimation in Kaneko et al. (2018) is available at https://ftp.gns.cri.nz/pub/ykaneko/Probabilities/
References
Akaike, H. (1980). “Likelihood and the Bayes Procedure,” in Bayesian Statistics. Editors J. M. Bernardo, M. H. De Groot, D. V. Lindley, and A. F. M. Smith (Valencia: University Press), 31, 143–166. doi:10.1007/bf02888350Trab. Estad. Investig. Oper.
Aki, K. (1965). Maximum Likelihood Estimate of B in the Formula logN=a-bM and its Confidence. Bull. Seismo. Soc. Am. 43, 237–239.
Allmann, B. P., and Shearer, P. M. (2009). Global Variations of Stress Drop for Moderate to Large Earthquakes. J. Geophys. Res. 114, B01310. doi:10.1029/2008JB005821
Ando, M., Kitamura, A., Tu, Y., Ohashi, Y., Imai, T., Nakamura, M., et al. (2018). Source of High Tsunamis along the Southernmost Ryukyu Trench Inferred from Tsunami Stratigraphy. Tectonophysics 722, 265–276. doi:10.1016/j.tecto.2017.11.007
Araoka, D., Yokoyama, Y., Suzuki, A., Goto, K., Miyagi, K., Miyazawa, K., et al. (2013). Tsunami Recurrence Revealed by Porites Coral Boulders in the Southern Ryukyu Islands, Japan. Geology 41 (8), 919–922. doi:10.1130/G34415.1
Avouac, J.-P. (2015). From Geodetic Imaging of Seismic and Aseismic Fault Slip to Dynamic Modeling of the Seismic Cycle. Annu. Rev. Earth Planet. Sci. 43 (1), 233–271. doi:10.1146/annurev-earth-060614-105302
Beeler, N. M., Roeloffs, E., and McCausland, W. (2014). Re-estimated Effects of Deep Episodic Slip on the Occurrence and Probability of Great Earthquakes in Cascadia. Bull. Seismol. Soc. Am. 104 (1), 128–144. doi:10.1785/0120120022
Behr, W. M., and Bürgmann, R. (2021). What's Down There? the Structures, Materials and Environment of Deep-Seated Slow Slip and Tremor. Phil. Trans. R. Soc. A 379, 20200218. doi:10.1098/rsta.2020.0218
Bürgmann, R. (2018). The Geophysics, Geology and Mechanics of Slow Fault Slip. Earth Planet. Sci. Lett. 495, 112–134. doi:10.1016/j.epsl.2018.04.062
Chang, W.-Y., Chen, K.-P., and Tsai, Y. B. (2016). An Updated and Refined Catalog of Earthquakes in Taiwan (1900-2014) with Homogenized M W Magnitudes. Earth Planet Spsp. 68, 45. doi:10.1186/s40623-016-0414-4
Chen, H. Y., Hsu, Y. J., Ikuta, R., Tung, H., Tang, C. H., Ku, C. S., et al. (2022). Strain Partitioning in the Southern Ryukyu Margin Revealed by Seafloor Geodetic and Seismological Observations. Geophys. Res. Lett. 49, e2022GL098218. doi:10.1029/2022GL098218
Chen, S. K., Chan, Y.-C., Hu, J.-C., and Kuo, L.-C. (2014). Current Crustal Deformation at the Junction of Collision to Subduction Around the Hualien Area, Taiwan. Tectonophysics 617, 58–78. doi:10.1016/j.tecto.2014.01.014
Chen, S. K., Wu, Y.-M., and Chan, Y.-C. (2022). Slow Slip Events Following the Afterslip of the 2002 Mw 7.1 Hualien Offshore Earthquake, Taiwan. Earth Planets Space 74. doi:10.1186/s40623-022-01629-y
Chen, S. K., Wu, Y.-M., Hsu, Y.-J., and Chan, Y.-C. (2017). Current Crustal Deformation of the Taiwan Orogen Reassessed by cGPS Strain-Rate Estimation and Focal Mechanism Stress Inversion. Geophys. J. Int. 210 (1), 228–239. doi:10.1093/gji/ggx165
Chen, S. K., Wu, Y. M., and Chan, Y. C. (2018). Episodic Slow Slip Events and Overlying Plate Seismicity at the Southernmost Ryukyu Trench. Geophys. Res. Lett. 45 (19), 10369–10377. doi:10.1029/2018GL079740
Cheng, S.-N., Shaw, C.-F., and Yeh, Y. T. (2016). Reconstructing the 1867 Keelung Earthquake and Tsunami Based on Historical Documents. Terr. Atmos. Ocean. Sci. 27, 431–449. doi:10.3319/tao.2016.03.18.01(tem)
Cheng, S. N., and Yeh, Y. T. (1989). Catalog of the Earthquakes in Taiwan from 1604 to 1988Bulletin IES, R-661, 255pp. Taipei: Institute of Earth Sciences.
Courboulex, F., Vallée, M., Causse, M., and Chounet, A. (2016). Stress-Drop Variability of Shallow Earthquakes Extracted from a Global Database of Source Time Functions. Seismol. Res. Lett. 87 (4), 912–918. doi:10.1785/0220150283
Cruz-Atienza, V. M., Tago, J., Villafuerte, C., Wei, M., Garza-Girón, R., Dominguez, L. A., et al. (2021). Short-term Interaction between Silent and Devastating Earthquakes in Mexico. Nat. Commun. 12, 2171. doi:10.1038/s41467-021-22326-6
Dal Zilio, L., Lapusta, N., and Avouac, J. P. (2020). Unraveling Scaling Properties of Slow-Slip Events. Geophys. Res. Lett. 47, e2020GL087477. doi:10.1029/2020gl087477
Dixon, T. H., Jiang, Y., Malservisi, R., McCaffrey, R., Voss, N., Protti, M., et al. (2014). Earthquake and Tsunami Forecasts: Relation of Slow Slip Events to Subsequent Earthquake Rupture. Proc. Natl. Acad. Sci. U.S.A. 111, 17039–17044. doi:10.1073/pnas.1412299111
Engdahl, E. R., Van Der Hilst, R. D., and Buland, R. P. (1998). Global Teleseismic Earthquake Relocation with Improved Travel Times and Procedures for Depth Determination. Bull. Seismo. Soc. Am. 88 (3), 722–743. doi:10.1785/BSSA0880030722
Gutenberg, B., and Richter, C. F. (1944). Frequency of Earthquakes in California*. Bull. Seismo. Soc. Am. 34 (4), 185–188. doi:10.1785/bssa0340040185
Heki, K., and Kataoka, T. (2008). On the Biannually Repeating Slow-Slip Events at the Ryukyu Trench, Southwestern Japan. J. Geophys. Res. 113. doi:10.1029/2008JB005739
Hsu, Y.-J., Ando, M., Yu, S.-B., and Simons, M. (2012). The Potential for a Great Earthquake along the Southernmost Ryukyu Subduction Zone. Geophys. Res. Lett. 39, a–n. doi:10.1029/2012GL052764
Hsu, Y.-J., Yu, S.-B., Simons, M., Kuo, L.-C., and Chen, H.-Y. (2009). Interseismic Crustal Deformation in the Taiwan Plate Boundary Zone Revealed by GPS Observations, Seismicity, and Earthquake Focal Mechanisms. Tectonophysics 479, 4–18. doi:10.1016/j.tecto.2008.11.016
Ito, Y., Hino, R., Kido, M., Fujimoto, H., Osada, Y., Inazu, D., et al. (2013). Episodic Slow Slip Events in the Japan Subduction Zone before the 2011 Tohoku-Oki Earthquake. Tectonophysics 600, 14–26. doi:10.1016/j.tecto.2012.08.022
Kaneki, S., and Hirono, T. (2019). Diagenetic and Shear-Induced Transitions of Frictional Strength of Carbon-Bearing Faults and Their Implications for Earthquake Rupture Dynamics in Subduction Zones. Sci. Rep. 9, 7884. doi:10.1038/s41598-019-44307-y
Kaneko, Y., and Shearer, P. M. (2015). Variability of Seismic Source Spectra, Estimated Stress Drop, and Radiated Energy, Derived from Cohesive-Zone Models of Symmetrical and Asymmetrical Circular and Elliptical Ruptures. J. Geophys. Res. Solid Earth 120, 1053–1079. doi:10.1002/2014JB011642
Kaneko, Y., Wallace, L. M., Hamling, I. J., and Gerstenberger, M. C. (2018). Simple Physical Model for the Probability of a Subduction- Zone Earthquake Following Slow Slip Events and Earthquakes: Application to the Hikurangi Megathrust, New Zealand. Geophys. Res. Lett. 45, 3932–3941. doi:10.1029/2018GL077641
Kato, A., Fukuda, J. i., Kumazawa, T., and Nakagawa, S. (2016). Accelerated Nucleation of the 2014 Iquique, Chile Mw 8.2 Earthquake. Sci. Rep. 6, 24792. doi:10.1038/srep24792
Kato, A., Obara, K., Igarashi, T., Tsuruoka, H., Nakagawa, S., and Hirata, N. (2012). Propagation of Slow Slip Leading up to the 2011 M W 9.0 Tohoku-Oki Earthquake. Science 335, 6069705–6069708. doi:10.1126/science.1215141
King, G. C. P., Stein, R. S., and Lin, J. (1994). Static Stress Changes and the Triggering of Earthquakes. Bull. Seis. Soc. Am. 84, 935–953. doi:10.1785/BSSA0840030935
Kobayashi, T., and Sato, T. (2021). Estimating Effective Normal Stress during Slow Slip Events from Slip Velocities and Shear Stress Variations. Geophys. Res. Lett. 48, 20e2021GL095690. doi:10.1029/2021GL095690
Konstantinou, K. I., Pan, C.-Y., and Lin, C.-H. (2013). Microearthquake Activity Around Kueishantao Island, Offshore Northeastern Taiwan: Insights into the Volcano-Tectonic Interactions at the Tip of the Southern Okinawa Trough. Tectonophysics 593, 20–32. doi:10.1016/j.tecto.2013.02.019
Lin, J.-Y., Sibuet, J.-C., Hsu, S.-K., and Wu, W.-N. (2014). Could a Sumatra-like Megathrust Earthquake Occur in the South Ryukyu Subduction Zone? Earth Planet Sp. 66, 49. doi:10.1186/1880-5981-66-49
Mallick, R., Meltzner, A. J., Tsang, L. L. H., Lindsey, E. O., Feng, L., and Hill, E. M. (2021). Long-lived Shallow Slow-Slip Events on the Sunda Megathrust. Nat. Geosci. 14, 327–333. doi:10.1038/s41561-021-00727-y
Mazzotti, S., and Adams, J. (2004). Variability of Near-Term Probability for the Next Great Earthquake on the Cascadia Subduction Zone. Bull. Seismo. Soc. Am. 94 (5), 1954–1959. doi:10.1785/012004032
Michel, S., Gualandi, A., and Avouac, J.-P. (2019). Similar Scaling Laws for Earthquakes and Cascadia Slow-Slip Events. Nature 574, 522–526. doi:10.1038/s41586-019-1673-6
Nakamura, M., and Sunagawa, N. (2015). Activation of Very Low Frequency Earthquakes by Slow Slip Events in the Ryukyu Trench. Geophys. Res. Lett. 42, 1076–1082. doi:10.1002/2014GL062929
Nanjo, K. Z., and Yoshida, A. (2018). A B Map Implying the First Eastern Rupture of the Nankai Trough Earthquakes. Nat. Commun. 9, 1117. doi:10.1038/s41467-018-03514-3
Nishikawa, T., and Ide, S. (2014). Earthquake Size Distribution in Subduction Zones Linked to Slab Buoyancy. Nat. Geosci. 7, 904–908. doi:10.1038/ngeo2279
Nishimura, S., Hashimoto, M., and Ando, M. (2004). A Rigid Block Rotation Model for the GPS Derived Velocity Field along the Ryukyu Arc. Phys. Earth Planet. Interiors 142, 185–203. doi:10.1016/j.pepi.2003.12.014
Nishimura, T. (2014). Short-term Slow Slip Events along the Ryukyu Trench, Southwestern Japan, Observed by Continuous GNSS. Prog. Earth Planet. Sci. 1, 22. doi:10.1186/s40645-014-0022-5
Obara, K., and Kato, A. (2016). Connecting Slow Earthquakes to Huge Earthquakes. Science 353, 253–257. doi:10.1126/science.aaf1512
Parsons, T., Console, R., Falcone, G., Murru, M., and Yamashina, K. i. (2012). Comparison of Characteristic and Gutenberg-Richter Models for Time-dependent M ≥ 7.9 Earthquake Probability in the Nankai-Tokai Subduction Zone, Japan. Geophys. J. Int. 190 (3), 1673–1688. doi:10.1111/j.1365-246X.2012.05595.x
Petruccelli, A., Schorlemmer, D., Tormann, T., Rinaldi, A. P., Wiemer, S., Gasperini, P., et al. (2019). The Influence of Faulting Style on the Size-Distribution of Global Earthquakes. Earth Planet. Sci. Lett. 527, 115791. doi:10.1016/j.epsl.2019.115791
Radiguet, M., Perfettini, H., Cotte, N., Gualandi, A., Valette, B., Kostoglodov, V., et al. (2016). Triggering of the 2014 Mw7.3 Papanoa Earthquake by a Slow Slip Event in Guerrero, Mexico. Nat. Geosci. 911, 829–833. doi:10.1038/ngeo2817
Rogers, G., and Dragert, H. (2003). Episodic Tremor and Slip on the Cascadia Subduction Zone: the Chatter of Silent Slip. Science 300, 1942–1943. doi:10.1126/science.1084783
Ruiz, S., Metois, M., Fuenzalida, A., Ruiz, J., Leyton, F., Grandin, R., et al. (2014). Intense Foreshocks and a Slow Slip Event Preceded the 2014 Iquique M W 8.1 Earthquake. Science 345, 62011165–62011169. doi:10.1126/science.1256074
Saffer, D. M., and Wallace, L. M. (2015). The Frictional, Hydrologic, Metamorphic and Thermal Habitat of Shallow Slow Earthquakes. Nat. Geosci. 8, 594–600. doi:10.1038/ngeo2490
Saltogianni, V., Mouslopoulou, V., Dielforder, A., Bocchini, G. M., Bedford, J., and Oncken, O. (2021). Slow Slip Triggers the 2018 M W 6.9 Zakynthos Earthquake within the Weakly Locked Hellenic Subduction System, Greece. Geochem. Geophys. Geosyst. 22, e2021GC010090. doi:10.1029/2021GC010090
Schwartz, S. Y., and Rokosky, J. M. (2007). Slow Slip Events and Seismic Tremor at Circum-Pacific Subduction Zones. Rev. Geophys. 45, a–n. doi:10.1029/2006RG000208
Shi, Y., and Bolt, B. A. (1982). The Standard Error of the Magnitude-Frequency B Value. Bull. Seismo. Soc. Am. 72, 1677–1687. doi:10.1785/BSSA0720051677
Socquet, A., Valdes, J. P., Jara, J., Cotton, F., Walpersdorf, A., Cotte, N., et al. (2017). An 8 Month Slow Slip Event Triggers Progressive Nucleation of the 2014 Chile Megathrust. Geophys. Res. Lett. 44, 4046–4053. doi:10.1002/2017GL073023
Stein, R. S. (1999). The Role of Stress Transfer in Earthquake Occurrence. Nature 402, 605–609. doi:10.1038/45144
Stevens, V. L., and Avouac, J. P. (2016). Millenary M W > 9.0 Earthquakes Required by Geodetic Strain in the Himalaya. Geophys. Res. Lett. 43, 1118–1123. doi:10.1002/2015gl067336
Sugawara, D., Yu, N. T., and Yen, J. Y. (2019). Estimating a Tsunami Source by Sediment Transport Modeling: A Primary Attempt on a Historical/1867 Normal-Faulting Tsunami in Northern Taiwan. J. Geophys. Res. Earth Surf. 124, 1675–1700. doi:10.1029/2018JF004831
Sun, Y.-S., Chen, P.-F., Chen, C.-C., Lee, Y.-T., Ma, K.-F., and Wu, T.-R. (2018). Assessment of the Peak Tsunami Amplitude Associated with a Large Earthquake Occurring along the Southernmost Ryukyu Subduction Zone in the Region of Taiwan. Nat. Hazards Earth Syst. Sci. 18, 2081–2092. doi:10.5194/nhess-18-2081-2018
Theunissen, T., Font, Y., Lallemand, S., and Liang, W.-T. (2010). The Largest Instrumentally Recorded Earthquake in Taiwan: Revised Location and Magnitude, and Tectonic Significance of the 1920 Event. Geophys. J. Int. 183, 1119–1133. doi:10.1111/j.1365-246X.2010.04813.x
Toda, S., Stein, R. S., Sevilgen, V., and Lin, J. (2011). U.S. Geological Survey Open-File Report 2011–1060, 63. p., available at https://pubs.usgs.gov/of/2011/1060.Coulomb 3.3 Graphic-Rich Deformation and Stress-Change Software for Earthquake, Tectonic, and Volcano Research and Teaching–User Guide.
Utsu, T. (1999). Representation and Analysis of the Earthquake Size Distribution: A Historical Review and Some New Approaches. Pure Appl. Geophys. 155, 509–535. doi:10.1007/s000240050276
Voss, N., Dixon, T. H., Liu, Z., Malservisi, R., Protti, M., and Schwartz, S. (2018). Do slow Slip Events Trigger Large and Great Megathrust Earthquakes? Sci. Adv. 4, 10eaat8472. doi:10.1126/sciadv.aat8472
Wallace, L. M., Barnes, P., Beavan, J., Van Dissen, R., Litchfield, N., Mountjoy, J., et al. (2012). The Kinematics of a Transition from Subduction to Strike-Slip: An Example from the Central New Zealand Plate Boundary. J. Geophys. Res. 117, a–n. doi:10.1029/2011JB008640
Wallace, L. M., Kaneko, Y., Hreinsdóttir, S., Hamling, I., Peng, Z., Bartlow, N., et al. (2017). Large-scale Dynamic Triggering of Shallow Slow Slip Enhanced by Overlying Sedimentary Wedge. Nat. Geosci. 10, 765–770. doi:10.1038/ngeo3021
Wei, M., Kaneko, Y., Shi, P., and Liu, Y. (2018). Numerical Modeling of Dynamically Triggered Shallow Slow Slip Events in New Zealand by the 2016 M W 7.8 Kaikoura Earthquake. Geophys. Res. Lett. 45, 4764–4772. doi:10.1029/2018GL077879
Wiemer, S., and Wyss, M. (2000). Minimum Magnitude of Completeness in Earthquake Catalogs: Examples from Alaska, the Western United States, and Japan. Bull. Seismol. Soc. Am. 90 (4), 859–869. doi:10.1785/0119990114
Wu, Y.-M., Chang, C.-H., Zhao, L., Teng, T.-L., and Nakamura, M. (2008). A Comprehensive Relocation of Earthquakes in Taiwan from 1991 to 2005. Bull. Seismol. Soc. Am. 98 (3), 1471–1481. doi:10.1785/0120070166
Wu, Y.-M., Shyu, J. B. H., Chang, C.-H., Zhao, L., Nakamura, M., and Hsu, S.-K. (2009). Improved Seismic Tomography Offshore Northeastern Taiwan: Implications for Subduction and Collision Processes between Taiwan and the Southernmost Ryukyu. Geophys. J. Int. 178, 1042–1054. doi:10.1111/j.1365-246X.2009.04180.x
Yabuki, T., and Matsu'ura, M. (1992). Geodetic Data Inversion Using a Bayesian Information Criterion for Spatial Distribution of Fault Slip. Geophys. J. Int. 109, 363–375. doi:10.1111/j.1365-246X.1992.tb00102.x
Yokota, Y., Ishikawa, T., Watanabe, S.-i., Tashiro, T., and Asada, A. (2016). Seafloor Geodetic Constraints on Interplate Coupling of the Nankai Trough Megathrust Zone. Nature 534, 7607374–7607377. doi:10.1038/nature17632
Yu, N.-T., Yen, J.-Y., Yen, I.-C., and Chu, M.-F. (2022). An Extended, 2.4-ka Long Record of Western Pacific Tsunamis and Pumice Rafts in Northern Taiwan: Tsunami Recurrence, Pumice Sources, and Drifting Routes. Quat. Sci. Rev. 281, 107423. doi:10.1016/j.quascirev.2022.107423
Keywords: slow slip event (SSE), megathrust earthquake, Ryukyu fault, historical earthquake, b value, earthquake cycle
Citation: Chen SK, Wu Y-M and Chan Y-C (2022) The Seismogenic Potential of the Southernmost Ryukyu Subduction Zone as Revealed by Historical Earthquakes and Slow Slip events. Front. Earth Sci. 10:887182. doi: 10.3389/feart.2022.887182
Received: 01 March 2022; Accepted: 21 April 2022;
Published: 27 May 2022.
Edited by:
Pascal Audet, University of Ottawa, CanadaReviewed by:
Ryuta Arai, Japan Agency for Marine-Earth Science and Technology (JAMSTEC), JapanMotoyuki Kido, Tohoku University, Japan
Copyright © 2022 Chen, Wu and Chan. This is an open-access article distributed under the terms of the Creative Commons Attribution License (CC BY). The use, distribution or reproduction in other forums is permitted, provided the original author(s) and the copyright owner(s) are credited and that the original publication in this journal is cited, in accordance with accepted academic practice. No use, distribution or reproduction is permitted which does not comply with these terms.
*Correspondence: Sean Kuanhsiang Chen, c2VhbjgwMjU0QGdtYWlsLmNvbQ==