 Qiang Yao
 Sanjeev Joshi
 Kam-Biu Liu
 Erika Rodrigues1,3
- 1Department of Oceanography and Coastal Sciences, College of the Coast and Environment, Louisiana State University, Baton Rouge, LA, United States
- 2Columbia River Inter-Tribal Fish Commission, Portland, OR, United States
- 3Institute of Geosciences, University of São Paulo, São Paulo, Brazil
- 4Virginia Institute of Marine Science, Gloucester Point, VA, United States
Coastal river discharge and sediment load exert major influence on the sustainability of coastal systems. Controlled by various hydroclimatic/hydrometeorological agents, they exhibit distinct trend/variability at different time scales. Coastal Texas, while being a major target for tropical cyclones over the past 6 decades, has been experiencing drought and flood cycles associated with ENSO in the long term. However, it is still unclear the temporal variability of river discharge and the associated sediment delivery over this area at different time scales, and the controlling factors behind it. In this study, a 58-years (1960–2017) dataset is compiled to analyze the influence of ENSO, seasonal rainfall distribution and hurricanes event on the river discharge and suspended sediment load of three Texas coastal rivers-the San Bernard River, the Brazos River, and the Trinity River, at annual, seasonal and event scales, respectively. In the short-term, all three rivers attained the highest average daily discharge and sediment load during Hurricane Harvey. On a seasonal scale, the precipitation regime exerts more influence on the Texas watersheds than tropical storms and hurricanes. Over a multi-decadal scale, amplified rainstorms during the El Niño phases likely play an important role in the overall discharge and sediment transport in large rivers along the northern Gulf coast. Overall, it is reasonable to conclude that the magnitude of hurricane impacts on the overall discharge and suspended sediment load is regulated by the duration and intensity of the rainfall, as well as the coupled drought-flood cycle in relation to the intensity of ENSO.
1 Introduction
The river discharge and associated sediment delivered by coastal rivers have a major influence on the sustainability of the coastal system. Located in the northern Gulf of Mexico (GOM), Texas is the second largest state by both area and population in the United States. The coastal zones along Texas have ∼1,000 km of shorelines and reside ∼7 million population. In addition, the Texas coast is the home base for the oil and natural gas industry that produces 43% of the crude oil and 26% of the natural gas in the U.S. The climate of Coastal Texas is influenced by cyclic climate changes associated with ENSO. In addition, Coastal Texas is also one of the most hurricane prone regions in the world. During the past 6 decades, Texas was directly struck by 15 hurricanes, including Hurricane Carla (1961) and Hurricane Harvey (2017), two of the most devastating and costly hurricanes ever made landfalls in North America (NOAA, 2021). Most of these hurricanes made landfalls in the proximity of three coastal rivers in Texas: the San Bernard River, the Brazos River and the Trinity River (Roth, 2010; NOAA, 2021).
In recent years, studies around the globe have explored the landward (Turner et al., 2006; Xia et al., 2008; McKee and Cherry, 2009; Tweel and Turner, 2012; Liu et al., 2014; Hodge and Williams, 2016) or seaward (Farfán et al., 2014; Bianchette et al., 2015) sediment transport associated tropical storms. These studies demonstrated that quantifying hurricane related river discharge and sediment loads can significantly benefit sediment management by distinguishing ranges with highest potential for transporting as well as depositing hurricane induced sediment loads. However, similar studies are rare in the existing literature from the northern GOM, particularly from Texas coast (Yao et al., 2020a; Yao et al., 2020b; D’Sa et al., 2018; Wang et al., 2018). Furthermore, another gap exists in the quantification of long-term inter- and intra-river hurricane related discharge and sediment loads (Phillips et al., 2004; Wellmeyer et al., 2005; Taha and Anderson, 2008). In particular, even fewer studies have quantitatively examined the multi-decadal trends of hurricane related hydrodynamic variations. To date, few comprehensive spatial-temporal analyses of hurricane induced river discharge and suspended loads from large river systems in Texas are available in the literature over a multi-decadal period. Such dataset is essential in allocating the maximum sediment availability in rivers and is beneficial to the post-hurricane coastal restoration along the northern GOM coastlines. Thus, large gaps exist in the literature.
In this study, we compiled a dataset of river discharge and suspended sediment load over three Texas rivers-the San Bernard, Brazos and Trinity River (Figure 1). The dataset expands from 1958 to 2017, during which 16 hurricanes passed over the three rivers. We selected five of the 16 hurricanes, which includes the only three major hurricanes (category 3-5 on the Saffir-Simpson scale) ever made landfalls in our study region (from Aransas to Galveston, TX)—Carla (1961), Alicia (1983), and Harvey (2017), a category two Hurricane Ike (2008), and a tropical storm Allison (2001), to assess their impacts over our study area. These storms struck our study area in different month, with different rainfall intensity and duration, and exerted distinct impacts on the river discharge and sediment dynamics. The objective of the study is threefold: 1) analyze the seasonal and multi-decadal trends of discharge and suspended sediment load of the three rivers; 2) quantify the impacts of different hurricanes on floods and associated sediment delivery under various climatic contexts; 3) unravel the hydroclimate/hydrometeorological controls behind the river discharge and sediment dynamics at different time scales. The overarching objective of this study is to reveal the hydrological impacts of hurricanes in the light of cyclic climate variabilities. Such information is essential in understanding the contribution of hurricanes on the flood and sediment dynamics over the coastal system under different climatic conditions. This can provide baseline knowledge for projecting hurricane induced floods and associated ecological impacts under climate change.
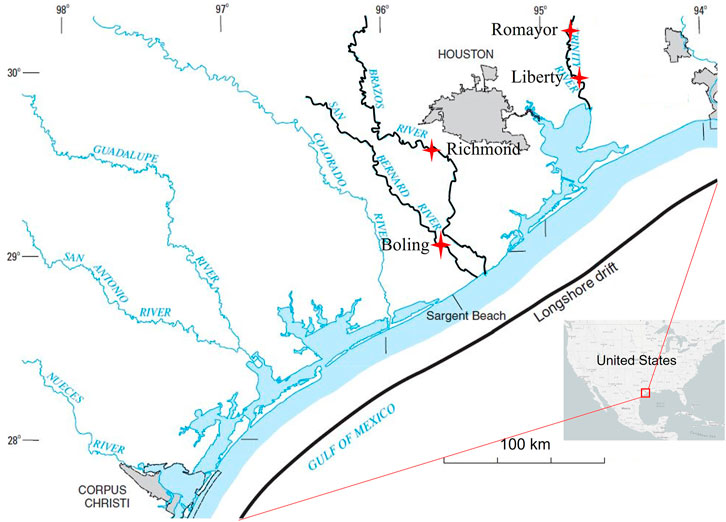
FIGURE 1. Study area map showing the four USGS monitoring stations (red cross) and the San Bernard, Brazos, and Trinity River (from west to east, their main channels are highlighted in black) near the Texas coast. The base map is modified from Dunn and Raines (2001).
2 Regional settings
2.1 Study area description
This study focuses on three coastal rivers in southeast Texas: the San Bernard, Brazos, and Trinity River (Figure 1). The San Bernard River flows downstream from Southwest Austin County through western Brazoria County all the way into GOM for approximately 170 km with a drainage area of ∼4,800 km2. The Brazos River originates in New Mexico and flows for over 1900 km downstream, draining an area of ∼118000 km2 into GOM. With a drainage area of ∼40000 km2, the Trinity River flows from northern Texas downstream for approximately 1,136 km before entering the GOM (Figure 1).
In this study, we collected data from four United States Geological Survey (USGS) monitoring stations along the three rivers. For each river, one to two USGS monitoring stations that are the closest to the GOM and have the most comprehensive discharge and sediment records were selected. These stations include: Boling station at the San Bernard River (USGS Station ID: 08117500) that is ∼65 km inland from the GOM Richmond station at the Brazos River (USGS Station ID: 08114000) that is ∼80 km inland from the GOM, and Romayor (USGS Station ID: 08066500) and Liberty (USGS Station ID: 08067000) stations at the Trinity River, which are ∼55 and ∼70 km inland from the Trinity Bay, respectively (Figure 1).
2.2 Hurricane events
In this study, we selected five hurricanes/tropical storms to investigate their impacts on river discharge and sediment dynamics over the study area at event scale. Hurricane Carla made landfall on 11 September 1961 in the Port O’Conner to Port Lavaca area of the coastal Texas (∼120, 125, and 170 km to the southwest of the San Bernard, Brazos and Trinity River, respectively) (Figure 2). It was a category four hurricane upon landfall and reached a maximum wind speed of ∼230 km/h (NOAA, 2021). Hurricane Alicia hit the west beach of Galveston, TX (∼40 and 35 km to the northeast of the San Bernard and Brazos Rivers, and ∼80 km to the southwest of the Trinity River) on 18 August 1983. It was a category three hurricane at landfall and reached a maximum wind speed of ∼185 km/h (NOAA, 2021). Similarly, tropical storm Allison and category two Hurricane Ike also made landfalls near Galveston, TX on 5 June 2001 and 13 September 2008, but their landfalling locations were ∼25 and ∼50 km to the west and east of that of Alicia, respectively. It is worth noting that although Allison was a tropical storm at landfall, it lasted for 16 days, unusually long for a June storm, and dropped as much as 1,000 mm of rainfall over Texas, making Allison one of the most devastating storm ever made landfall in the northern GOM (Stewart, 2001). The maximum wind speed of Allison and Ike reached ∼90 and ∼170 km/h (NOAA, 2021). Last but not the least, Hurricane Harvey was the most recent major hurricane that directly hit the Texas coast, and the second costliest hurricane that impacted the U.S (Blake and Zelinsky, 2017). It made landfall on 26 August 2017 between Port Aransas and Port O’Conner, ∼50 km to the southwest of the landfall location of Hurricane Carla (Trenberth et al., 2018) (Figure 2). It was a category four hurricane at landfall and reached a maximum wind speed of ∼210 km/h (NOAA, 2021).
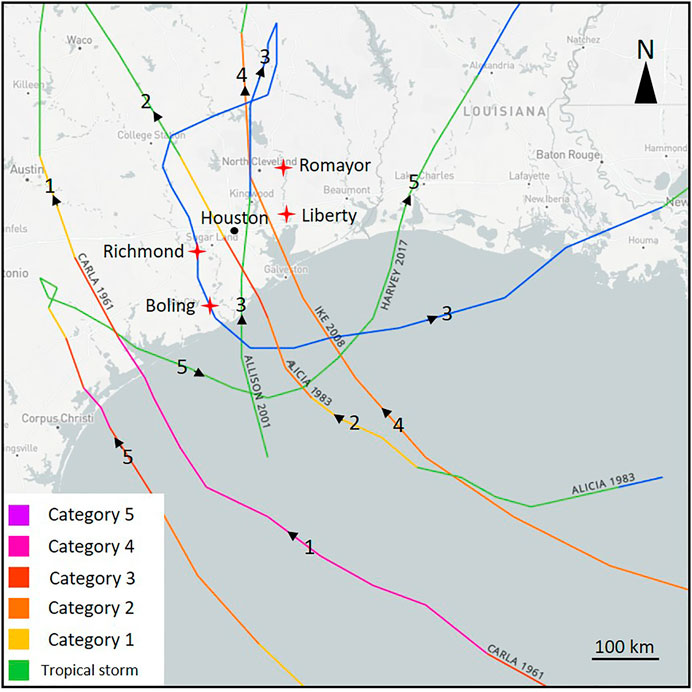
FIGURE 2. Map showing the tracks of the five storms in relation to our study area and the USGS stations (red cross). The numbers 1–5 correspond to Hurricane Carla (1961), Alicia (1983), Allison (2001), Ike (2008), and Harvey (2017), respectively.
2.3 El niño/southern oscillation
El Niño/Southern Oscillation (ENSO) is one of the most important global climate phenomena that alters the atmospheric circulation and influences the global precipitation and temperature (Philander, 1983). During the warmer (El Niño) phases, the sea surface temperatures is warmer than usual in the central and eastern equatorial Pacific and the Pacific jet stream shows a dip in the Eastern Pacific, causing more tropical storms and rainfalls in the southern states in U.S. On the contrary, during the colder (La Niña) phases, the Pacific jet stream shifts northward of its normal position, causing warmer and drier winters over the southern states (Ropelewski and Halpert, 1987). In Texas, ENSO affects the long-term precipitation. The warmer ENSO phases (El Niño) usually induce a much wetter climate than normal. Subsequently, the fluvial discharge and flooding will be increased significantly during El Niño years (Fraticelli, 2006). On the other hand, during a La Niña phase, the precipitation will generally drop below average and drought is expected to occur. The drought-flood cycle is believed to be responsible for the sediment dynamics and geomorphological change over coastal Texas in the long run (Rodriguez et al., 2000; Fraticelli, 2006; Carlin and Dellapenna, 2015).
3 Methods and materials
3.1 River flow data
Daily discharge (Qd) in cubic meters per second (cms here after) at Boling (for the San Bernard River) and Richmond (for the Brazos River) were collected from 1 January 1960 to 31 December 2017. However, Qd records at Liberty (for the Trinity River) were only available for the period from 1 January 1980 to 31 December 2017. The USGS gauging station about 80 km upstream of Liberty, at Romayor (for the Trinity River) had Qd records from mid-1920s to early 2000s. Thus, we added the Qd records at Romayor from 1 January 1960 to 31 December 1979 to the previously collected Qd records at Liberty to match the data period with the locations of other two rivers (i.e., 1960–2017). The addition was based on the deduction that in proximate sites from upstream to downstream, a river flows within 24 h across low to high velocity ranges (Joshi and Xu, 2017) and was supported by short distance between the two sites and the velocity observations from U.S. Army Corps of Engineers (USACE) at Romayor and Liberty across low, medium, and high river-stage ranges.
3.2 Sediment concentration data
Suspended sediment concentration (SSC hereafter) in milligram per liter (mg/L) measurements were collected from USGS at the following locations: Boling for the San Bernard River (during 1978–2002), Richmond for the Brazos River (during 1966–1995), and Liberty for the Trinity River (during 2012–2017). The USGS SSC collection involves depth-integrated sampling for every 12–26 days using several isokinetic point samplers (i.e., P-61, P-63, D-96, and D-99) ranging from four to eight verticals, and each vertical consisting of two to five samples. We retrieved 70 SSC measurements at Boling, 214 measurements at Richmond, and 66 samples at Liberty during the corresponding sampling periods at each location, respectively. We hypothesize that the SSC measurements at all four sampling locations represent all seasons (including low to high flow regimes) because USGS had carried out at least six sediment measurements each year during the sampling periods.
3.3 Development of discharge-sediment load rating curves
We followed the procedures used by Joshi and Xu (2015) to develop discharge-sediment rating curves at all locations for the three rivers. Joshi and Xu (2015), Joshi et al. (2018) developed rating curves for estimating the daily suspended sediment and sand loads for the Mississippi River. We hypothesized that this procedure would work in the three significantly smaller coastal Texas Rivers based on the four criteria used for comparing the robustness of the rating curves (described below). First, we computed the daily sediment load (DSL in t/day) as:
where 0.0864 is a unit conversion factor for converting the sediment mass to the metric tons per day (T/day).
We then applied linear and polynomial curves to evaluate the relationship between the natural logarithm (ln) of two variables, DSL (dependent) and Qd (independent), thus obtained rating curve equations used the “log transformed (ln) Qds” to get the “predicted ln DSL.” We did not apply the power curves because they gave relatively lower regression coefficient (R2) for all rivers after a preliminary check. The exponential values of “predicted ln DSL” finally gave the “predicted DSL” for all sampling days in all three rivers. We also checked for potential log-biasing in the exponential values by applying the correction factor (CF) given by Duan (1983) and simplified by Gray et al. (2015) and for temporal autocorrelation by the Durbin-Watson test (Durbin and Watson, 1950; Durbin and Watson, 1951; Durbin and Watson, 1971). All rating curves were evaluated on the basis of following four criteria: 1) regression coefficient of the curves (R2 ≥ 0.8); 2) root mean square errors of the predicted DSL (RMSE) (the lower the better); 3) standard error (SE) of the curves (in ln units) (also, the lower the better) and 4) a graphical assessment of corresponding calibrated and predicted DSLs (Sadeghi et al., 2008; Joshi and Xu, 2015).
The rating curve equations and their corresponding R2 for the three locations in the three rivers have been documented in Supplementary Table S1, while other evaluation parameters for the rating curves such as CFs, RMSEs (with and without CFs), and SEs have been documented in Supplementary Table S2 in the Supporting Information. Based on these two tables, we used polynomial rating curves with CF to estimate DSLs for each day during the period 1960–2017 at Boling for the San Bernard River and Richmond for the Brazos River. Similarly, we used linear rating curve without CF to estimate DSLs during the same period at Liberty for the Trinity River. The polynomial curves with CF at Boling and Richmond and the linear curves without CF at Liberty accordingly given closest approximation between calibrated (through USGS) and estimated (from this study) sediment loads (please see Supplementary Figures S1–S3).
3.4 Daily, annual and seasonal sediment load trends
We used the selected rating curves (with or without CF) to calculate the DSLs at the three locations for the three rivers during 1960–2017. At all locations, annual sediment loads (SL) were calculated by summingthe DSLs from 1st January to 31st December during each year throughout the study period. We did not consider “water year” used by USGS and USACE (from October 1 of first year to September 30 of next year) for our analysis because the objective of this study is to correlate the long and short-term sediment loads with hurricane events that scattered from summer (June) to fall (September). Similarly, monthly SLs were calculated by averaging DSLs for each month separately from 1960 to 2017. We plotted the annual sediment loads against their corresponding years and the monthly SLs against their corresponding months to analyze their annual and seasonal trends, respectively. We followed the method used by Joshi and Xu (2015) to adjust errors in the sediment load measurements. Joshi and Xu (2015) considered two types of errors E-1 and E-2 in their SL estimates. E-1 is associated with the methods used by USGS for depth-integrated SSC sampling and calibration and has been considered approximately same (±10%) by several previous studies (51–53 in Joshi and Xu 2015). E-2 is based on rating curve statistics (confidence interval plots in ln predicted SL at 95% level of significance, RMSEs, and percentage difference between measured and predicted SLs which averaged 21.6%, 16.1%, and 2.1% for the San Bernard, Brazos, and Trinity Rivers, respectively). We estimated an approximate E-2 of about ±17% in all SLs estimated from the rating curves. Thus, the error range used in sediment load measurements for this study was approximately ±27% (combination of E-1 and E-2).
3.5 Daily and cumulative discharge and sediment loads during hurricane events
We analyzed the trends (including maximum, average, minimum, and cumulative) of Qds and DSLs in the three rivers (at their corresponding locations) during the five storms. Although each hurricane passed by the study area within several days, their influence on river discharge and associated sediment transport can last 1 month. In this case, we considered the calendar month of the hurricane landfall in our analysis to include both the rising and falling limbs of Qd and DSL. We define cumulative discharge (Qcum) and sediment loads (SLcum) as periods between the rising and the last falling limb days of the hydrograph after reaching peak Qcum and SLcum.
4 Results
4.1 Seasonal and annual variability of river discharge and suspended sediment load
The average (Qd), maximum (Qmax), and minimum (Qmin) daily discharges and annual total discharge (Qa) for San Bernard, Brazos, and Trinity River (1960–2017) are listed in Table 1. The average Qd was the lowest for San Bernard River, and it was lower than 20 cms for 40 years during the 58-year period (from 1960—2017) (Figure 3). In addition, the average Qd was the lowest in 2011 for all three rivers (1 cms in the San Bernard River, 20 cms in the Brazos River, and 51 cms in the Trinity River), and the average Qd was the highest in 1973, 1992, and 2015 for the San Bernard (38 cms), Brazos River (684 cms), and Trinity River (645 cms) (Figure 3). In particular, the intervals for 1%, 5%, 10%, 20%, and 50% Qd in the San Bernard River (194–1,407 cms, 77–1,407 cms, 38–1,407 cms, 14–1,407 cms, and 3–1,407 cms, respectively) had substantially lower ranges than the corresponding intervals for 1%, 5%, 10%, 20%, and 50% Qd in the Brazos River (1724–3,398 cms, 903–3,398 cms, 563–3,398 cms, 317–3,398 cms, and 84–3,398 cms, respectively) and the Trinity River (1,492–3,681 cms, 959–3,681 cms, 713–3,681 cms, 402–3,681 cms, and 79–3,681 cms, respectively) (Supplementary Figure S4).
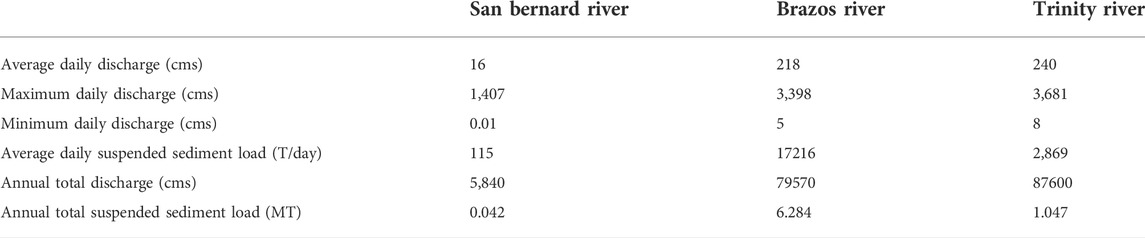
TABLE 1. The average, maximum, and minimum daily discharges, annual total discharge, average daily suspended sediment load, and annual total suspended sediment load for San Bernard, Brazos, and Trinity River from 1960 to 2017.
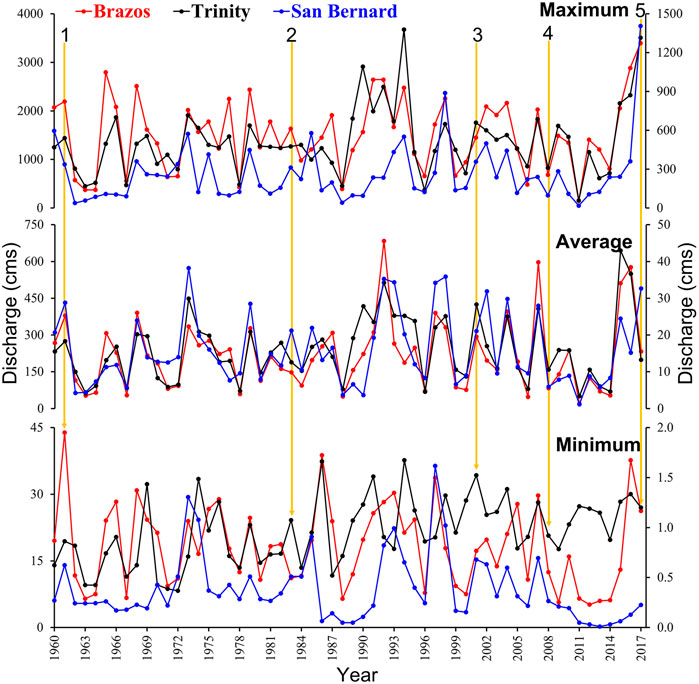
FIGURE 3. The annual average values of the maximum, average and minimum daily discharge in the San Bernard, Brazos, and Trinity River. The scale (Y-axis) for the San Bernard River has been allocated to the right side due to its significantly lower parameters. The numbers 1–5 and arrows point to Hurricane Carla (1961), Alicia (1983), Allison (2001), Ike (2008), and Harvey (2017), respectively.
The seasonal trends in average Qd are highly resembling in the Brazos and Trinity Rivers during the study period. In both rivers, the average Qd reaches its maximum in May (353 cms in Brazos and 374 cms in Trinity). After the decreasing trend from June to August, the average Qd continuously rises again from September to December (109–207 cms in Brazos and 82–260 cms in Trinity) (Figure 4). In the San Bernard River, the average Qd has two peaks in June (23 cms) and September (19 cms), respectively (Figure 4).
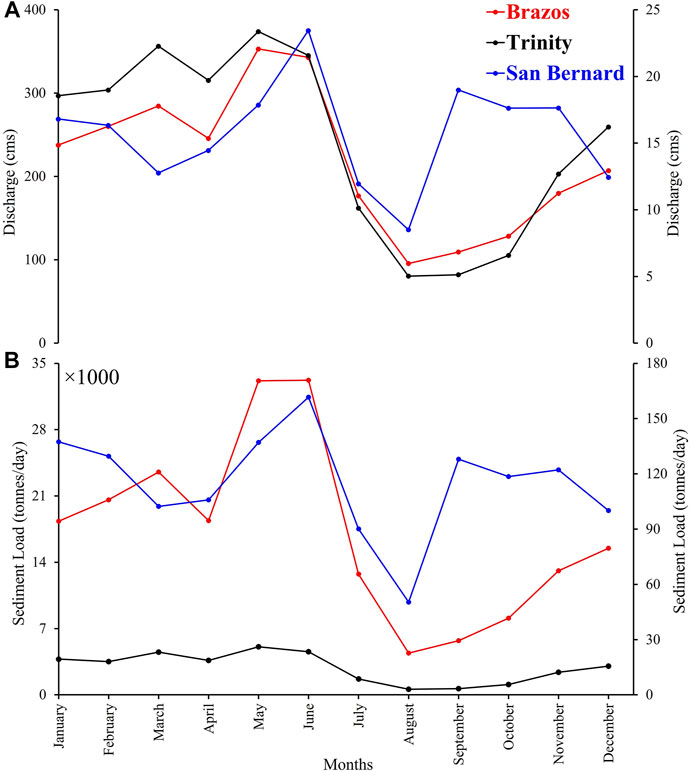
FIGURE 4. Seasonal trends of monthly mean of (A) daily discharge (Qd) and (B) daily sediment loads (DSL) in the San Bernard River, Brazos, and Trinity River during 1960–2017. Seasonal trends of Qd and DSL (Y-axis) for the San Bernard River have been allocated to the right side due to its significantly lower parameters.
The annual total sediment load (ATSL) for the San Bernard, Brazos, and Trinity River (1960–2017) are displayed in Figure 5. The ATSL was the lowest in the San Bernard River at Boling [0.042 million tons (MT)] followed by the Trinity River at Liberty (1.047 MT) and then the Brazos River at Richmond (6.284 MT) during 1960–2017 (Table 1). The seasonal trends in average Daily Sediment load (DSL) are highly resembling in the Brazos and Trinity River during the study period (Figure 4). In both rivers, average DSL reaches its maximum in May (33158 T/day in Brazos and 5074 T/day in Trinity). After the decreasing trend from June to August, the average DSL continuously rises again from September to December (5,728–15477 T/day in Brazos and 662–3023 T/day in Trinity) (Figure 4). In the San Bernard River, the average DSL has two peaks in June (162 T/day) and September (128 T/day) (Figure 4).
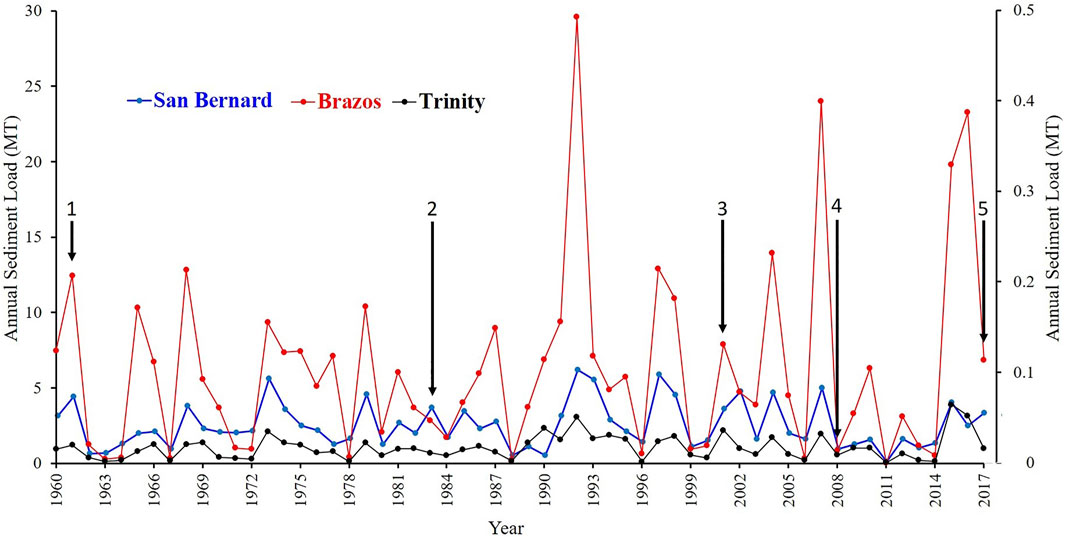
FIGURE 5. The Annual Total Suspended Sediment Loads (ATSL) [in Million Tons (MT)] for the San Bernard, Brazos, and Trinity River. The scale (Y-axis) for the San Bernard River have been allocated to the right side due to its significantly lower parameters. The numbers 1–5 and arrows point to Hurricane Carla (1961), Alicia (1983), Allison (2001), Ike (2008), and Harvey (2017), respectively.
4.2 Discharge conditions and suspended sediment loads during hurricane events
The Total Sediment Load (TSL) at Boling (San Bernard River), Richmond (Brazos River), and Liberty (Trinity River) station (1960–2017) was calculated to be 2.44, 364.45 and 60.75 MT (Table 2). During the study period, the top 1%, 5%, and 10% Qd carried ∼15, 46, and 67% of the TSL in the San Bernard River; ∼18, 55 and 74% of the TSL in the Brazos River; and ∼14, 42, and 63% of the TSL in the Trinity River, respectively. In addition, the top 20% and 50% of the discharge regimes carried the majority of the TSLs in all three rivers, i.e., 85% and 98% of the TSL in the San Bernard River, 90% and 99% of the TSL in the Brazos River, and 84% and 98% of the TSL in the Trinity River (Table 2).
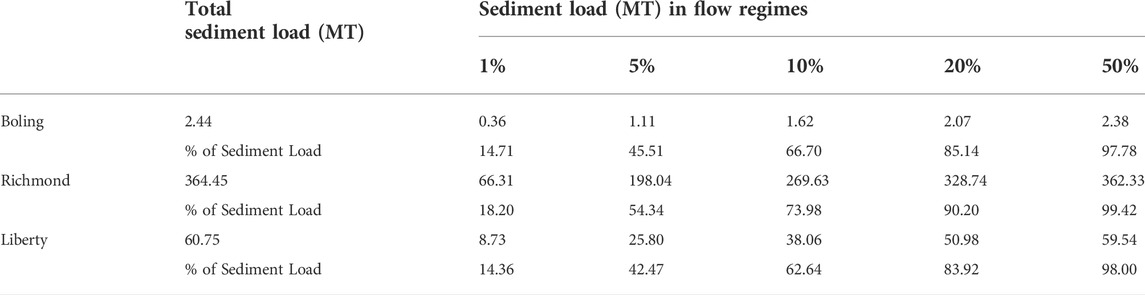
TABLE 2. Sediment load [in Million Tons (MT)] within 1%, 5%, 10%, 20%, and 50% flow regimes at Boling (in the San Bernard River), Richmond (in the Brazos River), and Liberty (in the Trinity River) from 1960 to 2017.
The Peak and daily average Qd and DSL of the three rivers during each of the five storms and during the month of the five storms are listed in Table 3, and the cumulative Qsum and SLsum are listed in Table 4. The daily Qd and DSL trends of the three rivers during the month of the five storms are plotted in Figures 6, 7. Hurricane Harvey is arguably the most powerful flood generating storm over the three rivers during the study period. From 1960 to 2017 (Tables 1, 3), the maximum daily discharge of the San Bernard (1,407 cms) and the Brazos River (3,398 cms) and the second maximum daily discharge of the Trinity River (3,511 cms) were all induced by Hurricane Harvey, while Harry also resulted the highest Qsum and SLsum among the five storms for all three rivers (Table 4). During the calendar month of Hurricane Harvey, the average daily discharge over the three rivers from west to east are 202 cms, 732 and 621 cms (Table 1), respectively, which are 179 cms, 379 and 247 cms higher than the corresponding maximum monthly average (Figure 4A), while the Qsum for San Bernard, Brazos, and Trinity River are 8,461, 29,432, and 24,669 cms, respectively. Also, Hurricane Harvey mobilized substantial amount of sediment. The calendar month average suspended sediment load delivered by San Bernard River, Brazos River and Trinity River during Hurricane Harvey are 700 T/day, 99636 T/day and 14907 T/day (Table 3), while the SLsum for the three rivers are 29,212, 4,165,823, and 619,937 tons, respectively (Table 4). These average daily suspended sediment loads are 538 T/day, 66478 T/day and 9833 T/day higher than the corresponding maximum monthly average (Figure 4B). Under the historical context, the total sediment load delivered during the calendar month of Hurricane Harvey over San Bernard River (21,000 tons), Brazos River (2,989,080 tons) and Trinity River (447,210 tons) took account of 50%, 48% and 43% of the annual average total suspended sediment load (Table 1) of each river, respectively. Over the year of 1960–2017, the average contribution of September to annual total sediment load are 10%, 3.0%, and 2.1% over the San Bernard River, the Brazos River and the Trinity River, respectively. Thus, it can be inferred that Hurricane Harvey has largely modified the seasonal pattern of sediment delivery over the three rivers during 2017.
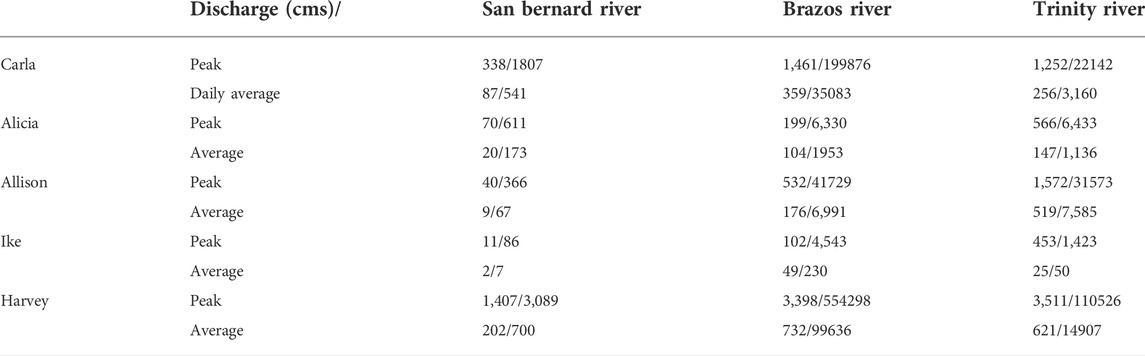
TABLE 3. The Peak and average daily values of discharge and suspended sediment load of the San Bernard, Brazos, and Trinity River during each of the five storms and during the month of the five storms. The red color marks the peak discharge and suspended sediment load during hurricanes that are lower than their 58 years daily average.
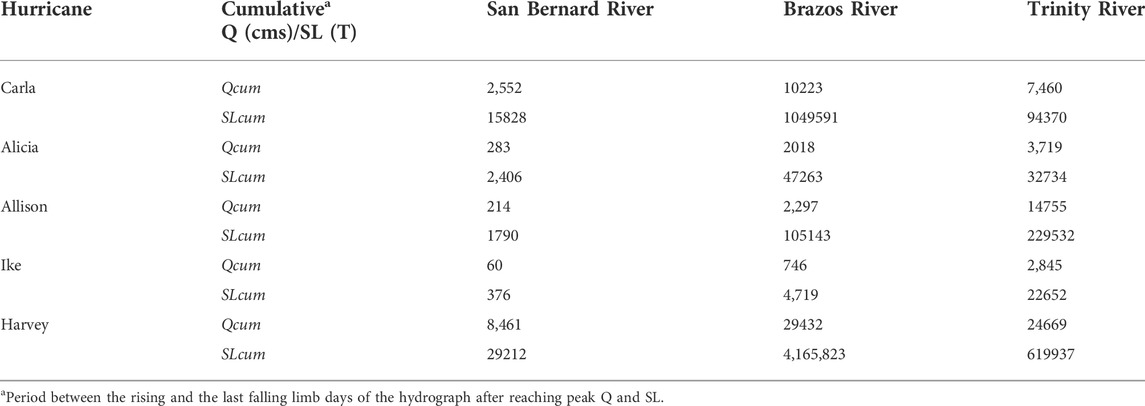
TABLE 4. Cumulative discharge (Q) and sediment load (SL) associated with the five storms for the three studied rivers.
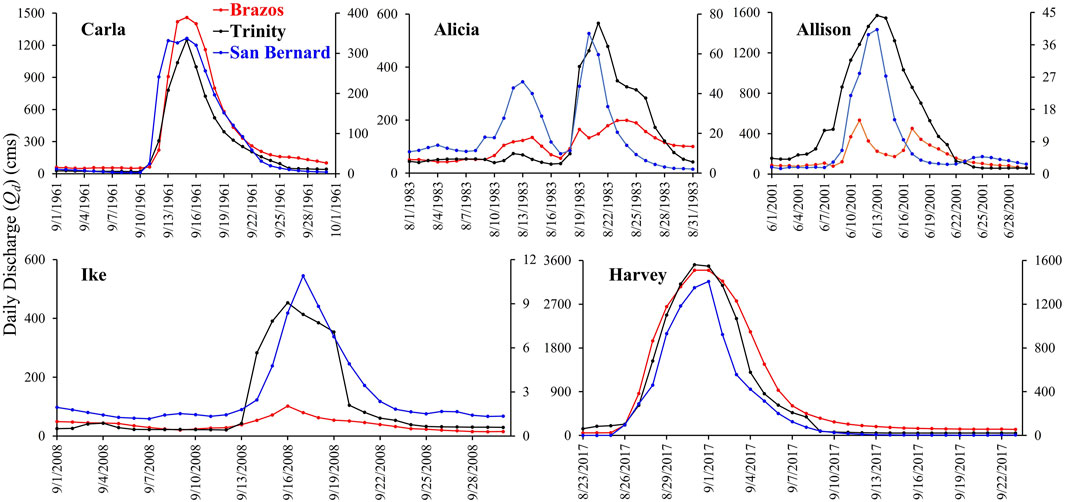
FIGURE 6. Daily discharge (Qd) trends in the San Bernard (at Boling), Brazos (at Richmond) and Trinity (at Liberty) Rivers during the months of occurrence of Carla, Alicia, Allison, Ike and Harvey. The scale (Y-axis) for the San Bernard River have been allocated to the right side due to its significantly lower parameters.
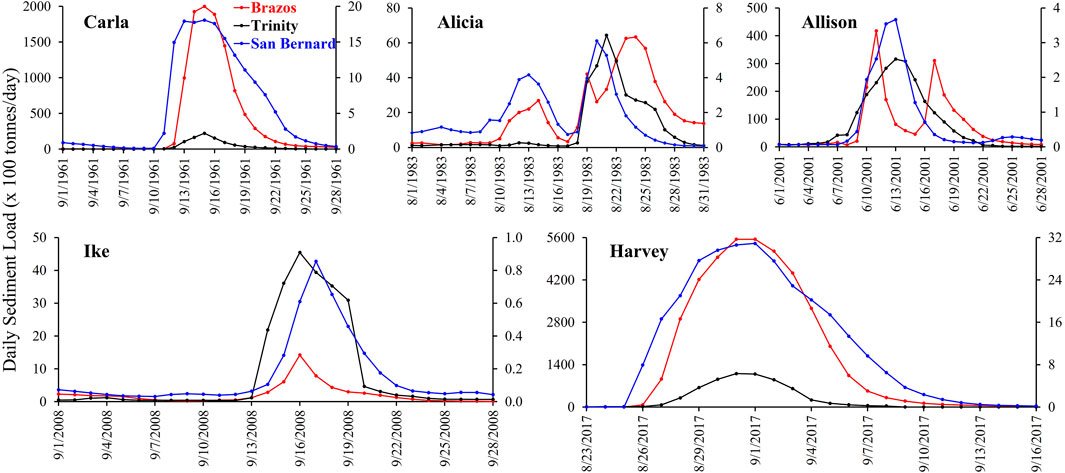
FIGURE 7. Daily sediment load (DSL) trends in the San Bernard (at Boling), Brazos (at Richmond) and Trinity (at Liberty) Rivers during the months of occurrence of Carla, Alicia, Allison, Ike, and Harvey. The scale (Y-axis) for the San Bernard River have been allocated to the right side due to its significantly lower parameters.
On the contrary, Hurricane Ike caused minimal impact on the river discharge and sediment transport over the three rivers. The calendar month average daily discharge over the three rivers during Hurricane Ike (Table 3) are all lower than the corresponding minimum monthly average (Figure 4A). The suspended sediment load delivered by the San Bernard River, the Brazos River and the Trinity River during the calendar month of Hurricane Ike are 7T/day, 230 T/day and 50 T/day, respectively. These average daily suspended sediment loads are 43 T/day, 4176 T/day and 534 T/day lower than the corresponding minimum monthly average (Fig .4 b), respectively. In addition, the sediment delivered during the calendar month of Hurricane Ike accounts for only 0.5%, 0.1%, and 0.1% of the annual average total sediment load over each river, while the Qsum and SLsum were both the lowest in all three rivers (Table 4). Compared to the average contribution of September to the annual total sediment load, the month of Hurricane Ike was far less productive in terms of sediment delivery.
Hurricane Carla was another flooding generating storm with major influences on the San Bernard River and the Brazos River. The Qsum and SLsum record during Carla were the second highest among the five storms in these two rivers (Table 4) The peak discharge over the San Bernard River, the Brazos River and the Trinity River associated with Hurricane Carla (Table 3) are among the maximum 0.5%, 2%, and 3% daily discharge during 1960–2017. The average daily discharge during the calendar month of Hurricane Carla over the San Bernard River and the Brazos River are 64 and 6 cms higher than the corresponding maximum monthly average, respectively (Figure 4A). And the calendar month average daily suspended sediment load delivered through these two rivers are 379 T/day and 1925 T/day higher than the maximum monthly average, respectively (Figure 4B). In terms of monthly sediment load contribution, the sediment delivered during the calendar month of Hurricane Carla over the San Bernard River and the Brazos River are equal to 39 and 17% of the annual average total sediment load, respectively. Similarly, considering the average percent of annual total sediment delivered during September, it is noted that Hurricane Carla largely affected the seasonal pattern of sediment dynamics over the Brazos River and the Trinity River in 1961.
Hurricane Alicia mainly influenced the discharge and sediment dynamics of the San Bernard River during its passage over the study area. The average daily discharge during the calendar month of Hurricane Alicia over San Bernard River (Table 3) was only 3 cms lower than the maximum monthly average (Figure 4A). One hundred and seventy-four tons of sediment were delivered through the San Bernard River during the calendar month of Hurricane Alicia, which was 11 T/day higher than the maximum monthly average (Figure 4B). Monthly, 5,190 tons of sediment was delivered, and it accounts for 12% of the annual average total suspended sediment load (Table 1). On average, 3.8% of annual total suspended sediment load is delivered during August-the month of Hurricane Alicia. In this case, Hurricane Alicia highly influenced the contribution of August to the annual sediment load during the year of 1983. In addition, the Qsum and SLsum associated with Alicia were 283 cms and 2,406 tons for the San Bernard River (Table 4).
Different from the other hurricanes mentioned above, Hurricane Allison occurred in June and mainly impacted the Trinity River. The Qsum and SLsum associated with Allison were 14,755 cms and 229,532 tons for the San Bernard River (Table 4). The peak discharge associated with Hurricane Allison over the Trinity River is among the maximum 1% of the daily discharge. The calendar month average daily discharge during Hurricane Allison (Table 3) is 145 cms higher than the maximum monthly average (Figure 4A). For suspended sediment delivery, 227,550 tons of sediment was delivered during the calendar month of Hurricane Allison, which accounts for 21.8% of the annual average total suspended sediment load (Table 1). However, this amount of sediment is only equal to 10.4% of total suspended sediment load in 2001, which is less than the average contribution of June (the hurricane month, 14.5%). This seemly inconsistency is due to the high productivity of sediment delivery during the year of Hurricane Allison. In this case, although Hurricane Allison seems to be a significant storm in terms of sediment delivery compared to historical average, its significance was attenuated by the high productivity of the entire year. In this case, it might be inferred that the significance of extreme event is downgraded by the long-term controlling factor.
5 Discussion
5.1 Long-term trends of discharge and sediment load in relation to climate variabilities
Overall, our record shows that the San Bernard River had substantially lower average daily discharge (16 cms) and average daily suspended sediment load (115 T/day) than the Brazos (218 cms and 17216 T/day) and Trinity Rivers (240 cms and 2869 T/day) during 1960–2017 (Table 1). This notable difference in average Qd and DSL is likely attributed to the San Bernard River’s (4,800 km2) significantly lower drainage area as compared to the Trinity (40,000 km2) and Brazos (1,18,000 km2) River (Kraus and Lin, 2002). In addition, during the study period, the Trinity and Brazos River had highest average Qd and average DSL, respectively.
Our multi-decadal (1960–2017) discharge and sediment transport record also shows that most of the years with above average discharge and sediment loads coincide with the warmer (El Niño) phases (Figure 8). In particular, the top 5 years (1973, 1998, 1992, 2007, and 2017) with the highest daily Qd and ATSL in all three rivers during the 58 years of study period all coincide with the El Niño phases (NOAA/NWS, 2021) (Figure 8). Moreover, our dataset recorded a number of years with very low discharge and sediment transport in all three rivers during the study period. For example, the average Qd was <10 cms for 22 years in the San Bernard River and <100 cms for 16 and 12 years (out of 58 years) in the Brazos and Trinity Rivers (Figure 3), significantly lower than the average Qd (16, 218, and 240 cms, respectively) in the three rivers for the entire study period (Table 1). The ATSL was <1 MT for 12 and 32 years in the Brazos and Trinity River (Figure 5), also lower than the ATSL (6.284 and 1.047 MT, respectively) in the two rivers for the entire study period (Table 1). In particular, these drought events usually occurred prior to the El Niño phases and most of the Qd and ATSL peaks occurred when episodes of La Niña preceded El Niño events (Figure 8). For example, it is evident that the 1973, 1979, 1992, and 2017 Qd and ATSL peaks all occurred after strong La Niña episodes (Figure 8). Previous studies have documented that La Niña events trigger periods of extreme drought in Texas (Allan et al., 1997; Sarachik and Cane, 2010). These La Niña induced droughts were crucial in pre-conditioning (e.g., removing vegetation) the drainage basin for erosion, hence, facilitating major flooding events during the following El Niño years (Fraticelli, 2006). These findings indicate that our record is in line with previous studies (Rodriguez et al., 2000; Fraticelli, 2006; Carlin and Dellapenna, 2015), and ENSO related climate variability likely has significant impacts on the discharge and sediment transport in the Texas watersheds. Considering the south shifts of the Pacific jet stream during the El Niño phases also sends more tropical storms and hurricanes to the southern states in U.S. (Philander, 1983; Allan et al., 1997), it is reasonable to assume that over a long-term scale, amplified storm activities during the El Niño phases also play a significant role in the overall discharge and sediment transport in coastal rivers along the northern GOM.
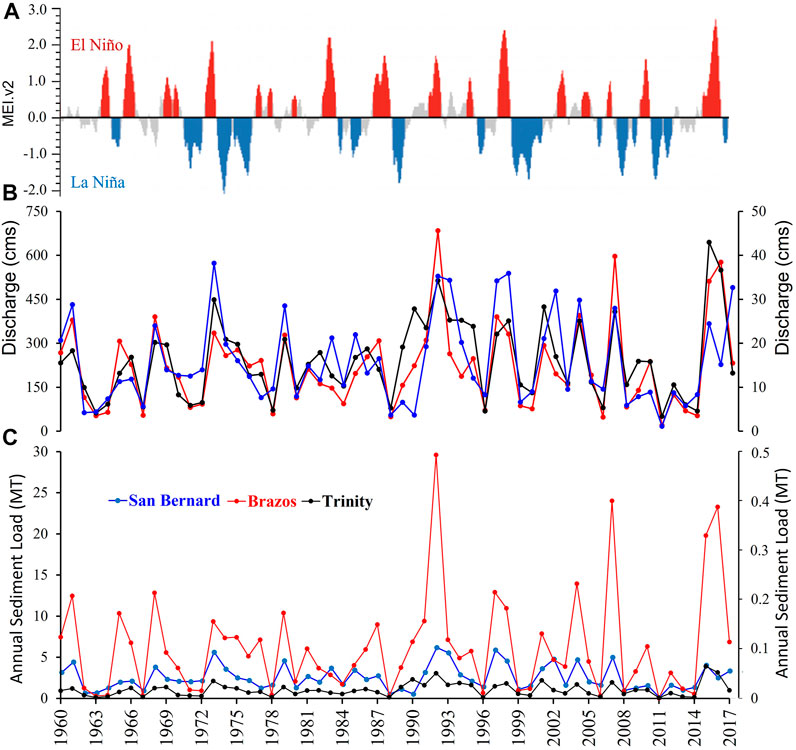
FIGURE 8. Multi-decadal record of the Multivariate ENSO Index (NOAA/NWS, 2021) (A), Daily discharge (B), and Annual Total Suspended Sediment Loads of the three rivers (C).
5.2 Seasonal variability and precipitation distribution
Seasonal variability of the river discharge and sediment load exhibit two distinct patterns over the three rivers. For the Brazos River and the Trinity River, river discharge and sediment load peaked in May and June while fell to minimum during July to September. Meanwhile for the San Bernard River, monthly river discharge and sediment load are characterized with two peaks-one in June and the other in September. These signatures are tied to the seasonal precipitation distribution over the drainage area of each river.
Figure 9A shows the drainage basins of the three rivers along with the climate divisions of Texas divided by the National Climatic Data Center. As one of Texas’ largest rivers, the Brazos River drains mainly through six climate divisions, which are 1) the High Plains, 2) the Low Rolling Plains, 3) the Cross Timbers, 4) the Piney Woods, 5) Gulf Coastal Plains, and 6) the Post Oak Savanna. Along the mainstream and the tributary of the Brazos Rivers, dams have been built for different purposes. The most downstream dam on the mainstem of the Brazos River is the Whitney Lake Dam, which provides flood control for the watershed. In this context, the discharge at the Richmond gage of the Brazos River (Figure 9A) should be mainly controlled by the precipitation characteristics downstream from the Whitney Lake Dam, which includes climate division 3, 4, and 6. As is shown in Figure 9B (3, 4, and 6), the monthly precipitation over division four are in general higher than that of division 3 and 6, indicating its overall larger influence on the river discharge downstream. Its monthly precipitation distribution, with maximum in May and minimum in August, resembles that of the river discharge and suspended sediment load at Richmond Brazos River. These findings indicate that the precipitation regime over the Piney Woods climatic division is the primary control over the discharge and sediment load at the most downstream of Brazos River at seasonal scale. Similarly, it can be inferred that the seasonal variability of river discharge and sediment load in the Trinity River are also controlled by the precipitation in thePiney Woods climatic division.
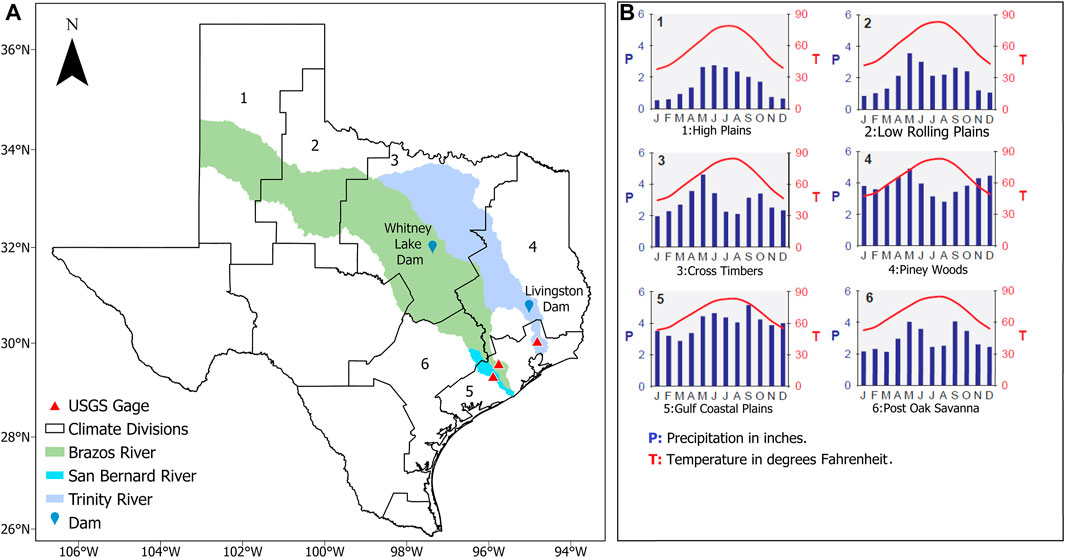
FIGURE 9. (A) The drainage river basin of the San Bernard River (blue), the Brazos River (green) and the Trinity River (purple) overlying with the six climate divisions divided by the National Climatic Data Center. The three USGS Gages used in this study are shown with red triangle. The two most downstream dams at the mainstem of the Brazos River (the Whitney Lake Dam) and the Trinity River (the Livingston Dam) are shown in dark blue marker (B) Monthly average precipitation and temperature adapted from (Vaughan et al., 2012).
Compared to the Brazos River and the Trinity River, the drainage basin of the San Bernard River is much smaller and lies entirely in the coastal area of Texas. As is shown in Figure 9B, the seasonal precipitation of the two climate divisions (the Gulf Coastal Plains and the Post Oak Savanna) that the San Bernard River passes (Figure 9A) exhibit similar characteristics with bi-peak shape. Thus, the precipitation regime controls the river discharge and sediment dynamics of the San Bernard River, which exhibit similar seasonal variability (Figure 4A,B).
5.3 Effect of hurricane in relation to climactic background and rainfall characteristics
Our results suggest that the influence of hurricanes on river discharge and sediment dynamics can be highly varied. For the hurricane events studied here, Hurricane Harvey exerted significant influence on all three rivers, while Hurricane Alicia and Allison mainly affect a small region or one single watershed. Moreover, Hurricane Ike had minimal effect over the study area. In this section, based on the available data, we selected Hurricane Harvey, Ike and Allison, to unravel the hydroclimatic and hydrometeorological factors controlling the influence of hurricanes on the sediment dynamic and river discharge of coastal rivers.
Figure 10 shows the accumulative rainfall associated with Hurricane Harvey 1), Hurricane Ike 2) and tropical storm Allison 3). The data used to generate the map is from the Phase two of the North American Land Data Assimilation System, which has been used by researchers to investigate hurricane induced flooding (e.g., Villarini et al., 2011; Yin et al., 2021). Here, we focused mainly on the coastal area where the hurricanes dropped most of rainfall. As the single largest extreme rainfall event over an area of 50,000 km2 and a duration of 4 days (Kunkel and Champion, 2019). Hurricane Harvey delivered historical amount of rainfall over the coastal area that drained by all three studied rivers (Figure 10A). This torrential amount of rainfall thus caused extreme flood and substantial amount of sediment delivery over the study area as mentioned in Section 4.2. On the contrary, the amount of rainfall brought by Hurricane Ike is much lower and dropped mainly over areas outside of the drainage basin of the three rivers (red rainfall center in Figure 10B). This finding explains the minimal influence of Hurricane Ike on the river discharge and sediment dynamics over the study area. The connection between sediment discharge and accumulative rainfall agrees with the precious study on tropical cyclone induced sediment transport (Chen et al., 2018). Moreover, for tropical storm Allision, although it brought a large amount of rainfall over the study area, the rainfall center mainly located at the east of the drainage basins of the three rivers (Figure 10C). Thus, Allision’s rainfall only exerted large influence on the discharge and sediment transport over the Trinity River. These findings highlight the importance of not only the total amount of rainfall, but also its spatial distribution on the sediment dynamics of the areas affected.
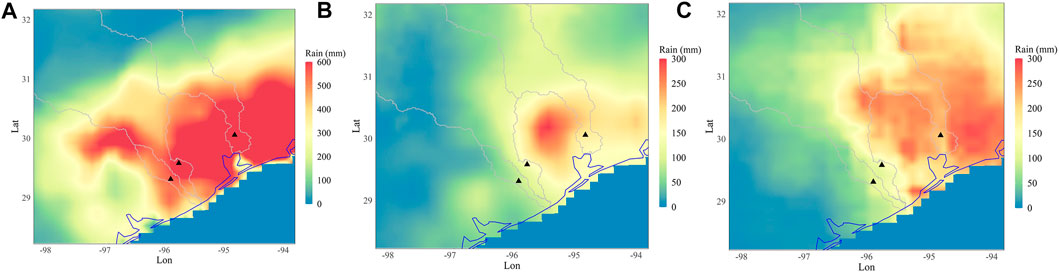
FIGURE 10. The accumulative rainfall during (A) Hurricane Harvey (08/25/2017–09/04/2017), (B) Hurricane Ike (09/05/2008–09/15/2008) and (C) tropical storm Allison (06/05/2001–06/18/2001). The rainfall data is from the Phase two of the North American Land Data Assimilation System. The grey line indicates the area drained by the three rivers while the coastal line is shown in blue. The three USGS gages are shown as the black triangles.
Furthermore, as shown in Figures 3, 5, the year of 2007, a year before Hurricane Ike made landfall, was a peak year in terms of river discharge and sediment delivery. This finding indicates that the sediment load over the drainage basin might have been depleted temporarily in 2007, making the erosive threshold higher for the rainfall in the falling year to cause significant amount of sediment delivery. This finding is also validated by the case of Hurricane Harvey. Given the historical amount of rainfall Hurricane Harvey brought to this region, the annual sediment load of the year of 2017 is much lower than that of 2016. The most plausible explanation is that the period of drought between 2010 and 2015 have likely conditioned the drainage basins prior to the flood in 2016. Consequently, the 2016 flood transported the majority of erodible sediments out of the basins. This drought-flood cycle and its control on sediment delivery are in line with findings documented by previous studies (Rodriguez et al., 2000; Fraticelli, 2006; Yellen et al., 2014; Carlin and Dellapenna, 2015). Thus, it is reasonable to conclude that the magnitude of hurricane impacts on the overall discharge and suspended sediment load is regulated by the amount and spatial distribution of the rainfall, as well as the coupled drought-flood cycle in relation to the intensity of ENSO.
6 Conclusion
This study presents a comprehensive analysis of the discharge and sediment transport in the San Bernard, Brazos, and Trinity River from the Texas coast during 1960–2017 in relation to its controlling factors at annual, seasonal and event scales. At long-term scale, the discharge and associated sediment transport of the three coastal rivers in this study is controlled by the drought-flood cycle associated with ENSO. The years of peak annual total suspended sediment load were all preceded by drought years induced by La Niña. Seasonally, the trend of discharge and sediment transport is influenced by the rainfall distribution over the climatic division that the drainage basin include. Hurricanes can exert highly varied influences on the river discharge and sediment dynamics over the coastal river basins. Such difference influences are dependent on the spatial distribution and total amount of rainfall associated and modulated by the climatic context (wet or dry year) when the hurricane occurred. The findings in our study aligns with previous studies regarding the control of drought-flood cycle on long-term sediment delivery (Rodriguez et al., 2000; Fraticelli, 2006; Carlin and Dellapenna, 2015), the impact of extreme tropical cyclone on the flood and sediment dynamics (Turner et al., 2006; Yellen et al., 2014; Chen et al., 2018, 2020), and also provide new insight into the role of hurricanes under different climatic condition. Such information can be beneficial towards coastal river and sediment management in alluvial rivers globally. In addition, our findings on the hurricane induced sediment transport in the San Bernard, Brazos and Trinity River can have important implications in selecting suitable sediment coring sites near coastal rivers, which are the principal repositories of the biological, chemical and sedimentological proxies used in paleotempestology (Yao et al., 2018; 2020a).
Data availability statement
The datasets presented in this study can be found in online repositories. The names of the repository/repositories and accession number(s) can be found in the article/Supplementary Material.
Author contributions
QY designed the study and wrote the paper. SJ led the data collection, analysis, and contributed to writing and editing. K-BL directed the project and fieldwork and contributed to data interpretation, writing, and editing. ER assisted in fieldwork, data interpretation, writing, and editing. DY contributed to data interpretation, writing and editing.
Funding
This research was supported by the U.S. National Science Foundation (NSF RAPID Grant # EAR-1803035 and Grant #1759715).
Acknowledgments
The authors are solely responsible for the statements, findings, and conclusion of this study and do not necessarily reflect the views of the funding agencies. The authors also thank the United States Geological Survey for making the long-term river discharge, and sediment records of the San Bernard, Brazos and Trinity River available for this study.
Conflict of interest
The authors declare that the research was conducted in the absence of any commercial or financial relationships that could be construed as a potential conflict of interest.
Publisher’s note
All claims expressed in this article are solely those of the authors and do not necessarily represent those of their affiliated organizations, or those of the publisher, the editors and the reviewers. Any product that may be evaluated in this article, or claim that may be made by its manufacturer, is not guaranteed or endorsed by the publisher.
Supplementary material
The Supplementary Material for this article can be found online at: https://www.frontiersin.org/articles/10.3389/feart.2022.886614/full#supplementary-material
SUPPLEMENTARY FIGURE S1 | Comparison of measured sediment loads (SL) calculated from sediment concentration records provided by USGS with the sediment loads estimated from either polynomial (Poly) or linear rating curves (predicted SL) at Boling in the San Bernard River during 1978–2002. Here, Duan correction factors were applied for the curves denoted by “CF” in the figure ), while the remaining curves denoted by “No CF” in the figure were analyzed without correction factors (A,B).
SUPPLEMENTARY FIGURE S2 | Comparison of measured sediment loads (SL) calculated from sediment concentration records provided by USGS with the sediment loads estimated from either polynomial (Poly) or linear rating curves (predicted SL) at Richmond in the Brazos River during 1966–1995. Please refer to Figure 2 for definition of specific terminologies pertaining to parts of this figure, i.e., Linear, Poly, CF, and No CF.
SUPPLEMENTARY FIGURE S3 | Comparison of measured sediment loads (SL) calculated from sediment concentration records provided by USGS with the sediment loads estimated from either polynomial (Poly) or linear rating curves (predicted SL) at Liberty in the Trinity River during 2012–2017. Please refer to Figure 2 for definition of specific terminologies pertaining to parts of this figure, i.e., Linear, Poly, CF, and No CF.
SUPPLEMENTARY FIGURE S4 | Flow duration curves for the three rivers: San Bernard (at Boling), Brazos (at Richmond), and Trinity (at Liberty) during 1960–2017.
SUPPLEMENTARY TABLE S1 | Discharge-suspended sediment load rating curves developed for the three locations in the three rivers: Boling (in the San Bernard River), Richmond (in the Brazos River) and Liberty (in the Trinity River). Here, ln (Qd) is the independent variable and ln (DSL) is the dependent variable.
SUPPLEMENTARY TABLE S2 | Root mean square errors (RMSEs) (tonnes) of Daily Sediment Loads (DSL) predicted through discharge-sediment load rating curves (as shown in Table 1) for each period at the locations: Boling (in the San Bernard River), Richmond (in the Brazos River) and Liberty (in the Trinity River). Here, SE is the standard error and CF-Poly is the Duan correction factor used in polynomial rating curves, while CF-Lin is the Duan correction factor used in linear rating curves. “No CF” represents DSLs calculated without applying correction factors during their retransformation from predicted ln DSLs while “CF” represents DSLs calculated by applying the correction factors during the retransformation procedure.
References
Allan, R., Lindesay, J., and Parker, D. (1997). El Nino southern oscillation and climatic variability. Oceanogr. Lit. Rev. 6 (44), 555.
Bianchette, T. A., Liu, K. B., Qiang, Y., and Lam, N. S. N. (2015). Wetland accretion rates along coastal Louisiana: Spatial and temporal variability in light of hurricane isaac’s impacts. Water 8, 1. 2016. doi:10.3390/W8010001
Carlin, J. A., and Dellapenna, T. M. (2015). The evolution of a subaqueous delta in the anthropocene: A stratigraphic investigation of the Brazos River delta, TX USA. Cont. Shelf Res. 111, 139–149. doi:10.1016/J.CSR.2015.08.008
Chen, C. W., Oguchi, T., Hayakawa, Y. S., Saito, H., Chen, H., Lin, G. W., et al. (2018). Sediment yield during typhoon events in relation to landslides, rainfall, and catchment areas in Taiwan. Geomorphology 303, 540–548. doi:10.1016/j.geomorph.2017.11.007
Chen, C. Y., Willett, S. D., West, A. J., Dadson, S., Hovius, N., Christl, M., et al. (2020). The impact of storm-triggered landslides on sediment dynamics and catchment-wide denudation rates in the southern Central Range of Taiwan following the extreme rainfall event of Typhoon Morakot. Earth Surf. Process. Landforms 45, 548–564. doi:10.1002/esp.4753
D’Sa, E. J., Joshi, I., and Liu, B. (2018). Galveston Bay and coastal ocean optical-geochemical response to hurricane Harvey from VIIRS ocean color. Geophys. Res. Lett. 45 (10), 10579–10589. doi:10.1029/2018GL079954
Duan, N. (1983). Smearing estimate—a nonparametric retransformation method. J. Am. Stat. Assoc. 78, 605–610. doi:10.1080/01621459.1983.10478017
Dunn, D. D., and Raines, T. H. (2001). Indications and potential sources of change in sand transport in the Brazos River, Texas (Vol. 1, No. 4057). Washington, DC: US Department of the Interior, US Geological Survey.
Durbin, J., and Watson, G. S. (1950). Testing for serial correlation in least squares regression. I. Biometrika 37, 409–428. doi:10.1093/BIOMET/37.3-4.409
Durbin, J., and Watson, G. S. (1951). Testing for serial correlation in least squares regression. II. Biometrika 38, 159–178. doi:10.1093/BIOMET/38.1-2.159
Durbin, J., and Watson, G. S. (1971). Testing for serial correlation in least squares regression.III. Biometrika 58, 1–19. doi:10.1093/BIOMET/58.1.1
Farfán, L. M., D’Sa, E. J., Liu, K. biu, and Rivera-Monroy, V. H. (2014). Tropical cyclone impacts on coastal regions: The case of the yucatán and the baja California peninsulas, Mexico. Estuaries Coasts 37, 1388–1402. doi:10.1007/s12237-014-9797-2
Fraticelli, C. M. (2006). Climate forcing in a wave-dominated delta: The effects of drought–flood cycles on delta progradation. J. Sediment. Res. 76, 1067–1076. doi:10.2110/JSR.2006.097
Gray, A. B., Pasternack, G. B., Watson, E. B., Warrick, J. A., and Goñi, M. A. (2015). Effects of antecedent hydrologic conditions, time dependence, and climate cycles on the suspended sediment load of the Salinas River, California. J. Hydrol. X. 525, 632–649. doi:10.1016/J.JHYDROL.2015.04.025
Hodge, J., and Williams, H. (2016). Deriving spatial and temporal patterns of coastal marsh aggradation from hurricane storm surge marker beds. Geomorphology 274, 50–63. doi:10.1016/J.GEOMORPH.2016.09.005
Joshi, S., Xu, , Jun, Y., and Jun, X. Y. (2018). Recent changes in channel morphology of a highly engineered alluvial river-the Lower Mississippi River. Phys. Geogr. 39, 140–165. doi:10.1080/02723646.2017.1340027
Joshi, S., and Xu, Y. J. (2015). Assessment of suspended sand availability under different flow conditions of the lowermost Mississippi River at tarbert landing during 1973–2013. Water 7, 7022–7044. doi:10.3390/W7126672
Joshi, S., and Xu, Y. J. (2017). Bedload and suspended load transport in the 140-km reach downstream of the Mississippi river avulsion to the atchafalaya river. Water 9, 716. doi:10.3390/W9090716
Kraus, N. C., and Lin, L. (2002). Coastal processes study of the san Bernard River mouth, Texas: Stability and maintenance of the mouth. Technical Report ERDC/CHL-02-10. Vicksburg, MS: U.S. Army Engineer Research and Development Center, Coastal and Hydraulics Laboratory, 87.
Kunkel, K. E., and Champion, S. M. (2019). An assessment of rainfall from hurricanes Harvey and florence relative to other extremely wet storms in the United States. Geophys. Res. Lett. 46, 13500–13506. doi:10.1029/2019GL085034
Liu, K. B., McCloskey, T. A., Bianchette, T. A., Keller, G., Lam, N. S. N., Cable, J. E., et al. (2014). Hurricane Isaac storm surge deposition in a coastal wetland along Lake Pontchartrain, southern Louisiana. J. Coast. Res. 70, 266–271. doi:10.2112/SI70-045.110.2112/SI70-045.1
McKee, K. L., and Cherry, J. A. (2009). Hurricane Katrina sediment slowed elevation loss in subsiding brackish marshes of the Mississippi River delta. Wetl. Wilmingt. 29, 2–15. doi:10.1672/08-32.1
NOAA (2021). National Oceanic and Atmospheric (NOAA) online storm events database. Available at: https://www.ncdc.noaa.gov/stormevents/ (Last accessed 09 20, 2021).
NOAA/NWS (2021). National oceanic and atmospheric (NOAA)/national weather service (NWS). Available at: https://origin.cpc.ncep.noaa.gov/products/analysis_monitoring/ensostuff/ONI_v5.php (Last accessed: 04 10, 2021).
Philander, S. G. H. (1983). El Nino southern oscillation phenomena. Nature 302 (5906), 295–301. doi:10.1038/302295a0
Phillips, J. D., Slattery, M. C., and Musselman, Z. A. (2004). Dam-to-delta sediment inputs and storage in the lower trinity river, Texas. Geomorphology 62, 17–34. doi:10.1016/J.GEOMORPH.2004.02.004
Rodriguez, A. B., Hamilton, M. D., and Anderson, J. B. (2000). Facies and evolution of the modern brazos delta, Texas: Wave versus flood influence. J. Sediment. Res. 70, 283–295. doi:10.1306/2DC40911-0E47-11D7-8643000102C1865D
Ropelewski, C. F., and Halpert, M. S. (1987). Global and regional scale precipitation patterns associated with the El Niño/Southern Oscillation. Mon. Weather Rev. 115 (8), 1606–1626. doi:10.1175/1520-0493(1987)115<1606:garspp>2.0.co;2
Roth, D. (2010). Technical report: Texas hurricane history. Camp Springs, MD: National Weather Service, 80.
Sadeghi, S. H. R., Mizuyama, T., Miyata, S., Gomi, T., Kosugi, K., Fukushima, T., et al. (2008). Development, evaluation and interpretation of sediment rating curves for a Japanese small mountainous reforested watershed. Geoderma 144, 198–211. doi:10.1016/J.GEODERMA.2007.11.008
Sarachik, E. S., and Cane, M. A. (2010). The El Nino-southern oscillation phenomenon. Cambridge University Press.
Stewart, S. R. (2001). Tropical cyclone report: Tropical storm Allison. National Hurricane Center. Available at: https://www.nhc.noaa.gov/data/tcr/AL012001_Allison.pdf (Last accessed 0807, 2021).
Taha, Z. P., and Anderson, J. B. (2008). The influence of valley aggradation and listric normal faulting on styles of river avulsion: A case study of the Brazos River, Texas, USA. Geomorphology 95, 429–448. doi:10.1016/J.GEOMORPH.2007.07.014
Trenberth, K. E., Cheng, L., Jacobs, P., Zhang, Y., and Fasullo, J. (2018). Hurricane Harvey links to ocean heat content and climate change adaptation. Earth's. Future 6, 730–744. doi:10.1029/2018EF000825
Turner, R. E., Baustian, J. J., Swenson, E. M., and Spicer, J. S. (2006). Wetland sedimentation from hurricanes katrina and rita. Sci. (80-) 314, 449–452. doi:10.1126/SCIENCE.1129116/SUPPL_FILE/1129116-TURNER-SOM.PDF
Tweel, A. W., and Turner, R. E. (2012). Landscape-scale Analysis of wetland sediment deposition from four tropical cyclone events. PLoS One 7, e50528. doi:10.1371/JOURNAL.PONE.0050528
Vaughan, E. G., Crutcher, J. M., Labatt III, T. W., McMahan, L. H., Bradford, B. R., and Cluck, M. (2012). Water For Texas. Austin, TX: Texas Water Development Board.
Villarini, G., Smith, J. A., Baeck, M. L., Marchok, T., and Vecchi, G. A. (2011). Characterization of rainfall distribution and flooding associated with U.S. landfalling tropical cyclones: Analyses of Hurricanes Frances, Ivan, and Jeanne (2004). J. Geophys. Res. 116, 16175. doi:10.1029/2011JD016175
Wang, S. Y. S., Zhao, L., Yoon, J. H., Klotzbach, P., and Gillies, R. R. (2018). Quantitative attribution of climate effects on Hurricane Harvey’s extreme rainfall in Texas. Environ. Res. Lett. 13, 054014. doi:10.1088/1748-9326/AABB85
Wellmeyer, J. L., Slattery, M. C., and Phillips, J. D. (2005). Quantifying downstream impacts of impoundment on flow regime and channel planform, lower Trinity River, Texas. Geomorphology 69, 1–13. doi:10.1016/J.GEOMORPH.2004.09.034
Xia, M., Xie, L., Pietrafesa, L. J., and Peng, M. (2008). A numerical study of storm surge in the cape fear river estuary and adjacent coast. J. Coast. Res. 24, 159–167. doi:10.2112/06-0795.1
Yao, Q., Liu, K. B., and Ryu, J. H. (2018). Multi-proxy characterization of hurricanes rita and Ike storm deposits in the rockefeller wildlife refuge, southwestern Louisiana. J. Coast. Res. 85 (1), 841–845. doi:10.2112/si85-169.1
Yao, Q., Liu, K. B., Williams, H., Joshi, S., Bianchette, T. A., Ryu, J., et al. (2020a). Hurricane Harvey storm sedimentation in the San Bernard national wildlife refuge, Texas: Fluvial versus storm surge deposition. Estuaries Coasts 43 (5), 971–983. doi:10.1007/s12237-019-00639-6
Yao, Q., Liu, K.-B., Rodrigues, E., Bianchette, T., Aragón-Moreno, A. A., and Zhang, Z. A. (2020b). Geochemical record of late-holocene hurricane events from the Florida everglades. Water Resour. Res. 56, e2019WR026857. doi:10.1029/2019WR026857
Yellen, B., Woodruff, J. D., Kratz, L. N., Mabee, S. B., Morrison, J., and Martini, A. M. (2014). Source, conveyance and fate of suspended sediments following Hurricane Irene. New England, USA. Geomorphology 226, 124–134. doi:10.1016/j.geomorph.2014.07.028
Keywords: hurricanes, river discharge, gulf of Mexico, enso, sediment load, rainfall
Citation: Yao Q, Joshi S, Liu K-B, Rodrigues E and Yin D (2022) A multi-decadal analysis of river discharge and suspended sediment load in three Texas coastal rivers in relation to hurricanes, seasonal rainfall, and ENSO. Front. Earth Sci. 10:886614. doi: 10.3389/feart.2022.886614
Received: 01 March 2022; Accepted: 23 August 2022;
Published: 23 September 2022.
Edited by:
Wouter Buytaert, Imperial College London, United KingdomReviewed by:
Joseph Carlin, California State University, Fullerton, United StatesKui Wang, Zhejiang University, China
Copyright © 2022 Yao, Joshi, Liu, Rodrigues and Yin. This is an open-access article distributed under the terms of the Creative Commons Attribution License (CC BY). The use, distribution or reproduction in other forums is permitted, provided the original author(s) and the copyright owner(s) are credited and that the original publication in this journal is cited, in accordance with accepted academic practice. No use, distribution or reproduction is permitted which does not comply with these terms.
*Correspondence: Sanjeev Joshi, c2pvc2hpQGNyaXRmYy5vcmc=