 Bi-Wen Zhang
 Kai Fang1,2*
- 1College of Energy and Mining Engineering, Shandong University of Science and Technology, Qingdao, China
- 2Mine Disaster Prevention and Control-Ministry of State Key Laboratory Breeding Base, Shandong University of Science and Technology, Qingdao, China
- 3Research Center for Rock Burst Control, Shandong Energy Group Co., Ltd., Jinan, China
Constant stiffness confining condition seems more reasonable than constant stress confining condition to simulate the actual confining stress environment of in situ rock which varies with the lateral strain. Compression tests of sandstone samples with two different confining conditions were conducted to study the energy evolution characteristics of rock under constant stress confining condition and constant stiffness confining condition. Except for the conventional triaxial compression tests, CFRP-confined rock samples were also used to simulate the constant stiffness confinement of the rock specimen in the laboratory. The stress–strain curve and failure mode of the samples under different confining conditions were compared. The influence of confining condition on the characteristics of rock energy evolution was investigated. The results show that the stress–strain curves under the confining conditions of constant stress and constant stiffness exhibited strain softening and strain hardening, respectively. Under constant stress confining condition, the specimen failed in the ductile mode while the specimen exhibited a sudden and brittle failure behavior under constant stiffness confining condition. The evolution trend of the elastic strain energy was greatly affected by the magnitude of confining stiffness. The elastic strain energy of the specimen under low stiffness confining condition decreased slightly after reaching its peak. As the confining stiffness increased, the elastic strain energy would not decrease but continued to increase until the failure of the specimen. The maximum elastic strain energy under the confining condition of the high confining stiffness is greater than that of constant stress. Considering the influence of confining stiffness on the storage and release of the strain energy, to obtain the true mechanical behavior of the rock mass under confining conditions, stiffness confining conditions should be taken into consideration in the laboratory.
Introduction
In deep underground rock mass engineering, engineering activities can induce severe rock failure of the surrounding rock masses due to the release of strain energy stored in the rocks (Ma et al., 2020; Yu et al., 2022). The mechanical behavior of the rock mass is an important factor affecting the failure mechanism. Due to high confining stress in situ, the mechanical characteristics of deep rock are significantly different from those of shallow rock (Xie H. P. et al., 2021). The mechanical behavior of rock under confining conditions is a critical topic concerned in engineering. In previous studies, scholars investigated rock under different lateral pressures to simulate the confining environment in situ (Li et al., 1999; Chen and Feng, 2006; Zhang and Zhao, 2014). Triaxial loading tests are the most common laboratory method and the mechanical behavior of rock under constant confining stress has been widely investigated by means of laboratory tests and numerical modeling (Fang et al., 2019; Liu et al., 2020; Xie H. et al., 2021). However, for the in situ rock, its constraints come from the surrounding rock mass, and the confining stresses are not fixed during the deformation and failure process. When the rock deforms outward, it will squeeze the surrounding rock mass, and the confining stress will increase accordingly. It means that the confining stress is dependent on the lateral strain of the rock. The confining condition can be regarded as a constant confining stiffness condition. For the laboratory test, a constant stiffness confining condition seems more reasonable than constant stress confining condition to simulate the actual confining environment.
The mechanical behavior of the rock is driven by the evolution and release of energy (Xie et al., 2009; Bagde and Petroš, 2009; Feng et al., 2022). Energy evolution can better describe the deformation and failure mechanisms of the rock (Wang and Cui, 2018; Jia et al., 2019; Zhang et al., 2021). Some researchers have carried out studies to analyze the energy evolution characteristics of the rock under various confining pressures (Peng et al., 2014; Zhang and Gao, 2015; Meng et al., 2022). Li et al. (2017) studied the characteristics of energy evolution and dissipation during hard rock during triaxial failure with different loading and unloading paths. Huang and Li (2014) studied the conversion characteristics of strain energy with conventional triaxial unloading tests at different unloading rates and initial confining pressures. The results show that the confining pressure has a significant influence on the energy evolution of rock. Increases in the confining pressures can improve cumulative strain energy density and effectively limit the energy dissipation and release due to fracture or failure of the rock. However, most of the research to date has focused on the mechanical behavior and energy evolution of rock under constant confining stress. Few studies have been conducted to explore the mechanism of the energy evolution of rock under constant confining stiffness. Tests on the concrete showed that axial stress–strain curves under constant confining stiffness were obviously different from those under constant confining stress (Dong et al., 2015). The stiffness of the loading system has also been proven to have an important impact on the energy release of the rock (Feng et al., 2014; Wang and Kaunda, 2019). Therefore, the influence of confining stiffness on the evolution and release of the rock strain energy is a critical issue that should be further clarified.
In this study, compression tests of sandstone samples with different confining conditions were conducted to study the energy evolution characteristics of rock under constant confining stiffness and constant confining stress. Except for the conventional triaxial compression tests, CFRP-confined rock samples were also used to simulate the constant confining stiffness of the rock in the laboratory. The stress–strain curve and failure mode of the samples under different confining conditions were compared. The influence of confining condition on the characteristics of rock energy evolution was investigated.
Stiffness Confining Condition
In order to simulate the confining conditions with different constant stiffness, fiber-reinforced polymer (FRP) was used as the confining material to form the FRP jackets in the hoop direction of the specimen. FRP materials have high tensile strength and deformation modulus, and it has been widely used as confining materials for concrete structures to improve the performance of the concrete building (Lam and Teng, 2004; Jiang and Teng., 2007). Due to their ultra-high ductility and strength, FRP materials could provide a substantially constant confining stiffness for the test rock core (Dong et al., 2015). Different confining stiffness of rock samples can be achieved by overlapping FRP materials with different layers.
The following analytical model can be used to quantify the confining stiffness provided by FRP when the fibers of the FRP are wrapped in the hoop direction. As shown in Figure 1, considering the equilibrium condition in the in-plane direction of the rock core section, the confining stress in the rock core can be calculated as follows:
where

FIGURE 1. Analytical model of confining stiffness of FRP.
Assuming that the FRP is linearly elastic until rupture, its stress–strain relation can be written as follows:
where
Considering the compatibility condition in the in-plane direction of the rock core section, the strain of the FRP is equal to the circumference strain of the rock core,
Substituting Eq. 2 and Eq. 3 into Eq. 1, an expression between the confining stress and the confining strain can be obtained as follows:
The structural confining stiffness of the FRP jacket can be calculated as the ratio of confining stress to the confining strain. It can be evaluated as in the following equation:
Based on Eq.5, the specific confining stiffness corresponding to different layers of the FRP jacket can be calculated. For the convenience of the following discussion, confining stiffness can be normalized by the elastic modulus of the rock core sample. A new parameter, confining stiffness ratio, can be introduced as in the following equations:
where
It can be found that confining stiffness is directly proportional to the thickness of the FRP material. Different confining stiffness can be achieved conveniently by different layers of fiber jackets. Several types of FRP have been used in practice. In the present experimental work, 200 g class I carbon-fiber-reinforced polymer (CFRP) was selected as the confining material. It has the advantages of high tensile strength, lightweight, and small-fiber diameter. The carbon fiber sheets had a nominal thickness of 0.111 mm. Its elastic modulus is 241 GPa, and its tensile strength along the fiber direction is greater than 1600 MPa. The calculated confining stiffness for different thicknesses of confining jackets is listed in Table 1.
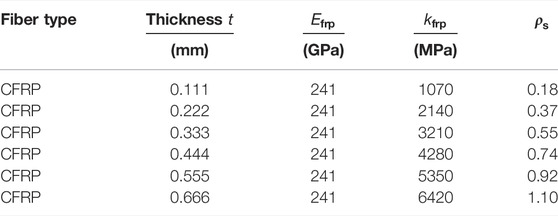
TABLE 1. Calculated confining stiffness for different thicknesses of confining jacket.
Considering that the rock in situ is confined by the surrounding rock mass, one layer of CFRP jacket can be regarded as a rock sleeve with a certain thickness. Assuming that the rock core was confined by the rock sleeve with a certain thickness, an equivalent thickness of the surrounding rock sleeve can be obtained based on the equal confining stiffness. The surrounding confining rock sleeve can be regarded as a thick-walled hollow cylinder. The elastic solution of the thick-walled hollow cylinder under uniform internal radial pressure can be used to obtain the relationship between the radial stress and the radial strain. According to the definition, the confining stiffness of the rock sleeve can be determined by the ratio of radial stress and radial strain as shown in Eq. 8. By equating the confining stiffness of Eqs 5 and 8, the equivalent thickness of the rock sleeve can be obtained. The calculated equivalent thickness of the rock sleeve for different numbers of CFRP layers is shown in Figure 2. It can be found that one layer of CFRP jacket is equivalent to a 5 mm rock sleeve in confining stiffness. When the thickness of the surrounding rock sleeve approaches infinity, the equivalent number of CFRP layers is 4.3. It means that 4.3 layers of CFRP jacket can be used to simulate the confining stiffness of surrounding rock in situ.
where
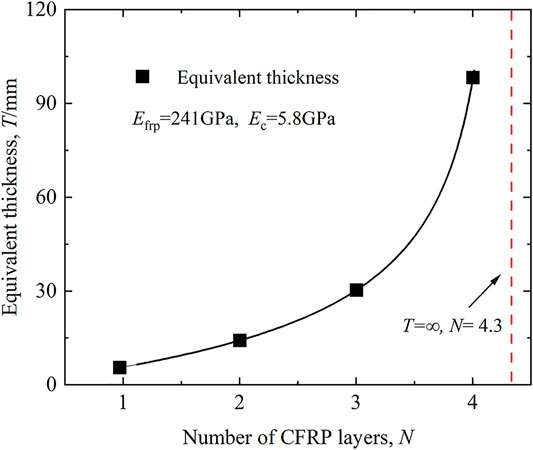
FIGURE 2. Equivalent thickness of surrounding rock for different numbers of CFRP layers.
Specimen Preparation and Testing
A total of 27 specimens were prepared from a sandstone block in Jining of Shandong, China. Cylindrical specimens were drilled and prepared with a diameter of 50 mm and a height of 100 mm as shown in Figure 3. The specimens were divided into two groups to be tested under different confining conditions as listed in Table 2. The preparation of the CFRP-confined specimens followed a standard procedure, which has been described elsewhere (Jiang and Teng, 2007; Micelli and Modarelli, 2013).
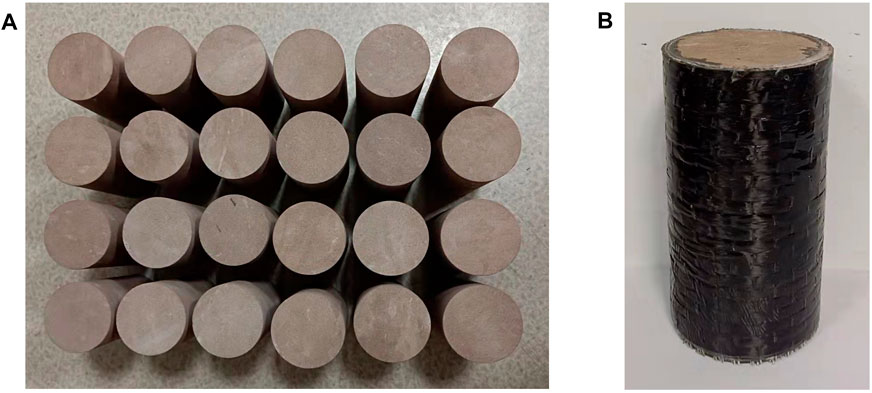
FIGURE 3. Specimens for tests. (A) Cylindrical samples; (B) CFRP-confined rock specimens.
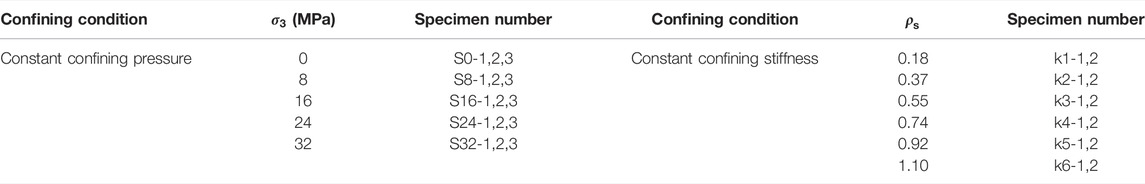
TABLE 2. Two groups of specimens with different confining conditions.
The tests were carried out on the RLJW-2000 rock mechanics testing apparatus. The tests under constant confining stress and constant confining stiffness were conducted following the standard procedure of triaxial tests and uniaxial tests, respectively. The axial pressure was applied in a displacement-controlled way, and the loading rate was 0.005 mm/s. Both the axial and circumferential strains were recorded by the LVDT during the tests.
Test Results
Stress-Strain Relationship Under Different Confining Conditions
The typical deviatoric stress–axial-strain curves of sandstone samples under different confining pressures are shown in Figure 4. It can be seen that both the peak deviatoric stress and corresponding peak strain increase as the confining pressure increases. When the confining pressure increases from 8 to 32 MPa, the peak deviatoric stress and peak strain increase by 43.15% and 36.75%, respectively.
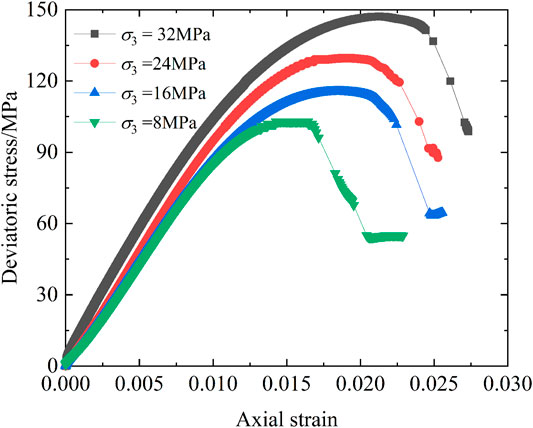
FIGURE 4. Deviatoric stress axial strain curves under different confining pressures. Stress–strain relationship under constant confining stiffness tests.
The typical axial stress–strain curves under different confining stiffness ratios are shown in Figure 5. It can be found that the curve shape under constant confining stiffness is not the same as that under constant confining stress. The stress–strain curve under constant confining stress exhibits strain softening. But the stress–strain curve under constant confining stiffness may not have a descending portion. For low confining stiffness, the stress–strain curve would first exhibit strain softening and then exhibit strain hardening. For high confining stiffness, the stress–strain curve would exhibit strain hardening only. The axial stress ascends to a certain turning point and then continues to ascend at a slower rate.
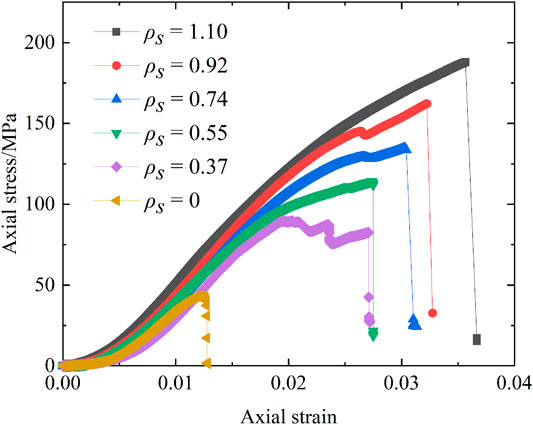
FIGURE 5. Axial-stress–axial-strain curves under different confining stiffness ratios.
Furthermore, it can be seen from Figure 5 that with the increase in confining stiffness ratio, the ultimate axial stress and ultimate axial strain increase. When the confining stiffness ratio increases from 0.37 to 1.10, the ultimate stress and strain increase by 127% and 33%, respectively.
Failure Mode Under Different Confining Conditions
The typical failure modes of the specimens under different confining conditions are shown in Figure 6. Different failure modes are exhibited for the specimen under constant confining stress and constant confining stiffness. As shown in Figure 6A, for the tests under constant confining stress (triaxial test), the failure mode of rock samples is basically the same even with different confining pressures. The macroscopic shear fracture surface can be seen when the failure of the rock specimen occurs. However, for the specimen under constant confining stiffness, the failure mode appears more complex. Failure of CFRP-confined specimens occurred in a sudden and explosive way due to fiber rupture that reached their ultimate tensile strain. The rock specimens expanded outward and were severely damaged. For the specimen under low confining stiffness, the CFRP jacket broke in the upper section of the specimen accompanied by spalling of the broken rock. For the specimen under high confining stiffness, a cone-shape failure surface is generated in the mid-height region of the specimen. Both the stress–strain curve and the failure mode of the samples show a significant differentiation between the two confining conditions.
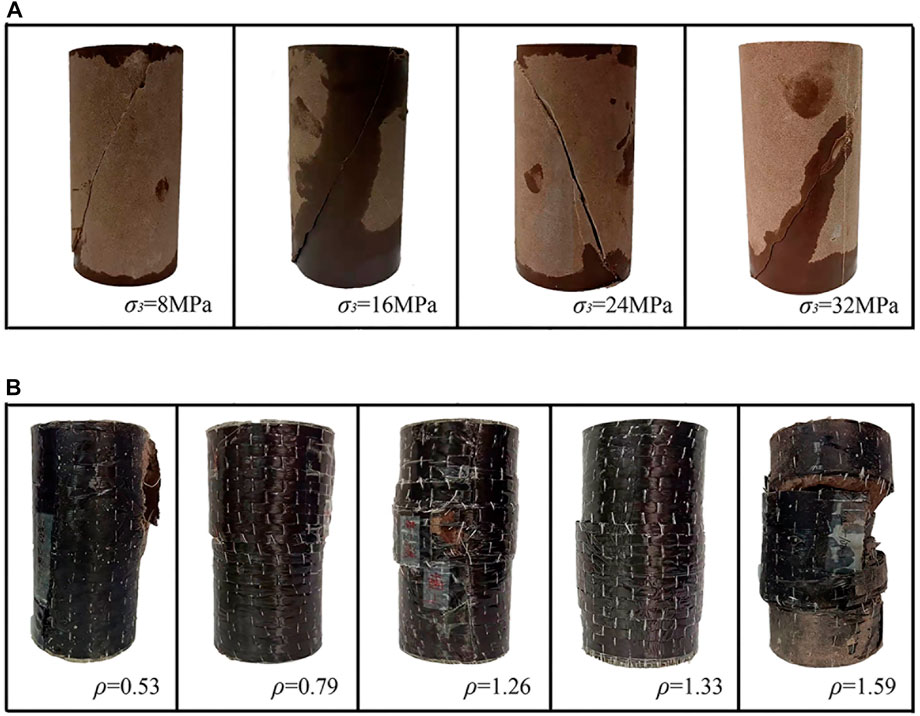
FIGURE 6. Failure mode of the specimen under different confining conditions. (A) constant confining stress; (B) constant confining stiffness.
Evolution of Strain Energy
Calculation of Strain Energy
During the process of loading, the test machine does work on the specimen. Part of the energy is transformed from the mechanical energy of the test machine into the deformation energy of the rock, which is stored in the rock mass. And the other part is dissipated due to the plastic deformation and crack propagation in the specimen. Assuming that there was no heat exchange between the specimen and the environment during the loading, the total input energy generated by external force work can be written as follows:
where
Under triaxial loading conditions, the total strain energy
The total energy absorbed by the rock sample can be obtained by the integral of the stress–strain curve. Considering that medium principal stress is equal to small principal stress for this test, then Eq. 10 and Eq. 11 can be written as follows:
The elastic strain can be obtained by the unloading elastic modulus and Poisson’s ratio.
Existing studies have shown that the unloading elastic modulus and Poisson’s ratio were close to the initial value of uncracked rock (Yu et al., 2005; David et al., 2012). So the initial elastic modulus and Poisson’s ratio were used for the calculation. For constant confining stiffness conditions, the confining pressure of the specimen can be calculated by Eq. 4 based on the measured strain of FPR.
Evolution of Strain Energy Under Constant Confining Stress
Based on the above calculation method, the energy evolution curves of rock specimens under different confining pressures are given in Figure 7. It can be seen that the evolution curves of the specimen under different confining pressures exhibit great similarity. The total strain energy absorbed by the rock sample and the dissipated strain energy show a nonlinear increasing trend. The elastic strain energy presented a trend of first increasing and then decreasing. The evolution process can be divided into several stages. In the initial stage, the total absorbed strain energy was mainly converted into elastic strain energy, and the dissipated strain energy was very low. With the crack initiation and plastic deformation, the dissipated strain energy begins to increase when the axial strain reaches about 0.015. Before the peak point, the dissipated strain energy is much smaller than the elastic strain energy. The elastic strain energy reaches its peak at the peak strength of the specimen and is then released quickly. In the post-peak stage, the dissipated strain energy increases rapidly until the failure of the specimen.
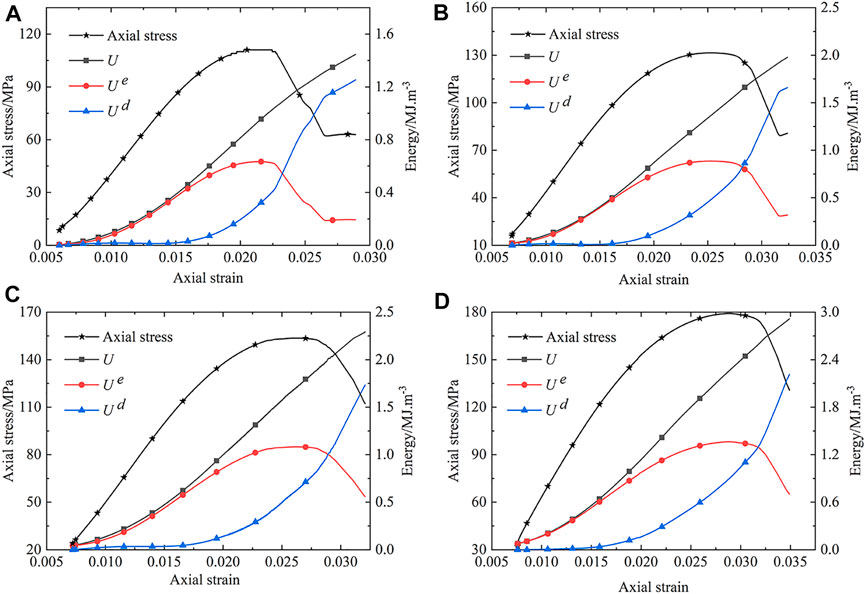
FIGURE 7. Energy evolution curve of the specimen under different confining pressures. (A) Confining pressure = 8 MPa; (B) confining pressure = 16 MPa; (C) confining pressure = 24 MPa; (D) confining pressure = 32 MPa.
It can also be found that
Evolution of Strain Energy Under Constant Confining Stiffness
The energy evolution curves of rock specimens under different confining stiffness ratios are given in Figure 8. It can be seen that different energy evolution characteristics are exhibited for the specimen under constant confining stiffness. The total strain energy
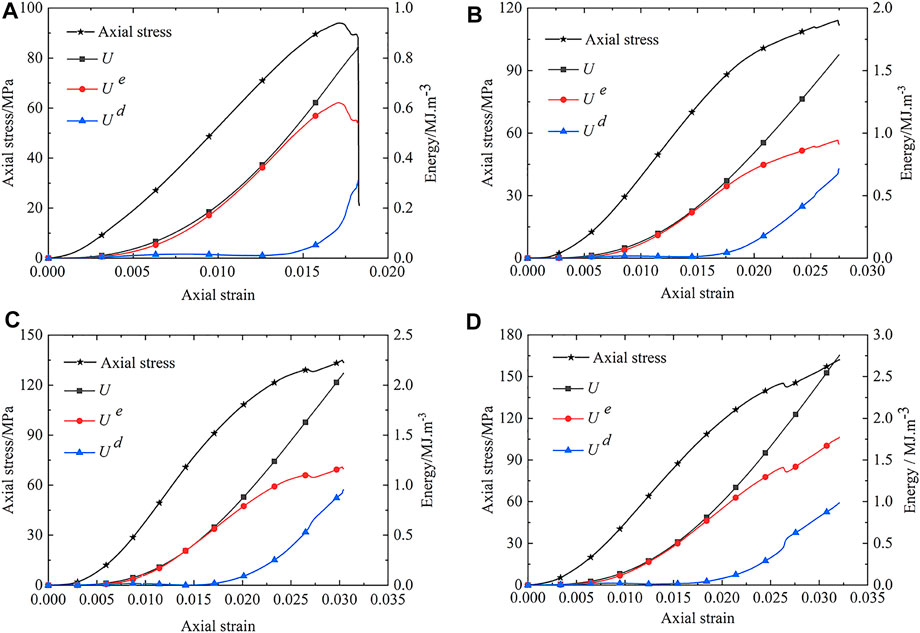
FIGURE 8. Energy evolution curve of the specimen under different confining stiffness. (A)
It can also be noted that
Comparison Under Different Confining Conditions
It is well-known that the failure mode of the rock is to a large extent dependent on the release of the stored elastic strain energy. In order to analyze the difference between the two conditions, the evolution curve of elastic strain energy under different confining conditions is compared in Figure 9. For the constant confining stress, there is a declining stage of elastic strain energy after reaching its peak. In this stage, the volume of the specimen expands gradually with the initiation, propagation, and coalescence of new cracks. The elastic strain energy decreases gradually with an axial strain increase. The failure process of the specimen exhibits ductile failure behavior. For the constant confining stiffness, the elastic strain energy continues to increase with the increase of axial strain until the sudden rupture of the CFRP jacket. At this stage, the confining stress increases with the increase of dilatational strain of the specimen because of the constant confining stiffness. And then the increased confining stress further limits the internal crack propagation of the specimen. A proportion of the absorbed energy is converted to the elastic energy of the CFRP jacket. When the strain of CFRP reaches the ultimate tensile strain, failure occurs in a sudden and explosive way, and the failure process of the specimen exhibits brittle failure behavior.
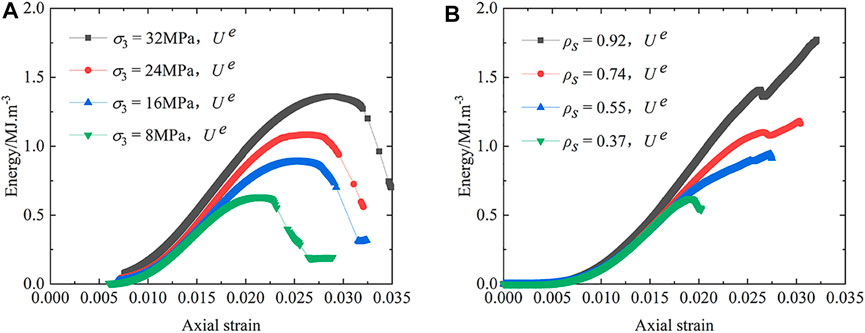
FIGURE 9. Energy evolution curve of elastic energy under different confining conditions. (A) Constant confining stress; (B) constant confining stiffness.
In order to compare the energy evolution characteristics between the two conditions under the same confining pressure standard, according to the measured hoop strain, the confining stress provided by the CFRP jacket can be calculated by using Eq. 3 and Eq. 4. Considering that the confining stress of the CFRP jacket changes continually in the loading process, the maximum confining stress corresponding to the ultimate strain of the CFRP jacket before failure was selected to compare with the constant stress condition. Based on the measured ultimate strain of the CFRP jacket, the ultimate confining stresses are about 8 and 16 MPa for the specimen, with a confining stiffness ratio of 0.79 and 1.33, respectively. Figure 10 shows the comparison of the total absorbed and elastic energy evolution curve between the two confining conditions. It can be found that the total absorbed energy of the specimen under the confining condition of constant stress is greater than that of constant stiffness when the confining stiffness is low. But for the high confining stiffness, an opposite conclusion can be observed. It indicated that confining stiffness conditions should be simulated reasonably in the laboratory to obtain the actual mechanical behavior of the rock in situ. In addition, it can be noted that the maximum elastic strain energy under the condition of constant stiffness is greater than that of constant stress by a factor of 1.4–2, corresponding to confining stress from 8 to 16 MPa. The confining stiffness of the rock has a significant effect on the storage and release of the energy. It is difficult to obtain the true mechanical behavior when only taking into consideration the confining stress conditions.
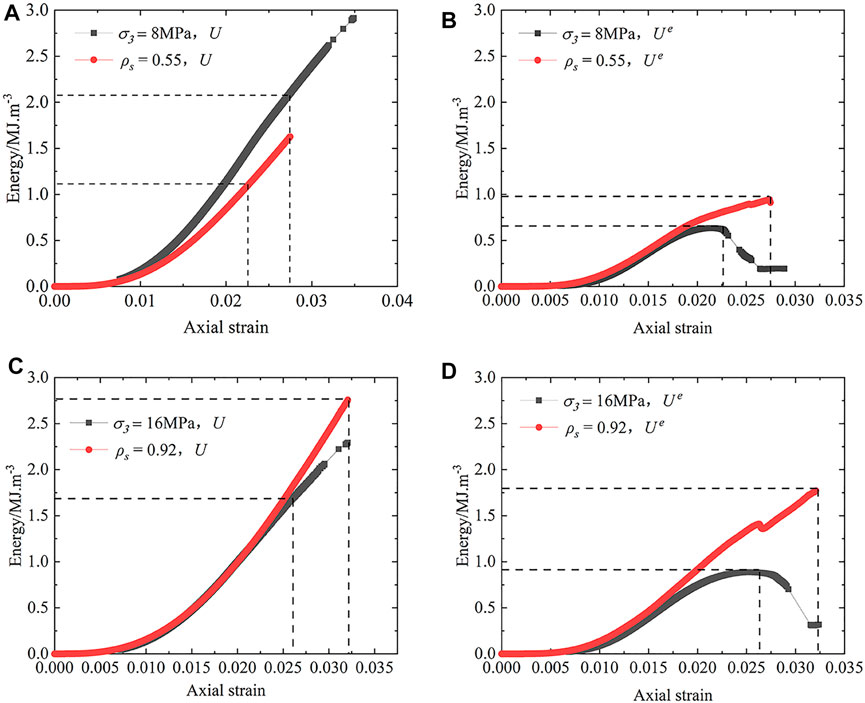
FIGURE 10. Comparison of energy evolution curve between the two conditions under the same confining stress standard. (A) Total absorbed energy (8 MPa); (B) elastic energy (8 MPa); (C) total absorbed energy (16 MPa); (D) elastic energy (16 MPa).
Conclusion
The stress–strain curve and failure mode of the samples are significantly influenced by the confining conditions. The stress–strain curves under the confining conditions of constant stress and constant stiffness exhibit strain softening and strain hardening, respectively. Under constant stress confining conditions, the specimen failed in the ductile mode with the generation of the macroscopic shear fracture surface. Under constant stiffness confining conditions, the specimen failed in a sudden and violent way, and the failure process exhibits brittle failure behavior.
The total absorbed strain energy, the dissipated strain energy, and elastic energy are all increased with the increase in confining stiffness. The evolution trend of the elastic strain energy is greatly affected by the magnitude of confining stiffness. When the confining stiffness is small, the elastic strain energy decreases slightly after reaching its peak. As the confining stiffness increases, the elastic strain energy will not decrease but continue to increase until the failure of the specimen.
Taking the ultimate confining stresses as a standard, the total absorbed energy of the specimen under the confining condition of constant stress is greater than that of constant stiffness when the confining stiffness is low. But for the high confining stiffness, an opposite conclusion can be observed. The maximum elastic strain energy under the condition of constant stiffness is greater than that of constant stress.
Data Availability Statement
The raw data supporting the conclusions of this article will be made available by the authors, without undue reservation.
Author Contributions
B-WZ and KF designed experiments; B-WZ and CW carried out experiments; B-WZ, T-BZ, X-FZ and KF analyzed experimental results; B-WZ and CW wrote the manuscript.
Funding
This work was supported by the Major Program of the Shandong Provincial Natural Science Foundation (No. ZR2019ZD13), the Shandong Province Natural Science Fund (No. ZR2019QEE015), China, and the Major Scientific and Technological Innovation Project of the Shandong Provincial Key Research Development Program (No. 2019SDZY02).
Conflict of Interest
Author X-FZ was employed by the company Shandong Energy Group Co., Ltd.
The remaining authors declare that the research was conducted in the absence of any commercial or financial relationships that could be construed as a potential conflict of interest.
Publisher’s Note
All claims expressed in this article are solely those of the authors and do not necessarily represent those of their affiliated organizations, or those of the publisher, the editors, and the reviewers. Any product that may be evaluated in this article, or claim that may be made by its manufacturer, is not guaranteed or endorsed by the publisher.
References
Bagde, M. N., and Petroš, V. (2009). Fatigue and Dynamic Energy Behaviour of Rock Subjected to Cyclical Loading. Int. J. Rock Mech. Mining Sci. 46, 200–209. doi:10.1016/j.ijrmms.2008.05.002
Chen, J. T., and Feng, X. T. (2006). True Triaxial Experimental Study on Rock with High Geostress. Chin. J. Rock Mech. Eng. 25, 1537–1543. doi:10.3321/j.issn:1000-6915.2006.08.004
David, E. C., Brantut, N., Schubnel, A., and Zimmerman, R. W. (2012). Sliding Crack Model for Nonlinearity and Hysteresis in the Uniaxial Stress-Strain Curve of Rock. Int. J. Rock Mech. Mining Sci. 52, 9–17. doi:10.1016/j.ijrmms.2012.02.001
Dong, C. X., Kwan, A. K. H., and Ho, J. C. M. (2015). Effects of Confining Stiffness and Rupture Strain on Performance of FRP Confined concrete. Eng. Structures 97, 1–14. doi:10.1016/j.engstruct.2015.03.037
Fang, K., Zhao, T., Zhang, Y., Qiu, Y., and Zhou, J. (2019). Rock Cone Penetration Test under Lateral Confining Pressure. Int. J. Rock Mech. Mining Sci. 119, 149–155. doi:10.1016/j.ijrmms.2019.04.018
Feng, G.-L., Chen, B.-R., Xiao, Y.-X., Jiang, Q., Li, P.-X., Zheng, H., et al. (2022). Microseismic Characteristics of Rockburst Development in Deep TBM Tunnels with Alternating Soft-Hard Strata and Application to Rockburst Warning: A Case Study of the Neelum-Jhelum Hydropower Project. Tunnelling Underground Space Techn. 122, 104398. doi:10.1016/j.tust.2022.104398
Feng, G.-L., Feng, X.-T., Chen, B.-r., Xiao, Y.-X., and Yu, Y. (2014). A Microseismic Method for Dynamic Warning of Rockburst Development Processes in Tunnels. Rock Mech. Rock Eng. 48, 2061–2076. doi:10.1007/s00603-014-0689-3
Huang, D., and Li, Y. (2014). Conversion of Strain Energy in Triaxial Unloading Tests on Marble. Int. J. Rock Mech. Mining Sci. 66, 160–168. doi:10.1016/j.ijrmms.2013.12.001
Jia, Z., Li, C., Zhang, R., Wang, M., Gao, M., Zhang, Z., et al. (2019). Energy Evolution of Coal at Different Depths under Unloading Conditions. Rock Mech. Rock Eng. 52, 4637–4649. doi:10.1007/s00603-019-01856-y
Jiang, T., and Teng, J. G. (2007). Analysis-oriented Stress-Strain Models for FRP-Confined concrete. Eng. Structures 29, 2968–2986. doi:10.1016/j.engstruct.2007.01.010
Lam, L., and Teng, J. G. (2004). Ultimate Condition of Fiber Reinforced Polymer-Confined Concrete. J. Compos. Constr. 8, 539–548. doi:10.1061/(asce)1090-0268(2004)8:6(539)
Li, D., Sun, Z., Xie, T., Li, X., and Ranjith, P. G. (2017). Energy Evolution Characteristics of Hard Rock during Triaxial Failure with Different Loading and Unloading Paths. Eng. Geology. 228, 270–281. doi:10.1016/j.enggeo.2017.08.006
Li, H. B., Zhao, J., and Li, T. J. (1999). Triaxial Compression Tests on a Granite at Different Strain Rates and Confining Pressures. Int. J. Rock Mech. Mining Sci. 36, 1057–1063. doi:10.1016/s1365-1609(99)00120-3
Liu, X., Feng, X.-T., and Zhou, Y. (2020). Experimental Study of Mechanical Behavior of Gneiss Considering the Orientation of Schistosity under True Triaxial Compression. Int. J. Geomechanics 20. doi:10.1061/(asce)gm.1943-5622.0001838
Ma, C. C., Chen, K. Z., Li, T. B., Zeng, J., and Ma, J. J. (2020). Numerical Simulation of Stress-Structural Rockburst Based on GDEM Software. Hazard. Control. Tunnelling Underground Eng. 2 (3), 85–94.
Meng, Q.-b., Liu, J.-f., Huang, B.-x., Pu, H., Wu, J.-y., and Zhang, Z.-z. (2022). Effects of Confining Pressure and Temperature on the Energy Evolution of Rocks under Triaxial Cyclic Loading and Unloading Conditions. Rock Mech. Rock Eng. 55, 773–798. doi:10.1007/s00603-021-02690-x
Micelli, F., and Modarelli, R. (2013). Experimental and Analytical Study on Properties Affecting the Behaviour of FRP-Confined concrete. Composites B: Eng. 45, 1420–1431. doi:10.1016/j.compositesb.2012.09.055
Peng, R., Ju, Y., Wang, J. G., Xie, H., Gao, F., and Mao, L. (2014). Energy Dissipation and Release during Coal Failure under Conventional Triaxial Compression. Rock Mech. Rock Eng. 48, 509–526. doi:10.1007/s00603-014-0602-0
Wang, F., and Kaunda, R. (2019). Assessment of Rockburst hazard by Quantifying the Consequence with Plastic Strain Work and Released Energy in Numerical Models. Int. J. Mining Sci. Techn. 29, 93–97. doi:10.1016/j.ijmst.2018.11.023
Wang, Y., and Cui, F. (2018). Energy Evolution Mechanism in Process of Sandstone Failure and Energy Strength Criterion. J. Appl. Geophys. 154, 21–28. doi:10.1016/j.jappgeo.2018.04.025
Xie, H., Li, C., He, Z., Li, C., Lu, Y., Zhang, R., et al. (2021b). Experimental Study on Rock Mechanical Behavior Retaining the In Situ Geological Conditions at Different Depths. Int. J. Rock Mech. Mining Sci. 138, 104548. doi:10.1016/j.ijrmms.2020.104548
Xie, H., Li, L., Peng, R., and Ju, Y. (2009). Energy Analysis and Criteria for Structural Failure of Rocks. J. Rock Mech. Geotechnical Eng. 1, 11–20. doi:10.3724/sp.J.1235.2009.00011
Xie, H. P., Li, C. P., Gao, M. Z., Zhang, R., Gao, F., and Zhu, J. B. (2021a). Conceptualization and Preliminary Research on Deep In Situ Rock Mechanics. Chin. J. Rock Mech. Eng. 40 (02), 217–232. doi:10.13722/j.cnki.jrme.2020.0317
Yu, X. B., Xie, Q., Li, X. Y., Na, Y. K., and Song, Z. P. (2005). Cycle Loading Tests of Rock Samples under Direct Tension and Compression and Bi-modular Constitutive Model. Chin. J. Geotechnical Eng. 27, 988–993. doi:10.3321/j.issn:1000-4548.2005.09.003
Yu, Y., Feng, G.-l., Xu, C.-j., Chen, B.-r., Geng, D.-x., Zhu, B.-t., et al. (2022). Quantitative Threshold of Energy Fractal Dimension for Immediate Rock Burst Warning in Deep Tunnel: A Case Study. Lithosphere 2021, 1699273. doi:10.2113/2022/1699273
Zhang, L., Cong, Y., Meng, F., Wang, Z., Zhang, P., and Gao, S. (2021). Energy Evolution Analysis and Failure Criteria for Rock under Different Stress Paths. Acta Geotech. 16, 569–580. doi:10.1007/s11440-020-01028-1
Zhang, Q. B., and Zhao, J. (2014). A Review of Dynamic Experimental Techniques and Mechanical Behaviour of Rock Materials. Rock Mech. Rock Eng. 47, 1411–1478. doi:10.1007/s00603-013-0463-y
Keywords: constant confining stress, constant confining stiffness, energy evolution, elastic strain energy, fracture mode
Citation: Zhang B-W, Fang K, Wang C, Zhao T-B and Zhang X-F (2022) Energy Evolution Characteristics of Rock Under Different Confining Conditions. Front. Earth Sci. 10:886134. doi: 10.3389/feart.2022.886134
Received: 28 February 2022; Accepted: 06 April 2022;
Published: 26 May 2022.
Edited by:
Guang-Liang Feng, Institute of Rock and Soil Mechanics (CAS), ChinaReviewed by:
Dongdong Xu, Changjiang River Scientific Research Institute (CRSRI), ChinaZhiyong Fu, Liaoning Technical University, China
Copyright © 2022 Zhang, Fang, Wang, Zhao and Zhang. This is an open-access article distributed under the terms of the Creative Commons Attribution License (CC BY). The use, distribution or reproduction in other forums is permitted, provided the original author(s) and the copyright owner(s) are credited and that the original publication in this journal is cited, in accordance with accepted academic practice. No use, distribution or reproduction is permitted which does not comply with these terms.
*Correspondence: Kai Fang, Zms4NjEwMThAMTYzLmNvbQ==