 Ellen Krahl1
 Bernhard Vowinckel
 Leiping Ye
 Tian-Jian Hsu
 Andrew J. Manning
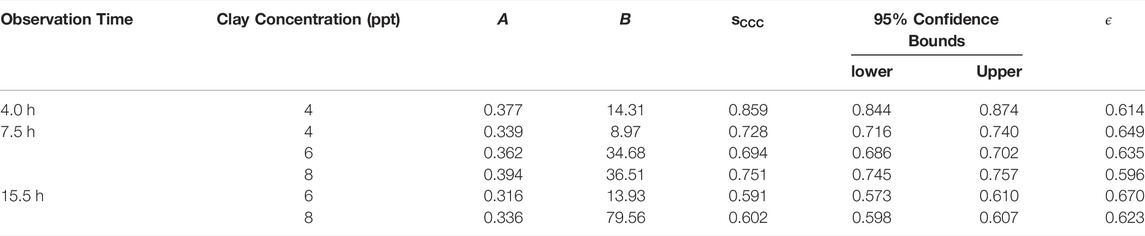

95% of researchers rate our articles as excellent or good
Learn more about the work of our research integrity team to safeguard the quality of each article we publish.
Find out more
ORIGINAL RESEARCH article
Front. Earth Sci. , 15 July 2022
Sec. Marine Geoscience
Volume 10 - 2022 | https://doi.org/10.3389/feart.2022.886006
This article is part of the Research Topic Cohesive Sedimentary Systems: Dynamics and Deposits View all 21 articles
The flocculation behavior of clay minerals in aquatic environments is an important process in estuarine and riverine dynamics, where strong gradients in salinity can locally occur. Various contradicting observations have been reported in the literature on the impact of salt concentration on the settling process of cohesive sediments. To address this issue in a systematic manner, we investigate the settling behavior of clay minerals as a function of the salt concentration of the ambient water. Specifically, we focus on montmorillonite as a prototype clay mineral with a high cation exchange capacity (CEC). To this end, we study suspensions of Wyoming bentonite (Volclay SPV) as a very important constituent for many constructional and industrial purposes. We perform an experimental campaign to study the settling behavior of moderately turbid montmorillonite concentrations in monovalent salt solutions with different salinities (sodium chloride) to represent different environments ranging from deionized to ocean water, respectively. The subsequent settling process was monitored by taking pictures by a camera in regular time intervals over a total observation time up to 48 h. In addition, a modified hydrometer analysis is conducted to determine the grain size distribution (in terms of an equivalent diameter) of the flocculated clay suspension in salt water. Despite the rather high cation exchange capacity of the investigated clay (CEC=88.1), our results show that the settling speed drastically increases within a range of 0.6–1.0 PSU and stays approximately constant for higher salinities. This critical salt concentration is defined here as the critical coagulation concentration (CCC) and lies well below the salinity of natural open water bodies. The hydrometer analysis revealed that 60% of the agglomerates exceed the equivalent grain size of 20 μm. Finally, the findings of this study are supplemented with experiments studying the effect of Extracellular Polymeric Substances (EPS) on the flocculation behavior of bentonite in salt water. Our results demonstrate that salinity is the original trigger for flocculation, whereas EPS allows for even larger floc size but it does not play a significant role for the settling processes of bentonite in estuarine environments.
The fate and transport of cohesive sediments is an important constituent of sediment transport in natural open water bodies (Winterwerp and van Kesteren, 2004). Due to their small grain size and their cohesiveness, fine-grained sediments can act as vehicles for the transport of nutrients but also contaminants (Ahmerkamp et al., 2022). Cohesive sediments are grains that have a diameter size of smaller than 63 µm and can be further sub-divided into silt (2–63 µm) and clay (< 2 µm). Silt are larger silica grains that are similar in shape to sand grains (Te Slaa et al., 2015), whereas clay particles are platelets with ionic charges that create forces comparable with, or exceeding, the gravitational force, and these cause the clay particles to interact electrostatically. Such particles can be described by theories from colloidal science (Lagaly et al., 2013), i.e., the mutual forces experienced by two or more clay particles in close proximity are the result of the relative strengths of the repulsive and attractive forces (e.g., van Olphen, 1977; Manning, 2001). If clay minerals are dispersed to their primary clay platelets smaller than 1 μm, suspended particles of this size can form ideal sols, where the weight of the particles is balanced by Brownian motion and particles do not settle out over time (Partheniades, 2009; Berg, 2010). There has been evidence that such a state can be obtained in the laboratory if clay particles are dispersed in de-ionized water and flocculation is triggered at a critical salt concentration (e.g., Seiphoori et al., 2021; Mietta et al., 2009; Mehta, 2014; Sutherland et al., 2015; Adachi et al., 2020; Ghazali et al., 2020). However, this critical salt concentration to trigger coagulation, often times referred to as the Critical Coagulation Concentration (CCC, van Olphen, 1977), has not been reported for natural aquatic environments in such a consistent manner (e.g., Gibbs et al., 1989; Droppo and Ongley, 1994; Thill et al., 2001; Kumar et al., 2010; Mikeš and Manning, 2010).
In freshwater suspensions, which contain very few positive ions or possess low electrolyte concentration, the repulsive forces between negatively charged particles dominate, and the particles repel each other. The attractive forces dominate in saline waters due to the abundance of sodium ions that form a cloud of positive ions (cations in a high electrolyte concentration) around the negatively charged clay particles. Consequently, the sediment particles do not behave as individual particles but tend to stick together and form flocs (e.g., Krone, 1962). Krone (1963) found that flocculation quickly reaches equilibrium at a salinity of about 5–10 ppt, which is much less than that for sea water (approx. 35 ppt). Numerous field studies have observed large natural macroflocs (>100
Typical sediment values of suspended particulate matter concentrations (SPMC) in riverine, estuarine and marine environments range from 2–500 mg/l. Determining the governing mechanism for the onset of flocculation is, therefore, crucial. Applying the Stokes law to estimate the settling velocity of single fine-grained particles, we would expect settling rates so small that the particles will not make contact with the sediment bed in riverine transport. For this reason, this part of the sediment load of a river has been called wash load. In a recent contribution by Lamb et al. (2020), it has been questioned that this is indeed true for clays transported in natural aquatic environment. Lamb et al. (2020), however, investigated datasets from eight low-land rivers and argued that nearly all fine-grained sediments in natural open water bodies are in a flocculated state even in freshwater environments, so that flocs settle over time and make contact with the sediment bed as they are resuspended. The question remained, however, whether flocculation is triggered by either (very low) salinity or EPS or a combination of both. This is an important aspect as it may help to manage and mitigate sediment transport processes. It can also be useful in the modeling of cohesive sediments by means of continuum models (Jarvis et al., 2005; Verney et al., 2011; Kuprenas et al., 2018; Hsu et al., 2021) and newly emerging techniques of particle-resolved simulations (Vowinckel et al., 2019a,b; Vowinckel, 2021; Zhao et al., 2021, Zhu et al., 2022).
Consequently, this question is the focus of the present study. We present results for different experimental campaigns analyzing the impact of salt concentration and EPS in setups for differential settling and shear, respectively. The first setup is built on the work of Rommelfanger et al. (2022), who investigated the impact of salt concentration for kaolinite clay. For the present study, we follow this example and use pure mineral as sediment which allows us to isolate the effect of salinity, since the picture becomes more complicated for natural sediment (Zhu et al., 2018) or even sediment sampled in estuaries (Gibbs et al., 1989; Mikeš and Manning, 2010). In these naturally occurring environments, the effects of EPS and mineral mixtures may also play a role. We therefore deliberately focus on bentonite with a large cation exchange capacity (CEC). A higher CEC creates a larger surface charge as the governing colloidal parameter to control flocculation so that conclusions can be drawn for all clay minerals compositions with a similar or smaller CEC. The setup of differential settling allowed for a very controlled variation of the salt concentration in the semi-dilute regime ranging from 4 to 8 ppt mass concentration (Zhu et al., 2018; Adachi et al., 2020; Ghazali et al., 2020) and, hence, the determination of the CCC for sediment concentrations similar to the turbidity reported for the Gironde estuary in France (Gibbs et al., 1989; Mikeš and Manning, 2010). Second, we compare these findings with a jar test from the LabSFLOC-2 experimental stand of Ye et al. (2020; 2021) to investigate the impact of EPS on the flocculation of bentonite in salt water under shear.
This manuscript is structured as follows. First, we explain in detail our materials and methods in Section 2 before we present detailed results for flocculation of bentonite during differential settling and under fluid shear, respectively, in Section 3. Finally, we provide a discussion of the implications of our study in Section 4.
Since the idea of the present study is to focus on clays with a high cation exchange capacity (CEC) to provide an extreme case for the determination of the CCC, we investigated montmorillonite dominated bentonites in a monovalent salt solution of sodium chloride. This choice provides a reference, whether or not the CCC may be an important parameter in naturally occurring environments. We note that we focus on pH-neutral ambient fluids, which is in close agreement with the salinity of riverine waters (e.g., Gundersen and Steinnes, 2003) and any deviation from pH=7 lowers the CCC even further (Goldberg and Glaubig, 1987).
Three different setups are considered in the present study. First, an experimental stand was designed along the lines of Rommelfanger et al. (2022) to conduct experiments of differential settling of clays. This allows to determine the settling time and thereby the CCC for the onset of flocculation. Second, a standard hydrograph analysis was conducted to analyze the grain size distribution of the sediment. Third, a selection of floc size and settling measurements are included to analyze flocs generated by a jar test facility. For this batch, the novel LabSFLOC-2 video floc camera system was used to observe the resultant floc populations. Here, the relative level of flocculation produced by a bentonite clay in salt water was compared with the flocculation response from the addition of pure xanthan gum, a proxy for EPS found in natural sediment (e.g., Tolhurst et al., 2002; Parsons et al., 2016). EPS-coatings are ubiquitous in natural muddy sediments and can act as an adhesive to enhance flocculation (Black et al., 2002; Fang et al., 2016).
The fluid used in this study was de-ionized (DI) water with a conductivity of 0.5–1.0 μS/cm. In addition, sodium chloride (supplier Carl Roth, article number 9265) as a monovalent salt was used to prepare saltwater solutions with different salinities. Here, salinity is given in practical salt units (PSU) as it is equivalent to ppt used as a measure to quantify the clay concentration. The molar mass of the salt is 58.44 g/mol and it has a density of 2.17 g/cm3. Note that the pH-value was not modified in this way, but remained neutral at pH=7.
For the present study, we focus on Wyoming bentonite as a montmorillonite rich clay with a rather high CEC. To this end, we use Volclay SPV as a popular clay mineral for geo-engineering (e.g., Studds et al., 1998). The batch of Volclay SPV used in this study has been well characterized by the German Federal Institute for Geosciences and Natural Resources (BGR) (Dohrmann, 2020). Table 1 shows the mineralogical composition. The large fraction of Na2O reflects the fact that most of the exchangeable cations are Na+. The total CEC was determined via the X-ray diffraction method as 88.1 cmolc/kg (Dohrmann, 2020) as a sum of different exchangeable ions in terms of their mass fraction. These constituents comprise sodium (64.4 cmolc/kg), potassium (1.6 cmolc/kg), magnesium (4.1 cmolc/kg) and calcium (18.0 cmolc/kg). As expected from the mineralogical composition, sodium provides the majority of 73% exchangeable ions.

TABLE 1. Mineralogical composition of the bentonite used in this study. The mass fractions were determined by X-ray fluorescence analysis (Dohrmann, 2020) following the procedure by Dohrmann et al. (2009).
The grain size distribution was determined using X-ray granulometry (Micromeritics SediGraph 5100). As desired, the majority of the grains (>87%) has a diameter smaller than 2 µm and only 5% of the grains are larger than 20 µm (Dohrmann, 2020). For our analysis, we will use clay suspensions with a concentration of 4, 6, and 8 ppt, respectively (ppt in parts per thousand as the mass fraction) which corresponds to the semi-dilute regime (Zhu et al., 2018; Adachi et al., 2020; Ghazali et al., 2020). After the preparation of the suspensions, the samples were stored in a dark environment for a minimum of 7 days to establish an equilibrium between the exchangeable ions and the ions in the salt water solution.
To guarantee reproducibility, we follow the example of Rommelfanger et al. (2022) and design a test stand that provides controlled conditions for differential settling. Suspensions were prepared in newly purchased bottles that are otherwise known as cell culture flasks of size
Upon the initialization of the different experimental runs, the suspensions were homogenized by shaking the bottles with a platform shaker for a duration of 10 s at a frequency of 6.7 Hz and a stroke of 2 cm, which yields a maximal velocity and acceleration of 26.7 cm/s and 0.0225 cm/s2, respectively. Afterwards, the bottles were placed in rack with fixed, marked position. This process took approximately another 10 s before the recordings of the experiment actually started. The rack was illuminated by a light panel (Walimex pro Soft LED 200 Flat Bi Color, article number 21243) with a light intensity of 10% at a light temperature of 4400 K. The panel was placed at 7.5 cm distance from the rack. This distance ensures that the bottles do not experience any significant heat flux from the light panel. As a result, the temperature within the test stand was kept constant at 19.8°–20°C throughout the entire experimental campaign. The settling of the suspended clay was monitored by a single-lens reflex camera (Canon EOS 1000D, aperture F14, shutter speed 1/8). Pictures were taken in backlight at a distance of 28.5 cm and an interval of 5 min for observation periods up to 48 h. The experimental stand is shown in Figure 1.
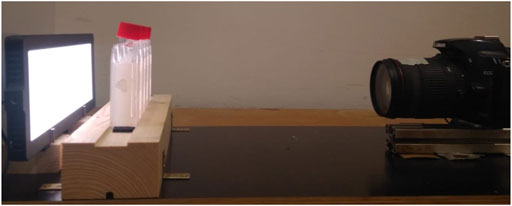
FIGURE 1. Experimental setup to determine the CCC. The distances between the light panel and the bottles, and the bottles and the camera are 7.5 and 28.5 cm, respectively.
The camera produced digital pictures with a resolution of 72 dpi in JPEG-format that are converted to gray scale images using Matlab R2020b, so that the pictures can be analyzed as a 2D-matrix of gray scale pixels. Hence, the raw data provides values within the range of 0 (black) to white (256) for pixels with a grid size that represent squares of 0.096 mm edge length.
The hydrometer analysis is used to determine the settling velocity of flocculated and non-flocculated clay suspensions. The hydrometer analysis according to DIN 18123 is generally used to determine the grain size distribution of soil samples (Brüggemann, 1982). This type of analysis is especially useful to determine the grain size distribution for very fine sediments. The change in density of the suspension is measured as the buoyancy of the hydrometer submerged into the suspension. As a result, the grain size distribution can be determined by the differential settling behavior of the individual grain size fractions and particles with grain sizes in the range of 2 and 20 µm can be represented by this analysis.
The standard protocol after Brüggemann (1982) was derived to determine the grain size of the primary particles. Here, we apply the same methodology to analyze the primary particles of our clay samples and conduct an additional, modified set of experiments, where we determine the size distribution of the flocculated clay. According to the standard protocol of the hydrometer analysis, 25 ml dispersant (sodium pyrophosphate) was mixed with 100 ml DI-water and the mixture sat for 15 h. Afterwards, an additional 200 ml of DI-water was added and the fluid was stirred for 30 min. Subsequently, the dispersion was poured into a larger cylinder and filled with more DI-water up to 990 ml. The larger cylinder was sealed, shaken and filled with more DI-water to contain precisely 1,000 ml before the time recording started. Hydrometer measurements were taken after 30 s, 1 min, 2, 5, 15, 45 min, 2, 6, and 24 h alongside with the fluid temperature (where the first reading was after 15 min). An example of this procedure is shown in Figures 2A,C for pure DI-water and DI-water with dispersant and clay, respectively. The buoyancy effect on the draught of the hydrometer due to the clay suspension is clearly visible.
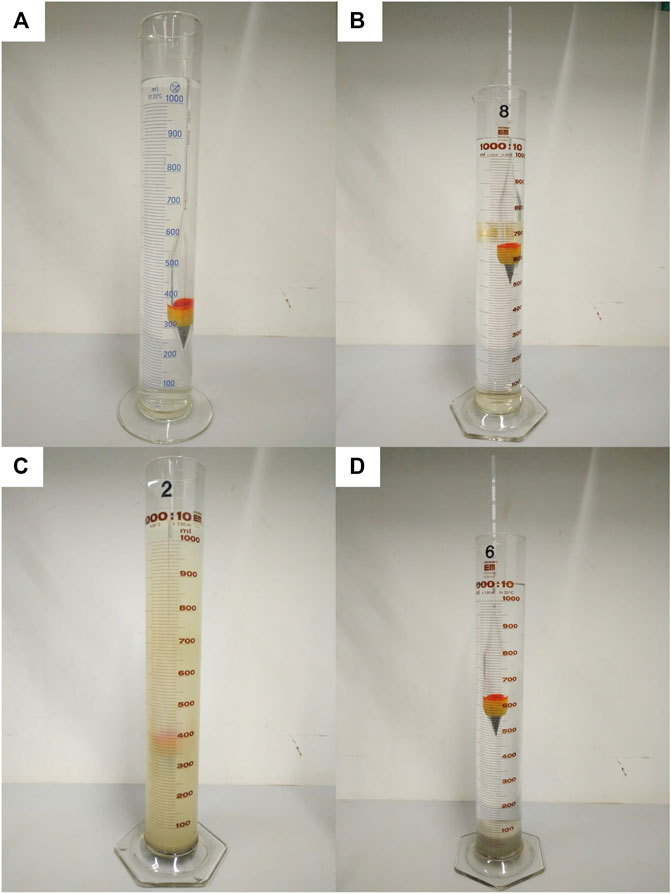
FIGURE 2. Examples of the immersion depth of the hydrometer in (A) DI-water, (B) salt water 35 PSU, (C) DI water with clay suspension, and (D) salt water 35 PSU with clay suspension. The images with suspensions were taken after 24 h observation time. Note in (D) how the clay is already deposited at the bottom of the cylinder.
To determine the grain size distribution, we follow the protocol of Brüggemann (1982) and use Stokes’ law to compute the settling velocity,
where
and
Here,
where
Using these considerations, we can determine the grain size distribution as follows
where
As mentioned above, a second set of hydrometer experiments was carried out with a modified procedure to analyze the grain size distribution of the flocculated clay. In contrast to the standard protocol, saltwater was used with a salinity of 35 PSU and no dispersant was added. This allowed the clay suspension to aggregate, so that the analysis reveals the characteristic floc diameter. Another difference to the standard procedure is that we stopped the recording after 900 s, because all clay had settled out at that time. An example of the modified procedure is given in Figures 2B,D, where the effect of salt water and flocculation becomes apparent in the respective panels. The modifications required a re-calibration of the hydrometer, which yielded the following calibration parameters
We analyze the effect of EPS on flocculation of bentonite by means of jar tests and the LabsFLOC-2 experimental setup previously conducted by Ye et al. (2020). Here, we provide a brief summary to keep the manuscript self-contained. Full details of the experimental procedure for reproducibility can be found in Ye et al. (2020).
Laboratory jar test experiments were undertaken at the Center for Applied Coastal Research, University of Delaware utilizing a magnetic stirring system, with a self-designed turbulence monitoring frame attached (cf. Figure 3A). The resultant floc populations were measured with a LabSFLOC-2 (the 2nd version of Laboratory Spectral Flocculation Characteristics instrument, Gratiot and Manning, 2004; Manning and Dyer, 2007) aside of the jar test apparatus (Figure 3B). Each experimental run adopted a uniform stirring speed of 490 rpm (equivalent to a turbulence shear rate parameter
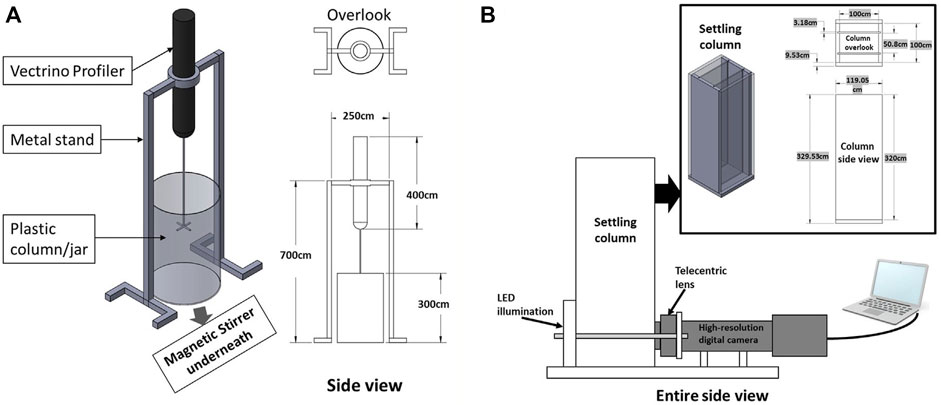
FIGURE 3. Schematic of the laboratory setup to test the influence of EPS on flocculation. Panel (A) shows the self-designed Vectrino stand and panel (B) shows the LabSFLOC-2 system.
Each experimental jar test run had a nominal 2 h duration before they were collected for analysis using the LabSFLOC-2 system (Manning et al., 2007). As demonstrated by Ye et al. (2020), for the given turbulence level, the flocculation process reaches equilibrium within the 2-h experimental run time. The total floc population characteristics were observed using the LabSFLOCS-2 system which comprised a high-resolution (one pixel ∼5 microns) video camera that observes and records individual flocs whilst settling in a dedicated settling column. The analyzed digital floc data provided by LabSFLOCS-2 includes complete population mass-balances: floc numbers, floc size, floc effective density (floc bulk density minus the fluid density), settling velocity, and porosity.
The LabSFLOC-2 system produces visible floc images that are analyzed to obtain other essential quantitative floc properties including floc size, floc shape and floc settling velocity (Manning et al., 2010). Through additional theories, other floc quantities can be derived, such as floc density, porosity and floc mass. The recorded videos of floc settling videos can be analyzed with Matlab software routines based on the HR Wallingford Ltd. DigiFloc software (Benson and Manning, 2013) and a Java Script to semi-automatically process the digital recording image stack to obtain floc size and settling velocity spectra (Manning et al., 2010; Uncles and Mitchell, 2017). Using the measured floc diameter
in which
To illustrate the general settling behavior of the clay suspension, we show exemplary runs as a collage of snapshot photographs taken at a regular interval of 30 min over time in Figure 4. Looking at the three different figures that represent the different clay concentrations, 4 ppt, 6 ppt, and 8 ppt, respectively, we can identify three different characteristic regions. First, a light grey area that dominates the water column at the initial period of the experiments. During this time, sediment particles move around due to the differential settling dictated by their weight and frequently come into contact. This is the so-called flocculation and hindered settling stage (Winterwerp, 2002), which will be the main focus within the study. Second, a dark grey area that builds on the bottom of the bottle and grows in thickness over time. This region represents sediment that has settled out and has made contact with the bottom wall via force chains among the sediment grains (Mehta and McAnally, 2008; Adachi et al., 2020; Ghazali et al., 2020). Third, a light region, where the fluid is mostly cleared up and only small amounts of sediment are still in suspension. This region also grows in thickness over time.
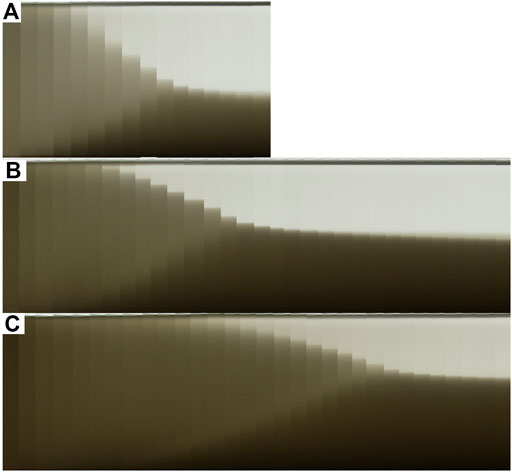
FIGURE 4. Example of the settling process over time for (A) 4 ppt and 0.98 PSU for a total observation period of 7.5 h, (B) 6ppt and 0.75 PSU for a total observation period of 15.5 h and (C) 8 ppt and 0.62 PSU.
At some instant in time, the first light grey region vanishes so that the bottle volume contains only clear fluid and sediment deposit. This instant is called the point of contraction, where the settling stops and the sediment column enters the process of self-weight consolidation. Consequently, the settling behavior observed in our experiments is in very good agreement with the overall phenomenology of settling suspensions (Winterwerp and van Kesteren, 2004; Mehta and McAnally, 2008), and we conclude that the present data set is very well suited for the present analysis. As a main difference among the different experimental runs with different clay concentrations, the flocculation and hindered settling process was completed after 7.5 h for 4 ppt (Figure 4A), whereas particles stay in suspension for longer in higher clay concentrations and the settling process takes a longer time to reach the point of contraction (here, we show an observation time of 15.5 h). However, we will show that the settling with different clay loadings yields similar scaling behavior.
To determine the CCC, we conducted a systematic campaign of settling experiments as depicted in Figure 4 for the three clay concentrations 4 ppt, 6 ppt, and 8 ppt. For those three batches, the salinity was varied in small increments in the range from 0 PSU (pure DI-water) to 35 PSU (sea water salinity). For salinities lower than the CCC, we expect no or slow aggregation, so that the settling process should take much longer than the settling for aggregated clays submerged in fluids with a salinity that exceeds the CCC. To this end, we determine an observation level in the bottles, where we record the gray level of the photograph as a surrogate for the clay concentration of the suspension (red horizontal line in Figure 5A), i.e., the lower the gray value of the pixel the higher the clay concentration. Hence, we refer to this quantity as light intensity. For the settling analysis, the recorded light intensity is averaged over the entire observation level and normalized by a reference value that was taken from a bottle filled with DI-water only. These results for normalized light intensities are plotted against time for various clay concentrations and salinities in Figures 5B–D.
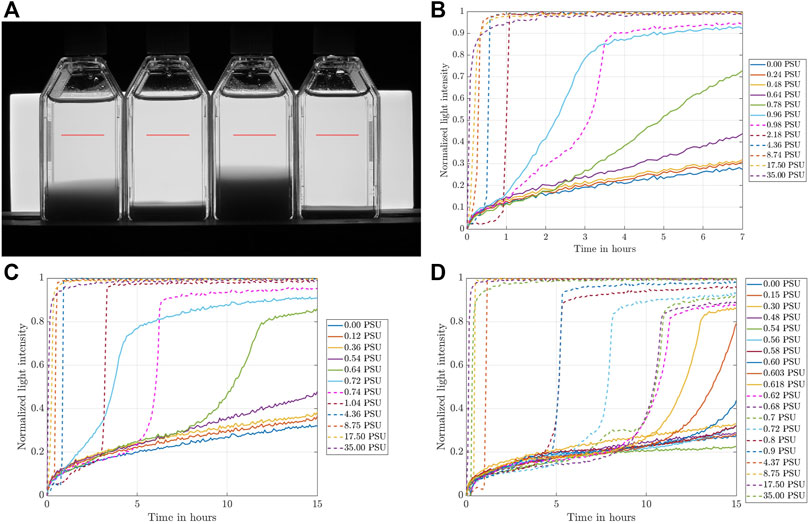
FIGURE 5. (A) Characteristic picture taken by the camera and observation level to measure the light intensity over time (marked in red), and normalized light intensity over time for various salt concentrations recorded at the observation level for (B) 4 ppt, (C) 6 ppt, and (D) 8 ppt.
Despite the qualitative differences observed in Figure 4, the settling behavior shown in Figures 5B–D is remarkably similar among the different clay concentrations. As expected, for large salt concentrations, rapid aggregation occurs that speeds up the settling process so that the fluid in the observation level clears up much more rapidly than for lower salt concentrations. For lower salt concentrations, the increase in light intensity takes a much longer time and transitions from a stepwise to a more gradual increase. The present results are in contrast with the recent findings of Rommelfanger et al. (2022), who investigated the CCC of Kaolin clay with a similar experimental protocol. In this study, the settling process of 4–40 ppt Kaolin clay over a vertical distance of 4.5 cm was completed within 10 min, which is substantially shorter than the settling process observed with 4–8 ppt Montmorillonite in the present study. This suggests that the different clay properties, namely different CECs of 3 cmolc/kg and 88.1 cmolc/kg for kaolinite and montmorillonite, respectively, yield settling speeds that differ by orders of magnitude. Montmorillonite as used in the present study can, therefore, be seen as an extreme case in terms of its CEC and, hence, its ability to flocculate.
It is now interesting to compare the observed light intensity recorded for different salinities at different observation times to provide a quantitative comparison among the settling behavior with different salinities (Rommelfanger et al., 2022). This was done at
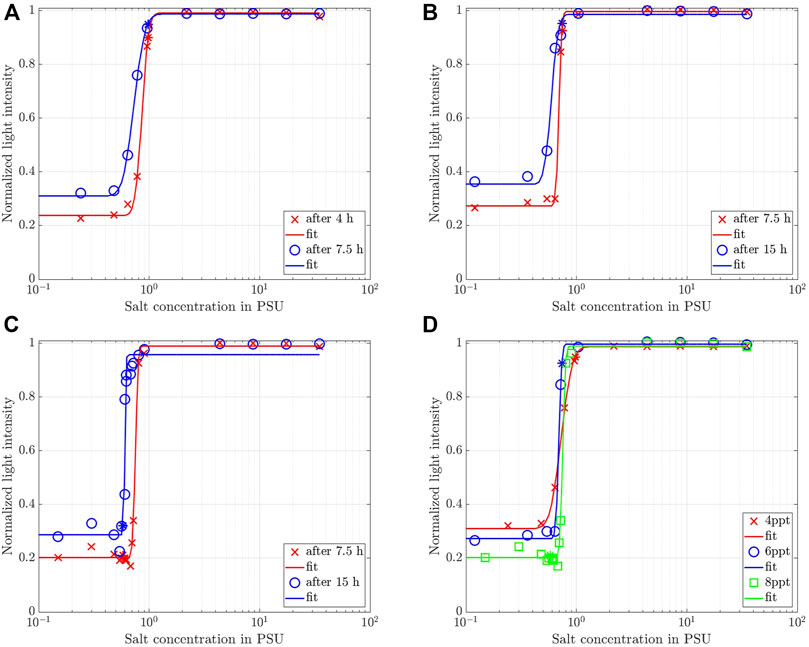
FIGURE 6. Normalized light intensity for 4 ppt recorded at the observation level marked in Figure 5A at two different observation times as a function of salinity for (A) 4 ppt, (B) 6 ppt, (D) 8 ppt. Solid lines represent a best fit of Eq. 7. (D) Synoptic comparison among the three different clay concentrations at
A similar behavior was reported for kaolin clay by Rommelfanger et al. (2022). Hence, we follow their reasoning and fit an error function of the form
where
Another way to analyze the data compiled in Figures 5B–D in more detail is to cut horizontally to determine the time it takes for the supernatant to clear to a normalized light intensity of 0.4, which we denote as
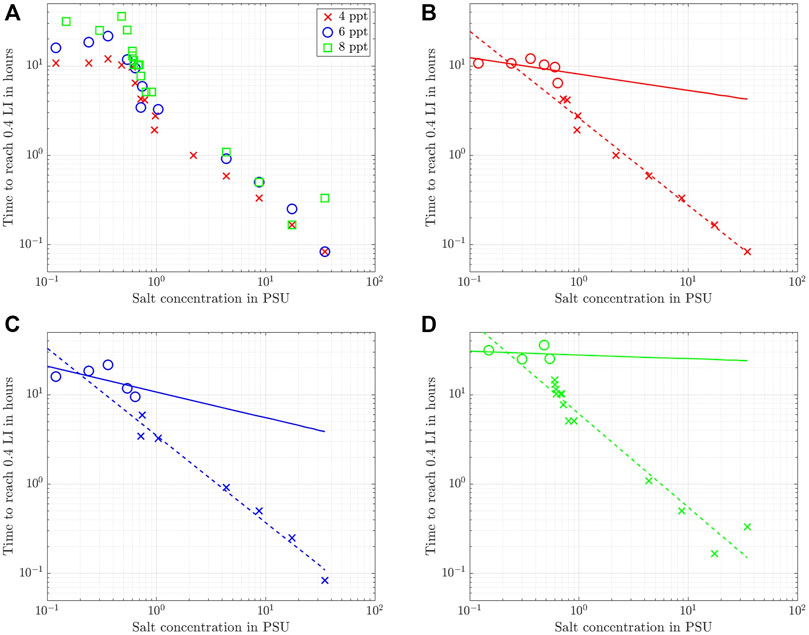
FIGURE 7. Time required for the normalized light intensity to clear up to 0.4. (A) For all three batches for comparison, (B) 4 ppt, (C) 6 ppt, and (D) 8 ppt. The solid and dashed lines represent power law fits to the circles and crosses, respectively.
Looking at the data for the three clay concentrations in Figure 7A, it becomes immediately obvious that two data ranges exist for all three clay concentrations that demarcate low from high salinities and, hence, the ability of the sediment to flocculate. For low salt concentrations,
where, again,
The results of the fit are shown in Figures 7B–D as solid and dashed lines for the low and high salinity data ranges, respectively. To this end, the data was truncated into two different sets (circles and crosses) by visual inspection of the graphs. Due to this heuristic choice to distinguish between high and low salinity, a bit of scatter exists for the data with low salt concentrations, but the overall agreement of these fits with the experimental data is very good, especially for the high salt concentrations. Note, however, that the good fit with a power law at higher salt concentrations does not imply
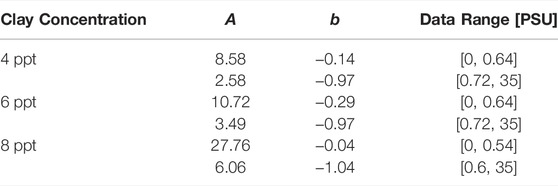
TABLE 3. Results for the fit of Equation 8 to the data shown in Figure 7.
The analysis of
Overall, we conclude for the Wyoming bentonite with a CEC of 88.1 cmolc/kg used in this study that a change in the settling dynamics sets in for salinities in the range 0.5 PSU to 1 PSU. This value range is about 25 times larger than the one determined for kaolin clay with a CEC of 3 cmolc/kg by Rommelfanger et al. (2022), who reported a critical salinity of 0.04 PSU for suspensions as dense as 40 ppt. Since the CEC of the clay used in the present study is 30 times higher and the suspensions are much more dilute than the material used by Rommelfanger et al. (2022), the present study confirms the linear dependency of the CCC on the CEC that was postulated by Rommelfanger et al. (2022). We furthermore note, that even though the
For the analysis of the settling velocity outlined in Section 2.3, we choose a grain density of 2.753 g/cm3. This value was determined so as to obtain a sieving curve, where grain sizes larger than 20 µm describe the entire sediment sample, i.e., the cumulative sum of all grain size fractions come out to be 100%. This value is also in good agreement with previous analyses of the Volclay SPV (Kaufhold, 2021).
Figures 8A,B show characteristic photos of the standard hydrometer analysis for the suspension settling process at the initial stage and the end of the experiment. Every run was conducted in three parallel batches to ensure reproducibility. Readings of the hydrometer were taken after 30 s, 1 min, 2, 5, 15, 45 min, 2, 6, and 24 h. For the initial readings, no or only little difference in the submersion depth of the hydrometer was detected (Figure 8A). This is the consequence of having only a small fraction of grains larger than 20 µm in the sample. After a total of 24 h of observation time, a good part of the particles still remains in suspension (Figure 8B), which reflects the high proportion of grain sizes smaller than 2 µm. Owing to the added dispersant, these types of grains did not flocculate so that their weight is entirely supported by Brownian motion to form a stable sol that will not settle out (Partheniades, 2009). Indeed, we tested this for more than a week of observation time, but it is not shown here as it does not add to the analysis of the grain size distribution.
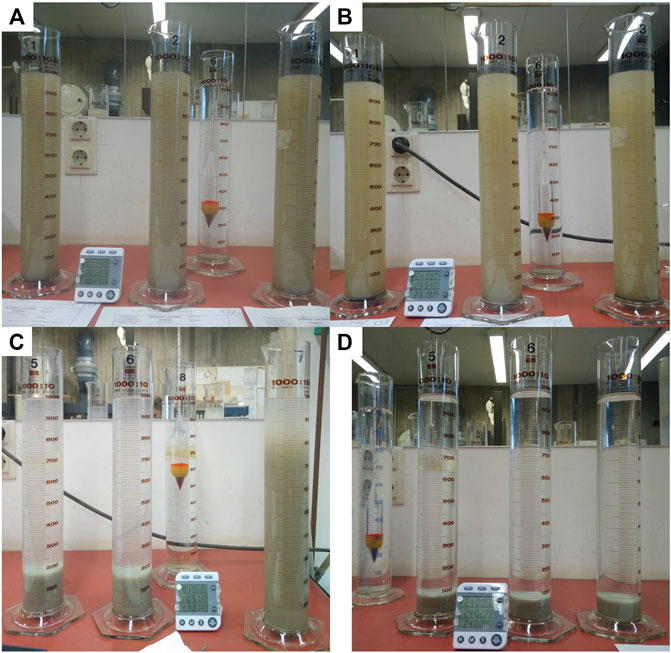
FIGURE 8. Experimental setup for the hydrometer analysis to determine the grain size distributions with three identical probes per run to guarantee reproducibility. (A) montmorillonite clay in DI-water after 1 h 15 min, (B) same as (A) but after 24 h, (C) montmorillonite clay in salt water (35 PSU) after 1 h (cylinder 5 and 6) and 7 min (cylinder 7), and (D) same as (C) but after 24 h.
Using the standard hydrometer analysis, a bulk settling velocity of 0.0105 cm/s was determined following the methodology described in Section 2.3. Furthermore, we can determine the grain size distribution from this analysis to compare it to the granulometry analysis provided by the BGR (Dohrmann, 2020). Based on the chosen time intervals for the reading, the standard hydrometer analysis yields 85% grains smaller than 2 μm, 4% of the grains within the range 2–6.3 µm, 4% of the grains within the range 6.3–20, and 7% larger than 20 µm. These values are in very good agreement with the grain size distribution determined via X-ray ganulometry by the BGR (cf. Section 2.1).
As expected, the modified hydrometer analysis revealed a very different behavior. Omitting the addition of the dispersant, but instead using DI water to create a solution with sodium chloride (salinity 35 PSU) promoted flocculation, so that rapid settling of the suspension can be observed. In fact, the experiment was ended after 15 min observation time, because by this point most of the sediment had already settled on the bottom of the cylinder. This becomes visible in Figure 8C that shows the modified hydrometer procedure after 7 min 43 s (most right cylinder) and about 1 h (middle and left cylinder). After 24 h, the fluid was completely clear and sediment on the bottom of the cylinder had consolidated (Figure 8D). Even at the early observation time (∼7 min), the suspension had already cleared the top third of the right cylinder. Recall that this modified procedure, therefore, does not yield the actual grain size diameter as a result, but a diameter that is equivalent to a solid sphere that would settle with the same velocity than the flocculated clay.
With the same framework of the hydrometer analysis outlined in Section 2.3, we determine an equivalent settling velocity of 0.345 cm/s, which is 30 times more than the settling velocity determined for the standard procedure. Consequently, the flocs of this experiment all have an equivalent diameter larger than 6.3 µm. A proportion of 35% has an equivalent grain size in the range 6.3–20 μm and 65% exceed an equivalent grain size diameter of 20 µm. The drastic increase in equivalent grain size once more illustrates the strong effect of flocculation on the settling process. Since we found in Section 3.2 and Section 3.3 that this effect sets in at ∼0.6 PSU and rapidly reaches a well-developed stage with increasing salinity, we conclude that the grain size distribution for the flocculated sediment represents the characteristic sediment composition for most aquatic environments.
The results reported so far demonstrate that a very low salinity is sufficient to serve as the critical constituent to trigger flocculation in pH-neutral conditions. To investigate how biogenic cohesion can add to the flocculation behavior of bentonite, we analyze additional data from previously conducted experiments of bentonite in salt water with and without EPS (Ye et al., 2020, 2021). The two batches one with pure bentonites and with EPS + bentonite in saltwater of 35 PSU have been evaluated in terms of their floc size
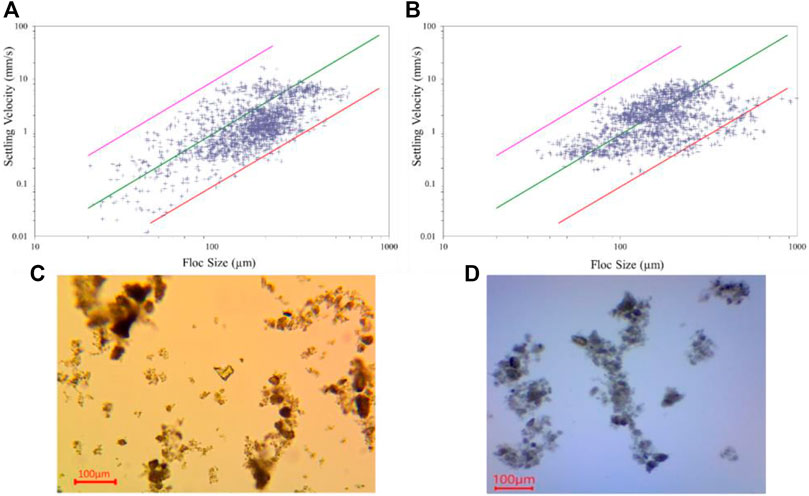
FIGURE 9. Settling velocity as a function of floc size measured in the LabSFLOC-2 experimental setup. (A) pure bentonite and (B) bentonite with EPS. The solid lines provide settling velocities for different effective densities according to Eq. 7 (magenta
To understand the diverse properties of the generated flocs, the floc population is often classified into different floc size classes (Eisma, 1986; Dyer et al., 1996). Particularly, the floc diameter has often been used by numerical models of cohesive sediment transport to distinguish between micro- and macroflocs (e.g. Lee et al., 2011). Here, we follow this approach and define those two size classes by choosing a critical floc size of 160
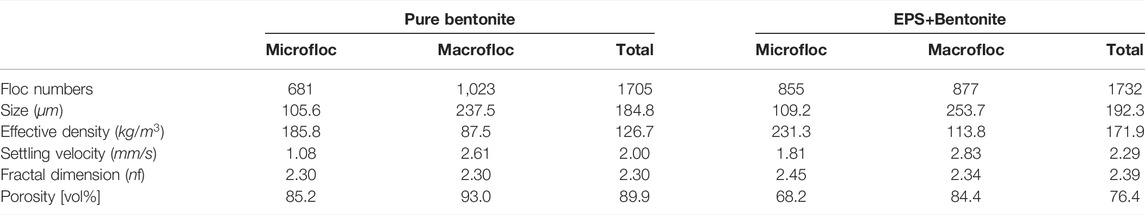
TABLE 4. Summary of microflocs (
Looking at the entire floc population of the pure bentonite sample (Figure 9A and Table 4), the 1705 individual flocs demonstrated sizes ranging from 20 to 600
Making the distinction of micro- and macroflocs for the pure bentonite, we find a total of 680 microflocs (
For the batch of bentonite flocs with EPS, we perform the same statistical analysis. We detected a total of 1732 flocs and find that among the total floc populations the flocs are larger in size ranging between 34 and 993 µm. As expected, the EPS acts as an adhesive and created a total of 94 flocs larger than 400 μm, which is 5.4% of the entire floc population and triples the number (1.7%) of the pure bentonite sample. Specifically, there are 10 flocs that substantially exceeded the maximum floc size observed for pure bentonite, i.e., (
More insights of EPS bentonite flocs can be found in the analysis of the two floc size classes (Table 4). The microflocs of bentonite with EPS are of almost the same size (
The findings of this analysis confirm the results obtained from the differential settling analysis of Section 3.2 that particles flocculate in salt water under shear and form aggregates that are much larger than the individual primary clay platelets. Adding EPS to bentonite in salt water enhances the ability to flocculate by allowing the clay minerals to form larger aggregates that are more stable and having a slightly faster settling based on the mean value. However, the overall effect of EPS on bentonite floc settling velocity is not significant.
In the present study, we conducted three experimental campaigns to clarify the importance of different mechanisms for flocculation of bentonite clay minerals as a prototype clay with a high cation exchange capacity. First, experiments based on differential settling of moderately turbid suspensions in the semi-dilute regime with varying salinity revealed that there exists a critical salt concentration at about 0.6 ppt, where flocculation is triggered. This salt concentration is barely above the threshold for the salinity of fresh water and exceeds most of the salinities reported for natural surface waters. It can therefore be concluded that nearly all natural occurring aquatic environments exceed this critical threshold concentration of salinity for the onset of flocculation. Evidence of similarly low values have been reported by Krone (1963) and Gibbs (1983) for sediments sampled in various estuarine environments, but the precise threshold value was not determined in such a systematic manner. For example, Gibbs (1983) reported a salinity of 0.5–1 ppt for various clay compositions by varying salinity in the range 0.5–17.5 ppt in only four increments, whereas we varied salinity from 0 to 35ppt in up to 20 increments that are systematically refined in the range of threshold conditions. Nevertheless, the results of our study seemingly contradict a number of field studies that reported varying floc sizes as a function of salt concentration in estuaries, i.e. the higher the salt concentration the larger the flocs (e.g., Thill et al., 2001; Huang, 2017), but it is very hard to identify single parameters as a key trigger for flocculation in these complex environments (Mikeš and Manning, 2010). It is well known that estuaries show a systematic decrease of local shear rates along with an increase in salinity as one moves from riverine to coastal conditions. In particular, the shear rate is known to play a governing role in the control of floc sizes (Verney et al., 2011).
The results of the present study, however, give clear indication that fine-grained suspended sediments are in the flocculated state even in freshwater environments, which has important consequences on their hydrodynamic properties such as their settling velocities. Indeed, this is confirmed by the second experiment conducted in the present study, the modified hydrometer analysis, where it was revealed that the floc size increases to aggregates larger than 20 µm in a salient ambient fluid with 35 PSU. Consequently, such particles in suspension can no longer be described as individual clay platelets (smaller than 2 µm) but the primary particle becomes an assembly of several hundred coagulated platelets (Partheniades, 2008). In addition, it was shown by Rommelfanger et al. (2022) that the CEC can be used as an indicator for the capacity of the suspended clay mineral to bind cations before flocculation sets in. We can, therefore expect that the threshold salinity for the onset of flocculation decreases further for clay minerals with an even lower cation exchange capacity (e.g., kaolinite).
We subsequently conducted a third analysis based on the LabSFLOC-2 experimental setup to clarify the role of EPS on bentonite flocs in salt water at salinity 35 PSU. Since the bentonite is already flocculated at this salinity, this allows to investigate, whether there is an additional flocculation effect due to the adhesive nature of the EPS coating of the clay minerals. Our data show that, while there is a change in the specific density and size distribution between microflocs and macroflocs, the overall floc size was approximately the same for the two batches of pure bentonite and bentonite with EPS. Nevertheless, we see effects in terms of enhanced settling velocities and larger effective densities for flocs of bentonite with EPS and the adhesive EPS coating allows for larger maximum floc sizes.
Our results confirm the findings of Lamb et al. (2020) that all fine-grained sediments in open water are likely to be flocculated and challenge the existence of wash-load, where all sediments are transported in suspension and never make contact with the sediment bed (Partheniades, 1977). The salinity of natural open waters is already sufficient to trigger flocculation. Depending on the microbiological activity in open-water bodies, EPS coatings on flocculated clay minerals can enhance the effect even further, but this was not found to be a prerequisite for flocculation to take place. We derive these findings from pure bentonite but we hypothesize that these observations will also hold for mixtures of mineral compositions (Zhu et al., 2018). This conclusion is in contrast to the study by Guo and He (2011), who claimed that biochemical factors are more important in riverine environments due to the more favorable hydrodynamic (shear) and biochemical conditions (particulate and dissolved organic carbon). Nevertheless, since biofilms are ubiquitous even in salt water conditions (Malarkey et al., 2015), the effect of biofilms is likely to be less important and the salt concentration can be regarded as the governing trigger for the onset of flocculation.
Future work of these types of experiments should focus on sediment compositions sampled from natural environments (Mikeš and Manning, 2010) and the effect of naturally grown EPS instead of xanthan gum (Ye et al., 2020) as well as the impact of varying shear rates as another important control mechanism for the maximum floc size in estuarine environments (Guo et al., 2021).
The raw data supporting the conclusion of this article will be made available by the authors, without undue reservation.
EK and BV performed the experiments and conducted the analysis of the differential settling setup. LY, T-JH, and AM conducted the LabSFLOCS-2 experiments. BV conceived the idea of the research project and helped with the data analysis of the LabSFLOCS-2 experiments. All authors read and approved the manuscript.
BV gratefully acknowledges the financial support by the German Research Foundation (DFG) grant VO2413/2-1. LY, T-JH, and AM contribution towards this research was supported by the National Science Foundation (OCE-1924532) and a grant from the Gulf of Mexico Research Initiative to support CSOMIO (Consortium for Simulation of Oil-Microbial Interactions in the Ocean) (Grant No. SA18-10). AM contribution toward this research was also partly assisted by the TKI-MUSA project 11204950-000-ZKS-0002, HR Wallingford company research FineScale project (Grant no. ACK3013_62), and NSF grant OCE-1736668.
AM was employed by the HR Wallingford Ltd.
The remaining authors declare that the research was conducted in the absence of any commercial or financial relationships that could be construed as a potential conflict of interest.
All claims expressed in this article are solely those of the authors and do not necessarily represent those of their affiliated organizations, or those of the publisher, the editors and the reviewers. Any product that may be evaluated in this article, or claim that may be made by its manufacturer, is not guaranteed or endorsed by the publisher.
The authors thank Reiner Dohrmann from the German Federal Institute of Geosciences and Natural Resources (BGR) for the mineralogic analysis of the bentonite clay.
Adachi, Y., Kawashima, Y. T., and Ghazali, M. E. B. (2020). Rheology and Sedimentation of Aqueous Suspension of Na-Montmorillonite in the Very Dilute Domain. KONA Powder Part. J. 37, 145–165. doi:10.14356/kona.2020019
Ahmerkamp, S., Liu, B., Kindler, K., Maerz, J., Stocker, R., Kuypers, M. M. M., et al. (2022). Settling of Highly Porous and Impermeable Particles in Linear Stratification: Implications for Marine Aggregates. J. Fluid Mech. 931, A9. doi:10.1017/jfm.2021.913
Benson, T., and Manning, A., 2013. Digifloc: the Development of Semi-automatic Software to Determine the Size and Settling Velocity of Flocs. HR Wallingford Report DDY0427-Rt001.
Berg, J. C. (2010). An Introduction to Interfaces & Colloids: The Bridge to Nanoscience. Singapore: World Scientific.
Black, K. S., Tolhurst, T. J., Paterson, D. M., and Hagerthey, S. E. (2002). Working with Natural Cohesive Sediments. J. Hydraul. Eng. 128 (1), 2–8. doi:10.1061/(asce)0733-9429(2002)128:1(2)
Brüggemann, K. (1982). Die Bodenprüfverfahren bei Straßenbauten. Düsseldorfin, German: Werner Verlag.
Cañedo-Argüelles, M., Kefford, B. J., Piscart, C., Prat, N., Schäfer, R. B., Schulz, C. J., et al. (2013). Salinisation of Rivers: an Urgent Ecological Issue. Environ. Pollut. 173, 157–167. doi:10.1016/j.envpol.2012.10.011
Dohrmann, R., Rüping, K. B., Kleber, M., Ufer, K., and Jahn, R. (2009). Variation of Preferred Orientation in Oriented Clay Mounts as a Result of Sample Preparation and Composition. Clays Clay Min. 57 (6), 686–694. doi:10.1346/ccmn.2009.0570602
Droppo, I. G., and Ongley, E. D. (1994). Flocculation of Suspended Sediment in Rivers of Southeastern Canada. Water Res. 28 (8), 1799–1809. doi:10.1016/0043-1354(94)90253-4
Dyer, K., Cornelisse, J., Dearnaley, M., Fennessy, M., Jones, S., Kappenberg, J., et al. (1996). A Comparison of In Situ Techniques for Estuarine Floc Settling Velocity Measurements. Neth. J. Sea Res. 36 (1-2), 15–29. doi:10.1016/s0077-7579(96)90026-5
Eisma, D., Schuhmacher, T., Boekel, H., Van Heerwaarden, J., Franken, H., Lann, M., et al. (1990). A Camera and Image Analysis System for In Situ Observation of Flocs in Natural Waters. J. Hydraulic Res. 27, 43–56. doi:10.1080/00221686.2016.1212938
Eisma, D. (1986). Flocculation and De-flocculation of Suspended Matter in Estuaries. Neth. J. sea Res. 20 (2-3), 183–199. doi:10.1016/0077-7579(86)90041-4
Fang, H., Fazeli, M., Cheng, W., and Dey, S. (2016). Transport of Biofilm-Coated Sediment Particles. J. Hyraul. Res. 54 (6), 631–645.
Fennessy, M. J., Dyer, K. R., and Huntley, D. A. (1994). Size and Settling Velocity Distributions of Flocs in the Tamar Estuary during a Tidal Cycle. Neth. J. Aquat. Ecol. 28, 275–282. doi:10.1007/bf02334195
Fennessy, M. J., Dyer, K. R., Huntley, D. A., and Bale, A. J. (1997). “Estimation of Settling Flux Spectra in Estuaries Using INSSEV,” in Cohesive Sediments – Proceedings of INTERCOH Conference, Wallingford, England. Editors N. Burt, R. Parker, and J. Watts (Chichester: John Wiley & Sons), 87–104.
Ghazali, M. E. B., Argo, Y., Kyotoh, H., and Adachi, Y. (2020). Effect of the Concentration of NaCl and Cylinder Height on the Sedimentation of Flocculated Suspension of Na-Montmorillonite in the Semi-dilute Regime. Paddy Water Environ. 18 (2), 309–316. doi:10.1007/s10333-019-00783-6
Gibbs, R. J., Tshudy, D. M., Konwar, L., and Martin, J. M. (1989). Coagulation and Transport of Sediments in the Gironde Estuary. Sedimentology 36 (6), 987–999. doi:10.1111/j.1365-3091.1989.tb01536.x
Gibbs, R. J. (1983). Coagulation Rates of Clay Minerals and Natural Sediments. J. Sediment. Res. 53 (4), 1193–1203.
Goldberg, S., and Glaubig, R. A. (1987). Effect of Saturating Cation, pH, and Aluminum and Iron Oxide on the Flocculation of Kaolinite and Montmorillonite. Clays Clay Miner. 35 (3), 220–227. doi:10.1346/ccmn.1987.0350308
Gratiot, N., and Manning, A. (2004). An Experimental Investigation of Floc Characteristics in a Diffusive Turbulent Flow. J. Coast Res., 105–113.
Gundersen, P., and Steinnes, E. (2003). Influence of pH and TOC Concentration on Cu, Zn, Cd, and Al Speciation in Rivers. Water Res. 37 (2), 307–318. doi:10.1016/s0043-1354(02)00284-1
Guo, C., Manning, A. J., Bass, S., Guo, L., and He, Q. (2021). A Quantitative Lab Examination of Floc Fractal Property Considering Influences of Turbulence, Salinity and Sediment Concentration. J. Hydrol. 601, 126574. doi:10.1016/j.jhydrol.2021.126574
Guo, L., and He, Q. (2011). Freshwater Flocculation of Suspended Sediments in the Yangtze River, China. Ocean Dyn. 61 (2), 371–386. doi:10.1007/s10236-011-0391-x
Hsu, T.-J., Penaloza-Giraldo, J., Yue, L., Manning, A. J., Meiburg, E., and Vowinckel, B. (2021). “Toward Modeling Flocculation in Turbulence-Resolving Simulations for Cohesive Sediment Transport,” in AGU Fall Meeting, 2021.
Huang, I. B. (2017). Cohesive Sediment Flocculation in a Partially-Stratified Estuary. PhD thesis. Stanford: Stanford University.
Jarvis, P., Jefferson, B., Gregory, J. O. H. N., and Parsons, S. A. (2005). A Review of Floc Strength and Breakage. Water Res. 39 (14), 3121–3137. doi:10.1016/j.watres.2005.05.022
Kaufhold, S., Kaufhold, A., and Dohrmann, R. (2018). Comparison of the Critical Coagulation Concentrations of Allophane and Smectites. Colloids Interfaces 2 (1), 12. doi:10.3390/colloids2010012
Kaufhold, (2021). Bentonites – Characterization, Geology, Mineralogy, Analysis, Mining, Processes and Uses. Stuttgart: Schweizerbart.
Kranenburg, C. (1994). The Fractal Structure of Cohesive Sediment Aggregates. Estuar. Coast. Shelf Sci. 39, 451–460. doi:10.1006/ecss.1994.1075
Krone, R. B. (1962). Flume Studies of the Transport of Sediment in Estuarial Shoaling Process: Final Report. Berkeley: Hydraulic Engineering Laboratory and Sanitary Engineering Research Laboratory, University of California.
Krone, R. B. (1963). A Study of Rheological Properties of Estuarial Sediments. Report No. 63–68. Berkeley: Hydraulic Engineering Laboratory and Sanitary Engineering Research Laboratory, University of California.
Kumar, R. G., Strom, K. B., and Keyvani, A. (2010). Floc Properties and Settling Velocity of San Jacinto Estuary Mud under Variable Shear and Salinity Conditions. Cont. Shelf Res. 30 (20), 2067–2081. doi:10.1016/j.csr.2010.10.006
Kuprenas, R., Tran, D., and Strom, K. (2018). A Shear-limited Flocculation Model for Dynamically Predicting Average Floc Size. J. Geophys. Res. Oceans 123 (9), 6736–6752. doi:10.1029/2018jc014154
Lagaly, G., Schulz, O., and Zimehl, R. (2013). Dispersionen und Emulsionen: eine Einführung in die Kolloidik feinverteilter Stoffe einschließlich der Tonminerale. Berlin: Springer-Verlag.
Lamb, M. P., de Leeuw, J., Fischer, W. W., Moodie, A. J., Venditti, J. G., Nittrouer, J. A., et al. (2020). Mud in Rivers Transported as Flocculated and Suspended Bed Material. Nat. Geosci. 13 (8), 566–570. doi:10.1038/s41561-020-0602-5
Le Floch, S., Guyomarch, J., Merlin, F.-X., Stoffyn-Egli, P., Dixon, J., Lee, K., et al. (2002). The Influence of Salinity on Oil Mineral Aggregate Formation. Spill Sci. Technol. Bull. 8 (1), 65–71. doi:10.1016/s1353-2561(02)00124-x
Lee, B. J., Toorman, E., Molz, F. J., and Wang, J. (2011). A Two-Class Population Balance Equation Yielding Bimodal Flocculation of Marine or Estuarine Sediments. Water Res. 45 (5), 2131–2145. doi:10.1016/j.watres.2010.12.028
Malarkey, J., Baas, J. H., Hope, J. A., Aspden, R. J., Parsons, D. R., Peakall, J., et al. (2015). The Pervasive Role of Biological Cohesion in Bedform Development. Nat. Commun. 6 (1), 6257. doi:10.1038/ncomms7257
Malpezzi, M. A., Sanford, L. P., and Crump, B. C. (2013). Abundance and Distribution of Transparent Exopolymer Particles in the Estuarine Turbidity Maximum of Chesapeake Bay. Mar. Ecol. Prog. Ser. 486, 23–35. doi:10.3354/meps10362
Manning, A. J., and Bass, S. J. (2006). Variability in Cohesive Sediment Settling Fluxes: Observations under Different Estuarine Tidal Conditions. Mar. Geol. 235, 177–192. doi:10.1016/j.margeo.2006.10.013
Manning, A. J., and Dyer, K. R. (2002). “A Comparison of Floc Properties Observed during Neap and Spring Tidal Conditions,” in Fine Sediment Dynamics in the Marine Environment – Proceedings in Marine Science 5. Editors J. C. Winterwerp, and C. Kranenburg (Amsterdam: Elsevier), 233–250.
Manning, A., and Dyer, K. (2007). Mass Settling Flux of Fine Sediments in Northern European Estuaries: Measurements and Predictions. Mar. Geol. 245 (1e4), 107–122. doi:10.1016/j.margeo.2007.07.005
Manning, A. J., and Schoellhamer, D. H. (2013). Factors Controlling Floc Settling Velocity along a Longitudinal Estuarine Transect. Mar. Geol. 345, 266–280. doi:10.1016/j.margeo.2013.06.018
Manning, A. J., Bass, S. J., and Dyer, K. R. (2006). Floc Properties in the Turbidity Maximum of a Mesotidal Estuary during Neap and Spring Tidal Conditions. Mar. Geol. 235, 193–211. doi:10.1016/j.margeo.2006.10.014
Manning, A. J., Baugh, J. V., Spearman, J. R., and Whitehouse, R. J. (2010). Flocculation Settling Characteristics of Mud: Sand Mixtures. Ocean. Dyn. 60 (2), 237–253. doi:10.1007/s10236-009-0251-0
Manning, A. J. (2001). A Study of the Effects of Turbulence on the Properties of Flocculated Mud. Ph.D. Thesis. Institute of Marine Studies, University of Plymouth.
Manning, A. J. (2004). “The Observed Effects of Turbulence on Estuarine Flocculation,” in Sediment Transport in European Estuaries. Editors P. Ciavola, and M. B. Collins, 41, 90–104. Journal of Coastal Research.
Manning, A. J., Friend, P. L., Prowse, N., and Amos, C. L. (2007). Preliminary Findings from a Study of Medway Estuary (UK) Natural Mud Floc Properties Using a Laboratory Mini-flume and the LabSFLOC system. Cont. Shelf Res. 27 (8), 1080–1095. doi:10.1016/j.csr.2006.04.011
Mehta, A. J., and McAnally, W. H. (2008). “Fine Grained Sediment Transport,” in Sedimentation Engineering: Processes, Measurements, Modeling, and Practice. Editor M. Garcia (Reston, Va: ASCE), 253–306.
Mehta, A. J. (2014). An Introduction to Hydraulics of Fine Sediment Transport. Advanced Series on Ocean Engineering, 38. Hackensack, NJ: World Scientific Publishing Co.
Mietta, F., Chassagne, C., Manning, A. J., and Winterwerp, J. C. (2009). Influence of Shear Rate, Organic Matter Content, pH and Salinity on Mud Flocculation. Ocean. Dyn. 59 (5), 751–763. doi:10.1007/s10236-009-0231-4
Mikeš, D., and Manning, A. J. (2010). Assessment of Flocculation Kinetics of Cohesive Sediments from the Seine and Gironde Estuaries, France, through Laboratory and Field Studies. J. Waterw. Port. Coast. Ocean. Eng. 136 (6), 306–318. doi:10.1061/(asce)ww.1943-5460.0000053
Parsons, D. R., Schindler, R. J., Hope, J. A., Malarkey, J., Baas, J. H., Peakall, J., et al. (2016). The Role of Biophysical Cohesion on Subaqueous Bed Form Size. Geophys. Res. Lett. 43 (4), 1566–1573. doi:10.1002/2016gl067667
Partheniades, E. (1977). Unified View of Wash Load and Bed Material Load. J. Hydr. Div. 103 (9), 1037–1057. doi:10.1061/jyceaj.0004825
Partheniades, E. (2009). Cohesive Sediments in Open Channels: Erosion, Transport and Deposition. Oxford: Butterworth-Heinemann.
Passow, U. (2012). The Abiotic Formation of TEP under Different Ocean Acidification Scenarios. Mar. Chem. 128, 72–80. doi:10.1016/j.marchem.2011.10.004
R. J. Uncles, and S. B. Mitchell (Editors) (2017). Estuarine and Coastal Hydrography and Sediment Transport (Cambridge: Cambridge University Press).
Rommelfanger, N., Vowinckel, B., Wang, Z., Dohrmann, R., Meiburg, E., and Luzzatto-Fegiz, P. (2022). A Simple Criterion and Experiments for Onset of Flocculation in Kaolin Clay Suspensions. arXiv preprint arXiv:2203.15545. https://arxiv.org/abs/2203.15545.
Schindler, R. J., Parsons, D. R., Ye, L., Hope, J. A., Baas, J. H., Peakall, J., et al. (2015). Sticky Stuff: Redefining Bedform Prediction in Modern and Ancient Environments. Geology 43, 399–402. doi:10.1130/G36262.1
Seiphoori, A., Gunn, A., Kosgodagan Acharige, S., Arratia, P. E., and Jerolmack, D. J. (2021). Tuning Sedimentation through Surface Charge and Particle Shape. Geophys. Res. Lett. 48 (7). e2020GL091251. doi:10.1029/2020gl091251
Spencer, K. L., Wheatland, J. A., Bushby, A. J., Carr, S. J., Droppo, I. G., Manning, A. J., et al. (2021). A Structure–Function Based Approach to Floc Hierarchy and Evidence for the Non-fractal Nature of Natural Sediment Flocs. Sci. Rep. 11 (1), 14012. doi:10.1038/s41598-021-93302-9
Stokes, G. G. (1851). On the Effect of the Internal Friction of Fluids on the Motion of Pendulums. Trans. Camb. Philosophical Soc. IX, 8.
Studds, P. G., Stewart, D. I., and Cousens, T. W. (1998). The Effects of Salt Solutions on the Properties of Bentonite-Sand Mixtures. Clay Miner. 33 (4), 651–660. doi:10.1180/claymin.1998.033.4.12
Sutherland, B. R., Barrett, K. J., and Gingras, M. K. (2015). Clay Settling in Fresh and Salt Water. Environ. Fluid Mech. (Dordr). 15 (1), 147–160. doi:10.1007/s10652-014-9365-0
Te Slaa, S., van Maren, D. S., He, Q., and Winterwerp, J. C. (2015). Hindered Settling of Silt. J. Hydraul. Eng. 141 (9), 04015020. doi:10.1061/(asce)hy.1943-7900.0001038
Thill, A., Moustier, S., Garnier, J. M., Estournel, C., Naudin, J. J., Bottero, J. Y., et al. (2001). Evolution of Particle Size and Concentration in the Rhône River Mixing Zone:. Cont. Shelf Res. 21 (18-19), 2127–2140. doi:10.1016/s0278-4343(01)00047-4
Tolhurst, T. J., Gust, G., and Paterson, D. M. (2002). “The Influence of an Extracellular Polymeric Substance (EPS) on Cohesive Sediment Stability,” in Proceedings in Marine Science (Elsevier), 5, 409–425.
van Leussen, W. (1999). The Variability of Settling Velocities of Suspended Fine-Grained Sediment in the Ems Estuary. J. sea Res. 41 (1-2), 109–118. doi:10.1016/s1385-1101(98)00046-x
van Olphen, H. (1977). An Introduction to Clay Colloid Chemistry. 2nd edn.. New York, NY: John Wiley & Sons.
Verney, R., Lafite, R., Brun-Cottan, J. C., and Le Hir, P. (2011). Behaviour of a Floc Population during a Tidal Cycle: Laboratory Experiments and Numerical Modelling. Cont. Shelf Res. 31 (10), S64–S83. doi:10.1016/j.csr.2010.02.005
Vowinckel, B., Biegert, E., Luzzatto-Fegiz, P., and Meiburg, E. (2019a). Consolidation of Freshly Deposited Cohesive and Noncohesive Sediment: Particle-Resolved Simulations. Phys. Rev. Fluids 4 (7), 074305. doi:10.1103/physrevfluids.4.074305
Vowinckel, B., Withers, J., Luzzatto-Fegiz, P., and Meiburg, E. (2019b). Settling of Cohesive Sediment: Particle-Resolved Simulations. J. Fluid Mech. 858, 5–44. doi:10.1017/jfm.2018.757
Vowinckel, B. (2021). Incorporating Grain-Scale Processes in Macroscopic Sediment Transport Models. Acta Mech. 232 (6), 2023–2050. doi:10.1007/s00707-021-02951-4
Winterwerp, J. C., and van Kesteren, W. G. (2004). Introduction to the Physics of Cohesive Sediment Dynamics in the Marine Environment. Amsterdam: Elsevier.
Winterwerp, J. C. (1998). A Simple Model for Turbulence Induced Flocculation of Cohesive Sediment. J. Hydraulic Res. 36, 309–326. doi:10.1080/00221689809498621
Winterwerp, J. C. (2002). On the Flocculation and Settling Velocity of Estuarine Mud. Cont. shelf Res. 22 (9), 1339–1360. doi:10.1016/s0278-4343(02)00010-9
Ye, L., Manning, A. J., and Hsu, T. J. (2020). Oil-mineral Flocculation and Settling Velocity in Saline Water. Water Res. 173, 115569. doi:10.1016/j.watres.2020.115569
Ye, L., Manning, A. J., Holyoke, J., Penaloza-Giraldo, J. A., and Hsu, T. J. (2021). The Role of Biophysical Stickiness on Oil-Mineral Flocculation and Settling in Seawater. Front. Mar. Sci. 8. doi:10.3389/fmars.2021.628827
Zhao, K., Pomes, F., Vowinckel, B., Hsu, T. J., Bai, B., Meiburg, E., et al. (2021). Flocculation of Suspended Cohesive Particles in Homogeneous Isotropic Turbulence. J. Fluid Mech. 921, A17. doi:10.1017/jfm.2021.487
Zhu, Z., Xiong, X., Liang, C., and Zhao, M. (2018). On the Flocculation and Settling Characteristics of Low-And High-Concentration Sediment Suspensions: Effects of Particle Concentration and Salinity Conditions. Environ. Sci. Pollut. Res. 25 (14), 14226–14243. doi:10.1007/s11356-018-1668-0
Keywords: bentonite, suspension, settling, flocculation, critical coagulation concentration, extracellular polymeric substances
Citation: Krahl E, Vowinckel B, Ye L, Hsu T-J and Manning AJ (2022) Impact of the Salt Concentration and Biophysical Cohesion on the Settling Behavior of Bentonites. Front. Earth Sci. 10:886006. doi: 10.3389/feart.2022.886006
Received: 28 February 2022; Accepted: 24 June 2022;
Published: 15 July 2022.
Edited by:
Eduardo Siegle, University of São Paulo, BrazilReviewed by:
Yasuhisa Adachi, University of Tsukuba, JapanCopyright © 2022 Krahl, Vowinckel, Ye, Hsu and Manning. This is an open-access article distributed under the terms of the Creative Commons Attribution License (CC BY). The use, distribution or reproduction in other forums is permitted, provided the original author(s) and the copyright owner(s) are credited and that the original publication in this journal is cited, in accordance with accepted academic practice. No use, distribution or reproduction is permitted which does not comply with these terms.
*Correspondence: Bernhard Vowinckel, Yi52b3dpbmNrZWxAdHUtYnJhdW5zY2h3ZWlnLmRl
Disclaimer: All claims expressed in this article are solely those of the authors and do not necessarily represent those of their affiliated organizations, or those of the publisher, the editors and the reviewers. Any product that may be evaluated in this article or claim that may be made by its manufacturer is not guaranteed or endorsed by the publisher.
Research integrity at Frontiers
Learn more about the work of our research integrity team to safeguard the quality of each article we publish.