 Paulina Janusz
 Vincent Perron
 Christoph Knellwolf2
95% of researchers rate our articles as excellent or good
Learn more about the work of our research integrity team to safeguard the quality of each article we publish.
Find out more
ORIGINAL RESEARCH article
Front. Earth Sci. , 09 May 2022
Sec. Geohazards and Georisks
Volume 10 - 2022 | https://doi.org/10.3389/feart.2022.885724
This article is part of the Research Topic New Challenges for Seismic Risk Mitigation in Urban Areas View all 11 articles
Amplification factors are often estimated using empirical methods based on earthquake ground motion; however, especially in low-seismicity urban areas, recording a statistically representative number of high-quality signals may take years. Hence, the attempts to use ambient vibration instead have progressed. This includes the development of the hybrid site-to-reference spectral ratio (SSRh) method that combines earthquake and ambient vibration recordings. We applied the method in the Lucerne area in central Switzerland that is characterized by low-to-moderate seismicity but was struck by several strong earthquakes in historical times (i.e., Mw 5.9 in 1,601) and is located in a glacial basin filled with unconsolidated deposits prone to significant amplification. To develop the high-resolution local site amplification model for the city of Lucerne using the SSRh method, we took advantage of a small seismic monitoring network installed in the Lucerne area in total for about a year and the stations of the Swiss Strong Motion Network (SSMNet). In addition, we performed two extensive surveys to record ambient vibrations and used dozens of measurements performed in the area since 2001. The resulting amplification model referring to the Swiss reference bedrock conditions indicates high-amplification factors (up to 10-fold) for a broad range of frequencies. The model is consistent with geological data and site response proxies such as f0 values. The direct comparison of our results with the SSR amplification functions for several sites shows good agreement. However, the model is characterized by high uncertainty and influenced by daily variation of the noise wavefield, as well as the spatial distribution of the stations of the seismic network. We also discussed the extent of the applicability of the method, concluding that the main factor influencing its performance is not the distance but the similarity of the site condition between the stations.
Estimation of site effects plays a crucial role in local seismic hazard and risk assessment. Indeed, the local soil condition can modify seismic ground motions’ amplitude and duration and impose significant spatial variability. In particular, the thick and soft sedimentary basins can considerably amplify the seismic waves. Events in 1985 in Mexico City and 1906 in the San Francisco area are examples, where earthquake-induced damage was significantly increased due to local site effects (e.g., Bard, 1997). Urban areas are especially vulnerable to earthquakes because of high-population density and the accumulation of exposed infrastructure. Due to recent rapid urban development, seismic risks in the cities cannot be neglected, even in countries characterized by moderate seismic hazards such as Switzerland.
The empirical site response can be evaluated from ground motion observations using the standard spectral ratio technique (SSR—Borcherdt, 1970) referenced to the local outcropping rock or methods based on the generalized inversion scheme (e.g., Andrews et al., 1986; Bindi et al., 2009) such as empirical spectral modeling (ESM) by Edwards et al. (2013). This method is used to obtain the empirical amplification functions with respect to the Swiss reference rock profile (Poggi et al., 2011). Nevertheless, the empirical approaches require a good statistical number of recordings with a high signal-to-noise ratio. In low-to-moderate seismicity urban areas that are characterized by the high background noise level, instruments often need to operate for years before recording a significant number of earthquakes. The associated cost of such deployment together with the lack of free-field space impedes using earthquake observations to assess the site response at high spatial resolution in urban environments. On the contrary, ambient vibration measurements can be performed easily and quickly even in densely populated cities. The ambient noise horizontal-to-vertical spectral ratio (HVSR) method first introduced by Nogoshi and Igarashi, (1971) and then revised and promoted by Nakamura, (1989) is commonly applied to determine the fundamental resonance frequency f0 of the site (e.g., Bonnefoy-Claudet et al., 2006; Fäh et al., 2001). However, the HVSR amplitude cannot be interpreted as a measure of amplification factors (e.g., Bonilla et al., 1997; Perron et al., 2018a; Poggi and Fäh, 2016). Therefore, the attempts to use ambient vibration to estimate directly the amplification factors were made by calculating spectral ratios from ambient noise recordings (SSRn—Kagami et al., 1982). As in the SSR method, the source and path components are assumed similar for both stations, and the spectral ratio expresses only the site effect term. It is, however, a strong statement regarding ambient noise, and many authors demonstrated that the SSRn approach overestimates the rock-relative amplification factors (e.g., Field et al., 1990; Perron et al., 2018a). Some other authors showed that it enables only to estimate the shape of the amplification curve (e.g., Lermo and Chavez-Garcia, 1994; Yamanaka et al., 1993), while several authors observed merely the similarity of the frequency of the SSRn main peak and fundamental frequency of resonance f0 (e.g., Field et al., 1990). No correlation was observed in other studies (e.g., Field, 1996). Perron et al. (2018a) provided detailed literature reports on this topic. The strong influence of close transient noise sources and effects of the impedance contrast between sediments and rock on the ambient noise wavefield may be the main reasons for the failure of the SSRn approach (Perron et al., 2018a). Hence, Perron et al. (2018a) introduced the hybrid approach (SSRh) combining the SSR and SSRn methods (Figure 1). The main idea of the SSRh method is to perform the SSRn approach only between sites located inside the sedimentary basin to map the spatial variation of the site response. Then, the SSRn curves are corrected using the rock-relative SSR at a few stations (at least one) inside the basin where earthquake recordings are available. The SSRh approach has shown comparable results to the direct SSR based on earthquake recordings (Perron et al., 2018a; Perron et al., 2022). In addition, the SSRh method allows for much higher spatial resolution because ambient noise can be fast recorded across wide areas, and it requires only a limited number of permanent seismic stations to be present in the region.
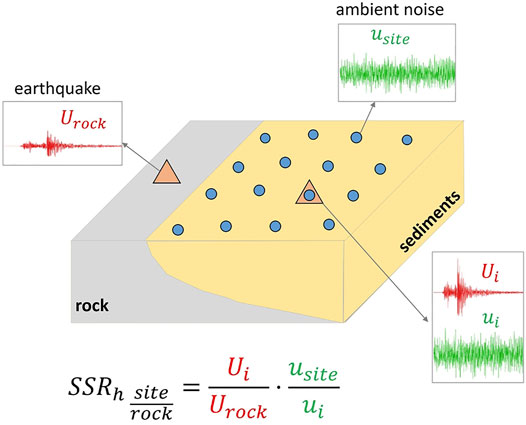
FIGURE 1. Schematic visualization of the SSRh method. Capital U indicates earthquake ground motion while u is the ambient vibration recording.
In this study, we will focus on Lucerne that is middle-sized but a densely populated town in central Switzerland (Figure 2A). The city is located on a soft sedimentary basin that is prone to site effects. During the last 50 years, the seismicity in central Switzerland has been low (Gisler et al., 2004); however, several strong historical earthquakes are evidenced, including an event in 1,601 with a moment magnitude Mw of 5.9 (Fäh et al., 2011). It was the strongest historical event in central Switzerland in the past millennium and one of the strongest events in the whole of Switzerland (Schwarz-Zanetti et al., 2003) and was followed by a 4–5 m-high tsunami (Schnellmann et al., 2004).
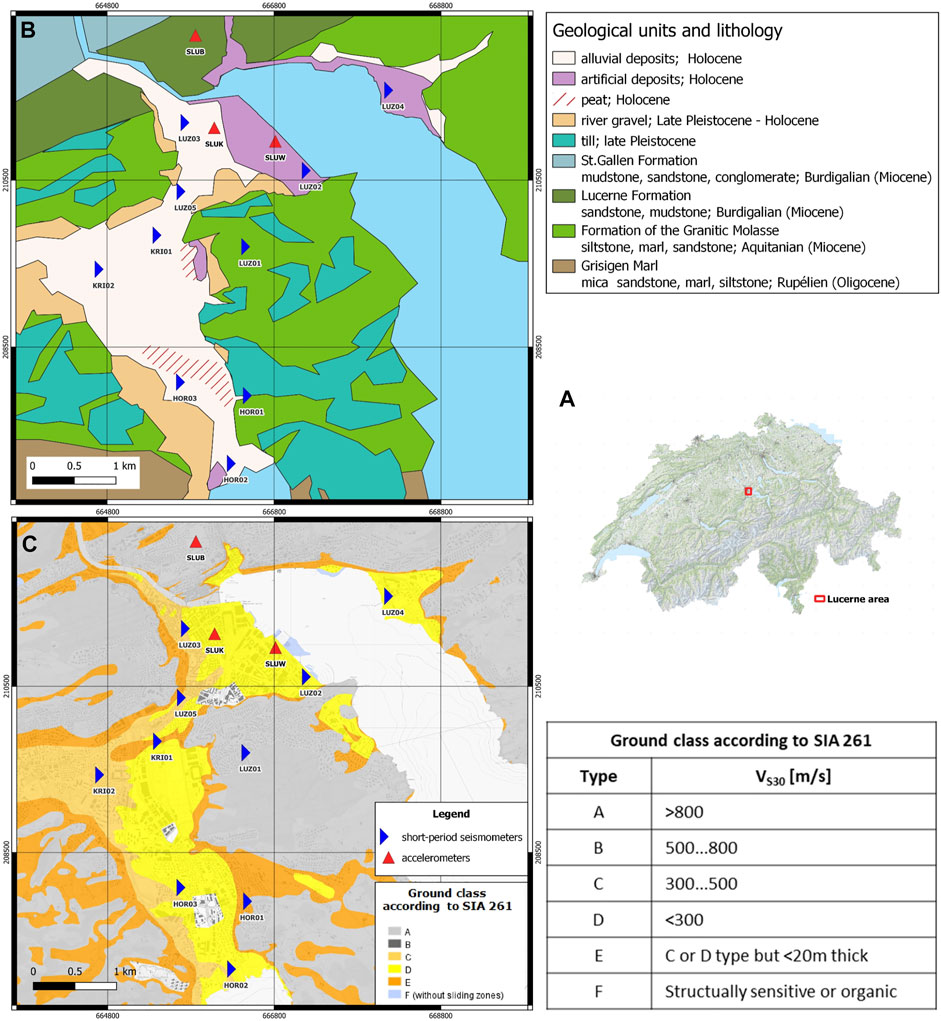
FIGURE 2. (A) Red rectangle on the map of Switzerland shows the location of the investigated area. (B) Simplified geological map based on Geological Vector Datasets GeoCover (s.geo.admin.ch/95a803e945) (C) Ground classes in the Lucerne area according to SIA 261 (SIA, 2020) (s.geo.admin.ch/96572c02d9). Stations of local seismic monitoring networks are shown.
Our study focuses on the application and optimization of the SSRh approach for the Lucerne area. We developed an amplification model at high spatial resolution and in a broad frequency range using the SSRh method. We verified the results by comparing them to the earthquake-based amplification functions. In addition, we tested several parameters that may influence the results. Moreover, we compared our results to geological data and to the fundamental resonance frequency that we mapped across the area. The aim of this article is not only to show an example of the SSRh method application but also to offer practical guidelines and advice to future users.
The study area is a relatively small basin filled with unconsolidated Quaternary fluvio-lacustrine deposits (Figure 2B), mainly consisting of interspersed layers of sand, gravel, clay, and silt (Keller + Lorenz, 2010; Poggi et al., 2012). Such predominantly soft sediments are classified as soil classes D, C, and E (Figure 2C), according to the Swiss building code classification (SIA, 2020), which is defined in terms of Vs30 ranges and is similar to EC8 classification (EC8, 2004). The basin was formed by the inter- and intraglacial processes in clastic sedimentary rocks, such as hard sandstones, siltstones, and mudstones deposited in the Subalpine Molasse basin. Hence, the bedrock interface geometry is complex; the southern part of the study area is a long (about 4 km), very narrow basin (about 700 m in the narrowest part) with sediment thickness reaching 150 m. In the northern part of the basin, where the historical Lucerne’s old town and train station are located, the basin shape is more asymmetrical with the thick sedimentary layers by the lakefront (50–100 m thick) extending southwest into a shallower terrace with gradually decreasing sediment thickness.
In November 2019, nine temporary seismic stations and then again in December 2020, ten temporary seismic stations were deployed in the Lucerne area for 5–6 months to record local and teleseismic earthquakes (Figure 3, Figure 4A). It consisted of 3-component short-period seismometers Lennartz 5 s (LE-3D 5-s) associated with Centaur digitizers. In total, most of the stations were recording for about one year. All sensors were buried 0.4 m below the ground, except for one (LUZ03) which was situated in the underground parking; the instrument was laid directly on the concrete floor. In addition, our dataset was supplemented by three permanent accelerometers of the Swiss Strong Motion Network (SSMNet—Hobiger et al., 2021; Michel et al., 2014). Some details concerning the deployment and geological and geotechnical characteristics of the sites can be found in Supplementary Table 1A (in Appendix).
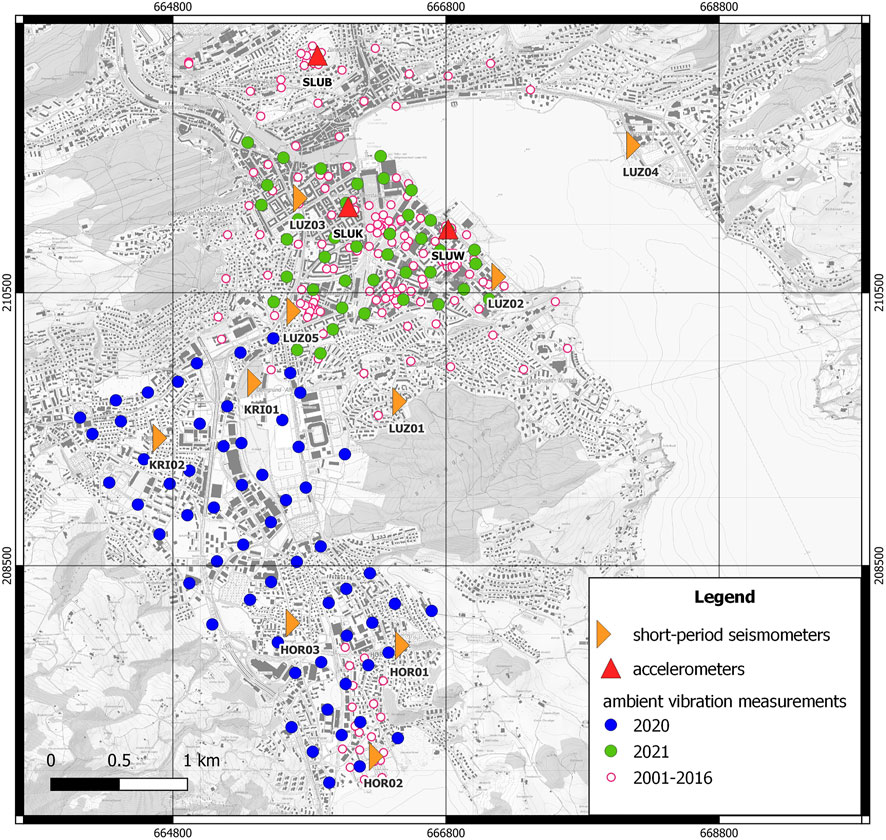
FIGURE 3. Stations of seismic monitoring networks located in the Lucerne area and single-station ambient noise measurements. Short-period seismometers are part of the temporary local network, while accelerometers belong to SSMNet (Michel et al., 2014; Hobiger et al., 2021).
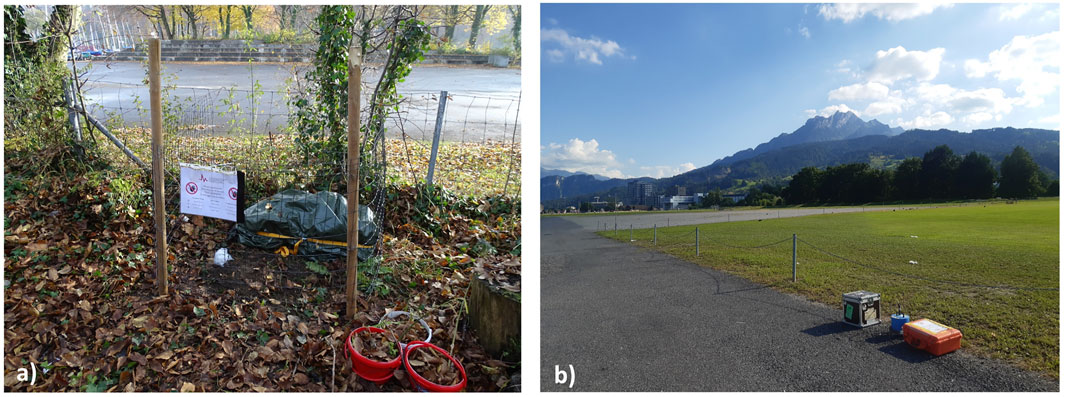
FIGURE 4. (A) LUZ02—example of the station of the temporary network. (B) Example of measurement of ambient noise during the survey in June 2020. The setup consists of a Lennartz 5-s sensor and Centaur digitizer.
Two ambient vibration measurement campaigns were performed in June 2020 and in April 2021, (Figure 3, Figure 4B) respectively, while the temporary seismic stations were still operating. In total, we recorded at least 1–2 h of ambient noise at 100 sites using the same sensor-digitizer configuration as for the earthquake monitoring (LE-3D 5-s—Centaur). During short-time measurements, sensors were not buried but installed on tripods directly on the ground. In addition to the temporary seismic stations, longer ambient noise recordings were performed at four sites with a buried sensor to capture the 24 h variations of the ambient noise seismic wavefield inside the basin. During both campaigns, the ambient vibration measuring points were recording simultaneously with earthquake monitoring stations, and the instruments deployed for 24 h. In addition, there were short overlaps (from a few minutes to one hour) between some short-term measuring points, but only a maximum of six of them were recording at the same time. Moreover, we supplemented our dataset with a few hundred short ambient vibration recordings (Figure 3) performed in the Lucerne area during the last 20 years (e.g., Poggi et al., 2012). These old recordings were used to map the fundamental resonance frequency in detail across the area but not to develop the amplification model since the SSRh cannot be applied without the simultaneous presence of the earthquake monitoring stations.
All earthquake and ambient vibration recordings that we used are first pre-processed using the ObsPy library (Beyreuther et al., 2010); in other words, instrumental correction and bandpass filter (a cosine taper with corner frequencies: 0.01, 0.05, 95, and 100 Hz) are applied.
As for the SSR method, a number of local and teleseismic earthquakes are extracted and processed for each site of the local temporary network and permanent SSMNet stations. In total, 44 events (Supplementary Table 2A in Appendix) are analyzed considering a part of the signal from P-wave arrival until coda (Perron et al., 2018b), requiring that the signal-to-noise ratio (SNR) is at least 3 for frequency bands longer than half an octave. To ensure that the earthquake source and path components are approximately the same for both considered stations, the SSR is computed for a given event if the distance between two stations was much shorter than the approximated epicentral distance; the factor of 5 was chosen. The SSR curve is then smoothed using the Konno and Ohmachi, (1998) algorithm with a b-value of 40.
The final amplification function for each pair is a geometric mean of several realizations of the SSR. The horizontal component is defined here as the geometric mean of the eastern and northern components. ESM amplification functions (Edwards et al., 2013) are automatically computed for all stations of the Swiss network including temporary deployment but only for local earthquakes and if SNR is more than three in a broad frequency range (at least an order of magnitude).
As for the SSRn technique, we randomly selected one week (10-16.03.2021) of continuous noise recording for temporary stations; for short-term ambient vibration measurements, the whole recordings (often 1–2 h long) are used. All recordings are divided into shorter windows before applying a short-time Fourier transform, where the window length and overlap value are dependent on the signal length to optimize the computing time; typically, the length of the window is 40 s with 50% overlapping. Noise-based spectral ratios for each short window are averaged using a geometric mean after excluding outliers and smoothed with the Konno and Ohmachi (1998) algorithm with a b-value of 40.
As for the SSRh technique, the SSR and SSRn computed in previous steps are used. For SSR functions, only frequency bands where at least two earthquakes contribute are considered because several stations of our local monitoring network might serve as a potential intermediate station; hence, to avoid subjectivity, we calculated a weighted geometrical mean of several SSRh realizations computed using different intermediate stations with the squared inverse of the difference of f0 values between the site (
While mapping the amplification variability for the Lucerne area using ambient vibration data, we have a limited choice of intermediate stations because we needed to remove part of our temporary network earlier. For the dataset collected in June 2020, only stations HOR02, HOR03, KRI01, and KRI02 were available; during the campaign in April 2021, we had our disposal stations LUZ02, LUZ03, and LUZ05, as well as SLUK and SLUW. Because the last two are accelerometers, we decided not to directly compare ambient vibration recorded by accelerometers to short-period seismometers; instead, we deployed short-period seismometers very close for about 24 h to record ambient noise.
Finally, we developed a detailed interpolated amplification map for the Lucerne basin at several frequencies. The model is referenced to either a local rock outcrop reference station or a Swiss reference rock profile (Poggi et al., 2011) by multiplying the values by the ESM amplification function (Edwards et al., 2013) for a local rock station. For measurement points where only ambient vibration data are available, the SSRh functions are used to estimate amplification, while for stations of the temporary and permanent monitoring networks, the SSR used is supplemented by SSRh at higher frequencies if there are not enough earthquake recordings.
The uncertainty of the final amplification model is a combined geometric standard deviation of SSRn and SSR, and ESM amplification functions are as follows:
In the case of using several intermediate stations, the weighted geometric standard deviation of such several realizations is also included.
In addition, for mapping the fundamental frequency of resonance f0 across the area, we used the HVSR calculated with the RayDec method (Hobiger et al., 2009), which emphasizes the influence of Rayleigh and suppresses the body and Love wave impact, allowing to retrieve the Rayleigh wave ellipticity curve. We utilized all available ambient vibration recordings since 2001, including data from the temporary and permanent stations, for which we chose 4 h randomly from continuous noise records considering only night to decrease the influence of cultural noise. The f0 values are picked manually at each ambient noise recording point separately using the HVSR curve, but the consistency of the f0 for neighboring points is verified. Finally, we interpolated the detailed f0 model for the Lucerne area.
The SSR and ESM amplification functions are used in this study to adjust the SSRn to the rock condition and to verify that these noise-based amplification functions give similar results as earthquake-based ones. In Figure 5A, the SSR amplification functions with respect to the rock station LUZ01 for each station of the temporary and permanent seismic monitoring networks are shown. In the background, the map of the thickness of unconsolidated deposits derived from the bedrock elevation model and provided by the Federal Office of Topography (Swisstopo) is displayed. The comparison indicates a good agreement between the thickness of sediments and the SSR amplification functions, at least regarding the first peak at low frequency. In addition, for LUZ01, the ESM amplification function is plotted (Figure 5B). For stations located on thick sedimentary layers (above 50 m thick), the peak amplification is observed at about 0.8–1.2 Hz, and amplification exceeds a factor of 10 (i.e., HOR02, HOR03, LUZ02, LUZ03, LUZ04, SLUK, and SLUW). The high amplification values present a plateau over a broad range of frequencies. Even for stations located closer to the basin edges such as KRI01, KRI02, and LUZ05, site effects are not negligible; above about 2 Hz, the amplification factors reach even 6-fold in the case of KRI01. In addition, we observed two peaks on the amplification functions for stations in the city center (i.e., LUZ03, SLUK, SLUW, and LUZ02) and a broad response with no clear peak for the stations closer to the basin edge (i.e., KRI02, etc.), and this may be due to the complexity of the basin and possible 2D site effects. For the stations located on the rock (SLUB and HOR01), the relative amplification function is close to unity; similarly, the ESM amplification function for LUZ01 shows negligible amplification in the frequency range of 0.5–3 Hz compared to the Swiss reference rock profile.
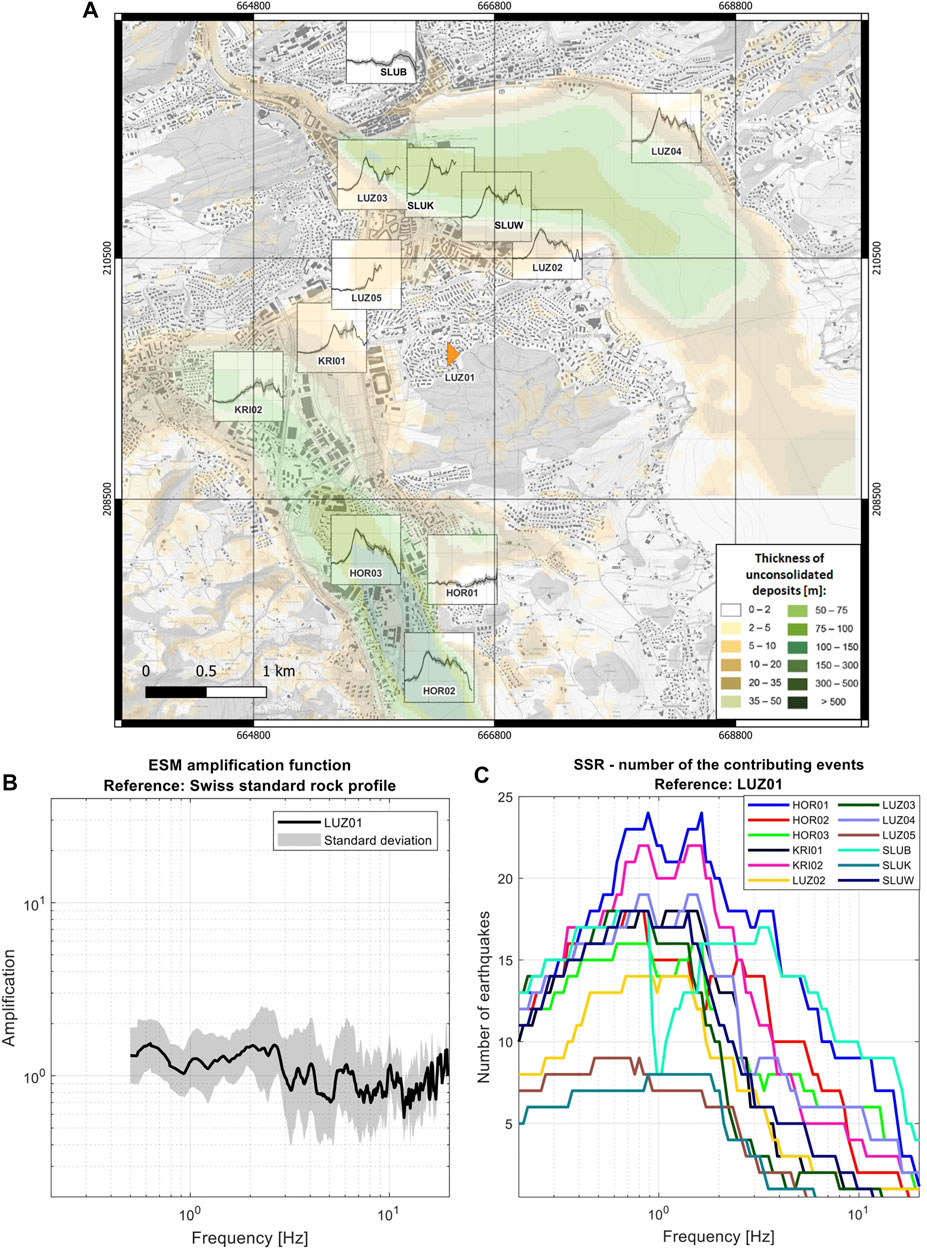
FIGURE 5. (A) Amplification functions (horizontal component) for stations located in the Lucerne area using the SSR method referenced to the rock station LUZ01. The center of each plot corresponds to the station location. All plots have the same scale as the plot in (B). In the background, the thickness of the unconsolidated deposits map is shown. (B) ESM amplification function (Edwards et al., 2013) for rock station LUZ01. (C) Number of contributing events for each frequency for all sites for the SSR method.
The standard deviation for the SSR represented by the gray band is relatively small; however, the number of events exceeding the required signal-to-noise ratio (SNR) is low mainly due to the high background noise level and relatively short recording time of the stations (∼1 year). The frequency band where many high-quality earthquakes are recorded is very narrow; on average, about 15 earthquakes contribute between 0.6 and 2 Hz. For higher frequencies, the number of events with sufficient SNR decreases rapidly (Figure 5C), and so far for some stations (e.g., LUZ05), we have recorded no earthquakes with high enough SNR at higher frequencies. Nevertheless, the frequency of the first and highest peak amplification often coincides with the frequency band with the highest number of contributing events; hence, the highest amplification values can be treated with relatively high confidence. However, to resolve the amplification function better at higher frequencies and to create a more reliable amplification model, more high-quality events are needed; therefore, a longer recording time is required.
The ESM adopts higher standards accepting only very good recordings (SNR>3 on a 10-Hz frequency band minimum) from local earthquakes solely; hence, in low-seismicity areas such as Lucerne, the station should be deployed even longer to reach a good statistical significance. Therefore, we used the ESM amplification functions only for local rock sites in order to refer the amplification model for the Lucerne area to the Swiss reference rock profile. It allows comparing the results between different methods and between different areas in Switzerland. In addition, it enables the calculation of site-specific hazard spectral acceleration maps. However, a high standard deviation of the ESM amplification functions compared to the SSR increases the uncertainty of the final model.
Figure 6 shows a comparison between SSR (in red) and SSRn (in black) for all combinations of short-period seismometers in the Lucerne area. An average SSRn over one week of recording is plotted and in the case of the SLUK and SLUW stations, it is plotted for about 24 h. In the last two columns, at least one of the station pairs is located under rock conditions. The rock-relative SSRn overestimates the amplification as was also observed by other authors (e.g., Field et al., 1990). However, when considering spectral ratios between pairs of stations located on the soil, the SSRn and SSR fit quite well, and most of the discrepancies are within the SSRn mean ± standard deviation. These observations are also confirmed in Figure 7, where the SSR, SSRn, and SSRh are compared for all stations located in the sedimentary basin with respect to the rock station LUZ01; the SSRh curves are calculated as a weighted mean of all intermediate stations with f0 difference as a weight. As expected, the rock-relative SSRn overestimates the amplification factors for frequencies higher than the frequency of the peak amplitude, while the mean SSRh curves are consistent with the SSR; the discrepancies are observed at higher frequencies and are often within one SSRh standard deviation. Nevertheless, the uncertainty of the SSRh and SSRn methods is much higher than in the case of the earthquake-based approach because of the high variability of the ambient vibration wavefield in time.
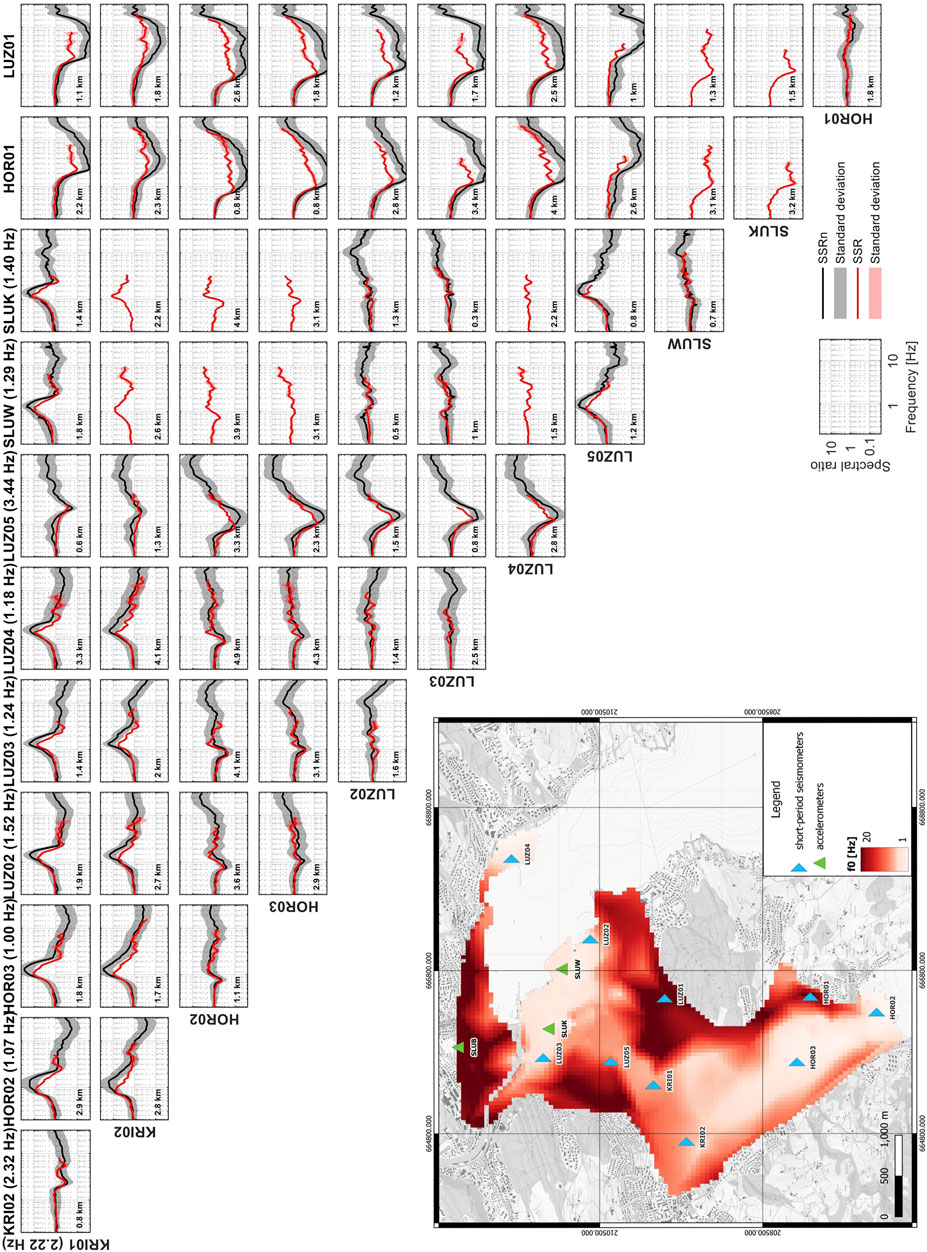
FIGURE 6. Comparison between SSRn and SSR for all combinations of short-period seismometers. Each column corresponds to one site and each row to one reference station. The distances between sites and f0 values are indicated. In the case of SLUK and SLUW, the short-period seismometers deployed close to the permanent accelerometer were not operating simultaneously with all stations. The map shows the interpolated map of f0; for the rock sites where a peak was indiscernible, the value of 20 Hz was allocated for visualization purposes.
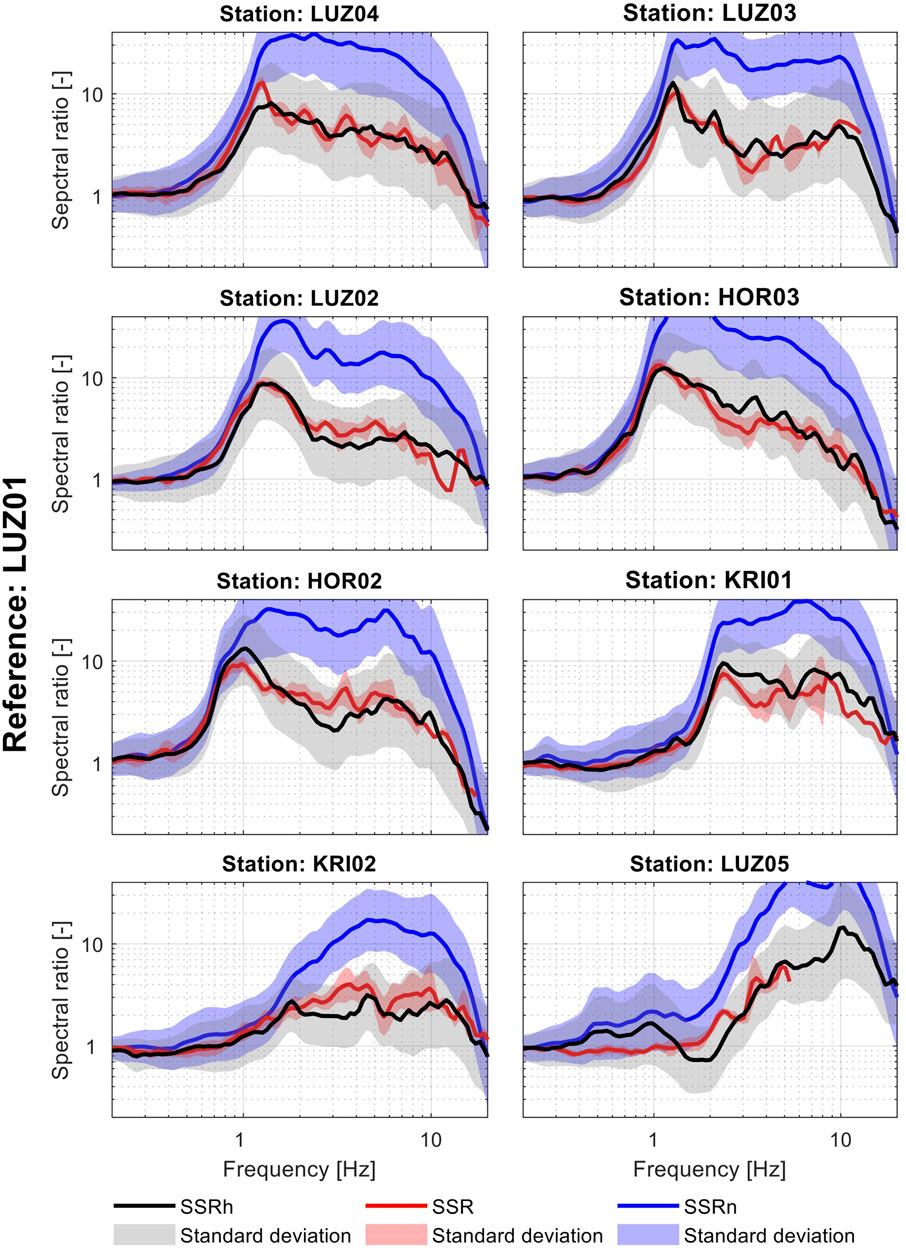
FIGURE 7. Comparison of the relative amplification functions for sedimentary sites using the SSR, SSRn, and SSRh methods with standard deviation (reference—rock station LUZ01).
The direct comparison between SSR and SSRn for stations inside the sedimentary basin is a straightforward way to assess the applicability of the SSRh method in a given area. The similarity between curves verifies experimentally that the basin site response can be estimated using a soil-to-soil spectral ratio of ambient vibration. While the noise-based spectral ratios between the sedimentary site and the rock cannot be employed to obtain reliable amplification factors, the SSRn between stations inside the sedimentary basin gives a good estimation of the basin response and can be corrected using SSR to obtain rock-relative amplification. A detailed discussion of the potential reasons for these observations can be found in Perron et al. (2018a). In case the SSR–SSRn comparisons show weak or no correlation for most of the stations, the SSRh method cannot be used in the basin, at least using that specific configuration of intermediate stations. The reasons may be among others, namely, very great distance, very different site conditions, or very much variable ambient vibration wavefields. Nevertheless, experimental evidence of the SSRh reliability was observed in other sites (Perron et al., 2018a; Perron et al., 2022).
In Figure 6, we can observe that the agreement between SSRn and SSR varies from one pair of stations to another. Based on the map of the thickness of unconsolidated deposits (Figure 5A) and fundamental resonance frequency map (Figure 6), the Lucerne basin can be divided into three parts: the northern and southern deep basins characterized by low f0 and the middle basin with shallower sediments and higher f0. The best fit is obtained for nearby stations located in the same part of the basin, for example, the spectral ratio between HOR02 and HOR03 located in the deep southern part or between KRI01 and KRI02 in the shallower basin gives similar SSRn and SSR amplification functions. We observed the flat spectral ratios without significant peaks between these stations indicate that the site response is similar for both of them. All other combinations (e.g., KRI02 and HOR03) where we see an apparent peak show some discrepancy between SSRn and SRR, especially misestimating the amplitude of peak amplification. It may indicate that the sources controlling the noise wavefield are much different in those parts of the basin; hence, the assumptions required to retrieve site effects using SSRn are not valid. Similarly, the SSRn calculated for any pair of the close by group of LUZ02, LUZ03, SLUK, SLUW, and LUZ04 provides a curve that is almost identical to the corresponding SSR function. All are located in the northern part of the Lucerne basin characterized by high sediment thickness and low f0. However, the stations located in northern and southern deep basins also give good results when combined, even though the distances between them are relatively high. We also observed a flat SSR and SSRn for those pairs. These examples indicate the higher importance of closeness of the site condition and lower significance of the spatial proximity between stations to the maximal extent of our experimental area. A simple indicator of similarity of the site condition is the f0 value. Nevertheless, in Sion (Perron et al., 2022), no significant difference in the goodness of the fit between different station pairs was noticed; however, the difference of f0 between most of the stations was also insignificant. Therefore, this effect needs to be investigated for several other case studies to study what is the decisive factor affecting the goodness of the fit between noise- and earthquake-based spectral ratios.
We suspected that with increasing distance, the fit would become worse, even if the site condition remains the same. However, because of the lack of short-period seismometers nearby that are located inside the sedimentary basin, we were not able to investigate the applicability of the method with the increasing distance for the Lucerne area. At this moment, the furthest pair in Lucerne for which good compatibility between SSRn and SSR is observed is 4.9 km apart. In Argostoli (Perron et al., 2018a), the maximum distance was about 1.2 km, while in Sion (Perron et al., 2022) it was more than 13 km.
In addition, when SSRh functions are considered, the best fit is observed (Figure 7; Table 1) for stations located in the deep northern part of the basin (LUZ02, LUZ03, and LUZ04), while worse for the stations situated in the shallower part of the basin, especially LUZ05 which is characterized by the highest f0 value. More investigation needs to be carried out; however, these results may indicate that the method performance is the best for sites located on the thick sedimentary layers, decreasing toward the basin margins. In Perron et al. (2022), it was noticed that for stations located at the edges of the Rhône valley, the SSRh method gives poor results, especially at low frequencies. We have recently deployed two new temporary stations in the Lucerne area close to the basin margin in order to test that behavior; however, not enough earthquakes have been recorded so far to derive the empirical amplification functions.
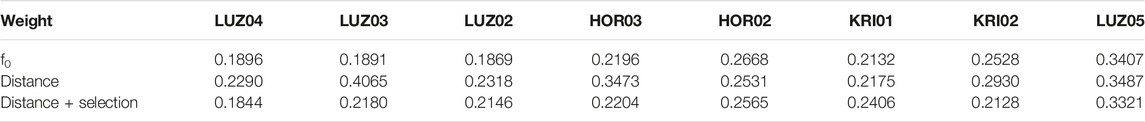
TABLE 1. RMS between SSR and SSRh calculated using different strategies of weighting intermediate stations. More explanations in the text.
Because of the promising results using the stations of the seismic monitoring network, we applied the SSRh method for 100 single-station ambient noise measurements that we performed in 2020 and 2021. Figures 8A–C show the maps of the amplification factors for three frequencies with respect to the Swiss reference rock profile. Based on the model, we can expect amplification factors of more than 10 at the fundamental frequency (between 0.8 and 1.5 Hz) in the deep parts of the basin (>50 m of sediments). Significant amplifications are also expected for these sites at higher frequencies (up to 5 Hz). Due to the lower number of recorded earthquakes at frequencies higher than 5 Hz, the reliability of the model above that frequency is limited. Some amplification is also evident closer to the basin edges where the sediment thickness is lower. The uncertainty of the model that varies depending on the frequency (Figure 8D) is relatively high, especially due to the variability of the ambient vibration wavefield and high standard deviation for the ESM amplification functions (Figure 5B). The animations showing the amplification and the uncertainty for frequencies between 0.2 and 20 Hz for local reference (LUZ01) and the Swiss reference rock profile can be found in the Supplementary Materials. Generally, in the Lucerne area, the lowest uncertainty values are characteristic for frequencies between 1 and 2 Hz that coincide with the range where the highest amplification values are often observed. However, for most of the points, the standard deviation often exceeds 2. For frequencies lower than 1 Hz and higher than 2 Hz, the values are even higher. In a noisy city such as Lucerne, high uncertainty values cannot be significantly reduced because of the variable nature of the recorded noise.
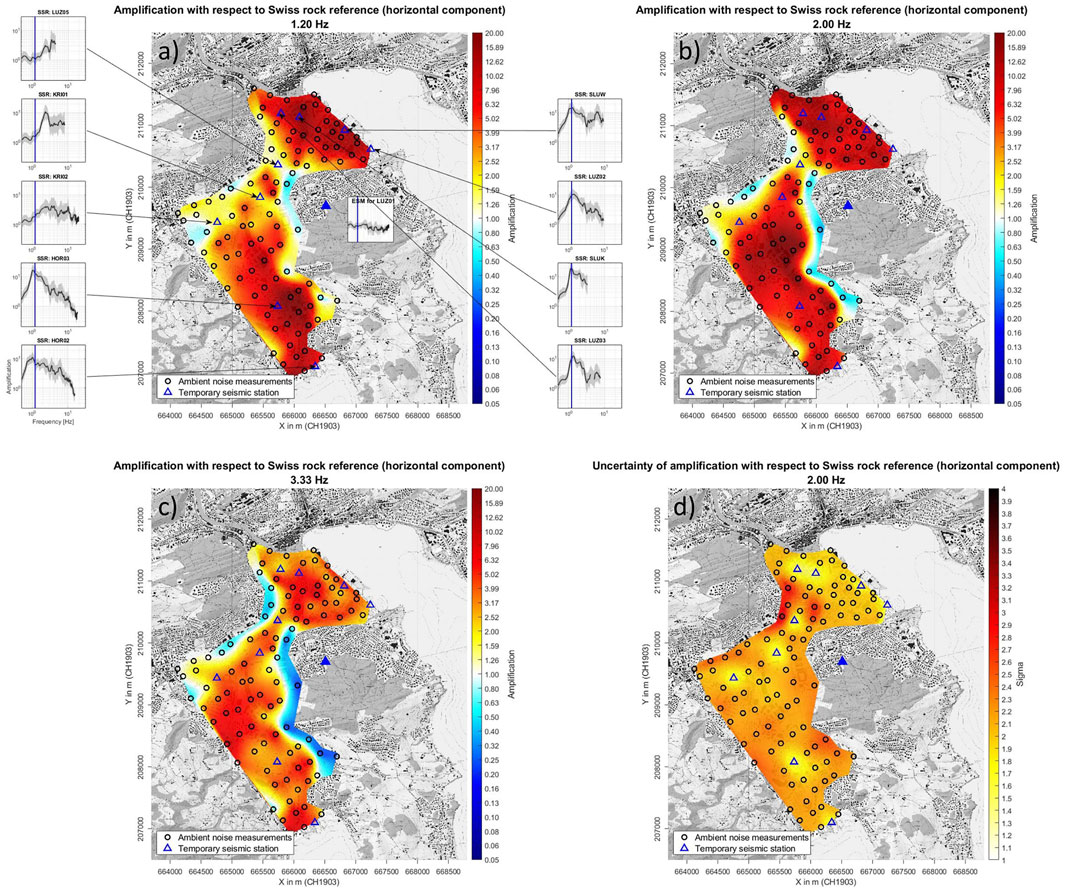
FIGURE 8. Amplification factors with respect to the Swiss reference rock profile for the Lucerne area for (A) 1.2 Hz, (B) 2 Hz, and (C) 3.33 Hz. Blue triangles are the stations of the seismic monitoring network, and black circles represent ambient vibration measurements. The amplification functions referenced to the Swiss reference rock profile for the stations are shown outside the map (A); blue lines show the value for 1.2 Hz. (D) Standard deviation for the amplification map for 2 Hz.
To verify if the obtained model predicts the reliable amplification factors and their spatial variability, a very dense network of stations deployed for several months would be needed. A cost-effective but a less solid approach is to use a few test sites for validation and to compare the model with site response proxies such as f0 values and other geological information. Although the amplitude of the HVSR curve cannot be used to predict amplification factors directly (e.g., Bonilla et al., 1997; Perron et al., 2018a), the high amplification values are expected at the frequency of the HVSR peak and above (Poggi and Fäh, 2016). We mapped the frequency of the peak of the Rayleigh wave ellipticity function for the Lucerne basin using more than 300 points (Figure 9A). In Figures 9B–D, the amplification maps from the SSRh method for 1, 1.5, and 2 Hz are shown together with the points, where the f0 value is similar or lower than the respective frequency. To account for the uncertainty, the broader ranges are adopted, for example, for an amplification map for 1 Hz; the points where f0 is between 0.75 and 1.25 are highlighted. We can observe a good correlation for all shown frequencies, especially in the southern part of the basin, indicating that our model is consistent with f0, which is one of the important site response proxies. The f0 values as shown in Figure 9A are in good agreement with the thickness of unconsolidated deposits derived from gravity measurements. This indicates that f0 is mainly controlled by that parameter, confirming that our amplification model is also consistent with the thickness of sediments. In the northern part of the basin, the observed agreement between the SSRh amplification, f0, and the sediment thickness is still clearly visible but less distinctly. The reason is probably the dominance of the artificial fillings (Figure 2B) that increases the variability of the site response and due to higher density of the infrastructure in the city center affecting the ambient noise wavefield. In the future, we would also apply other methods such as canonical correlations (Panzera et al., 2021) or simulations of wave propagation using numerical modeling that may help us to validate the model.
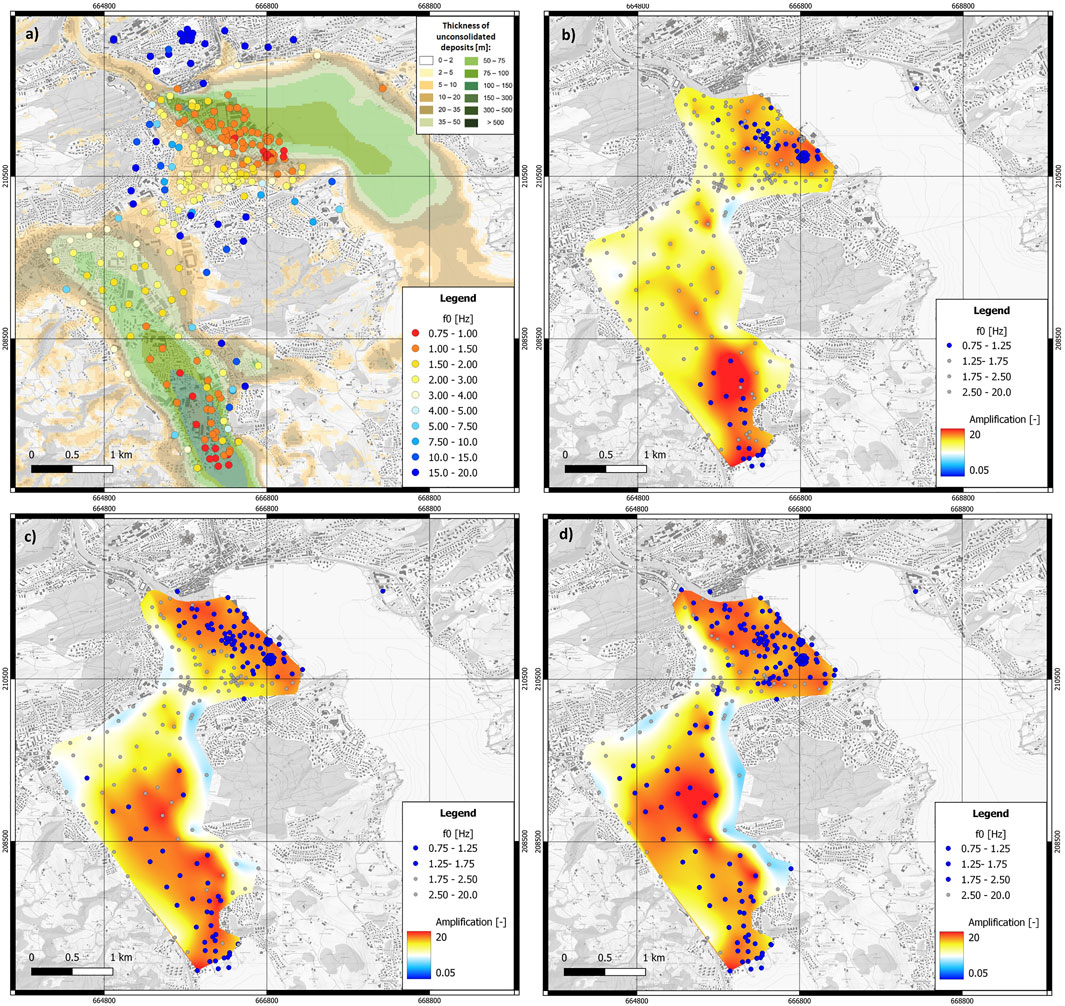
FIGURE 9. Fundamental resonance frequency f0 for more than 300 points in the Lucerne area compared to (A) the map of the thickness of the unconsolidated deposits, (B–D) amplification map derived using the SSRh method for 1, 1.5, and 2 Hz, respectively. The reference for amplification maps is the Swiss reference rock profile.
In the SSRh method, the intermediate stations located in the basin are used in order to estimate the rock-relative amplification function for each site. In case more than one station can serve as an intermediate station, adequate decisions should be made. Generally, two main scenarios exist, either one intermediate station can be chosen for each site or an average of several realizations using different intermediate stations can be calculated. In both approaches, a subjective decision needs to be made concerning the spatial extent where usage of a specific intermediate station is justifiable. In our study, we decided to calculate the weighted mean of many realizations in order to avoid too many subjective decisions. Analyzing the comparison between SSR and SSRn (Figure 6) can provide some hints if the area has to be divided into zones according to the usability of the intermediate stations.
First, we tested the inverse of square distance weight that emphasizes the influence of nearby stations. On the one hand, the basis of the SSRn is an assumption that is similar to the earthquake data, and we can retrieve the site effect component by assuming that source and path terms for both stations are the same. Hence, the emphasis on proximity and yet similarity of the wavefield seems to be a valid choice. However, as we showed, good results are obtained by also using stations located further away but similar in terms of the site condition. Therefore, another tested option was the inverse of squared difference of f0 values to indicate the similarity of the site condition. The RMS between SSR and SSRh for different approaches is shown for each station (Table 1). For many stations, the approach based on f0 seems to give better results (Figure 10); for some stations, no significant difference between both methods was noticed (Table 1). However, often, the highest differences are concentrated in the frequency band with the highest amplification values (Figure 10), indicating that this effect should not be neglected. However, if we divide intermediate stations into two regions (i.e., the deep basin and the shallow basin) and use the distance as a weight, the results for many stations improve significantly, giving similar results as using f0 weighting (Table 1). We also compared several other possible weights (e.g., logarithmic difference of f0, inverse vs. inversed square of distance); however, no significant improvements were noticed.
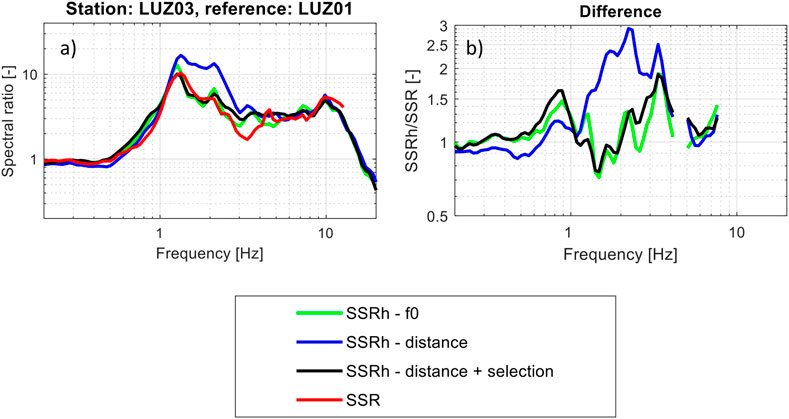
FIGURE 10. (A) Direct comparison of SSR and SSRh for the station LUZ03 calculated using different strategies considering the intermediate stations. (B) Relative difference between SSR and SSRh calculated using different strategies. More explanations in the text.
In the case of Lucerne, the weighting using f0 difference and careful selection of stations and then usage of distance as a weight give similar results. However, we assumed that the former is a more objective scheme allowing to use all possible stations as intermediate stations as long as the HVSRs are similar, indicating the similarity of profiles. However, an initial test including several stations with earthquake-derived amplification function is strongly recommended to verify the validity of the results. The validity of the SSRh approach should therefore be tested in areas of interest before being applied. For instance, in the area of Sion (Perron et al., 2022), calculating the median value of different intermediate stations appeared to be the optimal choice. Nevertheless, based on our findings, we recommend planning the deployment of a temporary network having in mind the influence of both the distance and site conditions and trying to cover different sites to sample the basin’s site response variability.
The amplitude of ambient vibration recordings shows systematic cyclic variations due to the changing intensity of human activities (Bonnefoy-Claudet et al., 2006). We investigated the influence of that variability on the performance of the SSRh method. In Figures 11A–G, the SSRn function for seven consecutive days is compared to SSR, where each line corresponds to one hour of the noise recording with colors indicating the time. The mean SSRn over 7 days (Figure 11H) is comparable to the SSR, while if we consider short 1-h recordings, large variability is observed, especially during weekdays where the clear separation between daily and nightly recordings is visible. In addition, Figure 12 shows the comparison between SSRn calculated using only nightly and daily recordings for all station combinations. The main reason is a changing intensity of the noise wavefield, which is not proportional for all the stations. The observed variability differs between different station pairs and usually increases with distance but not necessarily, the presented example is a pair situated close to each other; however, the variability is still relatively high. One of the conclusions is that 1-h recordings are too short to sample the variability of the ambient noise wavefield; the mean over a longer period is needed to obtain reliable results. For the majority of the pairs, the 24 h average is quite stable (as in Figures 11A–G) with slightly better results obtained during weekends or during nights (Figure 12) because of the lower influence of close human-generated transient noise sources. However, if we consider station pairs located under similar geological conditions, the difference between night and day recordings is slight (Figure 12), and in many cases, it is the mean over the whole day that has the best fit, while for other combinations (e.g., HOR/KRI) using night recordings improve significantly the correlation with the SSR curve.

FIGURE 11. Example of the influence of ambient noise daily variations on SSRn. Each of the plots (A–G) corresponds to one day and each line to one hour of recording. The colors indicate the time of the day when noise was recorded. The black line is a mean over 24 h, and the red line is SSR. Plot (H) shows the mean SSRn over 7 days with standard deviation compared to the SSR.
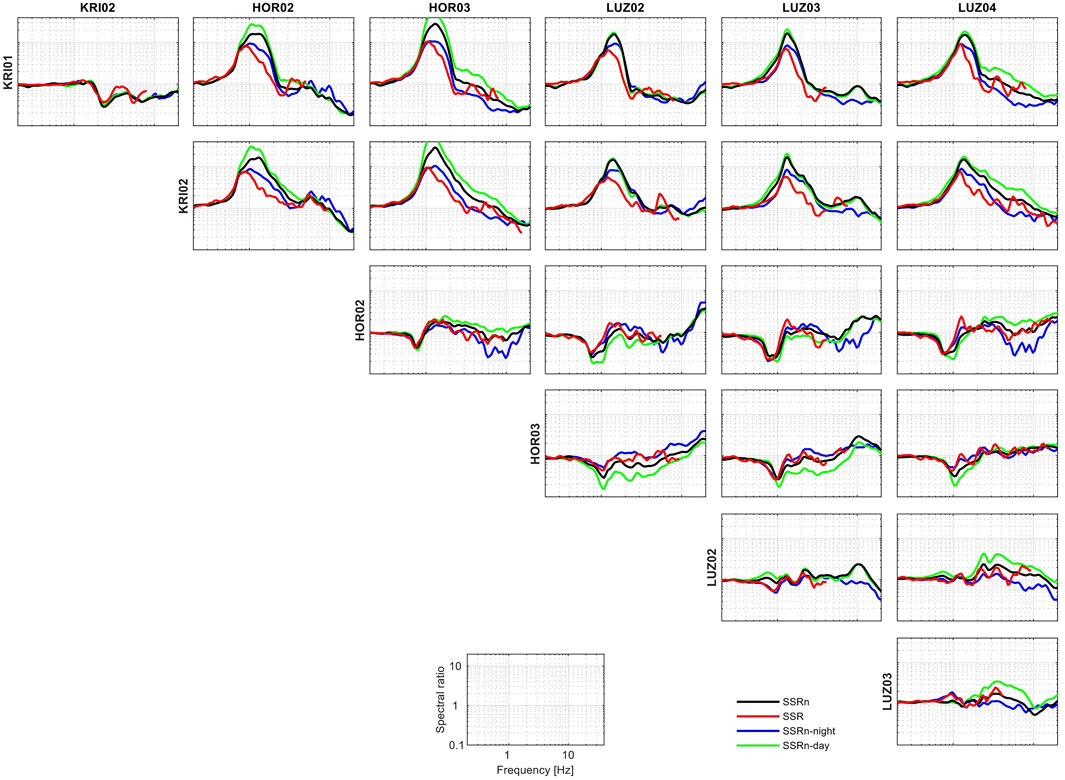
FIGURE 12. Comparison between SSR and SSRn for all combinations of stations located inside the sedimentary basin. The SSRn is a mean over 7 days, respectively, considering the whole day (black), the night between 00:00–3:00 UTC (blue), and the day between 08:00–11:00 UTC (green).
While for permanent or semi-permanent stations that are recording continuously, daily variations are not a significant issue because a mean over a long time can always be computed or only night hours can be considered, the ambient vibration measurements are often performed during busy weekday hours. In addition, when a limited number of stations are available, a compromise between the recording time and a number of points needs to be made. Of course, the best strategy is to use hundreds of stations and to measure for at least 24 h at each site, which allows calculating the relatively stable mean. Such dense measurement campaigns become more and more feasible with the development of low-cost and portable instruments such as the seismic nodes. An alternative approach is to use a temporary network first to assess the significance of the variability due to the daily changes of noise intensity and to plan the measurement campaign accordingly, for instance, by avoiding recording during specific days or hours at given sites. Another option is to limit the usage of some intermediate stations to small, restricted areas assuming the noise wavefield intensity changes similarly in the proximity.
In the case of the data that we collected during measurement campaigns in June 2020 and April 2021, we could not verify how strong the influence of the ambient vibration’s daily variation is; however, most of the data were collected during weekdays and day hours. The recordings are often only 1–2 h long because of the time constraints and a small number of available instruments. Figure 13 shows the variability of the SSRh functions during the measurements in 2021 for sites where we have at least 24 h of recordings. We observed some dispersion of the results, mostly at low frequencies; however, the variability is not very significant compared to the ambient vibration observations which were made using the temporary network on different days (e.g., Figure 11). It allows us to assume that single 1–2 h of recordings that we collected are enough to create a relatively reliable amplification model. However, we identified some points for which the amplification using the SSRh method seems specifically suspicious (e.g., too high compared to the neighboring points or characterized by a strange shape at low frequencies), which may be due to the disturbances by strong artificial noise sources.
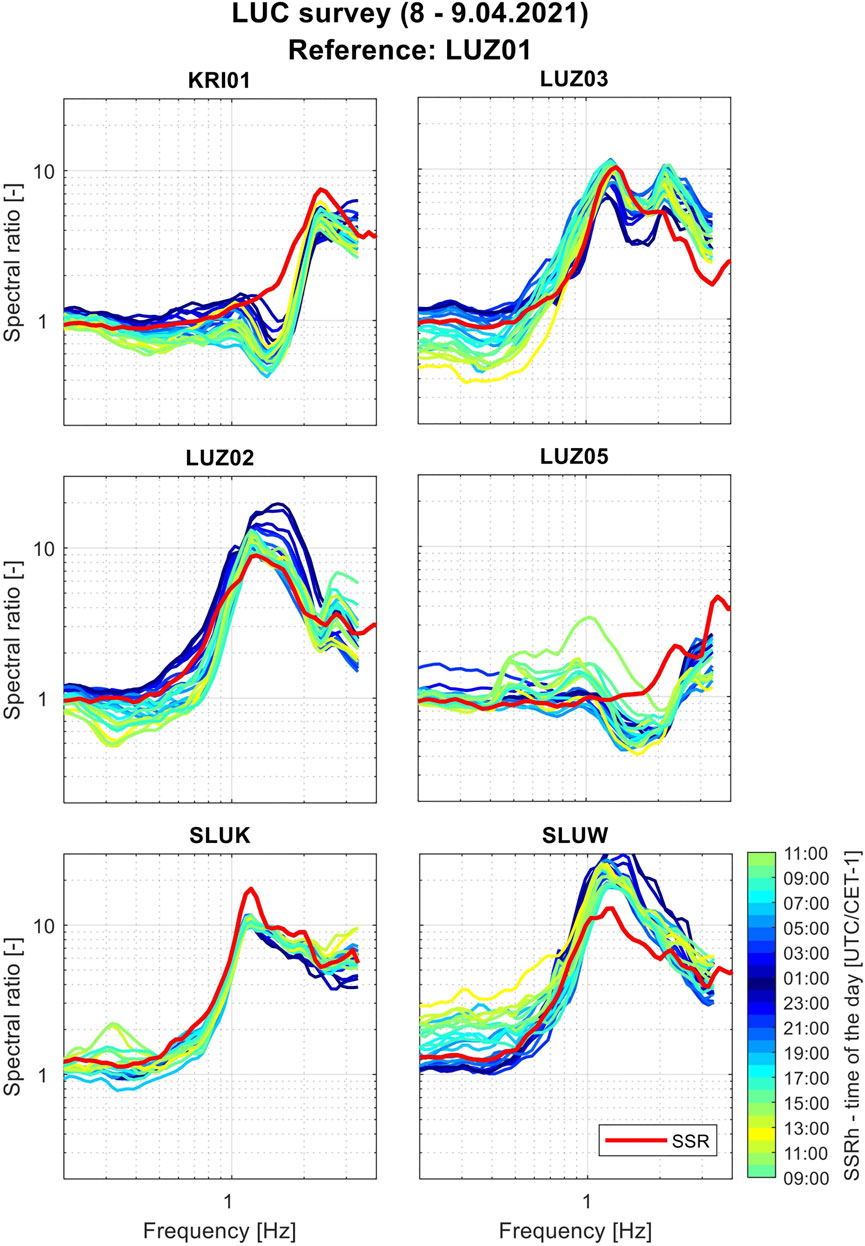
FIGURE 13. Variability of the SSRh results between all stations that recorded for at least 24 h in the period 8-9.04.2021.
Empirical site-to-reference methods using earthquake observations are commonly used to estimate the site response. However, in low-seismicity urban areas, the effective application of such methods is limited due to the scarcity of earthquake recordings. Seismic stations have to be deployed for a considerable time in order to record a significant number of high-quality earthquake ground motions. On the other hand, ambient noise measurements are easy to perform and are cheaper than the deployment of the monitoring network. They allow achieving higher spatial resolution; however, it was shown by many authors that the amplification factors derived using ambient noise are overestimated when referred to rock sites. In this study, we tested the SSRh method that combines earthquakes and ambient noise recordings in order to estimate the variability of amplification factors with high spatial resolution. The SSRh technique allows avoiding the limitations of the sole earthquake or noise-based approaches. First of all, the amplification factors estimated using the SSRh approach show good agreement with the classical SSR at the tested sites. In addition, the detailed amplification maps produced for the Lucerne area show consistency with tested site response proxies (i.e., f0 and thickness of the unconsolidated deposits). Second, a dense long-term monitoring network is not necessary to map the amplification with high spatial resolution and for a broad range of frequencies. The minimum strategy is to deploy only two stations—one on the rock and one in the basin; however, installation of more instruments is strongly recommended, especially for the initial testing phase in particular when soil characteristics in the area show strong variability. On the other hand, one of the disadvantages has relatively high uncertainty compared to the SSR due to the daily variability of the ambient vibration wavefield.
The validity of the SSRh approach is probably very site-specific. Therefore, we recommend before applying the technique to test its performance by comparing it with the SSR and verifying the influence of different factors on a small seismic monitoring network, which is deployed in a way to sample different site conditions and regions characterized by different ambient noise intensities. Nevertheless, based on our observation in the Lucerne area, we conclude that concerning the performance of the SSRh method, the distance between stations is not as important as the similarity of the site condition, at least to the maximum extent of the seismic stations in the Lucerne area. In addition, in case the SSRh function for a given site can be derived using different intermediate stations, the most optimal approach for the Lucerne area was to calculate a weighted mean of many realizations with weights indicating the similarity of the site condition (e.g., using f0 value). Last but not least, while the amplification functions estimated using 24 h of ambient noise recording seem to be robust, the results using shorter recordings may show some variability. Generally, more reliable outcomes are obtained during times of lower human activity; however, the improvement is significant only in some cases. Our recommendation is to use longer ambient noise recordings, preferably 24 h, and/or to plan the measurement campaign accordingly to minimize the influence of changing the intensity of the ambient noise wavefield.
We showed experimentally that the SSRh method provides comparable results as the empirical approaches based on analyzing earthquakes’ ground motion at several sites. Nevertheless, a better theoretical understanding needs to be provided, preferably confirmed by numerical simulations. Even though the derived amplification maps are consistent with geological data and some site response proxies (i.e., f0), it has to be verified if the method allows to correctly estimate the variability of the basin response either experimentally or by using other indirect methods. We installed two new seismic monitoring stations in the Lucerne area to check if the SSRh techniques correctly predict the amplification close to the basin margins. Moreover, in November 2021, we repeated the installation of the seismic monitoring network in order to assess more reliable earthquake-base amplification factors in the area; hence, the presented model will be consequently updated.
The results for the Lucerne area indicate high amplification factors reaching or exceeding 10 for the peak frequency (1–1.5 Hz) in some parts of the basin; significant amplification is also predicted for higher frequencies and in shallower parts. Such results indicate the seismic hazard is considerably increased in the Lucerne area. Hence, we will further investigate the city of Lucerne and its surroundings using other empirical and numerical methods and perform a detailed site response analysis considering the non-linear soil behavior in order to assess the seismic hazard and risk in the area more specifically.
The datasets presented in this article are not readily available because the data of the stations of the temporary network (doi.org/10.12686/sed/networks/xy) will be made publicly available at the end of the project. The data of short-term ambient vibration measurements are available on request after the end of the project (doi.org/10.12686/sed-stationcharacterizationdb). Requests to access the datasets should be directed to cGF1bGluYS5qYW51c3pAc2VkLmV0aHouY2g=.
PJ—first authorship, the main contributor. VP—co-supervisor of the project and contributor in the field and for data processing. CK—local government representative and contributor in the field. DF—main supervisor of the project, funding provider and project manager.
This PhD project is performed in the framework of the URBASIS-EU project–New challenges for Urban Engineering Seismology (grant agreement no 813137) funded by the European Union’s Horizon 2020 ITN program, which focuses on the seismic hazard and risk in urban areas. Open access funding was provided by ETH Zurich.
The authors declare that the research was conducted in the absence of any commercial or financial relationships that could be construed as a potential conflict of interest.
All claims expressed in this article are solely those of the authors and do not necessarily represent those of their affiliated organizations, or those of the publisher, the editors, and the reviewers. Any product that may be evaluated in this article, or claim that may be made by its manufacturer, is not guaranteed or endorsed by the publisher.
The study is also a part of the “Earthquake Risk Model for Switzerland” (ERM-CH) project conducted at the Swiss Seismological Service (SED). We would not be able to install our temporary monitoring network and perform measurements if not for the permission and support of local authorities (Kanton Luzern, Stadt Luzern, Gemeinde Horw) and several institutions in Lucerne (Verkehrshaus der Schweiz, Pfarrei St. Paul, Kantonsschule Alpenquai, and Armee-Ausbildungszentrum Luzern), Horw (Schulhaus Biregg, Friedhof Horw, and Seefeld Horw), and Kriens (Pfarrei Bruder Klaus). We would also like to acknowledge and Zimmermann, and Faesi, Franziska Vercueil, Rafał Lupa, Erich Wigger, Paul Studhalter, Philippe Ehrler, Toni Amstutz, and Hans Kauffmann for their cooperation and help with planning, installations, and maintenance of the network. We also acknowledge Pascal Graf, Dario Chieppa, Miroslav Hallo, Agostiny Lontsi, Carla Schöb, Nora Schweizer, and Manuel Studer for their help during the fieldwork. We would like also to thank the reviewers and editors for their help in improving this article.
The Supplementary Material for this article can be found online at: https://www.frontiersin.org/articles/10.3389/feart.2022.885724/full#supplementary-material
Supplementary Video S1 | Amplification factors with respect to the rock station LUZ01 derived using the SSRh method for the Lucerne area for the frequency range between 0.2 and 20 Hz. The amplification functions for stations of the temporary network are shown outside the map.
Supplementary Video S2 | Amplification factors with respect to the Swiss reference rock profile derived using the SSRh method for the Lucerne area for the frequency range between 0.5 and 20 Hz. The amplification functions for stations of the temporary network are shown outside the map.
Supplementary Video S3 | Standard deviation for the amplification factors with respect to the rock station LUZ01.
Supplementary Video S4 | Standard deviation for the amplification factors with respect to the Swiss reference rock profile.
Andrews, D. J. (1986). “Objective Determination of Source Parameters and Similarity of Earthquakes of Different Size,” in Earthquake Source Mechanics. Editors S. Das, J. Boatwright, and C. H. Scholz (American Geophysical Union AGU), 37, 259–267. doi:10.1029/GM037p0259
Bard, P.-Y. (1997). “Local Effects of strong Ground Motion: Basic Physical Phenomena and Estimation Methods for Microzoning Studies,” in SERINA—Seismic Risk: An Integrated Seismological, Geotechnical and Structural Approach ( Thessaloniki, Greece: Thessaloniki, Greece, publisher - Institute of Engineering Seismology and Earthquake Engineering (ITSAK), Ministry of Environment and Public Works), 229–299.
Beyreuther, M., Barsch, R., Krischer, L., Megies, T., Behr, Y., and Wassermann, J. (2010). ObsPy: A Python Toolbox for Seismology. Seismological Res. Lett. 81 (3), 530–533. doi:10.1785/gssrl.81.3.530
Bindi, D., Parolai, S., Cara, F., Di Giulio, G., Ferretti, G., Luzi, L., et al. (2009). Site Amplifications Observed in the Gubbio Basin, Central Italy: Hints for Lateral Propagation Effects. Bull. Seismological Soc. America 99 (2A), 741–760. doi:10.1785/0120080238
Bonilla, L. F., Steidl, J. H., Lindley, G. T., Tumarkin, A. G., and Archuleta, R. J. (1997). Site Amplification in the San Fernando Valley, California: Variability of Site-Effect Estimation Using the S-Wave, Coda, and H/V Methods. Bull. Seismological Soc. America 87 (3), 710–730. doi:10.1785/bssa0870030710
Bonnefoy-Claudet, S., Cotton, F., and Bard, P.-Y. (2006). The Nature of Noise Wavefield and its Applications for Site Effects Studies. Earth-Science Rev. 79 (3), 205–227. doi:10.1016/j.earscirev.2006.07.004
Borcherdt, R. D. (1970). Effects of Local Geology on Ground Motion Near San Francisco Bay. Bull. Seismological Soc. America 60 (1), 29–61.
EC8 (2004). Design of Structures for Earthquake Resistance. Brussels, Belgium: European Committee for Standardization CEN.
Edwards, B., Michel, C., Poggi, V., and Fäh, D. (2013). Determination of Site Amplification from Regional Seismicity: Application to the Swiss National Seismic Networks. Seismological Res. Lett. 84, 611–621. doi:10.1785/0220120176
Fäh, D., Giardini, D., Kästli, P., Deichmann, N., Gisler, M., Schwarz-Zanetti, G., et al. (2011). ECOS-09 Earthquake Catalogue of Switzerland Release. Zürich, Switzerland: Swiss Seismological Service ETH Zürich.
Fäh, D., Kind, F., and Giardini, D. (2001). A Theoretical Investigation of averageH/Vratios. Geophys. J. Int. 145 (2), 535–549. doi:10.1046/j.0956-540x.2001.01406.x
Field, E. H. (1996). Spectral Amplification in a Sediment-Filled Valley Exhibiting clear basin-edge-induced Waves. Bull. Seismological Soc. America 86 (4), 991–1005. doi:10.1785/BSSA0860040991
Field, E. H., Hough, S., and Jacob, K. H. (1990). Using Microtremors to Assess Potential Earthquake Site Response: A Case Study in Flushing Meadows, New York City. Bull. - Seismological Soc. America 80, 1456–1480. doi:10.1785/BSSA08006A1456
Gisler, M., Fäh, D., and Kästli, P. (2004). Historical Seismicity in Central Switzerland. Eclogae Geol. Helv. 97 (2), 221–236. doi:10.1007/s00015-004-1128-3
Hobiger, M., Bard, P.-Y., Cornou, C., and Le Bihan, N. (2009). Single Station Determination of Rayleigh Wave Ellipticity by Using the Random Decrement Technique (RayDec). Geophys. Res. Lett. 36, L14303. doi:10.1029/2009GL038863
Hobiger, M., Bergamo, P., Imperatori, W., Panzera, F., Marrios Lontsi, A., Perron, V., et al. (2021). Site Characterization of Swiss Strong-Motion Stations: The Benefit of Advanced Processing Algorithms. Bull. Seismological Soc. America 111 (4), 1713–1739. doi:10.1785/0120200316
Kagami, H., Duke, C. M., Liang, G. C., and Ohta, Y. (1982). Observation of 1- to 5-second Microtremors and Their Application to Earthquake Engineering. Part II. Evaluation of Site Effect upon Seismic Wave Amplification Due to Extremely Deep Soil Deposits. Bull. Seismological Soc. America 72 (3), 987–998. doi:10.1785/BSSA0720030987
Keller + Lorenz, A. G. (2010). Baugrund-Hinweiskarte, Blatt 1150 Luzern. Lucerne, Switzerland: Keller + Lorenz AG.
Konno, K., and Ohmachi, T. (1998). Ground-motion Characteristics Estimated from Spectral Ratio between Horizontal and Vertical Components of Microtremor. Bull. Seismological Soc. America 88 (1), 228–241. doi:10.1785/BSSA0880010228
Lermo, J., and Chavez-Garcia, J. (1994). Are Microtremors Useful in Site Response Evaluation? Bull. Seismological Soc. America 84, 1350–1364. doi:10.1785/BSSA0840051350
Michel, C., Edwards, B., Poggi, V., Burjánek, J., Roten, D., Cauzzi, C., et al. (2014). Assessment of Site Effects in Alpine Regions through Systematic Site Characterization of Seismic Stations. Bull. Seismological Soc. America 104 (6), 2809–2826. doi:10.1785/0120140097
Nakamura, Y. (1989). A Method for Dynamic Characteristics Estimation of Subsurface Using Microtremor on the Ground Surface. Railway Tech. Res. Inst. Q. Rep. 30 (1), 25–33.
Nogoshi, M., and Igarashi, T. (1971). On the Amplitude Characteristics of Microtremor (Part 2). Jssj 24 (1), 26–40. doi:10.4294/zisin1948.24.1_26
Panzera, F., Bergamo, P., and Fäh, D. (2021). Canonical Correlation Analysis Based on Site-Response Proxies to Predict Site-specific Amplification Functions in Switzerland. Bull. Seismological Soc. America. 111, 1905–1920. doi:10.1785/0120200326
Perron, V., Bergamo, P., and Fäh, D. (2022). Site Amplification at High Spatial Resolution from Combined Ambient Noise and Earthquake Recordings in Sion, Switzerland. Seism. Res. Let.
Perron, V., Gélis, C., Froment, B., Hollender, F., Bard, P.-Y., Cultrera, G., et al. (2018a). Can Broad-Band Earthquake Site Responses Be Predicted by the Ambient Noise Spectral Ratio? Insight from Observations at Two Sedimentary Basins. Geophys. J. Int. 215 (2), 1442–1454. doi:10.1093/gji/ggy355
Perron, V., Laurendeau, A., Hollender, F., Bard, P.-Y., Gélis, C., Traversa, P., et al. (2018b). Selecting Time Windows of Seismic Phases and Noise for Engineering Seismology Applications: A Versatile Methodology and Algorithm. Bull. Earthquake Eng. 16 (6), 2211–2225. doi:10.1007/s10518-017-0131-9
Poggi, V., Edwards, B., and Fäh, D. (2011). Derivation of a Reference Shear-Wave Velocity Model from Empirical Site Amplification. Bull. Seismological Soc. America 101 (1), 258–274. doi:10.1785/0120100060
Poggi, V., Fäh, D., Burjanek, J., and Giardini, D. (2012). The Use of Rayleigh-Wave Ellipticity for Site-specific hazard Assessment and Microzonation: Application to the City of Lucerne, Switzerland. Geophys. J. Int. 188 (3), 1154–1172. doi:10.1111/j.1365-246X.2011.05305.x
Poggi, V., and Fäh, D. (2016). Guidelines and Strategies for Seismic Microzonation in Switzerland [Report]. SED/ETH Zurich. doi:10.3929/ethz-a-010735479
Schnellmann, M., Anselmetti, F., Giardini, D., McKenzie, J., and Ward, S. (2004). Ancient Earthquakes at Lake Lucerne. Amer. Scientist 92, 46. doi:10.1511/2004.1.46
Schwarz-Zanetti, G., Deichmann, N., Fäh, D., Giardini, D., Jiménez, M., Masciadri, V., et al. (2003). The Earthquake in Unterwalden on September 18, 1601: A Historico-Critical Macroseismic Evaluation. Eclogae Geol. Helv. 96, 3. doi:10.5169/seals-169031
SIA (2020). Actions on Structures, SIA 261. Swiss Standards. Zürich, Switzerland: Swiss Society of Engineers and Architects.
Keywords: seismic site effects, seismic hazard, urban areas, microzonation, ambient vibration, earthquake ground motion
Citation: Janusz P, Perron V, Knellwolf C and Fäh D (2022) Combining Earthquake Ground Motion and Ambient Vibration Recordings to Evaluate a Local High-Resolution Amplification Model—Insight From the Lucerne Area, Switzerland. Front. Earth Sci. 10:885724. doi: 10.3389/feart.2022.885724
Received: 28 February 2022; Accepted: 22 March 2022;
Published: 09 May 2022.
Edited by:
Dimitris Pitilakis, Aristotle University of Thessaloniki, GreeceReviewed by:
Iolanda-Gabriela Craifaleanu, Technical University of Civil Engineering of Bucharest, RomaniaCopyright © 2022 Janusz, Perron, Knellwolf and Fäh. This is an open-access article distributed under the terms of the Creative Commons Attribution License (CC BY). The use, distribution or reproduction in other forums is permitted, provided the original author(s) and the copyright owner(s) are credited and that the original publication in this journal is cited, in accordance with accepted academic practice. No use, distribution or reproduction is permitted which does not comply with these terms.
*Correspondence: Paulina Janusz, cGF1bGluYS5qYW51c3pAc2VkLmV0aHouY2g=
Disclaimer: All claims expressed in this article are solely those of the authors and do not necessarily represent those of their affiliated organizations, or those of the publisher, the editors and the reviewers. Any product that may be evaluated in this article or claim that may be made by its manufacturer is not guaranteed or endorsed by the publisher.
Research integrity at Frontiers
Learn more about the work of our research integrity team to safeguard the quality of each article we publish.