 Silvia Fabbrocino1,2*
 Eliana Bellucci Sessa2
 Sandro de Vita2
 Mauro Antonio Di Vito2
 Rosario Avino2
 Enrica Marotta2
- 1Department of Earth, Environment and Resources Science (DiSTAR), University of Naples Federico II, Naples, Italy
- 2Istituto Nazionale di Geofisica e Vulcanologia (INGV), Sezione di Napoli Osservatorio Vesuviano, Naples, Italy
Assessing the variations in space and time of groundwater circulation in volcanic islands is of paramount importance to the description of the hydro-geo-thermal system and implementation of hydrogeological, geochemical, and volcanic monitoring systems. In fact, the reliable reconstruction of the groundwater potentiometric surface in such composite volcanic aquifer systems can enable the identification of the most advantageous strategies for both the sustainable use of groundwater resources and the management of volcanic risk. Geographical Information System (GIS) platforms can support the integration and analysis of many spatial and temporal variables derived from monitoring of active volcanoes and the elaboration of spatially continuous data. However, open issues still affect the reliability and general applicability of common spatial interpolation methods in the case of groundwater potentiometric surfaces. This is related to the assessment of the main stratigraphic and volcano-tectonic features affecting the hydraulic head changes. With regard to the dynamically very active Ischia Island (Italy), this study illustrates a GIS-based hydrogeological approach to identify the most accurate interpolation method for mapping the potentiometric surface in complex hydrogeological terrains. The proposed approach has been applied to the existing dataset (1977–2003) stored by Istituto Nazionale di Geofisica e Vulcanologia. Based on a careful geological and hydrogeological survey, a total of 267 wells, from 5 to 250 m in depth, were processed. The data pre-processing involved four meteorological time-series data (1922–1997) and six long records of piezometric water levels (1930–1994). As a result, knowledge of the delineation of rather homogeneous stratigraphic and volcano-tectonic structures at the basin-scale has improved. Thus, new, more reliable potentiometric surfaces of the four main geothermal areas closest to the coast were produced during both dry and wet seasons. The reliability of the processed potentiometric surface was then validated by comparing the spatially continuous data with complementary field data. These findings point toward an optimal interpolation approach for representing the seasonal and areal distribution of main hydrogeological parameters in complex aquifer systems. Finally, insights into variations of hydrological behavior at an active volcanic area will foster an understanding of possible involvement of fresh and thermal waters in triggering phreatic explosions.
1 Introduction
In active volcanic areas, knowledge of the groundwater circulation is of fundamental importance for understanding the interaction between water and the magmatic system in the case of re-alimentation of the shallow reservoir and for assessing the possibility of the occurrence of phreatic explosions. The discrimination of shallow and deep flow paths is still an issue today, especially in volcano-tectonically active islands, making it difficult to estimate aquifer geometry and groundwater flow patterns (Rad et al., 2007; Izquierdo, 2014; Vittecoq et al., 2015; Frisbee et al., 2017).
Field data are crucial in defining reliable conceptual hydrogeological models, and the reconstruction of the potentiometric surface is an important boundary (e.g., Atkinson and Davison, 2002; Join et al., 2005) in many groundwater flow models. Nevertheless, the potentiometric surface configuration is often poorly known due to the high variability of the hydrological properties of volcanic and non-volcanic deposits and to the small number of exploitation wells in the inland island areas (Herrera and Custodio, 2008).
Groundwater mapping, described by water table elevation in a phreatic aquifer or by piezometric surface elevations in a confined or a leaky one, is a useful tool for summarizing both field and desk investigations of hydrogeological structures. The interpolation of one kind or another (e.g., linear) of water level data, measured at the same time in the available observation wells of a given aquifer, allows contours of the potentiometric surface to be drawn (Bear, 2007). Therefore, many software programs have been developed for drawing contour maps, and properly designed and constructed mathematical models are able to predict the water levels by solving the partial differential equations which govern the groundwater flow (e.g., Domenico and Schwartz, 1998; Ochoa-Gonzáleza et al., 2015; Varisco et al., 2021). Geospatial technologies have become an effective tool for monitoring, mapping, and modeling water resources as well as for volcanic risk evaluation and management and emergency planning due to their capability to store, retrieve, analyze, and display data that are characterized spatially or geographically (Pareschi et al., 2000; Felpeto et al., 2007; Díaz-Alcaide and Martínez-Santos, 2019 and references therein; Abdalla et al., 2020; Bellucci Sessa et al., 2021). One of the fundamental functions of the Geographical Information System (GIS) is the automation of cartographic workflows and the potential to integrate and analyze the large number of spatial and temporal variables derived from monitoring of active volcanoes. In such a multidisciplinary study, this process facilitates the integration of information and simplifies the identification of interrelationships between different phenomena.
In active volcanic islands, piezometric mapping based on existing, even sparse water level data is a key tool able to guide and optimize field activities and improve the capabilities of the monitoring system. The most common interpolation methods for groundwater mapping are inverse distance weighting (IDW), natural neighbor (NaN), and Kriging (K). IDW and NaN are “deterministic” estimation methods, while Kriging is a “stochastic” method (Myers, 1994; Burrough and McDonnell, 1998; O'Sullivan and Unwin, 2010; Slocum et al., 2014).
Despite the widespread use of GIS technology for analyzing main groundwater variables, and for their interpolation and representation by continuous surface (mapping), there are currently no guidelines on which spatial interpolation procedures are most suitable for developing the potentiometric surface in relation to the features of the water level observation network and factors that may affect the distribution of hydraulic heads (Kamińska and Grzywna, 2014; Bourgine et al., 2017; Díaz-Alcaide and Martínez-Santos, 2019; Nistor et al., 2020). Conversely, several studies compare and analyze the progress of spatial interpolation techniques in environmental studies (e.g., Li and Heap 2008; Li and Heap, 2014).
In the present study, a GIS-based hydrogeological methodology is proposed and assessed as a tool for the identification of the most accurate interpolation method for mapping the potentiometric surface in complex hydrogeological terrains. It aims to overcome certain issues associated with the high heterogeneity of hydrological properties of geological deposits and the small number of available observation wells in volcanic islands. The assessment of the methodology is carried out with reference to a real case study of Ischia Island (Italy), characterized by significant hydrostratigraphic and volcano-tectonic features and compared to the results of classical hydrological procedures and field investigation. The application of this methodology allowed the reconstruction of the hydrogeological setting of selected sectors of the island, taking into account all the stratigraphical and volcano-tectonic features that characterize this dynamically very active island. Moreover, the suggested procedure aims to improve any future planning of groundwater monitoring network and become a cost-effective support to multidisciplinary field survey activities.
2 Study Area: Geological and Hydrogeological Framework
Ischia Island, located in the southern Tyrrhenian Sea, is an active volcanic field within the Phlegrean volcanic district (Figure 1). It corresponds to the emerged part of the volcanic field, which rises more than 1,000 m above the sea floor (Orsi et al., 1999; Bruno et al., 2002; Selva et al., 2019). The island comprises volcanic rocks, landslide deposits, and subordinately, sedimentary terrigenous rocks, derived from a complex history of alternating constructive and destructive phases related to volcanic, volcano-tectonic, and slope instability phenomena (de Vita et al., 2006; de Vita et al., 2010; Della Seta et al., 2012). The morpho-structural setting of the island reflects its volcanological history, lasting more than 150 ka, and is characterized by the asymmetric block resurgence of a caldera floor (Acocella and Funiciello, 1999; Molin et al., 2003; de Vita et al., 2010; Marotta and de Vita, 2014; Selva et al., 2019). The caldera, which occupied the central part of the island, collapsed between 60 and 50 ka, following the eruptions of the so-called Monte Epomeo Green Tuff (Vezzoli, 1988; Brown et al., 2008; Sbrana and Toccaceli, 2011; Sbrana et al., 2018), a sequence of trachytic ignimbrites that filled the depression in a submarine environment. Marine sediments and reworked pyroclastic deposits were emplaced in this depression. The intracalderic resurgence (younger than 50 ka) is impressive, being characterized by a maximum uplift of the order of about 900–1,100 m and creating a remarkable structure. This structure comprises differentially displaced blocks, generated by the reactivation of regional faults and the activation of faults related to the local volcano-tectonic processes (Orsi et al., 1991; Acocella and Funiciello, 1999; Carlino et al., 2006; Marotta and de Vita, 2014). The resurgent block is bounded to the west by high-angle inward-dipping, N-S, NE-SW, and NW-SE trending faults, cut by late outward-dipping normal faults due to gravitational readjustment of the slopes. To the east, a number of vertical or outward-dipping N-S, NE-SW, and NW-SE trending normal faults downthrow a series of blocks, settled at a lower altitude and connected westward to the resurgent area (de Vita et al., 2006; de Vita et al., 2010; Della Seta et al., 2012). The N-NE boundary of the resurgent area is not well-defined because beach deposits, exposed along the coast, can be seen at different elevation above the sea level due to E-W and NW-SE trending, vertical faults (Alessio et al., 1996; de Vita et al., 2006; de Vita et al., 2010; De Novellis et al., 2018; Nappi et al., 2018; Trasatti et al., 2019; Berrino et al., 2021; Nappi et al., 2021; Carlino et al., 2022). Deformation within the Ischia caldera is still active and presently characterized by subsidence, related to the cooling and deflation of a residual magma chamber (Sepe et al., 2007; Vezzoli et al., 2009; Selva et al., 2019; Trasatti et al., 2019). Therefore, the resurgence process is currently passive, as also suggested by geodetic data (Sepe et al., 2007; Selva et al., 2019; Trasatti et al., 2019).
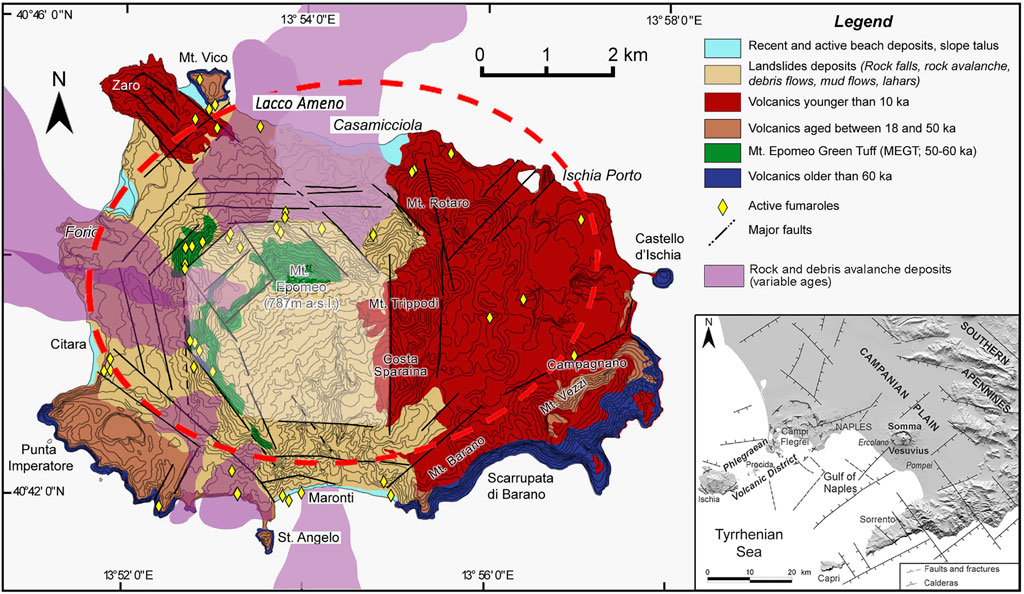
FIGURE 1. Geological sketch map of Ischia Island (modified after Sbrana et al. (2018) and Della Seta et al., (2021)). The shaded area highlights the most uplifted part of the resurgent block; the red dashed line indicates the inferred collapsed area.
The model of the hydrothermal system of Ischia Island highlights the close relationship between the structural/geological setting and the fluid circulation. The hydrothermal reservoirs, at least two, ranging in temperature from ∼ 150°C to ∼ 270°C and located at depths from ∼ 200 m to ∼ 1,000 m below the sea level (b.s.l.), are the result of a complex and dynamic interaction between the circulation patterns of meteoric water, sea water, and fluids of deep origin (Di Napoli et al., 2009; Di Napoli et al., 2011). The mixing of these deep-reservoir fluids with the groundwater flow, which occurs in the shallow aquifer system (up to 200 m deep), governs the composition of surface thermal manifestations (De Gennaro et al., 1984; Carapezza et al., 1988; Panichi et al., 1992; Caliro et al., 1999; Inguaggiato et al., 2000; Chiodini et al., 2004; Aiuppa et al., 2006; Morell et al., 2008; Carlino et al., 2014).
Knowledge of the features of the shallow aquifer system allows recognition of different sectors of the island, separated by structural features and characterized by distinct hydrodynamic conditions (Celico et al., 1999; Piscopo et al., 2020a; Piscopo et al., 2020b; Kicsiny et al., 2021). Specifically, in the eastern part of the island, the main aquifers consist of the most recent pyroclastic deposits and lavas (younger than 10 ka), which are marked by high values of transmissivity (10−2–10–4 m2/s). They give place to a single and continuous groundwater flow and are recharged mostly by meteoric and sea waters (Celico et al., 1999; Kicsiny et al., 2021). In the central zone, corresponding to the resurgent block of Mt. Epomeo, and in its northern, western, and southern peripheral areas, the greater variability of the hydrological properties of the volcanic rocks, landslide deposits, and sedimentary terrigenous rocks controls the groundwater circulation at shallow depths. The resultant heterogeneous bodies of intercalated aquifers and aquitards may locally develop perched groundwater circulation, but a continuous basal aquifer is recognized. An independent and uplifted basal groundwater circulation occurs in the resurgent block of Mt. Epomeo (Piscopo et al., 2020a), characterized by lower values of transmissivity (10−5–10−6 m2/s) (Celico et al., 1999; Piscopo et al., 2020b). Furthermore, the tectonic discontinuities, especially the main faults bordering the resurgent block, become pathways for deep fluid migration. Along such faults, the hot springs with larger discharges (about 0.015 m3/s) are localized (Carlino et al., 2014).
The only reconstructions of the potentiometric surface in the shallow aquifer system of the Ischia Island are carried out by Celico et al., (1999), which consider the water level observations in 100 wells carried out in the period January–March 1996, and by Piscopo et al., (2020a), which take into account the water level measurements derived from the archives of public bodies, previous studies, and technical reports, relating to the period 1996–2017. However, these potentiometric surfaces consider the basal aquifer continuously and try to represent the groundwater flow pattern processing scattered data, integrated by a hypothesis of piezometric levels in areas without data.
3 Materials and Methods
The main available groundwater level data are analyzed in relation to coupled multidisciplinary information about the volcano-tectonic setting, the hydrodynamic conditions of the island, and a careful geological and hydrogeological survey. Field investigations include new groundwater level measurements (Figure 11) in selected wells and a survey of springs (Figure 10).
3.1 Piezometric Measurements
The Ischia volcanic island has been a wellness thermal destination for millennia. The main tourism resources are related to the several healing water resorts and spas, which use wells and springs to supply thermal activities. Thus, many piezometric and geochemical data derive from archives of local and regional public authorities. The regional inventory currently recognizes 244 wells and 20 springs on the whole island (Regione Campania unpublished report 2015). A total of 267 wells, from 5 to 250 m in depth, were processed in this study. This database is stored by the Istituto Nazionale di Geofisica e Vulcanologia, Sezione di Napoli, Osservatorio Vesuviano. Available datasets include information about the location (coordinates), well elevation, stratigraphic logs, groundwater depths, groundwater levels, well discharges, and pumping test results. Groundwater level data are reported for 193 wells, but the date of observation is recorded for only 111 wells (from 19/01/1977 to 14/05/2003) (Figure 2).
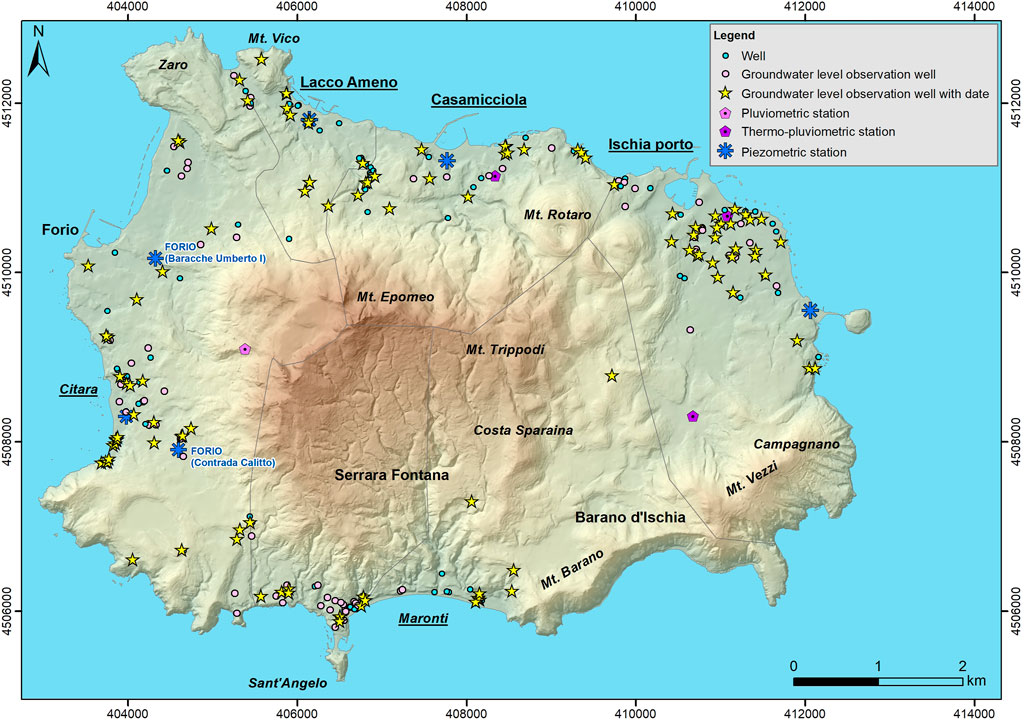
FIGURE 2. INGV-GIS groundwater database in the Ischia volcanic island. Available site descriptive information includes well location and groundwater level data. The National Hydrographic and Mareographic monitoring network is also indicated. The digital elevation model (DEM) derives from the Regional Technical Map, scale 1:5000.
The data pre-processing involved the analysis of four meteorological time-series data (1922–1997) and of six long records of piezometric water levels (Figure 2) (observed from 1930 to 1994, specifically every 3 days from the year 1935) (cf. Hydrological Annals by the National Hydrographic and Mareographic Service, 1916–1999, http://centrofunzionale.regione.campania.it/#/pages/documenti/annali), with the aim of evaluating the rainfall regime and its relationship with the piezometric level fluctuations. Representative in this regard is the behavior of the well called “Forio Contrada Calitto,” whose water level was recorded from 1930 to 1994, the longest time-series data available (Figure 3). The hydrogeological survey activities revealed that this piezometric station was an old shallow well (8.50 m in depth) that provided water for drinking and agricultural use in the past. Furthermore, the field control allowed verification of the ambiguous value of the well elevation recorded in hydrological annals. In fact, the value of the groundwater level elevation indicated there, and presented in Figure 3, must be increased by 100 m. The cross correlation between daily average rainfall and the groundwater level time series (1935–1959) showed a positive correlation and a maximum correlation coefficient for a lag of 45 days. The times of the dry and wet seasons were clearly comparable between the main piezometric stations (Figures 2–4), but the groundwater fluctuations assessed for the long record of piezometric levels available depended on the local aquifer properties and recharge conditions (Figures 3, 4), as well as on the distance of the well from the outflow.
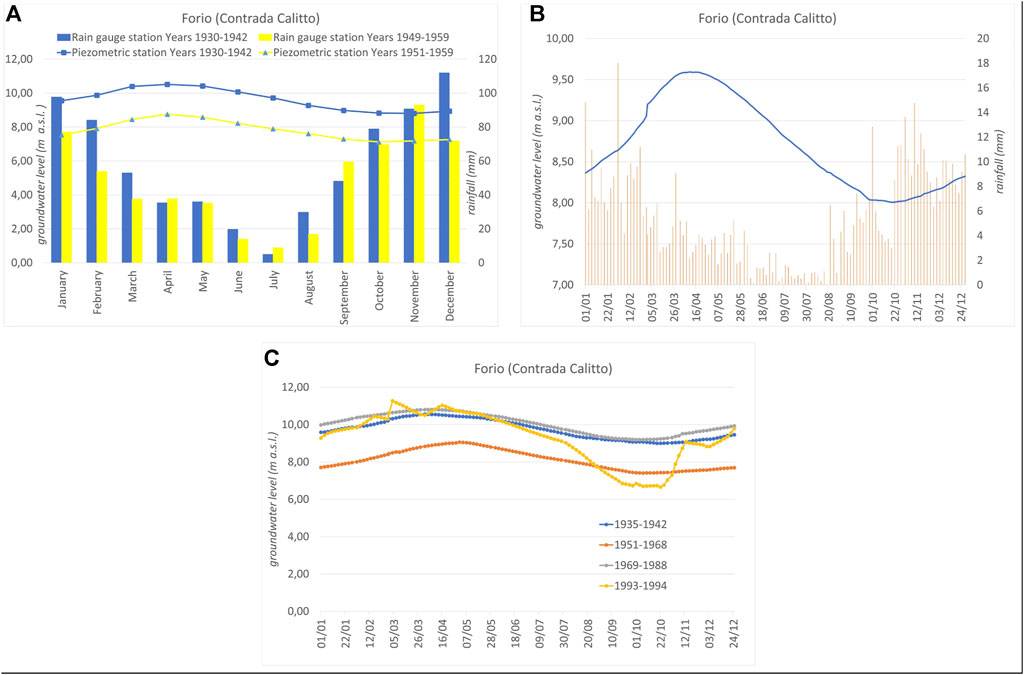
FIGURE 3. Analysis of the groundwater level fluctuations measured in the National Hydrographic and Mareographic monitoring well “Forio (Contrada Calitto)”: (A) comparison between the average monthly groundwater level and rainfall; (B) comparison between the average daily groundwater level and rainfall observed from 1935 to 1959; (C) comparison of the groundwater fluctuations for specific time periods. The well location is shown in Figure 2.
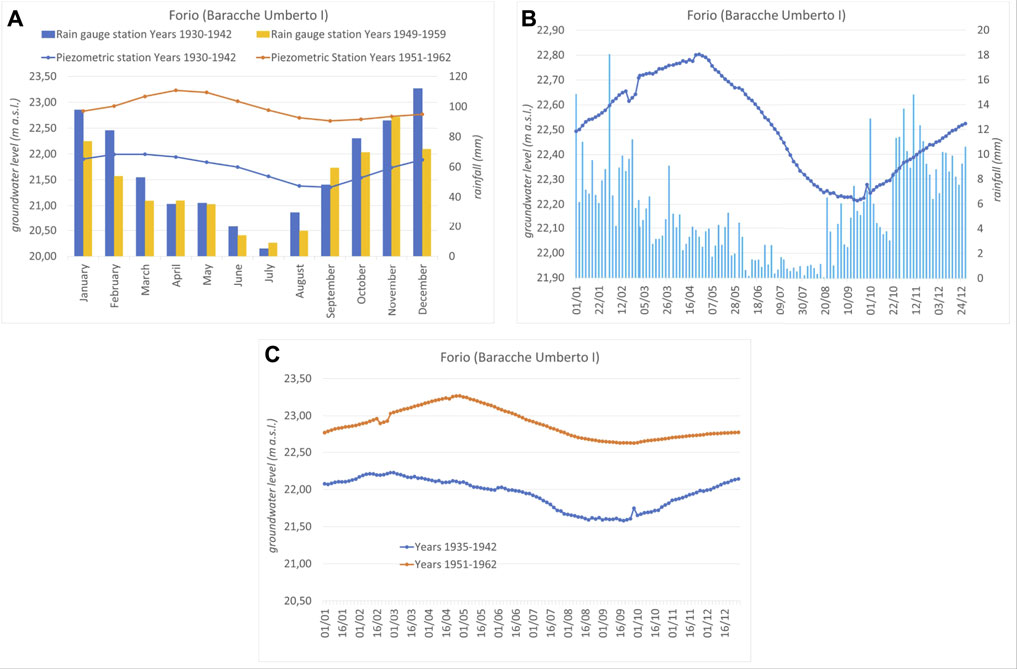
FIGURE 4. Analysis of the groundwater level fluctuations measured in the National Hydrographic and Mareographic monitoring well “Forio (Baracche Umberto I)”: (A) comparison between the average monthly groundwater level and rainfall; (B) comparison between the average daily groundwater level and rainfall observed from 1935 to 1962; (C) comparison of the groundwater fluctuations for specific time periods. The well location is in Figure 2.
Based on the groundwater regime, from the entire dataset, 68 wells were selected for the interpolation of the piezometric surface elevation with respect to the wet season (from 1977 to 2003), and 43 wells were selected for the same interpolation with respect to the dry season (from 1978 to 2001). These datasets were then related to georeferenced points in an ArcGIS© (ESRI, 2011) environment. The DEM of Ischia volcanic island at high resolution (pixel 1 x 1 m) was created by interpolating the elevation data extracted and revised from the Regional Technical Map, scale 1:5000. The DEM was used as a reference for the preliminary dataset verification since the groundwater level values recorded in the INGV Osservatorio Vesuviano database are derived from the surface elevation. The groundwater level data represent the elevation of the potentiometric surface. Then, the accuracy of the groundwater level datasets was estimated by comparison with the DEM values and altimetric information related to each groundwater observation well. There was very little information on the well screens, whereas the stratigraphic logs, from 5 to 245 m in depth, of 75 wells (about 68% of the total 111 wells), were known and used to identify the main aquifers investigated in the framework of the shallower aquifer system (cf. Section 4). Spatial analysis of the groundwater level elevation, as well as of the stratigraphic and tectonic elements which control the groundwater flow, was used to bound the interpolation areas for reconstructing the piezometric surface.
The field activities, mainly the geological and hydrogeological survey and the monitoring of the groundwater level in 36 selected wells, were aimed at validation of the boundaries of the interpolation areas.
3.2 Interpolation Methods
In this study, GIS interpolation techniques were used to reconstruct piezometric surface maps in the Ischia volcanic island. Nevertheless, the limited amount of water level data (68 observations related to the wet season and 43 observations related to the dry season) and their irregular spatial pattern were insufficient for the evaluation of the influence of hydrostratigraphic and tectonic elements on hydraulic head distribution in the whole island. Thus, the first potentiometric maps were produced by plotting the available water level data on the Ischia geological map (Sbrana and Toccaceli, 2011; Servizio Geologico d’Italia, 2018) and then contouring them manually, with regard to both dry and wet seasons. Based on the field survey results, the manual contouring of the data was able to take into account the influence of connections between the main aquifers and the major volcano-tectonic elements, as well as the effect of groundwater pumping.
Four sectors were recognized and bounded based on specific volcano-tectonic structures affecting groundwater flow conditions (cf. Section 4). Then, considering the few available water level measurements for each zone, the most common deterministic interpolation procedures were implemented for groundwater mapping in the western, southern, and northern peripheral areas of the resurgent block, as well as in the north-eastern part of Ischia Island. To generate a continuous potentiometric surface within the four identified aquifer structures, two main GIS interpolation tools were used: the natural neighbor (NaN) and inverse distance weighting (IDW) methods. The accuracy (in congruence with the practical manual contouring method and results) of the IDW technique was processed by application of the Geostatistical Analyst tools in ArcGIS© (ESRI). The results from NaN and IDW interpolation were compared to check the effectiveness of both methods in predicting the spatial variability of the hydraulic heads.
3.2.1 Natural Neighbor
The natural neighbor interpolation (NaN) was developed by Sibson (1981). It represents a geometric evaluation method that manages natural neighbor regions constructed around each point of the dataset. The procedure begins with the triangulation of the data by Delauney’s method. The corners of the triangles are the points measured in adjacent Thiessen polygons. To estimate the value of a point, it is incorporated into the tessellation, and its value derives from the closest subset of measured points. The weight of each neighbor is based on its proportionate area (Webster and Oliver, 2001).
So, the natural neighbor algorithm basically introduces an additional point into the existing Voronoi diagram (Tsidaev, 2016):
where G(x,y) is the value attributed to the interpolated point; f(xi,yi) is the measured value at point (xi, yi); and wi is the weight of the measured value at point (xi, yi). Such properties make the natural neighbor method a local, exact interpolator, that is, useful with scattered and irregularly spaced data.
3.2.2 Inverse Distance Weighting
The inverse distance weighting (IDW) method calculates the values of unmeasured points by a linear weighted combination of values at measured points. This interpolator assumes that measured points closer to an unmeasured point are more similar to it than those further away (Webster and Oliver, 2001). Therefore, the influence (weight) of each measured point decreases as a function of distance (Li and Heap 2008):
where λi is the weight for the neighbor i; di is the distance of the measured point to the estimated point; p is a power parameter; and n is the number of measured points used for estimation. The main factors affecting the accuracy of IDW interpolation are the value of the power parameter (Isaaks and Srivastava, 1989) and the number and size of neighbor areas. In this study, the power parameter and the features of neighbor areas were chosen using the Geostatistical Analyst tools in ArcGIS© (ESRI), resulting in the interpolation nearest to the hydrogeological conceptual model of the examined aquifer structures.
4 Results
The interpolation of groundwater level for mapping the piezometric surface in the shallow aquifer system of Ischia volcanic island was carried out taking account of the geometry of the selected dataset in relation to the stratigraphic and volcano-tectonic setting that would affect the spatial variations of basin-scale flow paths and thus the hydraulic head distribution. In the northern and western parts of the island, the wells selected for interpolation were mostly located between the inferred collapsed area and/or the coastline and the resurgent block; in the southern area, the groundwater level dataset locations were largely placed between the coastline and the inferred collapsed area (Figure 5). In particular, the main faults around the resurgent block and the caldera boundaries were related to barriers to horizontal groundwater flow, which cause groundwater level steps, even if they act as vertical conduits for deep fluid transport (Bense et al., 2016). In addition, the juxtaposition of lithostratigraphic units with contrasting permeabilities, often due to vertical displacement, was carefully considered. In this regard, the critical interpretation and correlation of the available stratigraphic logs refer to the main aquifers explored (Figure 5).
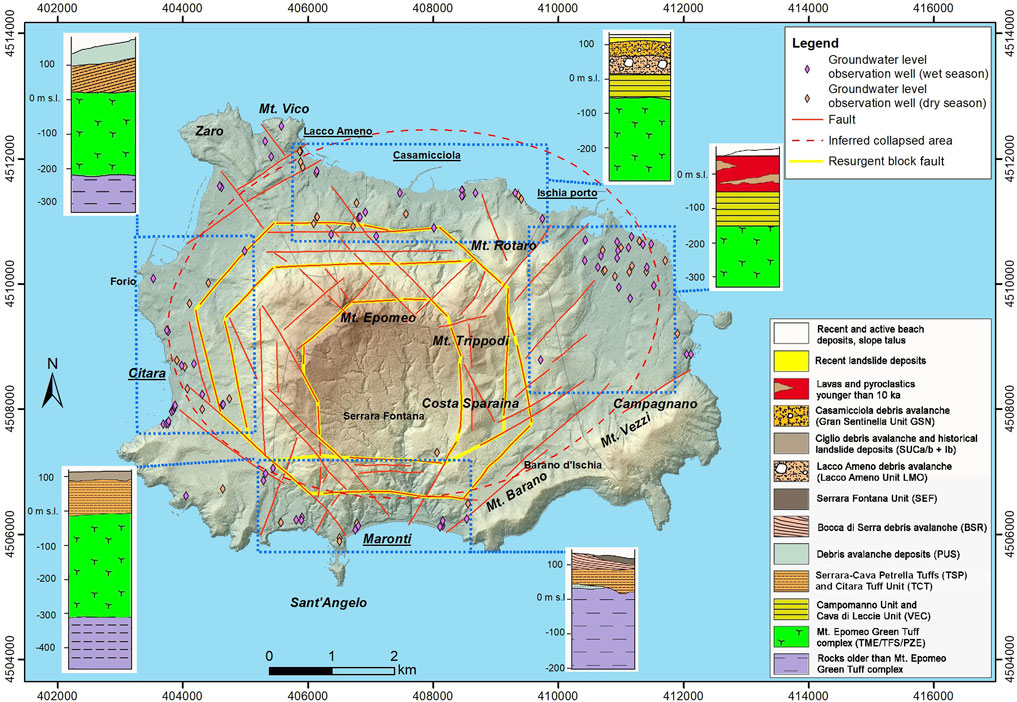
FIGURE 5. Stratigraphical and structural sketch map of Ischia Island. Available groundwater level datasets are shown; site descriptive information includes well depths and stratigraphic logs. The blue dashed lines highlight the delimitation of four distinct sectors used for the reconstruction of a reliable potentiometric surface. For each sector, the stratigraphic type section is reported based on the drilling information. DEM details are in Figure 2.
In the northern coastal zone of the island, the marine epiclastic and sedimentary marine deposits (namely, Campomanno and Cava Leccie lithostratigraphic units) (e.g., Sbrana et al., 2018), characterized by low permeability, confine the groundwater flow in the Mt. Epomeo Green Tuff aquifer (cf. Mt. Epomeo Green Tuff unit: Frassitelli and Pizzone, Sbrana et al., 2018) that represents the deeper aquitard of the shallowest multilayered volcanic aquifer (Figure 5). In this area, the groundwater level dataset involved wells from 24 to 195 m in depth. The deepest wells, which extended to the Green Tuff aquifer, are located near the boundary of the resurgent block.
In the western area, the morphological evolution related to the resurgence phenomenon caused the formation of widespread debris avalanche, debris flow, and landslide deposits which identify a multilayered aquifer system (Della Seta et al., 2012) affecting the groundwater flow (Figure 1). In this regard, as shown in Figure 5, in the southern part of this sector, it may be seen that two aquifers are separated by the intercalation of the Citara Tuff Unit (TCT; Sbrana et al., 2018), which consists mainly of yellowish ash tuffs with interbeds of clast-supported white trachytic pumice lapilli. The deeper aquifer includes the Mt. Epomeo Green Tuff complex; the shallower one includes the debris avalanche deposits of Punta del Soccorso (PUS; Sbrana et al., 2018). In the northern part of the western area, the sole detectable groundwater flow involves buried beach deposits and the underlying landslide deposits (Figure 1). The depth of the groundwater observation wells used for the interpolation varies from 40 m to 183 m; the deepest wells are located in the resurgent block.
The hydrostratigraphic architecture of the south-western area is comparable to that of the western zone described above (Figure 5). The debris avalanche, debris flow, and landslide deposits characterize the shallower groundwater flow, which reveals a connection with the deeper aquifer of the Mt. Epomeo Green Tuff complex and the underlying older lava units, and with the hydrothermal reservoir located at depths of ∼200 m. Toward SE, in the fumarole area and Maronti Beach (Figure 1), the structural setting is more complicated due to the presence of the caldera border, which limits the outcrop of the Mt. Epomeo Green Tuff. In this geothermal area was observed boiling water (T≥80°C), whose geochemical features and dissolved gases have been analyzed by several studies (e.g., Di Napoli et al., 2011; Carlino et al., 2014). The selected database showed well depths from 20 m to 220 m, and most of the available wells reached the deeper aquifers.
The volcanic activity of the last 10 ka affected the hydrological properties and the deformation of the volcanic units in the lowland located to the east of the Mt. Epomeo resurgent block (Figure 1). As a result, a N50E-trending fault system determined the alignments of the main volcanic vents and influenced the drainage network. The complex relationships among NW-SE, NE-SW, and N-S trending fault systems show several displaced blocks connected to the resurgent block (de Vita et al., 2010). Considering the depths of the selected wells (from 5 to 80 m), in the sector of the available groundwater level dataset, the hydrostratigraphic succession depicted a sequence of lava and pyroclastic deposits with moderate/high permeability (Celico et al., 1999; Piscopo et al., 2020b) (Figure 5).
Therefore, the analysis of the hydrostratigraphic architecture of the shallow multilayered aquifer, combined with the location of the 111 available observation wells (Figure 5), led to the delimitation of four distinct sectors for the reconstruction of a reliable potentiometric surface in the Ischia volcanic island during the dry and wet seasons.
Based on the aforementioned hydrogeological features, the peripheral area of the resurgent block of Mt. Epomeo allows recognition of four main dissimilar sectors (Figure 5):
• The sector of Casamicciola–Lacco Ameno to the north is constrained by the E–W and NW–SE trending normal fault systems along the northern boundary of the resurgent block and along the boundary of the Zaro volcanic complex in the northwestern corner of the island, and by Mt. Rotaro to the east.
• The sector of Citara to the west is located to the south of the Zaro volcanic complex and is bordered toward east by inward-dipping, high-angle reverse faults, the direction of which varies from N40E to N–S and N50W along the most uplifted block of Mt. Epomeo, and by the NW–SE and NE–SW trending marginal caldera faults.
• The sector of Maronti to the south is constrained by the E–W and NE–SW trending normal fault system along the southern boundary of the resurgent block, and by the NW–SE and NE–SW trending marginal caldera faults.
• The sector of Ischia Porto is constrained westward by the Monte Rotaro–Monte Trippodi–Costa Sparaina alignment, and southward by the Monte Barano–Monte Vezzi–Campagnano alignment. It is noteworthy that this resulting lowland is connected to the resurgent area of Mt. Epomeo through a series of differentially displaced blocks.
4.1 Casamicciola–Lacco Ameno Sector
The Casamicciola–Lacco Ameno sector is one of the main geothermal areas of the island. The major fault-controlled hot springs are located along the northern boundary of the resurgent block (Figure 6). They may be regarded as overflow and uplift springs (Soulios, 2010).
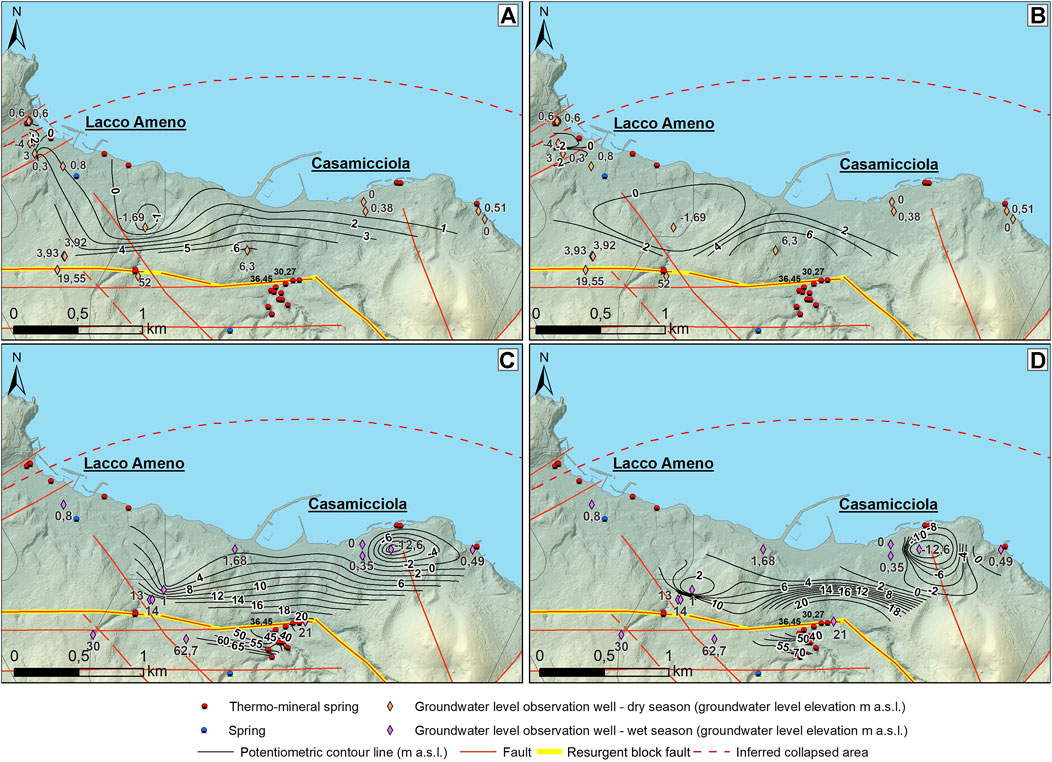
FIGURE 6. Piezometric surface map of the Casamicciola–Lacco Ameno sector: (A) NaN interpolation (dry season); (B) IDW interpolation (dry season); (C) NaN interpolation (wet season); (D) IDW interpolation (wet season). DEM details are in Figure 2.
For the interpolation of the piezometric surface in this area, 16 observation wells were used for the dry season and 12 observation wells were used for the wet season. In the zone closer to the coast, this reconstruction provided an indication of groundwater flow conditions in the superficial composite volcanic aquifer overlying the marine epiclastic and sedimentary marine deposits (Campomanno Unit and Cava Leccie Unit; Figure 5). This shallower circulation rejoins with the groundwater flow of the deeper aquifer (Green Tuff aquifer) along the border of the resurgent block owing to the specific characteristics of the groundwater wells (cf. Section 4 and Figure 5). According to the well data, the potentiometric surface ranges from 6.3 m above the sea level (a.s.l.) to 4.0 m b.s.l. during the dry season (Figures 6A,B), and from 14.0 m a.s.l. to 12.6 m b.s.l. during the wet season. Moreover, in proximity to the resurgent block, the hydraulic head reached the value of about 21.0 m a.s.l. in the wet season (Figures 6C,D). The geometry of the available dataset does not allow mitigation of the noise associated with the dynamic variation of groundwater elevation caused by pumping wells. The interpolation of the observed groundwater level data shows a continuous piezometric surface ranging from 6.3 m a.s.l. to 3.9 m b.s.l. (NaN method), and from 6.3 m a.s.l. to 4.0 m b.s.l. (IDW method), during the dry season. With regard to the wet season, instead, the interpolation indicates values ranging from 20.8 m a.s.l. to 12.4 m b.s.l. (NaN method), and from 21.0 m a.s.l. to 12.6 m b.s.l. (IDW method) (Figure 10). The analysis of the computed potentiometric maps reveals standard deviations equal to δ = 1.56 and δ = 2.07 according to the NaN and IDW methods, respectively, during the dry season, while δ = 5.78 based on the NaN method and δ = 7.41 based on the IDW method during the wet season. The optimal selection of the IDW interpolation parameters was based on congruence with the hydrogeological conceptual model of the area depicted in Section 4. In particular, a power parameter equal to 5 and an anisotropy factor equal to at least 2 were used because these values optimized the geometry of the neighbor’s area as a function of the control related to the hydrostratigraphic and volcano-tectonic features that constrained the interpolation area. It is worth noting that, in the resurgent block, the hydraulic head, derived from the elevation of the thermo-mineral springs, rises by an average of about 15 m and shows a complex variability due to the volcano-tectonic dislocation of the Mt. Epomeo Green Tuff aquifer (Figure 6).
4.2 Citara Sector
With regard to the hydrostratigraphic architecture and the volcano-tectonic features of the Citara sector (Figure 5), eight observation wells were used for the interpolation of the piezometric surface in this area with respect to the dry season and 18 observation wells were used with respect to the wet season. This reconstruction provided an indication of groundwater flow conditions in the depicted volcanic aquifer system owing to the examined characteristics of the groundwater wells (cf. Section 4 and Figure 5). According to the well data, the potentiometric surface ranges from 15.0 m a.s.l. to 0.5 m a.s.l. during the dry season and from 9.9 m a.s.l. to 0.7 m a.s.l. during the wet season. Moreover, in the sector of the resurgent block, the hydraulic head reached a value of about 19.2 m a.s.l. in the dry season (Figures 7A,B), and a value of 19.5 m a.s.l. in the wet season (Figures 7C,D). The analysis of the predicted potentiometric maps (Figure 10) in the dry season shows δ = 6.27 with the NaN method and δ = 6.56 with the IDW method; it also shows δ = 5.42 based on the NaN method and δ = 5.30 based on the IDW method during the wet season. The IDW interpolation which best reflects the potential influence of the faults around the resurgent block and the caldera boundaries was obtained using a power parameter equal to 5 and taking account of an anisotropy factor equal to at least 2. These values optimized the geometry of the neighbor’s area as a function of the hydrogeological conceptual model.
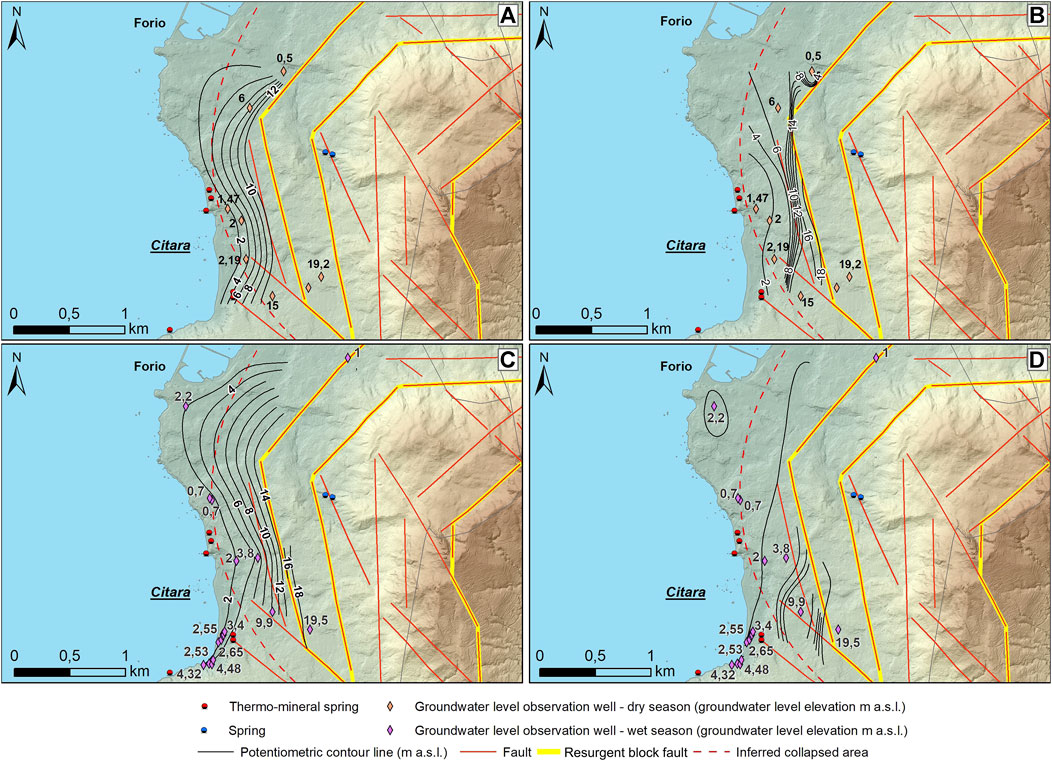
FIGURE 7. Piezometric surface map of the Citara sector: (A) NaN interpolation (dry season); (B) IDW interpolation (dry season); (C) NaN interpolation (wet season); (D) IDW interpolation (wet season). DEM details are in Figure 2.
4.3 Maronti Sector
In the identified Maronti sector, for the interpolation of the piezometric surface, five observation wells were used with respect to the dry season and nine with respect to the wet season. Taking account of the depths of the groundwater level observation wells and the reconstructed hydrogeological conceptual model, the elevation of the five main hot springs was considered in the definition of the piezometric surface. As a result, this surface depicts the groundwater flow conditions in the shallower multilayered volcanic aquifer recognized. According to the well and spring data, the potentiometric surface ranges from 25.0 m a.s.l. to 1.0 m a.s.l. during the dry season (Figures 8A,B) and varies from 25.0 m a.s.l. to 3.0 m b.s.l. during the wet season (Figures 8C,D). The interpolation of the observed groundwater level data shows a continuous piezometric surface (Figure 10) ranging from 0 m a.s.l. to 25.0 m a.s.l. (both NaN and IDW methods) during the dry season. With regard to the wet season, instead, the interpolation indicates values ranging from 2.9 m b.s.l. to 25.0 m a.s.l. (NaN method) and from 3.0 m b.s.l. to 25.0 m a.s.l. (IDW method). During the dry season, the analysis of the predicted potentiometric maps yields δ = 6.98 based on the NaN method, and δ = 7.97 based on the IDW method. Considering the wet season, the standard deviation becomes δ = 10.65 and δ = 9.36 based on the NaN and IDW methods, respectively. The IDW interpolation nearest to the hydrogeological conceptual model of the area was obtained by using a power parameter equal to 5 and an anisotropy factor equal to 2.6.
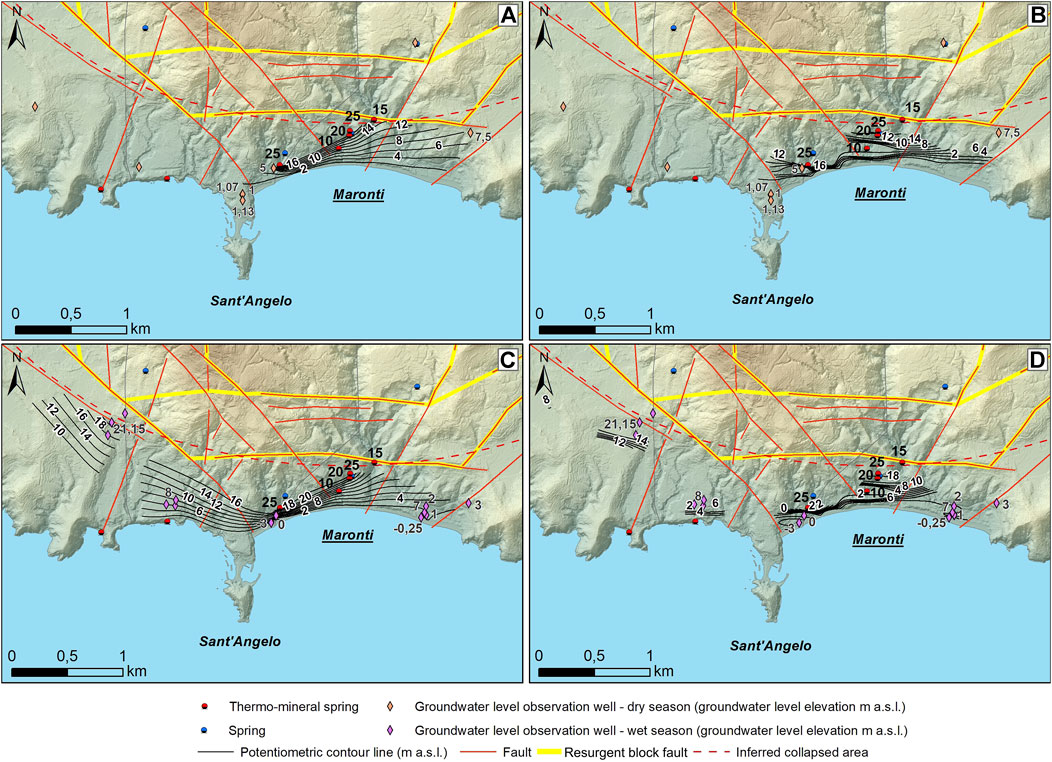
FIGURE 8. Piezometric surface map of the Maronti sector: (A) NaN interpolation (dry season); (B) IDW interpolation (dry season); (C) NaN interpolation (wet season); (D) IDW interpolation (wet season). DEM details are in Figure 2.
4.4 Ischia Porto Sector
The reconstruction of the piezometric surface was conducted using 10 observation wells for the dry season and 18 for the wet season. Given the examined depths of the groundwater wells, the two computed piezometric surfaces represent the groundwater flow circulation in the sequence of lava and pyroclastic deposits overlying the Campomanno sedimentary unit (Figure 5). According to the well data and viewing the north-eastern portion of the Ischia Porto sector, the potentiometric surface ranges from 2.0 m a.s.l. to 8.0 m b.s.l. during the dry season (Figures 9A,B) and from 2.0 m a.s.l. to 1.6 m b.s.l. during the wet season (Figures 9C,D). Furthermore, during the wet season, in the westernmost part of the investigated zone, the groundwater level reached a value of 9.7 m a.s.l. Clearly, available datasets do not allow mitigation of the noise caused by pumping wells. The interpolation of the observed groundwater level data shows a continuous piezometric surface ranging from 7.9 m b.s.l. to 2.0 m a.s.l. (NaN method) and from 8.0 m b.s.l. to 2 m a.s.l. (IDW method) during the dry season (Figures 9A,B, 10). With regard to the wet season (Figures 9C,D, 10), the interpolation gives values ranging from 1.6 m b.s.l. to 9.6 m a.s.l. (NaN method) and from 1.6 m b.s.l. to 9.7 m a.s.l. (IDW method). The analysis of the predicted potentiometric maps yields δ = 1.83 based on the NaN method and δ = 2.53 based on the IDW method during the dry season, while during the wet season, it gives δ = 2.38 and δ = 2.05 based on the NaN and IDW methods, respectively. The IDW interpolation which best matches the geometry of the neighbors’ area and the hydrogeological conceptual model was obtained using a power parameter equal to 3 and taking into account an anisotropy factor equal to 1.6.
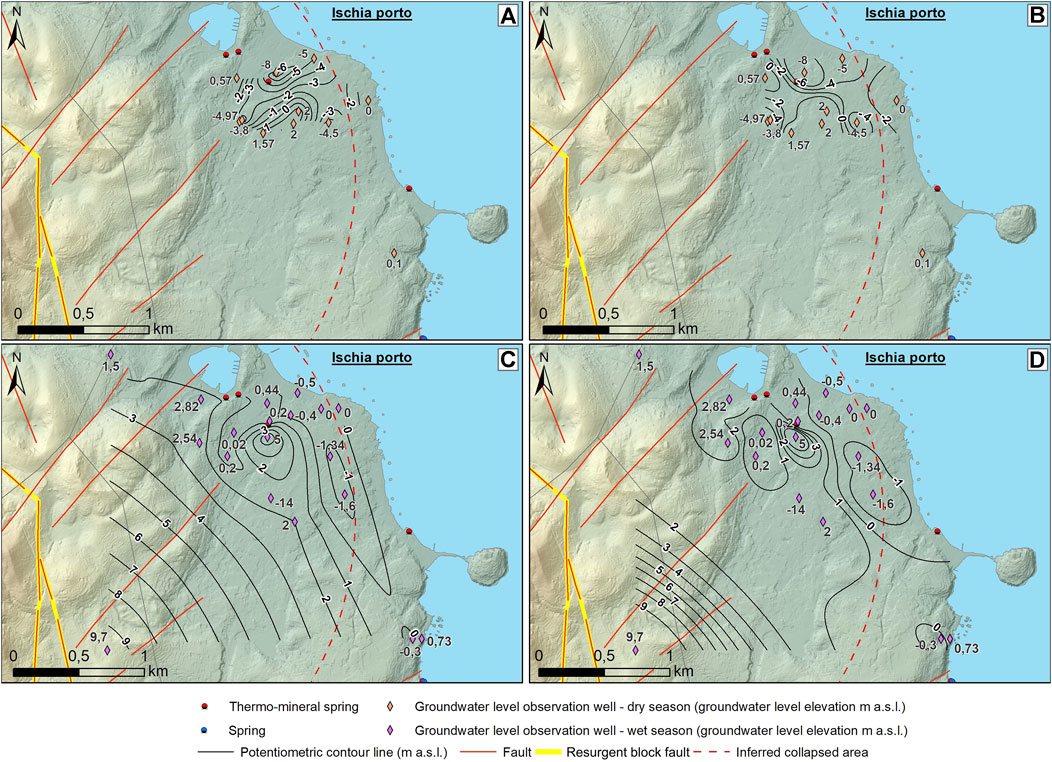
FIGURE 9. Piezometric surface map of the Ischia Porto sector: (A) NaN interpolation (dry season); (B) IDW interpolation (dry season); (C) NaN interpolation (wet season); (D) IDW interpolation (wet season). DEM details are in Figure 2.
5 Discussion
In Ischia, the analysis of the existing long records of groundwater level observations has revealed no significant changes in the groundwater surface elevation over the years, leaving aside the influence of the 1950s dry period (e.g., Spinoni et al., 2015). However, new collected information about the National Hydrographic and Mareographic piezometric monitoring network (cf. Section 3.1) has uncovered that during the recognized dry years, the groundwater level decreased by about 2 m in the shallower aquifers (Figure 3). In the deeper aquifers, instead, it was at least 1 m above the groundwater level recorded during the preceding wet years (Figure 4). The average seasonal fluctuations at different sites (Figure 2) ranged from few centimeters to about 2 m. The groundwater recession period usually occurred between March/April and October/November. Furthermore, the field control of main stratigraphical and volcano-tectonic features, as well as springs/thermo-mineral springs, integrated information on relationships between the main faults around the resurgent block or the caldera boundaries and the groundwater circulation. In fact, the number, distribution, and nature of springs and fumaroles (Figures 1, 10) enhanced the delineation of rather homogeneous stratigraphic and volcano-tectonic structures at the basin-scale, especially in the south-western area of the island. In addition, the revision and updation of the hydrostratigraphic framework (see Section 4) resulted in a better understanding of the hydrogeological behavior of the complex volcanic system, and hence, the analysis of groundwater level data has been improved. Based on these findings, more new reliable potentiometric surfaces of the four main geothermal areas closest to the coast were produced, during both dry and wet seasons (Figure 10). This result was obtained despite the sparse data, which resolves critical issues of earlier studies associated with the interpolation of groundwater level data that are spatially or/and temporally inhomogeneous. In fact, in the south-eastern corner of the Lacco Ameno–Casamicciola and Citara sectors, it was possible to outline the actual relationships with the inland areas of the resurgent block of Mt. Epomeo (Figures 6, 7). The geometry of potentiometric datasets, moreover, highlights the effect of groundwater pumping for human activities. Pumping wells cause marked changes of groundwater levels and have become a relevant environmental issue for the assessment of the groundwater circulation in the volcanic island examined, especially in the Casamicciola–Lacco Ameno and Ischia Porto areas, where large sectors were characterized by piezometric depression ranging to 12.6 and 8 m below the sea level, respectively (Figures 6, 9). The groundwater maps generated using the NaN and IDW methods (Figure 10) were rather similar, which confirm their suitability for the interpolation of a continuous phenomenon from sparse data points (e.g., Li and Heap, 2014). Nevertheless, with respect to the updated hydrogeological conceptual model, the performance of the applied spatial interpolation methods was sector-dependent, and a comparison of their reconstructed maps shows remarkable variations in terms of standard deviation (δ) and mean value. In the Casamicciola–Lacco Ameno and Maronti areas (cf. Section 4.1 and Section 4.3), the standard deviation derived from the reconstructed maps had lower values for the NaN method, while similar values were obtained for both methods in the Citara and Ischia Porto areas (cf. Sections 4.2 and Section 4.4). As regards the mean hydraulic head values, the NaN method gave values higher than those obtained from the IDW method. The differences ranged from 2.53 m (Citara area during the wet season) to 0.25 m (Casamicciola–Lacco Ameno area during the dry season). Clearly, the features of the hydrogeological terrain and the groundwater level observation network affect the coefficients of variation (at least equal to 57%). Considering the specific features of applied spatial interpolation procedures (e.g., Li and Heap, 2014; Musashi et al., 2018; Etherington, 2020), these differences can be mainly attributed to the local heterogeneity of each examined hydrostructure and to the number, distribution, and nature of groundwater level data. Both methods are convex (estimated groundwater elevations are always between the maximum and the minimum observed groundwater levels) and gradual, but the NaN method is an exact interpolator and seems better adapted to local variation of data density and spatial arrangement, as recognized in the Citara and Maronti sectors. The higher values of the IDW coefficient variation may be related to the capacity of this method to emphasize the variability of the hydraulic heads due to the local heterogeneity of the aquifer systems and to the noise associated with the dynamic variation of groundwater elevation caused by pumping wells. Furthermore, the use of the Geostatistical Analyst tools in ArcGIS© (ESRI) allowed the selection of the power parameter for assessing the search neighborhood strategy (cf. Section 3.2.2) based on the hydrogeological conceptual model of the specific aquifer structure. These tools constrained the examined interpolator to consider the geometry and the influence of the main stratigraphic and volcano-tectonic features controlling the boundary conditions of the interpolation areas. Therefore, this approach favored the integration of complex information derived from the conceptual hydrogeological model of specific areas and from the geometry of groundwater level datasets. Regarding the examined sectors of the Ischia Island, the complexity of each aquifer system affected the power parameter of the IDW function (equal to at least 3) and the anisotropy factor (equal to at least 1.6).
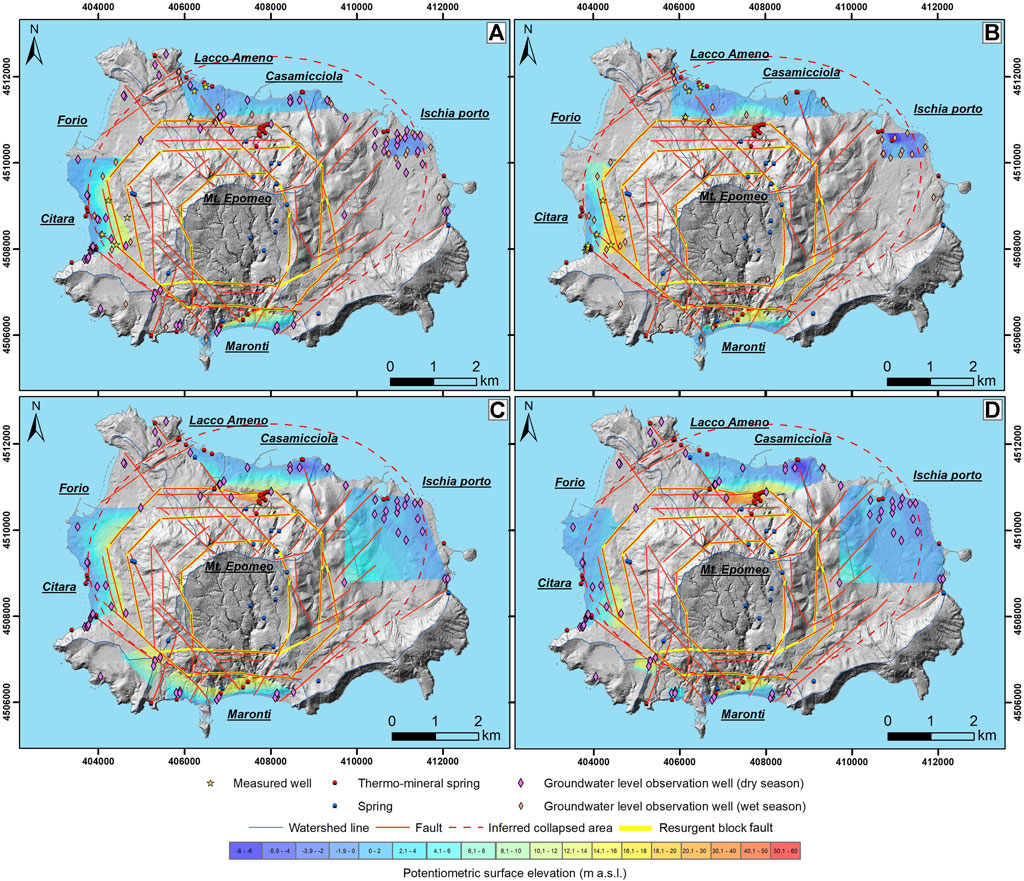
FIGURE 10. Structural sketch map of Ischia Island and reconstructed piezometric surfaces of the four main geothermal areas: (A) NaN interpolation (dry season); (B) IDW interpolation (dry season); (C) NaN interpolation (wet season); (D) IDW interpolation (wet season). The geometry of datasets used for the interpolation is shown; the location of wells used for the validation is reported, as well as all springs/thermo-mineral springs surveyed during field activities. DEM details are in Figure 2.
Considering the small and sparse dataset and the few previous groundwater table map validation procedures (Nistor et al., 2020), these results and the reconstruction of the potentiometric surface maps were validated against complementary field data taken during recent measurement campaigns (Figures 10, 11), which also provided information about the limited ability to predict the groundwater elevation at unsampled locations outside the sector covered by existing observations. The conditions of the Casamicciola–Lacco Ameno and Citara sectors modeled during the dry season may serve to illustrate the reliability of the hydrogeological pattern depicted. As shown in Figures 11A-D, the measured groundwater level (well data) and predicted values (derived from the interpolation model) were expected to scatter around the 1:1 line. The cross-validation scatter plots provided by the two interpolation methods are comparable, and both NaN and IDW methods provide reliable estimates of the groundwater level; the deviation from the 1:1 line increases with reference to the Citara sector, especially for the NaN method (Figure 11C). Clearly, the accuracy of the reconstructed maps was dependent on the geometry of contrasting structural and/or stratigraphical influences as well as on the effect of pumping wells and the spatial distribution of data. In fact, the comparison of cross-validation statistics (Table 1), that is, higher values of mean prediction error (ME) and root-mean-square prediction error (RMSE), resulting from the IDW method, confirms its capacity to highlight the local variability of the hydraulic heads and the influence of the boundary conditions. Nevertheless, it is worth noting that reconstructed groundwater mapping is an effective complement to the ongoing multidisciplinary field investigations. The piezometric maps produced improve our knowledge of the influence on the groundwater circulation of the main faults around the resurgent block and the caldera boundaries and are useful to indicate an appropriate scale assessing the most relevant stratigraphic and volcano-tectonic features of the shallower volcanic aquifer system. In this regard, the role of the main volcano-tectonic structures is certainly significant, as marked in the previous hydrogeological studies (i.e., resurgent block, cf. Section 2), but the novel, validated, potentiometric surfaces, as well as the detailed spring census (Figure 10), reveal the role of the caldera in the groundwater flow. The relationship between the caldera/resurgent block and main eruptive vents enables the identification of several different hydrostructures, and hence, the so-called “basal aquifer” of the shallower volcanic aquifer system cannot be considered continuous. The resultant first comparison between wet and dry seasons, moreover, demonstrates that the groundwater level elevation declines on average about 2 m during the dry period and that the spatiotemporal differences in hydraulic head fluctuations depend mainly on local groundwater pumping activities. It is worth noting that the assessment of long-term and seasonal changes in the groundwater surface elevation is a challenging issue for active volcanic areas, especially in coastal and insular terrains. In fact, these fluctuations are the outcome of complex and dynamic mixing among meteoric water, sea water, and deep fluids. Advances on their knowledge are, hence, of fundamental importance for understanding the interaction between water and the magmatic system in order to evaluate and manage the volcanic risk.
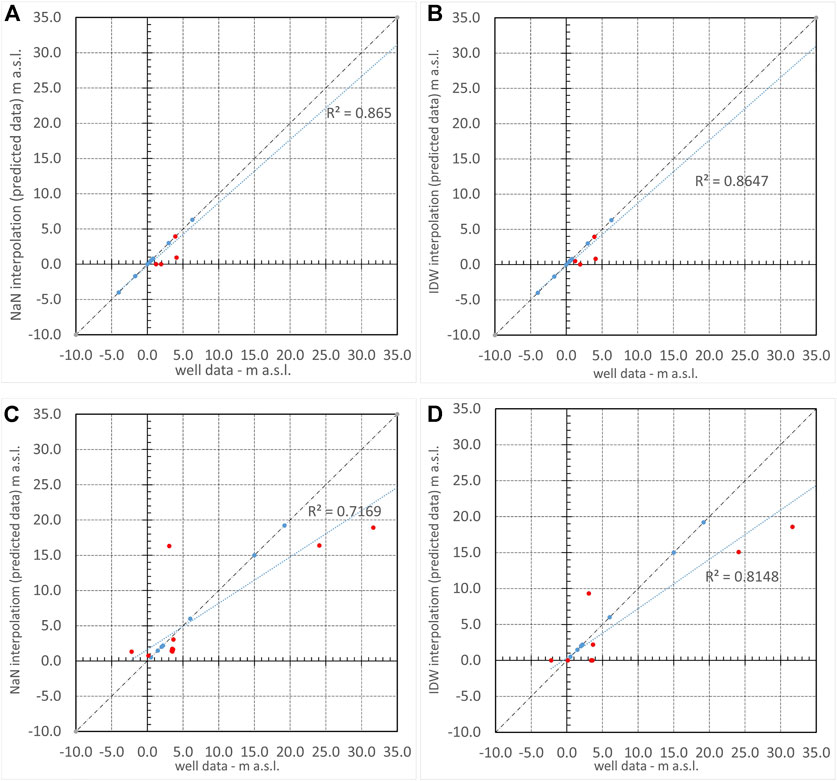
FIGURE 11. Correlation between the measured groundwater level (well data) and the predicted values (derived from the interpolation model) during the dry season in the Casamicciola–Lacco Ameno sector: (A) NaN interpolation and (B) IDW interpolation, and the Citara sector: (C) NaN interpolation and (D) IDW interpolation. Blue dots correspond to available data; red dots correspond to complementary field groundwater level measurements.

TABLE 1. Cross-validation results for NaN and IDW interpolation methods during the dry season. The mean prediction error (ME) and root-mean-square prediction error (RMSE) are in meters.
6 Conclusion
Monitoring and safeguarding the natural and built environment in areas exposed to volcanic risk is a very complex task that involves a very large number of heterogeneous data. Among others, the rational and validated reconstruction of groundwater circulation represents a challenging interdisciplinary problem due to the complex and dynamic mixing between meteoric water, sea water, and deep fluids. This article describes a hydrogeology-driven methodology aimed at exploiting and integrating all available knowledge (geological, volcanological, geochemical, and hydrogeological) through the use of a popular information technology platform such as the GIS. Optimization and validation of the methodology were based on reference to an important real-life case, the Isle of Ischia located in southern Italy. Attention was focused on reconstruction of the piezometric maps of areas for which sufficient detailed basic information was available, consisting primarily of reliable long-term measurements. It was found that tools and procedures currently available in widely used GIS software packages may be carefully used in order to fit relevant requirements, in particular accuracy and compliance with stratigraphic and volcano-tectonic knowledge. The results illustrated in this study are one of the few instances in which piezometric maps have been validated. Nevertheless, these findings point toward an optimal interpolation approach, which is not purely mathematical in nature, but has to incorporate and account for qualitative and semi-quantitative parameters associated with boundary conditions determined by detailed survey-scale knowledge of the geological and hydrogeological settings. The reconstruction of the hydrostratigraphic architecture of the shallow multi-layered aquifer, combined with the location of the 111 available observation wells, led to the delimitation of four important sectors of the island in which the reconstruction of a reliable potentiometric surface has been carried out during both the dry and wet seasons. The analysis revealed the key role of volcano-tectonic features in the aquifer structure, and therefore, novel and original results have been herein discussed. The enhancement of identification of the main volcano-tectonic structures characterized by distinct hydrodynamic conditions has improved the interpretation of available groundwater level data and resolved the major drawbacks of previous hydrogeological studies concerning the interpolation of spatially or/and temporally inhomogeneous data. In summary, perspectives for the interpretative extension of existing groundwater level measurements (often few and sparse in a volcanic island) are encouraging in view of this operational upgrade of the hydrogeological, geochemical, and volcanic monitoring system.
Data Availability Statement
The raw data supporting the conclusions of this article will be made available by the authors, without undue reservation.
Author Contributions
SF, SV, and MV contributed to conceptualization, data validation, and reviewing and editing the manuscript. SF and EB performed data curation and formal analysis. SF, SV, MV, RA, and EM carried out investigations. SF contributed to designing the methodology and wrote the first draft of the manuscript. SF, EB, and SV drew the figures. SV was responsible for funding acquisition and project administration. All authors contributed to manuscript revision and read and approved the submitted version.
Funding
This study was financially supported in the framework of the DPC-INGV B2 Project, Task 15 (2019–2021).
Conflict of Interest
The authors declare that the research was conducted in the absence of any commercial or financial relationships that could be construed as a potential conflict of interest.
Publisher’s Note
All claims expressed in this article are solely those of the authors and do not necessarily represent those of their affiliated organizations, or those of the publisher, the editors, and the reviewers. Any product that may be evaluated in this article, or claim that may be made by its manufacturer, is not guaranteed or endorsed by the publisher.
References
Abdalla, F., Moubark, K., and Abdelkareem, M. (2020). Groundwater Potential Mapping Using GIS, Linear Weighted Combination Techniques and Geochemical Processes Identification, West of the Qena Area, Upper Egypt. J. Taibah Univ. Sci. 14 (1), 1350–1362. doi:10.1080/16583655.2020.1822646
Acocella, V., and Funiciello, R. (1999). The Interaction between Regional and Local Tectonics during Resurgent Doming: the Case of the Island of Ischia, Italy. J. Volcanol. Geotherm. Res. 88, 109–123. doi:10.1016/S0377-0273(98)00109-7
Aiuppa, A., Avino, R., Brusca, L., Caliro, S., Chiodini, G., D'Alessandro, W., et al. (2006). Mineral Control of Arsenic Content in Thermal Waters from Volcano-Hosted Hydrothermal Systems: Insights from Island of Ischia and Phlegrean Fields (Campanian Volcanic Province, Italy). Chem. Geol. 229, 313–330. doi:10.1016/j.chemgeo.2005.11.004
Alessio, G., Esposito, E., Ferranti, L., Mastrolorenzo, G., and Porfido, S. (1996). Correlazione tra sismicità ed elementi strutturali nell’isola d’Ischia. Il Quat. 9, 303–308.
Atkinson, T. C., and Davison, R. M. (2002). Is the Water Still Hot? Sustainability and the Thermal Springs at Bath, 193. England: Geological Society, London, Special Publications, 15–40. doi:10.1144/GSL.SP.2002.193.01.02
Bear, J. (20071979). Hydraulics of Groundwater. Republishing of the edition published by. New York: McGraw-Hill Book Co.Dover Publication, 592.
Bellucci Sessa, E., Castellano, M., and Ricciolino, P. (2021). GIS Applications in Volcano Monitoring: the Study of Seismic Swarms at the Campi Flegrei Volcanic Complex, Italy. Adv. Geosci. 52, 131–144. doi:10.5194/adgeo-52-131-2021
Bense, V. F., Shipton, Z. K., Kremer, Y., and Kampman, N. (2016). Fault Zone Hydrogeology: Introduction to the Special Issue. Geofluids 16, 655–657. doi:10.1111/gfl.12205
Berrino, G., Vajda, P., Zahorec, P., Camacho, A. G., De Novellis, V., Carlino, S., et al. (2021). Interpretation of Spatiotemporal Gravity Changes Accompanying the Earthquake of 21 August 2017 on Ischia (Italy). Contrib. Geophys. Geod. 51 (4), 345–371. doi:10.31577/congeo.2021.51.4.3
Bourgine, B., Saltel, M., Pedron, N., and Lavie, E. (2017). “Building Piezometric Maps: Contribution of Geostatistical Tools,” in Geostatistics Valencia 2016. Quantitative Geology and Geostatistics. Editors J. Gómez-Hernández, J. Rodrigo-Ilarri, M. Rodrigo-Clavero, E. Cassiraga, and J. Vargas-Guzmán (Cham: Springer), 19, 761–776. doi:10.1007/978-3-319-46819-8_52
Brown, R. J., Orsi, G., and de Vita, S. (2008). New Insights into Late Pleistocene Explosive Volcanic Activity and Caldera Formation on Ischia (Southern Italy). Bull. Volcanol. 70, 583–603. doi:10.1007/s00445-007-0155-0
Bruno, P. P. G., de Alteriis, G., and Florio, G. (2002). The Western Undersea Section of the Ischia Volcanic Complex (Italy, Tyrrhenian Sea) Inferred by Marine Geophysical Data. Geophys. Res. Lett. 29, 57–61. doi:10.1029/2001GL013904
Burrough, P. A., and McDonnell, R. A. (1998). Principles of Geographical Information Systems. 2nd ed. Oxford: Oxford University Press, 352.
Caliro, S., Panichi, C., and Stanzione, D. (1999). Variation in the Total Dissolved Carbon Isotope Composition of Thermal Waters of the Island of Ischia (Italy) and its Implications for Volcanic Surveillance. J. Volcanol. Geotherm. Res. 90, 219–240. doi:10.1016/S0377-0273(99)00027-X
Carapezza, M., Hauser, S., Parello, F., Scelsi, E., Valenza, M., Favara, R., et al. (1988). Preliminary Studies on the Geothermal Fluids of the Island of Ischia: Gas Geochemistry. Rendiconti della Soc. Ital. Mineral. Petrol. 43, 967–974. Available at: http://hdl.handle.net/2122/14010.
Carlino, S., Cubellis, E., Luongo, G., and Obrizzo, F. (2006). On the Mechanics of Caldera Resurgence of Ischia Island (Southern Italy), 269. London: Geological Society, London, Special Publication, 181–193. doi:10.1144/gsl.sp.2006.269.01.12
Carlino, S., Sbrana, A., Pino, N. A., Marianelli, P., Pasquini, G., De Martino, P., et al. (2022). The Volcano-Tectonics of the Northern Sector of Ischia Island Caldera (Southern Italy): Resurgence, Subsidence and Earthquakes. Front. Earth Sci. 10, 1–16. doi:10.3389/feart.2022.730023
Carlino, S., Somma, R., Troiano, A., Di Giuseppe, M. G., Troise, C., and De Natale, G. (2014). The Geothermal System of Ischia Island (Southern Italy): Critical Review and Sustainability Analysis of Geothermal Resource for Electricity Generation. Renew. Energy 62, 177–196. doi:10.1016/j.renene.2013.06.052
Celico, P., Stanzione, D., Esposito, L., Formica, F., Piscopo, V., and De Rosa, B. M. (1999). La complessità idrogeologica di un’area vulcanica attiva: l’Isola d’Ischia (Napoli-Campania). Boll. Soc. Geol. Ital. 118, 485–504.
Chiodini, G., Avino, R., Brombach, T., Caliro, S., Cardellini, C., De Vita, S., et al. (2004). Fumarolic and Diffuse Soil Degassing West of Mount Epomeo, Ischia, Italy. J. Volcanol. Geotherm. Res. 133, 291–309. doi:10.1016/S0377-0273(03)00403-7
De Gennaro, M., Ferreri, M., Ghiara, M. R., and Stanzione, D. (1984). Geochemistry of Thermal Waters on the Island of Ischia (Campania, Italy). Geothermics 13, 361–374. doi:10.1016/0375-6505(84)90050-6
De Novellis, V., Carlino, S., Castaldo, R., Tramelli, A., De Luca, C., Pino, N. A., et al. (2018). The 21 August 2017 Ischia (Italy) Earthquake Source Model Inferred from Seismological, GPS, and DInSAR Measurements. Geophys. Res. Lett. 45 (5), 2193–2202. doi:10.1002/2017GL076336
de Vita, S., Sansivero, F., Orsi, G., and Marotta, E. (2006). Cyclical Slope Instability and Volcanism Related to Volcano-Tectonism in Resurgent Calderas: the Ischia Island (Italy) Case Study. Eng. Geol. 86, 148–165. doi:10.1016/j.enggeo.2006.02.013
de Vita, S., Sansivero, F., Orsi, G., Marotta, E., and Piochi, M. (2010). Volcanological and Structural Evolution of the Ischia Resurgent Caldera (Italy) over the Past 10 Ky, 464. USA: The Geological Society of America, Special Paper, 193–239. doi:10.1130/2010.2464(10)
Della Seta, M., Esposito, C., Fiorucci, M., Marmoni, G. M., Martino, S., Sottili, G., et al. (2021). “Thermal Monitoring to Infer Possible Interactions between Shallow Hydrothermal System and Slope-Scale Gravitational Deformation of Mt Epomeo (Ischia Island, Italy),” in Volcanic Island: From Hazard Assessment to Risk Mitigation. Editors E. Marotta, L. D’Auria, F. Zaniboni, and R. Nave (London: Geological Society, London, Special Publications), 519, SP519–2020. doi:10.1144/SP519-2020-131
Della Seta, M., Marotta, E., Orsi, G., de Vita, S., Sansivero, F., and Fredi, P. (2012). Slope Instability Induced by Volcano-Tectonics as an Additional Source of Hazard in Active Volcanic Areas: The Case of Ischia Island (Italy). Bull. Volcanol. 74, 79–106. doi:10.1007/s00445-011-0501-0
Di Napoli, R., Aiuppa, A., Bellomo, S., Brusca, L., D'Alessandro, W., Candela, E. G., et al. (2009). A Model for Ischia Hydrothermal System: Evidences from the Chemistry of Thermal Groundwaters. J. Volcanol. Geotherm. Res. 186, 133–159. doi:10.1016/j.jvolgeores.2009.06.005
Di Napoli, R., Martorana, R., Orsi, G., Aiuppa, A., Camarda, M., De Gregorio, S., et al. (2011). The Structure of a Hydrothermal System from an Integrated Geochemical, Geophysical, and Geological Approach: the Ischia Island Case Study. Geochem. Geophys. Geosyst. 12, 1–25. doi:10.1029/2010GC003476
Díaz-Alcaide, S., and Martínez-Santos, P. (2019). Review: Advances in Groundwater Potential Mapping. Hydrogeol. J. 27, 2307–2324. doi:10.1007/s10040-019-02001-3
Domenico, P. A., and Schwartz, F. W. (1998). in Physical and Chemical Hydrogeology. 2nd ed (NY: John Wiley & Sons), 506.
ESRI (2011). ArcGIS Desktop: Release 10. Redlands, CA, USA: Environmental Systems Research Institute, Inc.
Etherington, T. R. (2020). Discrete Natural Neighbour Interpolation with Uncertainty Using Cross-Validation Error-Distance Fields. PeerJ Comput. Sci. 6, e282. doi:10.7717/peerj-cs.282
Felpeto, A., Martí, J., and Ortiz, R. (2007). Automatic GIS-Based System for Volcanic Hazard Assessment. J. Volcanol. Geotherm. Res. 166 (2), 106–116. doi:10.1016/j.jvolgeores.2007.07.008
Frisbee, M. D., Tolley, D. G., and Wilson, J. L. (2017). Field Estimates of Groundwater Circulation Depths in Two Mountainous Watersheds in the Western U.S. And the Effect of Deep Circulation on Solute Concentrations in Streamflow. Water Resour. Res. 53, 2693–2715. doi:10.1002/2016WR019553
Herrera, C., and Custodio, E. (2008). Conceptual Hydrogeological Model of Volcanic Easter Island (Chile) after Chemical and Isotopic Surveys. Hydrogeol. J. 16, 1329–1348. doi:10.1007/s10040-008-0316-z
Inguaggiato, S., Pecoraino, G., and D'Amore, F. (2000). Chemical and Isotopical Characterisation of Fluid Manifestations of Ischia Island (Italy). J. Volcanol. Geotherm. Res. 99, 151–178. doi:10.1016/S0377-0273(00)00158-X
Isaaks, E. H., and Srivastava, R. M. (1989). Applied Geostatistics. New York: Oxford University Press, 561.
Izquierdo, T. (2014). Conceptual Hydrogeological Model and Aquifer System Classification of a Small Volcanic Island (La Gomera; Canary Islands). Catena 114, 119–128. doi:10.1016/j.catena.2013.11.006
Join, J.-L., Folio, J.-L., and Robineau, B. (2005). Aquifers and groundwater within active shield volcanoes. Evolution of conceptual models in the Piton de la Fournaise volcano. J. Volcanol. Geotherm. Res. 147, 187–201. doi:10.1016/j.jvolgeores.2005.03.013
Kamińska, A., and Grzywna, A. (2014). Comparison of Deteministic Interpolation Methods for the Estimation of Groundwater Level. J. Ecol. Eng. 15/4, 55–60. doi:10.12911/22998993.1125458
Kicsiny, R., Piscopo, V., Scarelli, A., and Varga, Z. (2021). Game-theoretical Model for the Sustainable Use of Thermal Water Resources: the Case of Ischia Volcanic Island (Italy). Environ. Geochem Health 44, 2021. doi:10.1007/s10653-021-00871-9(0123456789
Li, J., and Heap, A. (2008). A Review of Spatial Interpolation Methods for Environmental Scientists. Australia: Geoscience Australia, 137. Record 2008/23.
Li, J., and Heap, A. D. (2014). Spatial Interpolation Methods Applied in the Environmental Sciences: A Review. Environ. Model. Softw. 53, 173–189. doi:10.1016/j.envsoft.2013.12.008
Marotta, E., and de Vita, S. (2014). The Role of Pre-existing Tectonic Structures and Magma Chamber Shape on the Geometry of Resurgent Blocks: Analogue Models. J. Volcanol. Geotherm. Res. 272, 23–38. doi:10.1016/j.jvolgeores.2013.12.005
Molin, P., Acocella, V., and Funiciello, R. (2003). Structural, Seismic and Hydrothermal Features at the Border of an Active Intermittent Resurgent Block: Ischia Island (Italy). J. Volcanol. Geotherm. Res. 121, 65–81. doi:10.1016/S0377-0273(02)00412-2
Morell, I., Pulido-Bosch, A., Daniele, L., and Cruz, J. V. (2008). Chemical and Isotopic Assessment in Volcanic Thermal Waters: Cases of Ischia (Italy) and São Miguel (Azores, Portugal). Hydrol. Process. 22, 4386–4399. Hydrological Processes Published online in Wiley InterScience ()Available at: www.interscience.wiley.com. doi:10.1002/hyp.7042
Musashi, J. P., Pramoedyo, H., and Fitriani, R. (2018). Comparison of Inverse Distance Weighted and Natural Neighbor Interpolation Method at Air Temperature Data in Malang Region. Cauchy 5 (2), 48–54. doi:10.18860/ca.v5i2.4722
Myers, D. E. (1994). Spatial Interpolation: an Overview. Geoderma 62, 17–28. doi:10.1016/0016-7061(94)90025-6
Nappi, R., Alessio, G., Gaudiosi, G., Nave, R., Marotta, E., Siniscalchi, V., et al. (2018). The 21 August 2017 Md 4.0 Casamicciola Earthquake: First Evidence of Coseismic Normal Surface Faulting at the Ischia Volcanic Island. Seismol. Res. Lett. 89 (4), 1323–1334. doi:10.1785/0220180063
Nappi, R., Porfido, S., Paganini, E., Vezzoli, L., Ferrario, M. F., Gaudiosi, G., et al. (2021). The 2017, MD = 4.0, Casamicciola Earthquake: ESI-07 Scale Evaluation and Implications for the Source Model. Geosciences 11 (2), 44. doi:10.3390/geosciences11020044
Nistor, M. M., Rahardjo, H., Satyanaga, A., Hao, K. Z., Xiaosheng, Q., and Sham, A. W. L. (2020). Investigation of Groundwater Table Distribution Using Borehole Piezometer Data Interpolation: Case Study of Singapore. Eng. Geol. 271, 105590. ISSN 0013-7952. doi:10.1016/j.enggeo.2020.105590
O'Sullivan, D., and Unwin, D. J. (2010). Geographic Information Analysis. 2nd ed. NY: John Wiley & Sons, 432.
Ochoa-González, G. H., Carreón-Freyre, D., Cerca, M., and López-Martínez, M. (2015). Assessment of Groundwater Flow in Volcanic Faulted Areas. A Study Case in Queretaro, Mexico. Geofísica Int. 54 (3), 199–220. doi:10.1016/j.gi.2015.04.016
Orsi, G., Patella, D., Piochi, M., and Tramacere, A. (1999). Magnetic Modelling of the Phlegrean Volcanic District with Extension to the Ponza Archipelago, Italy. J. Volcanol. Geotherm. Res. 91 (2-4), 345–360. doi:10.1016/S0377-0273(99)00043-8
Orsi, G., Gallo, G., and Zanchi, A. (1991). Simple-shearing Block Resurgence in Caldera Depressions. A Model from Pantelleria and Ischia. J. Volcanol. Geotherm. Res. 47, 1–11. doi:10.1016/0377-0273(91)90097-J
Panichi, C., Bolognesi, L., Ghiara, M. R., Noto, P., and Stanzione, D. (1992). Geothermal Assessment of the Island of Ischia (Southern Italy) from Isotopic and Chemical Composition of the Delivered Fluids. J. Volcanol. Geotherm. Res. 49, 329–348. doi:10.1016/0377-0273(92)90021-5
Pareschi, M. T., Cavarra, L., Favalli, M., Giannini, F., and Meriggi, A. (2000). GIS and Volcanic Risk Management. Nat. Hazards 21, 361–379. doi:10.1023/A:1008016304797
Piscopo, V., Formica, F., Lana, L., Lotti, F., Pianese, L., and Trifuoggi, M. (2020a). Relationship between Aquifer Pumping Response and Quality of Water Extracted from Wells in an Active Hydrothermal System: The Case of the Island of Ischia (Southern Italy). Water 12, 2576. doi:10.3390/w12092576
Piscopo, V., Lotti, F., Formica, F., Lana, L., and Pianese, L. (2020b). Groundwater Flow in the Ischia Volcanic Island (Italy) and its Implications for Thermal Water Abstraction. Hydrogeol. J. 28 (28), 579–601. doi:10.1007/s10040-019-02070-4
Rad, S. D., Allègre, C. J., and Louvat, P. (2007). Hidden Erosion on Volcanic Islands. Earth Planet. Sci. Lett. 262, 109–124. doi:10.1016/j.epsl.2007.07.019
Sbrana, A., Marianelli, P., and Pasquini, G. (2018). Volcanology of Ischia (Italy). J. Maps 14 (2), 494–503. doi:10.1080/17445647.2018.1498811
Sbrana, A., and Toccaceli, R. M. (2011). Carta Geologica della regione Campania in scala 1:10.000 – Foglio 464, Isola di Ischia. Note illustrative.Regione Campania, Assessorato Difesa del Suolo. Firenze: Litografia artistica cartografica.
Selva, J., Acocella, V., Bisson, M., Caliro, S., Costa, A., Della Seta, M., et al. (2019). Multiple Natural Hazards at Volcanic Islands: a Review for the Ischia Volcano (Italy). J. Appl. Volcanol. 8 (5), 1–43. doi:10.1186/s13617-019-0086-4
Sepe, V., Atzori, S., and Ventura, G. (2007). Subsidence Due to Crack Closure and Depressurization of Hydrothermal Systems: a Case Study from Mt Epomeo (Ischia Island, Italy). Terra nova. 19, 127–132. doi:10.1111/j.1365-3121.2006.00727
Servizio Geologico d’Italia (2018). Geological Map of Italy, F 464 Isola d’Ischia. 1:25000. ISPRA Roma: ISPRA Geological Survey of Italy.
Sibson, R. (1981). “A Brief Description of Natural Neighbor Interpolation (Chapter 2),” in Interpreting Multivariate Data. Editor V. Barnett (Chichester: John Wiley), 21–36.
Slocum, T. A., McMaster, R. B., Kessler, F. C., and Howard, H. H. (2014). Thematic Cartography and Geovisualization. Harlow: Pearson Education Limited.
Soulios, G. (2010). Springs (Classification, Function, Capturing). geosociety 43, 196–2015. doi:10.12681/bgsg.11174
Spinoni, J., Naumann, G., Vogt, J. V., and Barbosa, P. (2015). The Biggest Drought Events in Europe from 1950 to 2012. J. Hydrology Regional Stud. 3, 509–524. doi:10.1016/j.ejrh.2015.01.001
Trasatti, E., Acocella, V., Di Vito, M. A., Del Gaudio, C., Weber, G., Aquino, I., et al. (2019). Magma Degassing as a Source of Long‐Term Seismicity at Volcanoes: The Ischia Island (Italy) Case. Geophys. Res. Lett. 46, 14421–14429. doi:10.1029/2019GL085371
Tsidaev, A. (2016). Parallel Algorithm for Natural Neighbor Interpolation. CEUR Workshop Proc. 1729, 78–83. http://ceur-ws.org/Vol-1729/paper-10.pdf.
Varisco, S., Beretta, G. P., Raffaelli, L., Raimondi, P., and Pedretti, D. (2021). Model-Based Analysis of the Link between Groundwater Table Rising and the Formation of Solute Plumes in a Shallow Stratified Aquifer. Pollutants 1, 66–86. doi:10.3390/pollutants1020007
Vezzoli, L. (1988). “Island of Ischia,” in CNR Quaderni de “La ricerca scientifica”. Editor L. Vezzoli, 122. 114–10.
Vezzoli, L., Principe, C., Malfatti, J., Arrighi, S., Tanguy, J.-C., and Le Goff, M. (2009). Modes and Times of Caldera Resurgence: The. J. Volcanol. Geotherm. Res. 186, 305–319. doi:10.1016/j.jvolgeores.2009.07.008
Vittecoq, B., Reninger, P. A., Violette, S., Martelet, G., Dewandel, B., and Audru, J. C. (2015). Heterogeneity of Hydrodynamic Properties and Groundwater Circulation of a Coastal Andesitic Volcanic Aquifer Controlled by Tectonic Induced Faults and Rock Fracturing - Martinique Island (Lesser Antilles - FWI). J. Hydrology 529, 1041–1059. doi:10.1016/j.jhydrol.2015.09.022
Keywords: groundwater map, hydrothermal system, conceptual model, volcanic island hydrogeology, spatial interpolation, GIS, Ischia Island
Citation: Fabbrocino S, Bellucci Sessa E, de Vita S, Di Vito MA, Avino R and Marotta E (2022) A GIS-Based Hydrogeological Approach to the Assessment of the Groundwater Circulation in the Ischia Volcanic Island (Italy). Front. Earth Sci. 10:883719. doi: 10.3389/feart.2022.883719
Received: 25 February 2022; Accepted: 24 June 2022;
Published: 04 August 2022.
Edited by:
Derek Keir, University of Southampton, United KingdomReviewed by:
Vincenzo Piscopo, University of Tuscia, ItalyIan Bastow, Imperial College London, United Kingdom
Valerio Acocella, Roma Tre University, Italy
Copyright © 2022 Fabbrocino, Bellucci Sessa, de Vita, Di Vito, Avino and Marotta. This is an open-access article distributed under the terms of the Creative Commons Attribution License (CC BY). The use, distribution or reproduction in other forums is permitted, provided the original author(s) and the copyright owner(s) are credited and that the original publication in this journal is cited, in accordance with accepted academic practice. No use, distribution or reproduction is permitted which does not comply with these terms.
*Correspondence: Silvia Fabbrocino, c2lsdmlhLmZhYmJyb2Npbm9AdW5pbmEuaXQ=