 Lihua Chen1,2,3
 Yanjun Che
 Shijin Wang
- 1Department of Physical Geography and Resources and Environment, School of Geography and Environment, Jiangxi Normal University, Nanchang, China
- 2Department of Geography Science, Yichun University, Yichun, China
- 3State Key Laboratory of Cryospheric Science/National Field Science Observation and Research Station of Yulong Snow Mountain Cryosphere and Sustainable Development (or Yulong Snow Mountain Station), Northwest Institute of Eco-Environment and Resources, Chinese Academy of Sciences, Lanzhou, China
- 4Key Laboratory of Resource Environment and Sustainable Development of Oasis, Lanzhou, China
- 5Key Laboratory of Poyang Lake Wetland and Watershed Research (Jiangxi Normal University), Ministry of Education, Nanchang, China
Glacier mass balance is a key idea in understanding the relationship between glaciers and climate. In this study, Landsat images, Shuttle Radar Topography Mission, and Advance Land Operation Satellite digital elevation models, and ground observation records for 2000–2010 and 2019–2020 were used to analyze a mass balance of the Baishui River Glacier No. 1 (BRG1) in Yulong Snow Mountain, southeastern Qinghai–Tibet Plateau. Both glaciological and geodetic methods were used to understand the spatial pattern of the mass balance. A mass balance contour line map of the glacier was created for the first time. From 2000 to 2010, the mean annual mass balance of the BRG1 was calculated to be -0.99 m w.e., -1.01 m w.e., and −1.18 m w.e. using the contour line, profile curve, and geodetic methods, respectively. In addition, the analysis revealed that strong melting of the glacier occurred from July 27 to 15 September 2019, with an averaged glacier mass balance of -1.75 m w.e. and a mean daily melting rate of 35 mm w.e. The annual mass balance was assessed to be −1.31 m w.e. during 2019/20 using the contour line method. In addition, the spatial patterns on the mass balance contour maps for 2000–2010 and the summer of 2019, and the climate change in this region were analyzed. The results indicate that the increased air temperature was the main cause of the accelerated glacial melting.
1 Introduction
Glaciers located in the high mountains of Asia serve as indispensable water reservoirs and are widely referred to as the “Asian Water Tower” (Immerzeel et al., 2010; Kaser et al., 2010; Muhammad and Tian, 2020). The local meteorological conditions and terrain control glaciers act as natural indicators of climate change due to their sensitivity to climate fluctuations, and thus, they can provide important feedback and data (Shi, 1990; Ding and Qing, 2009; Mortezapour et al., 2020). The Sixth Assessment Report of the International Panel on Climate Change documented a consistent overall shrinking trend of mountain glaciers and a significant increase in the rate of glacial mass loss over time (Zhong et al., 2021). Although mountain glaciers account for only a small proportion of all glaciers, they make a significant contribution to the sea level rise. For example, one recent study reported that the mass loss from mountain glaciers has contributed 25%–30% to the total sea level rise in recent decades (Zemp et al., 2019). Knowing the mass balance of a glacier is an important factor in understanding the relationship between climate and glaciers because of its direct and immediate response to changes in atmospheric conditions (Zemp et al., 2009).
The Hengduan Mountain region, located on the southeastern edge of the Qinghai–Tibet Plateau (QTP), is affected by the Indian and East Asian monsoon systems (Yao et al., 2012). Many of the modern glaciers in this region are well developed and have recently exhibited a significant trend of retreat (Liu et al., 2015; Che et al., 2017; Wang et al., 2021). In particular, the mass of the glaciers on Yulong Snow Mountain (YSM) decreased by 64.02% from 1957 to 2017. These glaciers are located in the southernmost glaciated region of the Hengduan Mountains and are part of the QTP (Wang et al., 2020b). Based on the observational records for the Baishui River Glacier No. 1 (BRG1), the terminus elevation of the glacier retreated from 4,100 to 4,300 m a.s.l. during 1982–2006 (Pang et al., 2017). Then, the glacier continuously retreated to 4,395 m a.s.l. by 2017 (Wang et al., 2020b). The summer ablation rate at 4,600 m a.s.l. increased from 6.47 cm/d in 1982 to 9.2 cm/d in 2009 (Du et al., 2013). In addition, the annual mass balance ranged from −1.94 m w.e. to 2.26 m w.e. during the period of 1952–2017, and the cumulative mass balance of the BRG1 was −27.45 m w.e. (Du et al., 2013; Wang et al., 2020b). These results were mainly assessed from the ground observation records and a degree-day model. Based on repeated photogrammetry collected using unmanned aerial vehicles, the mean daily velocity of the surface of the BRG1 was 0.14 m/d ± 0.05 m/d during the summer in 2018, with a mean mass balance of −5.92 m w.e. ± 3.33 m w.e. in the glacier ablation area (Che et al., 2020). However, the traditional method used to calculate the mass balance of glaciers still includes field glaciology methods that use mass balance stakes and snow pits on the glacier surface (Zemp et al., 2013). In addition, the geodetic method has also been recommended for use in calibrating the mass balance every few years. Although the mass balance of the BRG1 has been calculated using the traditional glaciology and degree-day methods, the mechanism involved in the spatial pattern of the melting of the glacier remains unclear. For example, a contour map of the glacier mass balance has not yet been published, and our understanding of the spatial pattern of the glacier mass balance is limited.
This study aimed to provide a unified pattern of the glacier mass balance for the BRG1. The geodetic method was used to reveal the spatial pattern of the glacier mass balance using two digital elevation model (DEM) datasets and Landsat images acquired during different periods. A method involving creating profile curves of the glacier mass balance was developed and applied to this glacier. In addition, the glaciological mass balance was also calculated using an on-site dataset for the glacier surface mass balance. By comparing these three methods, a mass balance calculation plan for the glaciers with different observation conditions was developed.
2 Study Area
Yulong Snow Mountain (27°10′–27°40′N, 100°9′−100°20′E), located on the southeastern edge of the QTP (Figure 1), is the glaciated area located closest to the equator in a temperate area of the Eurasian continent. The climate of this region is controlled by both the Indian and Southeast Asian monsoons. Under global warming, the air temperature in this region increased significantly by 0.19°C/decade during 1951–2017, with a mean annual air temperature of 13.33°C over the past 2 decades (Wang et al., 2020b). The mean annual precipitation was 950 mm during the period with no significant change trend. There are 13 glaciers in this region, with a total area of 4.48 km2. The BRG1 is the largest of these glaciers, with a length of 1.90 km and a total area of 1.32 km2 (Wang et al., 2020b). The elevation of the glacier ranges from 4,395 m a.s.l. to 5,361 m a.s.l. In addition, monitoring work in this area has been very difficult due to the strong melting, large surface velocity, and wide crevasses in the glacier.
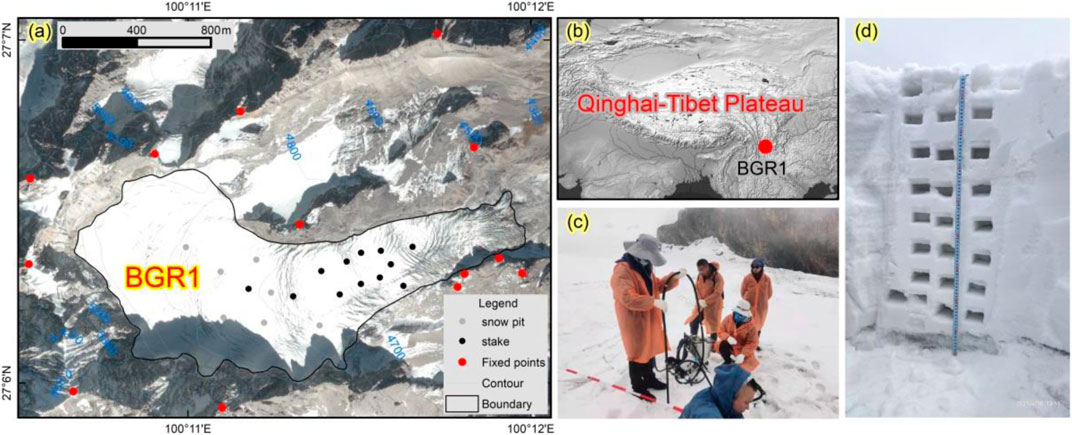
FIGURE 1. Location of the study area and the distribution of the stakes and snow pits on the Baishui River Glacier No. 1 (BRG1). (A) Aerial photo of the observation network on the Baishui River Glacier No. 1; (B) map showing the location of the study area on the Qinghai–Tibet Plateau; (C) observers inserting a mass–balance stake into the glacier surface; and (D) photo of a snow pit on the glacier surface.
3 Datasets and Methods
3.1 Remote Sensing Images and Ground Observations
Serial Landsat images were used, including Landsat 5 Thematic Mapper (TM) images acquired in 2000, Landsat 7 Enhanced Thematic Mapper (ETM+) images acquired in 2008, and Landsat 8 Operational Land Imager (OLI) images acquired in 2019, to extract the glacier boundaries (Table 1). Several data gaps occurred in the ETM + images due to failure of the Landsat 7 Scan Line Corrector, which were dealt with using the Scan Line Corrector Gap-Fill Methodology of landsat gapfill.sav (Scaramuzza et al., 2004; Wang et al., 2020b). In addition, a DEM of the glacier surface in 2000 was derived from the Shuttle Radar Topography Mission (SRTM) DEM (https://lta.cr.usgs.gov/SRTM1Arc), which is regarded to provide the basic elevation information of the glacier surface. In this study, an SRTM DEM with a spatial resolution of 30 m was used. The Advanced Land Operation Satellite World 3-D (ALOS 3D) 30 m digital surface model (DSM) of the study area was produced by the Japan Aerospace Exploration Agency (JAXA) using several images from 2005 to 2010 (https://www.eorc.jaxa.jp/ALOS/en/aw3d30/index.htm). The time span of the DSM on YSM was denoted as 2008 to conveniently calculate the mass balance of the glacier. Therefore, the DSM was used as the DEM of the glacier in 2008 due to a lack of obstructions on the glacier. Finally, the SRTM DEM for 2000 and the ALOS DEM for 2008, which had the same spatial resolution of 30 m were used to assess the changes in the elevation of the glacier surface.
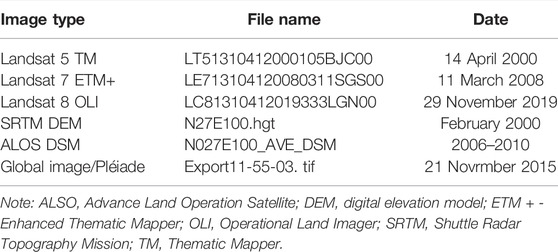
TABLE 1. Image type, file name, and acquisition date of the remote sensing images used in this study.
Mass balance stakes and snow pits have been widely used to measure and record in situ glacier mass balance (Østrem and Brugman, 1991; Zemp et al., 2013). This method usually has enough flexibility to resolve the details of small glaciers and allows researchers to measure short-term glacial variations (Ai et al., 2019). To further understand the melting and accumulation processes involved in the mass balance of the BRG1, we adjusted the observation network of the glacier mass balance in 2019 relying on data from the Yulong Snow Mountain Glacier and the Environment Observation and Research Station. A total of 12 stakes and seven snow pits were set up on the surface of the glacier. The stakes were used to record glacial melting, and snow pits were mainly used to observe the glacier accumulation. In addition, we made observations every 7–10 days in the summer of 2019 to obtain high-frequency glacial melt records.
3.2 Meteorological Observations
Precipitation and air temperature are the primary climatic factors controlling glacier mass balance; therefore, meteorological observations in glacial areas are an important part of studying changes in glaciers (Radić and Hock, 2014). In fact, several meteorological stations have been set up near the BRG1 since 2005 to monitor and record meteorological data, including the Lijiang meteorological station, the records for which began in 1951 (Wang et al., 2020a). The Lijiang meteorological station, near Lijiang city in Yunnan Province, China, was built by the China Meteorological Administration to record the climatic conditions in the Lijiang region. It is located in the southern region of the YSM and is located nearly 26 km from Lijiang city. The dataset was obtained from the China Meteorological Data Service Center (http://data.cma.cn/).
3.3 Glacier Mass Balance
3.3.1 Mass Balance of Observation Position
The monitoring of a glacier field is important and is widely used to obtain glacial mass balance data (Vincent et al., 2017; Vincent et al., 2021). In this study, the point mass balance of the glacier surface was recorded and evaluated using stake and snow pit measurements. The single-point mass balance is the sum of the balance of the snow (or firn) (bf), spur ice (bsp), and ice (bi) (Eqs. 1–4).
where i, sp, and f are the glacier ice, super ice, and snow or firn, respectively; 1 indicates the records of the former observation, and 2 indicates the records of the latter observation. In addition, ρs is the density of snow/firn (g/cm3), ρsp is the density of super ice (0.85 g/cm3), and ρi is the density of glacial ice (0.9 g/cm3).
3.3.2 Mass Balance of a Glacier
Accumulation, c, refers to the solid water collected by glaciers, including snowfall, condensation, and refrozen rainwater, on the glacier surface, as well as any accumulation of blown snow and avalanche snow redistributed by wind and gravity. Ablation, a, refers to the expended portion of the glacial solid water, including runoff from the melting of ice and snow, evaporation (sublimation), the disintegration of ice bodies, wind-blown snow transported off of the glacier, and snow lost due to avalanches. On cold glaciers, part of the meltwater is refrozen in the granular snow layer, on the ice surfaces, and in crevasses. This process is generally referred to as internal recharge, and this part of the meltwater cannot strictly be counted as ablation because it does not leave the glacier. However, since internal recharge is not easy to observe and calculate, all of the melted snow and ice are generally counted as ablation in general mass balance observations, and calculations are conducted using meteorological methods.
Accumulation minus ablation is defined as the mass balance, that is, b in Eq. 5:
1) Contour line method of glaciology
The mass balance contour line method was used to calculate the net mass balance (Østrem and Brugman, 1991). The net mass balance at two adjacent contour lines is defined as the specific net mass balance, and the annual net mass balance value for the entire glacier is calculated using Eq. 6:
where
2) Geodetic method
The geodetic method has traditionally been used to calculate the glacial mass balance (Andreassen et al., 2002; Cogley, 2009; Andreassen et al., 2016). In this study, DEMs from SRTM and JAXA, with spatial resolutions of 30 m, were used in the geodetic mass balance estimation. Because these DEMs were obtained from two different sources using different image acquisition techniques, horizontal or vertical offsets may exist (Kumar et al., 2017). Thus, it was necessary to compare the two phases of the glacial DEMs (Nuth and Kääb, 2011). We used the geodetic method to indirectly calculate the mass balance of the BRG1, in which two of the DEMs of the glacial surface were subtracted to calculate the changes in the volume, which was then converted to the mass balance using a density conversion (Cogley et al., 2011). The change in the total volume
where N is the number of pixels covering the glacier at its maximum extent and r is the pixel size (30 m × 30 m).
The calculated change in the volume can be converted to a geodetic mass balance (m w.e.) using Eq. 8.
where ρ is the average density of 850 ± 60 kg m−3, S is the mean glacier area of the BRG1, and t1 and t2 are the two acquisition dates.
(3) Profile curve method
The principle of the profile curve method is similar to that of the contour line method. Due to objective reasons, sometimes the ground mass balance stakes and snow pits collapse or are missing, so less observation information than is desirable is available. For example, only a few limited points were documented within a certain elevation range. Therefore, the curve pattern of the mass balance can be plotted using only a few observation sites, and then, the mass balance of the corresponding elevation zone can be calculated by combining the results with the glacier area of the elevation zone (Andreassen et al., 2016). That is, the regional mass balance between adjacent contour lines within each elevation interval (50 m or 100 m) was integrated using the profile line method to calculate the total amount of accumulation and ablation for each elevation interval in order to obtain the glacier mass balance. Therefore, in this study, the profile curve method for the mass balance calculation was tested on the BRG1 for the first time.
4 Results
4.1 Comparison of the Spatial Consistency Between the Shuttle Radar Topography Mission and Advance L and Operation Satellite Digital Elevation Models
The SRTM and ALOS DEMs were used to extract the elevation of the ice surface of the BRG1 during two phases in order to analyze the changes in the elevation of the glacier surface in this region. Glaciers tend to be in constant motion due to their own physical properties and gravity, but the bare rock surrounding a glacier remains comparatively unchanged. To ensure a good spatial match between the two phases of the DEMs, 13 fixed points were selected, mainly in the mountainous areas or peaks without glaciers, to validate the consistency of the two phases in the DEM space (Figure 1). As is shown in Figure 2, the elevations of the selected points that did not change position were statistically tested. The results show that r and R2 values were 0.98 and 0.96, respectively, and they passed the significance test (p < 0.0001). We also found that some differences in the fixed points were occurred, which was mainly due to the geographic coordinate system and resampling of the elevation raster. Therefore, the elevations of these selected validation points were consistent. That is, the SRTM and ALOS DEMs can be used to assess the changes in the elevation of the glacier surface due to their good spatial matching.
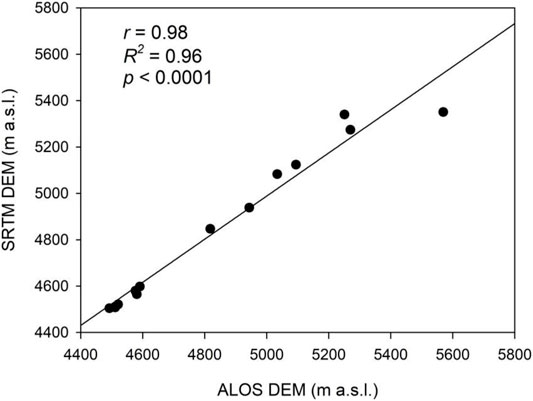
FIGURE 2. Comparison of selected validation points in the Shuttle Radar Topography Mission (SRTM) and Advance Land Operation Satellite (ALOS) digital elevation models (DEMs).
4.2 Surface Mass Balance of Baishui River Glacier No. 1 Using the Glaciology Method During the Periods of 2000–2010 and 2019–2020
To understand the mass balance of the BRG1, the annual mass balance estimates from 2000 to 2010 were obtained (Wang et al., 2020b). As is shown in Figure 3, the glacier mass balance fluctuated and changed during the period of 2000–2010. The average mass balance was -0.63 m w.e., and it exhibited a significant decreasing trend of 0.16 m w.e./a during this period. The mass balance of the BRG1 was initially positive and reached a maximum of 0.92 m w.e. in 2002. The mass balance of the BRG1 was negative from 2003 to 2010, that is, the glacier underwent mass loss after 2002. The largest mass loss occurred in 2003, with a mass balance of -1.77 m w.e.
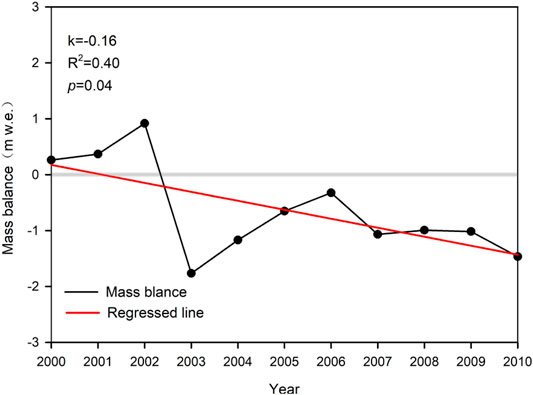
FIGURE 3. Changes in the mass balance of the Baishui River Glacier No. 1 from 2000 to 2010.
To deepen our understanding of the glacial melting and accumulation processes, an enhanced observation network was established on 27 July 2019, and in situ data were recorded weekly until 15 September 2019. During this period, the glacier underwent strong melting and mass loss. The total glacial melting at the observation positions ranged from 1.60 m w.e. to 2.00 m w.e., with an average glacier mass balance of −1.75 m w.e. (Figure 4A). The mean daily glacial melting was at 35 mm w.e., and the strongest glacial melting occurred in August. The mass balance of the entire glacier was −1.41 m w.e. In addition, the annual mass balance of the glacier was also calculated based on the observational records until September 2020. From September 2019 to the beginning of September 2020, the winter mass balance ranged from 1.09 m w.e. to 3.51 m w.e., with an average accumulation of 2.06 m w.e. (Figure 4B). The annual net mass balance at the observation points ranged from −0.88 m w.e. to −3.44 m w.e., with an annual mass balance of −1.95 m w.e. The annual mass balance increased significantly (i.e., decreased melting) with increasing elevation above 4,700 m a.s.l. Finally, using the contour line method, the annual mass balance of the entire glacier was determined to be −1.31 m w.e. in 2019/2020.
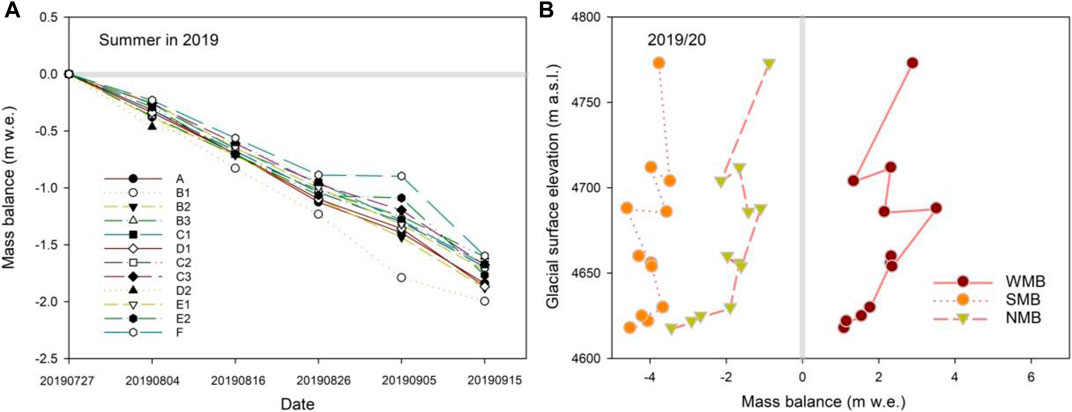
FIGURE 4. Mass balance at observation points on the Baishui River Glacier No. 1 from 2019 to 2020: (A) summer of 2019; and (B) 2019 to 2020.
4.3 Spatial Distribution of Mass Balance During the Period of 2000–2009 and in Summer 2019
The spatial variation in the glacier mass balance can clearly reflect the spatial variation trend of a glacier. To understand the spatial mass balance of the BRG1, the spatial mass balance was calculated using the geodetic method based on the SRTM and ALOS DEMs. A contour line map of the mean annual mass balance was drawn for the 2000–2009 period (Figure 5A). The pattern of the glacier mass balance was not the same as that of other glaciers. In general, the largest glacier accumulation occurred in the firn zone on the upper surface of the glacier at the highest elevation. However, the largest accumulation on the BRG1 occurred on the glacier surface in the central glacier zone, which was significantly affected by hill shadows. The mass balance at the glacier front was less than -3.0 m w.e., indicating very significant mass loss. To further validate and understand the pattern of the glacier mass balance, the contour lines of the glacier mass balance in summer 2019 were also drawn using mass balance records with high-frequency observations (Figure 5B). The spatial characteristics of the contour line map were similar to those of the annual mass balance during the period of 2000–2009. Therefore, we found that the glacier mass balance increased with increasing elevation, while it decreased at elevations of greater than ∼4,800 m a.s.l. Although the spatial patterns of the glacier mass balance were very similar, a significant difference was observed. For example, accumulation did not occur on the glacier surface during the period of 2000–2009, and it was completely absent during the summer of 2019, that is, the glacier mass loss was more significant than before. In addition, the spatial pattern did not remain stable indefinitely, which was predominantly dependent upon the glacier size and surface features, the surrounding terrain, and the local climate.
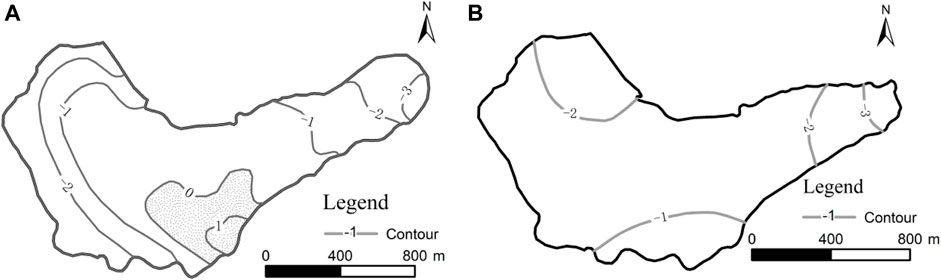
FIGURE 5. Spatial distribution of the contour line for the mass balance of the Baishui River Glacier No. 1 during (A) 2000–2010 and (B) July 27 to 15 September 2019.
4.4 Mass Balance Based on the Profile Curve Method
The mass balance at different elevations on the glacier surface was related to the elevation and exhibited a pattern containing specific elevation zones. To explore the spatial pattern of the mass balance and elevation on the glacier surface, the surface was divided into 11 zones using an elevation interval of 100 m. The extracted glacier area was 1.47 km2 based on Landsat 7 ETM + images acquired in 2008. Then, this area was divided into the corresponding intervals (Figure 6). We found that the glacier area was mainly concentrated in the elevation range of 4,600 m a.s.l. to 5,000 m a.s.l., and the largest glacier area was located at 4,800 m a.s.l. First, the mass balance of the individual grid cells was statistically analyzed. In addition, the mass balance was statistically counted using an interval of 100 m. Next, the average mass balance in each elevation band was calculated. A profile curve of the change in the mass balance with elevation was obtained (Figure 6). In addition, we also found that the pattern of the glacier mass balance was similar to the pattern of the contour line map. The mass balance of the entire glacier was obtained according to the weighted sum of the average mass balance along the profile curve multiplied by the area in each corresponding elevation band. According to the final calculations, the mean annual mass balance of the BRG1 from 2000 to 2010 calculated using the contour method was -0.99 m w.e., and that calculated using the profile curve method was -1.01 m w.e. The mean annual mass balance of the glacier was calculated to be -1.18 m w.e. during the period of 2000–2010 using the geodetic method. The results obtained using the three methods were consistent. In addition, the equilibrium line elevation was ∼4,800 m a.s.l. according to the profile curve of the mass balance of the BRG1 during the period of 2000–2010.
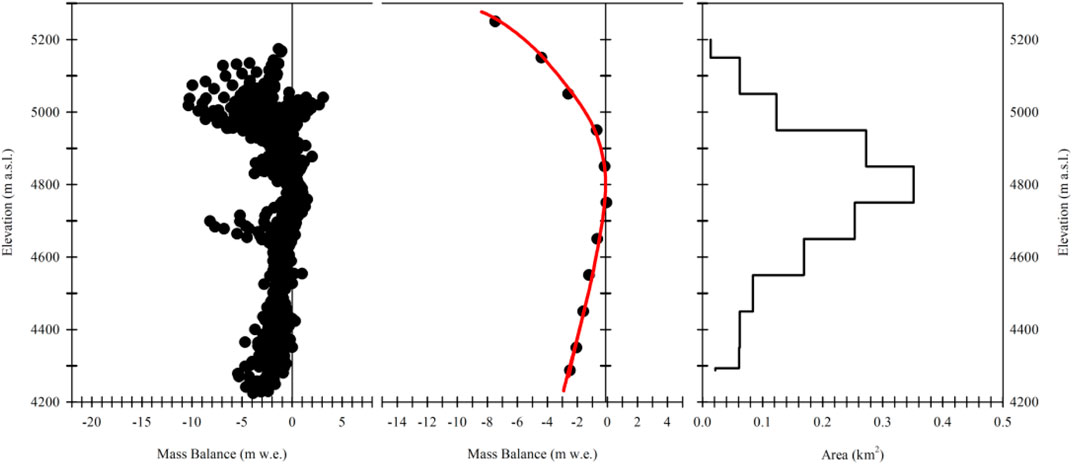
FIGURE 6. Relationships between (A) elevation, (B) mass balance, and (C) area for the Baishui River Glacier No. 1.
5 Discussion
5.1 Changes in Air Temperature and Precipitation on Yulong Snow Mountain
To understand the local climate change on Yulong Snow Mountain, air temperature and precipitation were analyzed using the records from the Lijiang meteorological station. The annual air temperature ranged from 11.8 to 14.2°C during the period of 1951–2019 (Figure 7A). The mean annual air temperature was 12.9°C in the study area. A significant increasing trend (0.20°C/decade, p < 0.0001) occurred during this period. The annual precipitation ranged from 648 to 1,283 mm during the period of 1951–2019, exhibiting strong fluctuations with time (Figure 7B). Although the annual precipitation exhibited an increasing trend of 4 mm/decade, the trend was not significant (p > 0.1). Therefore, the amount of precipitation did not change significantly or fluctuate significantly during the study period, with a mean annual precipitation of 954 mm. An increase in air temperature tends to accelerate glacial melting.
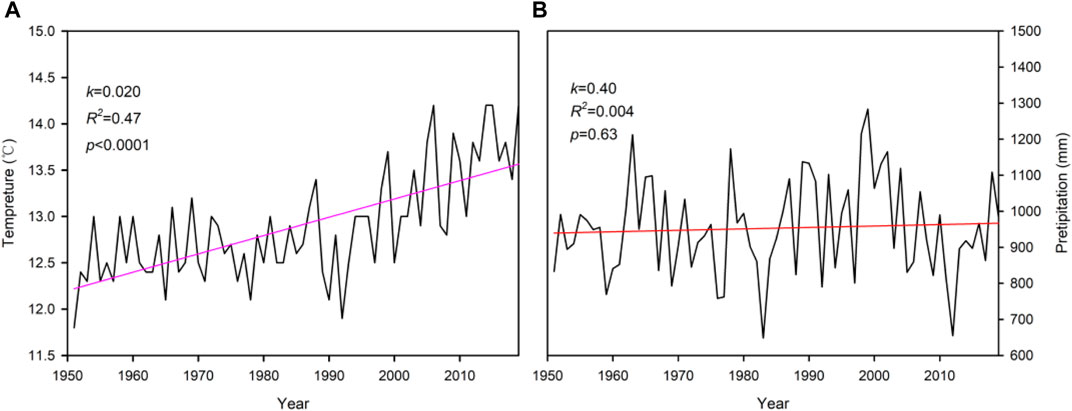
FIGURE 7. Changes in (A) the annual air temperature and (B) the precipitation at Lijiang meteorological station, near Yulong Snow Mountain and Lijiang city, Yunnan, China, from 1951 to 2019.
5.2 Relationship Between Summer Mass Balance and Local Climate Change
The glacial melting was mainly controlled by the local air temperature. Based on the daily records for Lijiang meteorological station from July 27 to 15 September 2019, the change in the daily air temperature at an elevation of 4,800 m a.s.l. was calculated, with a rate of decrease of 0.6°C/100 m. As is shown in Figure 8, the daily air temperature ranged from 0.8 to 7.3°C during the observation period in the summer of 2019, with an average daily air temperature of 4.0°C. Precipitation occurred on 35 of 51 days. Rainy weather also significantly affected the glacial melting process (Figure 8). In particular, glacial melting was very significant on days with a warm air temperature and without precipitation, such as during the period of August 16–26 and September 5–15. However, from August 26 to September 5, precipitation occurred frequently. The daily air temperature was low on rainy days, and the lowest daily air temperature was 0.8°C. In addition, fresh snow was observed during the fieldwork conducted in this specific time period. Accordingly, the glacial melting was relatively weak on rainy days compared with that on other days. In general, the melting of the BRG1 mainly resulted from high air temperatures, but it was also significantly affected by precipitation.
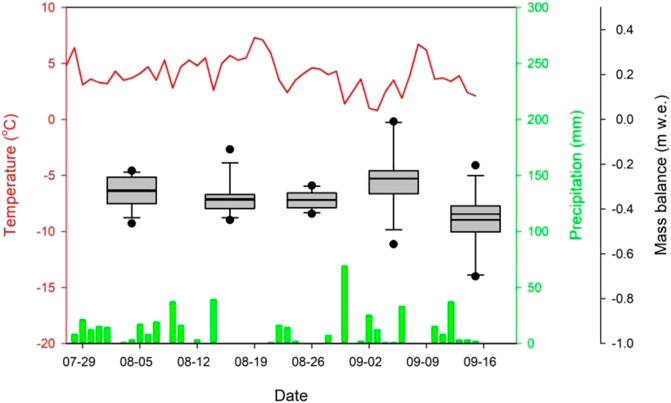
FIGURE 8. Changes in the air temperature, precipitation, and glacier mass balance during the period from July 27 to 15 September 2019. The red line denotes the daily air temperature at an elevation of 4,800 m s.l., the green bars denote the daily precipitation, and the boxes denote the mass balance at the stake points during the periods July 27–August 4, August 4–16, August 16–26, August 26–September 5, and September 5–15, 2019.
5.3 Glacier Mass Balance on the Southeastern Qinghai–Tibet Plateau
Glacial melting varied across the Qinghai–Tibet Plateau based on variations in the local climatic circulation and the terrain conditions. To understand the different impacts of climate change on the behavior of glaciers, several glaciers have been observed since 2000, including Parlung River Glaciers Nos. 04, 10, 12, 94, and 390, as well as the Demula Glacier (Yang et al., 2011; Yang et al., 2013; Zhu et al., 2018; Wang et al., 2021). The average annual mass balances of the Demula Glacier, Parlung River Glacier Nos. 04, 10, 12, and 94, and the BRG1 were -1.02 m w.e. for 2007–2010, -0.37 m w.e. for 2006–2007, -0.78 m w.e. for 2006–2009, -1.70 m w.e. for 2006–2010, -0.92 m w.e. for 2006–2010, and -1.16 m w.e. for 2008–2010 (Figure 9). The average annual mass balance of the BRG1 during the period of 2000–2010 was calculated to be -1.18 m w.e., -0.99 m w.e., and -1.01 m w.e. using the geodetic, profile curves, and contour line methods, respectively. The mean annual mass–balance of the BRG1 was -1.56 m w.e. from 2011 to 2019, and that of Parlung River Glacier No. 94 was -0.95 m w.e. from 2011 to 2018. In addition, the mass balance of the Demula Glacier ranged from -1.67 to 0.17 m w.e. during the period of 2006–2010, that of the Parlung River Glacier No. 94 ranged from -1.93 m w.e. to 0.16 m w.e. during the period of 2006–2018, and that of the BRG1 ranged from -1.87 m w.e. to -0.91 m w.e. during the period of 2008–2019. Thus, the mass balance results for the BRG1 obtained in this study using the different calculation methods are reliable. In addition, the mass balance fluctuations of these glaciers were similar and exhibited an increased melting trend with time.
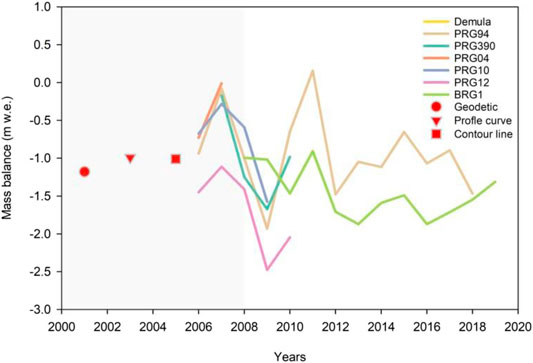
FIGURE 9. Mass balances of glaciers with in situ records on the southeastern Qinghai–Tibet Plateau from 2000 to 2019. In plots, PRG04, 10, 12, 94, and 390 denote Parlung River Glaciers Nos. 04, 10, 12, 94, and 390, respectively. The BRG1 denotes the Baishui River Glacier No. 1.
5.4 Glacier Mass Balance Calculated Using Different Methods
We acknowledge that some differences exist among the results obtained using the contour line, geodetic, and profile curve methods due to their uncertainties (Zemp et al., 2013). The contour line method is a glaciological method, and its uncertainty is mainly derived from the uncertainties of the point measurements, spatial integration, and glacier reference area. The uncertainty of the geodetic method is mainly due to the uncertainties of the digital terrain models (DTMs) and the density conversion used to convert the glacier surface area to the water equivalent. The results obtained using the profile curve method were determined from the profile line of the mass balance with a change in elevation. In general, continued geodetic surveys every 10 years are needed to measure the overall changes and provide data for calibrating the glaciological mass balance (Zemp et al., 2013; Andreassen et al., 2016). For example, Oerlemans (2013) estimated an even higher dissipative melting rate of −0.23 m w.e. per year in Nigardsbreen, which indicated that the accumulative mass balance was very sensitive to systematic biases and generic differences between the geodetic and glaciological methods. Andreassen et al. (2016) discussed the differences and uncertainties of the geodetic and glaciological methods, and they reanalyzed and calibrated 10 glaciers with long-term mass balance series using the profile method. The glaciological method measures the glacier surface mass balance, while the geodetic method measures the glacier surface, internal, and basal mass balances. In addition, relatively small mountain glaciers with negative cumulative balances are easier to measure correctly than maritime glaciers (Andreassen et al., 2016). The accumulation and ablation patterns are needed for use in the statistical analysis to reduce the amount of field work, expenses, and personnel required (Rasmussen and Andreassen, 2005). The profile curves provided some important information about the mass changes related to ignoring the areas of the glacier surface for which no observation data were available, for example, ice falls, crevasses, and unusual phenomena in the firn/accumulation zone. The combination of the profile curve and geodetic methods provides more accurate results and can be used to calculate the mass balances of maritime glaciers (Andreassen et al., 2015; Andreassen et al., 2016). These methods can also be used to calculate the mass balance of the BRG1 in the future.
6 Conclusion
Relatively small glaciers are easier to measure, and their mass balances are easier to calculate than those of large glaciers, in particular for maritime glaciers. In this study, the mass balance of the BRG1 was assessed during the periods 2000–2010 and 2019–2020 using the contour line, geodetic, and profile curve methods. From 2000 to 2010, the mean annual mass balance of the BRG1 was calculated to be -0.99 m w.e., -1.01 m w.e., and -1.18 m w.e. using the contour line, profile curve, and geodetic methods, respectively. Although these results are very similar, the errors among the three methods cannot be eliminated due to the systematic biases and generic differences in the different methods. To further understand and validate the spatial pattern of the mass balance of the BRG1, the field observation work was enhanced in the summer of 2019. The glacier underwent a period of strong melting from July 27 to 15 September 2019, and its mass balance ranged from -2.00 m w.e. to -1.60 m w.e. Its average glacier mass balance was -1.75 m w.e., with a mean daily melting rate of 35 mm w.e. during this period. The annual mass balance was calculated to be -1.31 m w.e. during 2019/20 using the contour line method. In addition, we also found that the central zone of the glacier was significantly affected by terrain shading, and a low glacier mass loss value was observed in this zone. In addition, a significant increase in air temperature (0.20°C/decade) was observed but no significant change trend in the annual precipitation occurred. The mass loss of the BRG1 was mainly due to the increase in air temperature Table 1.
Data Availability Statement
The original contributions presented in the study are included in the article/Supplementary Material, further inquiries can be directed to the corresponding author.
Author Contributions
YC, SW, and YC: conceptualization, methodology, writing-original draft, and supervision. LC: writing—original draft, data curation, methodology, and visualization. XM: validation and investigation.
Funding
This research was supported by the National Natural Science Foundation of China (grant no. 42101135), the Jiangxi Provincial Natural Science Foundation (Grant No. 20202BAB213013), an Environmental Monitoring project Supported by the Key Laboratory of Resources, Environment, and Sustainable Development of Oases, Gansu Province (grant no. GORS202103), and the Open Fund of the Key Laboratory of Poyang Lake Wetland and Watershed Research (Jiangxi Normal University), Ministry of Education (grant no. PK2020002).
Conflict of Interest
The authors declare that the research was conducted in the absence of any commercial or financial relationships that could be construed as a potential conflict of interest.
Publisher’s Note
All claims expressed in this article are solely those of the authors and do not necessarily represent those of their affiliated organizations, or those of the publisher, the editors, and the reviewers. Any product that may be evaluated in this article, or claim that may be made by its manufacturer, is not guaranteed or endorsed by the publisher.
Acknowledgments
We thank all the staff of the National Field Science Observation and Research Station of Yulong Snow Mountain Cryosphere and Sustainable Development (or Yulong snow mountain station) for their help in field observations. We thank two reviewers and editors for their comments, which helped improve our paper significantly. We acknowledge LetPub (www.letpub.com) for its linguistic assistance during the preparation of this manuscript.
References
Ai, S., Wang, S., Li, Y., Moholdt, G., Zhou, C., Liu, L., et al. (2019). High-precision Ice-Flow Velocities from Ground Observations on Dalk Glacier, Antarctica. Polar Sci. 19, 13–23. doi:10.1016/j.polar.2018.09.003
Andreassen, L. M., Elvehøy, H., Kjøllmoen, B., and Engeset, R. V. (2016). Reanalysis of Long-Term Series of Glaciological and Geodetic Mass–balance for 10 Norwegian Glaciers. The Cryosphere 10, 535–552. doi:10.5194/tc-10-535-2016
Andreassen, L. M., Elvehøy, H., and Kjøllmoen, B. (2002). Using Aerial Photography to Study Glacier Changes in Norway. Ann. Glaciol., 34, 343–348. doi:10.3189/172756402781817626
Andreassen, L. M., Huss, M., Melvold, K., Elvehøy, H., and andWinsvold, S. (2015). Ice Thickness Measurements and Volume Estimates for Glaciers in Norway. J. Glaciology 61, 1160–1170. doi:10.3189/2015jog14j161
Che, Y., Wang, S., Yi, S., Wei, Y., and Cai, Y. (2020). Summer Mass–balance and Surface Velocity Derived by Unmanned Aerial Vehicle on Debris-Covered Region of Baishui River Glacier No. 1, Yulong Snow Mountain. Remote Sensing 12, 3280. doi:10.3390/rs12203280
Che, Y., Zhang, M., Li, Z., Li, H., Wang, S., Sun, M., et al. (2017). Glacier Mass-Balance and Length Variation Observed in China during the Periods 1959-2015 and 1930-2014. Quat. Int. 454, 68–84. doi:10.1016/j.quaint.2017.07.003
Cogley, J., Hock, R., Rasmussen, L., Arendt, A., Bauder, A., Braithwaite, R., et al. (2011). Glossary of Glacier Mass–balance and Related Terms, IHP-VII Technical Documents in Hydrology No. 86, IACS Contribution No. 2. Paris: International Hydrological ProgramUNESCO.
Ding, Y., and Qing, D. (2009). Cryosphere Change and Global Warming: Impacts and Challenges for China. China Basic Sci. 11, 4–10. doi:10.1016/j.scitotenv.2020.142774
Du, J., He, Y., Li, S., Wang, S., Niu, H., Xin, H., et al. (2013). Mass–balance and Near-Surface Ice Temperature Structure of Baishui Glacier No.1 in Mt. Yulong. J. Geogr. Sci. 23, 668–678. doi:10.1007/s11442-013-1036-4
Graham Cogley, J. (2009). Geodetic and Direct Mass-Balance Measurements: Comparison and Joint Analysis. Ann. Glaciol. 50, 96–100. doi:10.3189/172756409787769744
Immerzeel, W. W., Van Beek, L. P. H., and Bierkens, M. F. P. (2010). Climate Change Will Affect the Asian Water Towers. Science 328, 1382–1385. doi:10.1126/science.1183188
Kaser, G., Großhauser, M., and Marzeion, B. (2010). Contribution Potential of Glaciers to Water Availability in Different Climate Regimes. Proc. Natl. Acad. Sci. U.S.A. 107, 20223–20227. doi:10.1073/pnas.1008162107
Liu, S., Yao, X., Guo, W., Xu, J., Shuangguan, D., Wei, J., et al. (2015). The Contemporary Glaciers in China Based on the Second Chinese Glacier Inventory. Acta Geographica Sinica 70, 3–16. doi:10.11821/dlxb201501001
Mortezapour, M., Menounos, B., Jackson, P. L., Erler, A. R., and Pelto, B. M. (2020). The Role of Meteorological Forcing and Snow Model Complexity in winter Glacier Mass–balance Estimation, Columbia River basin, Canada. Hydrological Process. 34, 5085–5103. doi:10.1002/hyp.13929
Muhammad, S., and Tian, L. (2020). Mass–balance and a Glacier Surge of Guliya Ice Cap in the Western Kunlun Shan between 2005 and 2015. Remote Sensing Environ. 244, 111832. doi:10.1016/j.rse.2020.111832
Nuth, C., and Kääb, A. (2011). Co-registration and Bias Corrections of Satellite Elevation Data Sets for Quantifying Glacier Thickness Change. The Cryosphere 5, 271–290. doi:10.5194/tc-5-271-2011
Østrem, G., and Brugman, M. (1991). Mass–balance Measurement Techniques. A Manual for Field and Office Work. Saskatoon: Environment Canada.
Oerlemans, J. (2013). A Note on the Water Budget of Temperate Glaciers. Cryosphere Discuss. 7, 2679–2702. doi:10.5194/tc-7-1557-2013
Pang, H., He, Y., and Zhang, N. (2017). Accelerating Glacier Retreat on Yulong Mountain, Tibetan Plateau, since the Late 1990s. J. Glaciol. 53, 317–319. doi:10.3189/172756507782202900
Radić, V., and Hock, R. (2014). Glaciers in the Earth’s Hydrological Cycle: Assessments of Glacier Mass and Runoff Changes on Global and Regional Scales. Surv. Geophys. 35, 813–837. doi:10.1007/s10712-013-9262-y
Rasmussen, L. A., and Andreassen, L. M. (2005). Seasonal Mass-Balance Gradients in Norway. J. Glaciol. 51, 601–606. doi:10.3189/172756505781828990
Scaramuzza, P., Micijevic, E., and andChander, G. (2004). SLC gap-filled Products Phase One Methodology. Landsat Tech. Notes.
Shi, Y. (1990). Glaciger Recession and lake Shrinkage Indicating the Climatic Warming and Drying Trend in central Asia. J. Geographical Sci. 45, 1–13. doi:10.11821/xb199001001
Vinay Kumar, G., Kulkarni, A. V., Gupta, A. K., and Sharma, P. (2017). Mass–balance Estimation Using Geodetic Method for Glaciers in Baspa basin, Western Himalaya. Curr. Sci. 113, 486–492. doi:10.18520/cs/v113/i03/486-492
Vincent, C., Cusicanqui, D., Jourdain, B., Laarman, O., Six, D., Gilbert, A., et al. (2021). Geodetic point Surface Mass–balances: a New Approach to Determine point Surface Mass–balances on Glaciers from Remote Sensing Measurements. The Cryosphere 15, 1259–1276. doi:10.5194/tc-15-1259-2021
Vincent, C., Fischer, A., Mayer, C., Bauder, A., Galos, S. P., Funk, M., et al. (2017). Common Climatic Signal from Glaciers in the European Alps over the Last 50 Years. Geophys. Res. Lett. 44, 1376–1383. doi:10.1002/2016gl072094
Wang, S., Che, Y., and andWei, Y. (2021). Spatiotemporal Dynamic Characteristics of Typical Temperate Glaciers in China. Scientific Rep. 11, 657. doi:10.1038/s41598-020-80418-7
Wang, S., Che, Y., Pang, H., Du, J., and andZhang, Z. (2020a). Accelerated Changes of Glaciers in the Yulong Snow Mountain, Southeast Qinghai-Tibetan Plateau. Reg. Environ. Change 20, 38. doi:10.1007/s10113-020-01624-7
Wang, S., Che, Y., Pang, H., Du, J., and Zhang, Z. (2020b). Accelerated Changes of Glaciers in the Yulong Snow Mountain, Southeast Qinghai-Tibetan Plateau. Reg. Environ. Change 20, 38. doi:10.1007/s10113-020-01624-7
Yang, W., Guo, X., Yao, T., Yang, K., Zhao, L., Li, S., et al. (2011). Summertime Surface Energy Budget and Ablation Modeling in the Ablation Zone of a Maritime Tibetan Glacier. J. Geophys. Res. Atmospheres 116, na. doi:10.1029/2010jd015183
Yang, W., Yao, T., Guo, X., Zhu, M., Li, S., and Kattel, D. B. (2013). Mass–balance of a Maritime Glacier on the Southeast Tibetan Plateau and its Climatic Sensitivity. J. Geophys. Res. Atmos. 118, 9579–9594. doi:10.1002/jgrd.50760
Yao, T., Thompson, L., Yang, W., Yu, W., Gao, Y., Guo, X., et al. (2012). Different Glacier Status with Atmospheric Circulations in Tibetan Plateau and Surroundings. Nat. Clim Change 2, 663–667. doi:10.1038/nclimate1580
Zemp, M., Hoelzle, M., and Haeberli, W. (2009). Six Decades of Glacier Mass-Balance Observations: a Review of the Worldwide Monitoring Network. Ann. Glaciol. 50, 101–111. doi:10.3189/172756409787769591
Zemp, M., Huss, M., Thibert, E., Eckert, N., Mcnabb, R., Huber, J., et al. (2019). Global Glacier Mass Changes and Their Contributions to Sea-Level Rise from 1961 to 2016. Nature 568, 382–386. doi:10.1038/s41586-019-1071-0
Zemp, M., Thibert, E., Huss, M., Stumm, D., Rolstad Denby, C., Nuth, C., et al. (2013). Reanalysing Glacier Mass–balance Measurement Series. The Cryosphere 7, 1227–1245. doi:10.5194/tc-7-1227-2013
Zhong, X., Kang, S., Guo, W., Wu, X., and andChen, J. (2021). The Rapidly Shrinking Cryopshere in the Past Decade:an Interpretation of Cryospheric Changes from IPCC WGI Sixth Assessment Report. J. Glaciology Geocryology 43 (6), 1–8. doi:10.7522/j.issn.1000-0240.2021.xxxx
Keywords: mass balance, geodetic method, profile curve method, Yulong Snow Mountain, Qianghai–Tibet plateau
Citation: Chen L, Che Y, Cao Y, Wang S and Ma X (2022) Glacier Mass Balance Based on Two Digital Elevation Models and Ground Observation Records for the Baishui River Glacier No. 1 in Yulong Snow Mountain, Southeastern Qinghai–Tibet Plateau. Front. Earth Sci. 10:883673. doi: 10.3389/feart.2022.883673
Received: 25 February 2022; Accepted: 11 April 2022;
Published: 26 May 2022.
Edited by:
Minghu Ding, Chinese Academy of Meteorological Sciences, ChinaReviewed by:
Zhou Jianmin, Aerospace Information Research Institute (CAS), ChinaMeiping Sun, Northwest Normal University, China
Copyright © 2022 Chen, Che, Cao, Wang and Ma. This is an open-access article distributed under the terms of the Creative Commons Attribution License (CC BY). The use, distribution or reproduction in other forums is permitted, provided the original author(s) and the copyright owner(s) are credited and that the original publication in this journal is cited, in accordance with accepted academic practice. No use, distribution or reproduction is permitted which does not comply with these terms.
*Correspondence: Yanjun Che, Y2hlX3lhbmp1bkAxMjYuY29t; Shijin Wang, eGlhb2hhbmppbkAxMjYuY29t