 David A. Bonneau
 D. Jean Hutchinson1
 Scott McDougall
- 1Department of Geological Sciences and Geological Engineering, Queen’s University, Kingston, ON, Canada
- 2Department of Earth Ocean and Atmospheric Sciences, University of British Columbia, Vancouver, BC, Canada
- 3Canadian National Railway, Kamloops, BC, Canada
Debris-flows present a natural hazard to the safe operation of linear infrastructure in mountainous environments. The most significant contributor to debris-flow occurrence is a supply of readily erodible material, often created by rockfalls and other shallow landslides. The spatial distribution and total volume of storage are also critical factors, controlling the initiation location, predominant flow type, and termination location of debris-flow surges. Therefore, there is a need to be able to systematically incorporate debris recharge processes and timeframes into the monitoring and characterization of debris-flow hazards. In this work, the authors present the results of 7 years of terrestrial laser scanning (TLS) captured at the White Canyon. The White Canyon represents an analog to large scale, steep catchments to investigate the role of sediment supply on debris-flow processes. The TLS dataset was collected at monthly to quarterly intervals, providing a basis for analysis of debris transfer processes occurring on the study slope. A rockfall database of over 72,000 events was generated from 52 change detection analyses and is linked to catchment recharge and transfer processes. The results indicate that the 17 channels analyzed in the White Canyon do not directly match the conceptual models proposed from the supply theory. The channels display a variety of behaviors when exposed to the same climate signature. The temporal data acquisition rate was found to have a significant influence on the dynamics of movement that can be interpreted from TLS change detection analysis. The work highlights the need for higher frequency monitoring and the integration of climate data into the analysis, in order to better understand these dynamic processes.
1 Introduction
In mountainous environments around the world, the transfer of debris from catchments by hydrogeomorphic processes is a common occurrence. These gravity-driven transport processes, which range from the movement of individual clasts to debris floods to debris avalanches, have an impact on landscape evolution and present a natural hazard to human settlements, industrial facilities, and linear infrastructure. Of particular concern are debris-flows, which are defined as a rapid movement of a saturated, poorly sorted mixture of clastic and organic materials in a steep channel (Hungr et al., 2014). Due to the combination of high flow velocities, large impact forces, long runout distances, and poor temporal predictability, debris-flows are among the most destructive and dangerous natural hazards (Jakob and Hungr, 2005).
Jakob et al. (2016) noted that the most significant contributor to debris-flow occurrence is a supply of readily erodible material, often created by rockfalls and landslides. As a result, research has focused on investigating debris-flow systems and occurrence based on sediment supply (Benda and Dunne 1997; Bovis and Jakob, 1999; Jakob et al., 2005). In general, debris-flow catchments can be classified as either transport-limited (also named supply-unlimited) or weathering-limited (also named supply-limited). Jakob (1996) and Bovis and Jakob (1999) proposed these terms for debris-flow catchments, according to the conditions of sediment recharge. In transport-limited catchments, there is always enough sediment available for a debris-flow to occur, and the limiting factor for debris-flow occurrence is the rainfall. In supply-limited catchments, a lower sediment recharge rate prevails, and it takes a long time for the channel to replenish after a debris-flow event. In this situation, the limiting factor for debris-flow occurrence is sediment or debris availability (Bierman and Montgomery, 2013). Furthermore, the rainfall threshold for debris-flow initiation may depend on the volume of sediment available at a given time (Brayshaw and Hassan, 2009).
Recent work by Imaizumi et al. (2019) demonstrated that the spatial distribution and total volume of storage are critical factors, controlling the initiation location, predominant flow type, and termination location of debris-flow surges. Previous work also further supports the idea that the initiation point can vary between events and can be affected by the spatiotemporal accumulation and distribution of debris (Coe et al., 2008; Berger et al., 2011a). Therefore, the accumulation of debris and its characteristics are likely important factors in the ability to understand the timing and initiation location of debris-flows and surges. Iverson and George (2019) suggested that numerical model simulations should simulate debris flows from static start to finish, producing meaningful results. Therefore, the ability to monitor and document the processes occurring in channel headwaters is critical components to better understand the hazards and simulate them in numerical models.
Despite the importance of understanding these factors, there is difficulty in monitoring debris transfer and production processes in their initiation zone (Berti et al., 1999; Kean et al., 2013). In many situations, the channel headwaters can often be hundreds of meters to kilometers away from a section of infrastructure or area of interest. Furthermore, in some circumstances, slope geometry and vegetation can obstruct views and make it difficult to monitor these areas of the channel, independent of the monitoring vantage point. In addition, steep topography and rockfall hazards present challenges to the ability to safely traverse channels for field inspections. Therefore, the investigation of initiation mechanisms and other debris transfer dynamics is challenging.
High-resolution remote sensing technologies have been applied to the investigation of the transport of debris in steep channels and processes occurring on alluvial fans. Multi-temporal laser scanning datasets have been used to investigate changes in channel topography after debris-flows (Scheidl et al., 2008; Oppikofer, 2009; Berger et al., 2011b; Blasone et al., 2014; Imaizumi et al., 2017, 2019; Morino et al., 2018). In almost all studies using remote sensing, the methodology of performing change detection has been primarily restricted to digital elevation model (DEM) of difference (DoD).
DoDs are restricted to quantifying change in a single vector direction and can be sensitive to cell size, as opposed to methods like the point cloud-based M3C2 distance computation method (Lague et al., 2013). Schürch et al. (2011) addressed issues arising from DEM generation on the complex surface geometry with abrupt changes in slope, aspect, local surface roughness, and high local relief. They presented a method to quantify volumetric uncertainty in change detection specific to data from terrestrial laser scanning (TLS) in a 300 m reach of the Illgraben channel in Switzerland. In the Manival catchment in France, Loye et al. (2016) used a multi-temporal TLS dataset to investigate the sediment budgets through DoDs between debris flows. Similarly, Theule et al. (2012, 2015) used TLS and morphological TLS-DEM-derived metrics to identify sources of debris in the channel that could lead to future debris-flow events. In Iceland, Morino et al. (2018) used a series of aerial laser scanning surveys and orthophotography to investigate debris-flow initiation in four channels near Ísafjörður in the Westfjords. They attempted to distinguish between fire-hose (Johnson and Rodine, 1984; Coe et al., 2008) and slope failure (Pierson, 1980) initiation mechanisms for the channels analyzed. The fire-hose initiation mechanism occurs when overland flow is concentrated in channels and transitions to a debris-flow as it propagates downslope, gathering loose debris in the channel. A limitation of Morino et al.’s (2018) work is the fact that they did not know the number of events that had occurred between the two data collection periods taken 5 years apart. They noted that when there is no monitoring system or witnesses present, deciphering the number of debris-flow events is a major challenge.
Photogrammetric data have also been used to assess topographic changes from debris-flow processes using pre- and post-event imagery (Coe et al., 1997; Crosta and Frattini, 2004; Berger et al., 2011b). Recently, Cucchiaro et al. (2018) used photographs from an uncrewed aerial vehicle (UAV) to generate Structure-from-Motion (SfM) photogrammetry models to assess changes in an area upslope of a check dam in the Moscardo catchment in the Eastern Italian Alps.
Each of these approaches captures new datasets to analyze debris-flow processes. In most cases, however, studies of debris-flows only make use of datasets spanning a few years and few data collections (i.e., 2–4 datasets). A major exception is the work by Imaizumi et al. (2019). They have monitored the Ohya landslide catchment area since 1998 and have collected a multi-year (7+) aerial laser scanning (ALS) dataset (Imaizumi et al., 2016) to investigate debris-flow dynamics. There are no other field sites around the world that have a similar data collection record, especially for active debris-flow sites, where movement can be expected every year.
In this work, the authors present terrestrial laser scanning (TLS) data that have been collected in the White Canyon, British Columbia (BC), Canada. The White Canyon (WC) represents an analog to large-scale, steep catchments to investigate the role of sediment supply on debris-flow processes. The access for TLS scanning, across the Thompson River, provides a unique opportunity to investigate the activities in debris-flow channel headwaters, which are typically difficult to monitor. The TLS dataset spans almost a 7-year study period, collected at monthly to quarterly intervals, providing data for analysis of debris transfer processes occurring on the slope. Rockfall activity has been linked to in-channel stored sediment volumes to characterize the channel recharge processes on this active slope. The overall goal of this work is to gain a better understanding of debris channel recharge processes, in order to advance the practices of natural slope mitigation planning and ongoing control and to protect the safety of the workers and integrity of infrastructure located near the toe of the slope.
2 Study Site—the White Canyon
The steep slopes of the WC (50.266261°N, -121.538943°W), located 5 km northeast of Lytton, BC, near the confluence of the Thompson and Fraser Rivers, present geohazards to the safe operation of the Canadian National (CN) Railway mainline (Figures 1–3). Rockfalls and rockslides contribute to the production of debris, which accumulates in the steep channels. Dry granular flows and debris-flows facilitate the transport of debris downslope, which can result in consequences that range from minimal maintenance and repair of warning systems, to complete closure and rebuilding of the impacted rail lines. The consequence of repairs, maintenance, and construction along single-track railway lines is compounded by the fact that during any such activity, the flow of traffic is impeded or stopped. The disruption of rail traffic can have repercussions on the network fluidity for the rail operators. Depending on the duration of the disruption on this busy corridor, the impact may affect national and international supply chains.
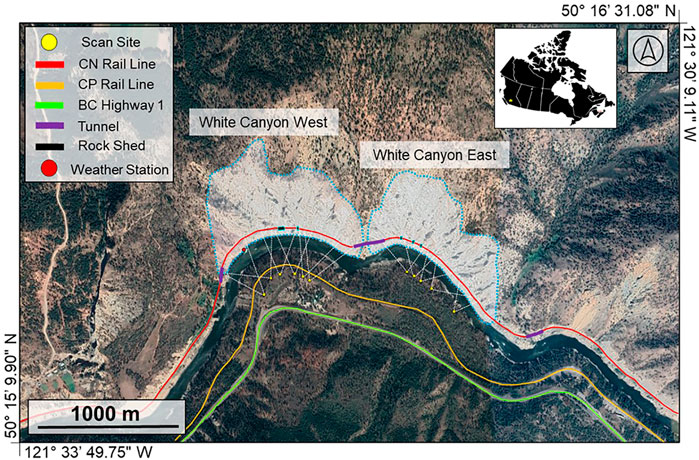
FIGURE 1. Location of the study slope and TLS scanning positions. The scan extents and area are displayed in the light blue color for each site. The weather station corresponds to the White Canyon weather station.
Differential erosion of the WC has formed a morphology that is highly geometrically complex and consists of vertical spires and deeply incised channels (Figures 2, 3). The WC spans approximately 2.2 km between Mile 093.1 and 094.6 of the CN Ashcroft subdivision. The active portion of the Canyon reaches up to 500 m above the railway track. Two short tunnels mark the entrances to the Canyon. A third short tunnel is located in the middle of the Canyon, which separates White Canyon East (WCE; Figure 2) and White Canyon West (WCW; Figure 3).
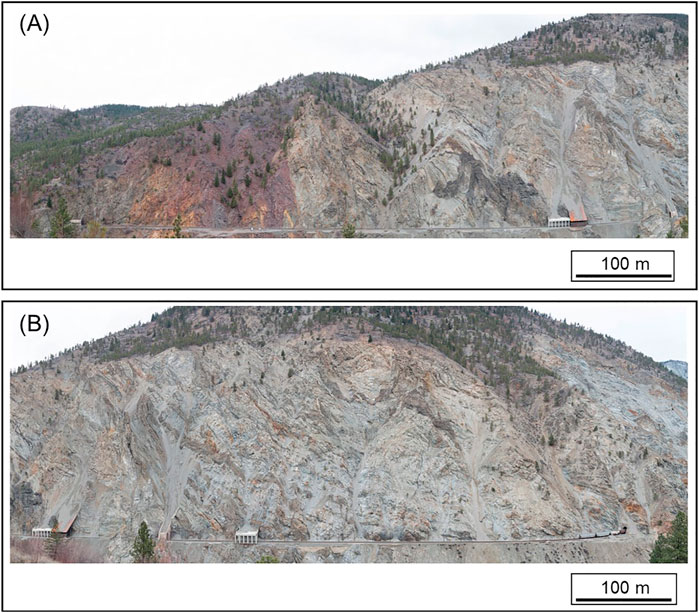
FIGURE 2. Panoramic photographs of WCW. Note that the scale is not consistent throughout each of the images. (A) This photo shows the Mt. Lytton Plutonic Complex and the fault contact (red-dashed line) with the Lytton Gneiss. (B) This photo shows the central portion of WCW, with the portal to WCE visible near the bottom right corner of the image.
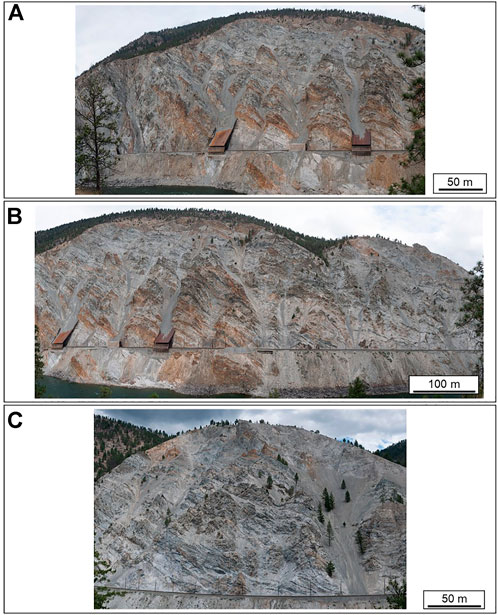
FIGURE 3. Panoramic photographs of WCE. Note that the scale is not consistent throughout the images. (A) This photo shows the rock sheds and the portal to WCW in the left side of the image. (B) Central portion of WCE. (C) Eastern most portion of WCE highlighting WCE channel 9.
The dominant geological unit in the WC is the Lytton Gneiss (Figure 4). The Lytton Gneiss is composed of a quartzofeldspathic gneiss with amphibolite bands, containing massive quartzite, gabbroic, and amphibolite intrusions. Two sets of dykes have intruded the Lytton Gneiss. The first dyke set consists of tonalitic intrusions that are believed to be related to the emplacement of the Mt. Lytton Plutonic Complex (Brown, 1981). The second dyke set is a series of dioritic intrusions that crosscut the Lytton Gneiss and tonalitic dykes. The dioritic intrusions are believed to be part of the Kingsville Andesite (Brown, 1981). On the western portion of the White Canyon is an outcropping of the Mt. Lytton Plutonic Complex (Brown, 1981; Greig, 1989). The Mt. Lytton Plutonic Complex in the White Canyon is a distinctly red-stained unit that is composed of granodiorite with local diorite and gabbro. The red staining of the rockmass is thought to be a direct result of fluids originating from the weathering of hematite in overlying mid-Cretaceous continental clastic rocks. Sedimentary units primarily composed of sandstone and conglomerate beds unconformably overlie the Mt. Lytton Plutonic Complex in WCW and above the Lytton Gneiss in two areas in WCE. In WCW, the outcrop is gently folded and displays well-graded bedding and load structures. The folding is thought to be a result of the local faulting (Brown, 1981).
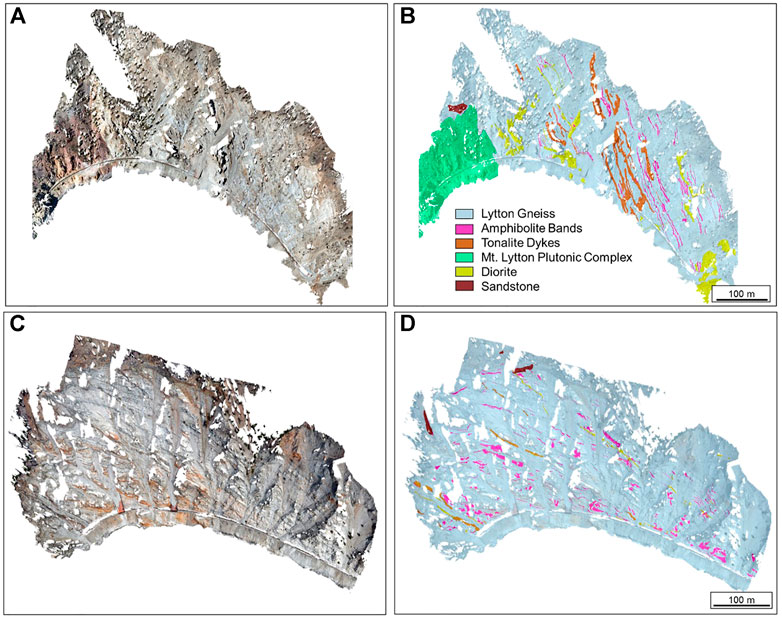
FIGURE 4. Overview of the lithological units present in the WC. (A) RGB photogrammetry model of WCW; (B) geological map of the major units in WCW; (C) RBG photogrammetry model of WCE; and (D) geological map of the major units in WCE. Note that the legend is the same for (B,D) and does not imply age of the units.
The overall rockmass is highly fractured and complex. Joint sets vary throughout the WC in each lithological units, each contributing to the high level of rockfall activity at this site. The rockfall and rockslides contribute to the production of material in the debris channels, and the more erosion resistant dykes provide geometric controls on the flow of material toward the rail line. All of the channels in the WC are truncated by the rail line, mitigation measures, and the river valley. Throughout the Canyon, mitigation measures have been installed by CN. These mitigation measures range from drape mesh fences to large 20-m wide debris sheds to convey debris over the rail line. In the Canyon, seven rock sheds protect the rail line: four in WCW and three in WCE. These structures have been built in a variety of ways; they either convey material over the structure at the angle of repose of the debris, or hold the material on a flat-topped structure until it can be cleared off and removed. Debris holding capacity is also provided by ditches and lock-block walls on the upslope side of the rail line, which are periodically cleared. Therefore, the portions of the channels directly above the rail line cannot be considered natural.
3 Methods
3.1 Data Capture
3.1.1 Laser Scanning
Laser scanning systems were used to capture point clouds of the WC. These point clouds were used to conduct change detection analyses and make assessments of in-channel-stored debris in each of the catchments. To capture the high-resolution point cloud datasets of the WC, two time-of-flight TLS scanning systems were used: an Optech Ilris 3D-ER and a Riegl VZ-400i system. Specifications of each system can be found within Supplementary Table S1.
TLS data capture was initiated using the Optech system in April 2013. In September 2017, data capture transitioned to using the Riegl system. While the TLS systems changed, the scan positions were unaltered. To scan the entire WC, six scan positions were used to capture data on WCW, and five positions were used on WCE. The spatial extents of each area of interest from each scan position are displayed in Figure 1.
Scanning campaigns were completed at frequencies that ranged from daily to quarterly between April 2013 and March 2020. In total, 52 and 51 TLS scanning datasets were captured for WCW and WCE, respectively. A summary of all scanning campaign dates can be found within Supplementary Table S2.
Between November 2014 and August 2017, a multi-scan box approach was used at each scan site. This method divided the field-of-view of the Optech scanner into three overlapping zones, corresponding to different ranges from the scanner. In each zone, the data were captured at different angular resolutions to achieve a consistent point spacing. Further details on this approach can be found in van Veen et al. (2017). This approach, however, yielded highly variable point spacing in the point clouds. Starting in August/September 2017, when the data capture transitioned to using the Riegl system, a single scan box was used at each scan site. The resolution of the scan was set to achieve an approximately 10-cm point spacing at the furthest reaches of the study slope. After the scans were captured, they were processed and then subsampled to a consistent point spacing of 10 cm.
To collect data in areas occluded by the TLS scanning, an aerial laser scanning (ALS) survey was conducted in October 2015 by McElhanney Consulting Inc. on behalf of CN. The dataset was collected using a helicopter-mounted Leica 70 ALS system, at a target resolution of 20 points per m2, with a horizontal accuracy of <10 cm and vertical accuracy of 15 cm in open areas and 50 cm in heavily vegetated areas. Aerial photographs were captured simultaneously during the laser scanning data capture. Orthophotos were generated at a resolution of 20 cm per pixel.
3.1.2 Gigapan Photography
Panoramic images were generated and used for verification of all changes seen in the change maps and during visual inspections of the slope. To generate the panoramic images, high-resolution images were taken with Nikon D800 and D7200 digital single-lens reflex (DSLR) cameras, mounted on a GigaPan robotic head and equipped with a Nikkor 135 mm 2/f prime lens. Using this setup, a set of overlapping photos was collected at each TLS scan location. After the photos were captured, they were stitched together using GigaPan Stitch software to generate high-resolution panoramic images. Examples of these panoramic images can be seen in Figures 2, 3.
The coverage for this dataset spans May 2013– March 2020. A complementary set of GigaPan digital images is not available for every TLS scan captured.
3.1.3 Structure-From-Motion Photogrammetry
Photogrammetry models were used to generate mapped point clouds to separate the different types of geomorphic activity and to map lithologies in the WC. To generate the photogrammetry models, a Nikon D750 DSLR camera with a Nikkor 50 mm f/1.8 prime lens was used to capture digital images from the opposite side of the Thompson River. An external global positioning system (GPS) was attached to the camera to geotag each photograph. A total of 282 images were captured on 30 January 2017 to generate a model of WCW, and 452 images were captured on 4 April 2017 to generate a model of WCE. The images were captured with approximately 50–60% overlap.
After the photographs were captured, they were imported into the Agisoft Metashape (formerly PhotoScan) Professional V1.3.2 software package (Agisoft LLC, 2018) to create the photogrammetry models. The models were generated following a typical Structure-from-Motion (SfM) photogrammetry processing workflow (Westoby et al., 2012; Smith et al., 2016). After each of the models was generated, they were manually mapped in Metashape to delineate the boundaries of bedrock outcrops and channels to create masks (Figure 5) and map lithologies (Figure 4). The process involves using the selection tool within Metashape to isolate areas of the SfM point cloud to be assigned a classification (Jolivet et al., 2015). This process results in a mapping attached to the point cloud, which can be exported for subsequent analysis. The photogrammetry models and masks were exported and aligned to the TLS datasets in CloudCompare (Girardeau-Montaut, 2018) for further analysis.
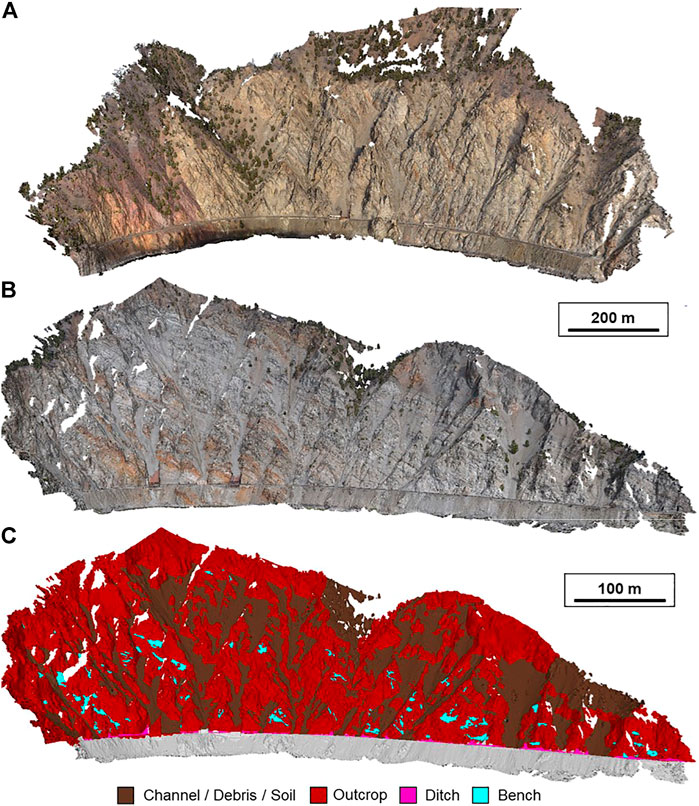
FIGURE 5. Overview of the SfM-MVS photogrammetry models. (A) Model of WCW from photographs taken on 30 January 2017. (B) Model of WCE from photographs taken on 4 April 2017. (C) Classified model of WCE. The model was remotely mapped in PhotoScan using a combination of the RGB point cloud and visual inspection of the panoramic photography. Figure from Bonneau et al. (2019b).
3.2 Analytical Methods
3.2.1 Terrestrial Laser Scanning Point Cloud Processing and Change Detection
Each of the TLS point clouds were processed to allow the datasets to be used for change detection analysis. Change detection computations allowed for the identification of changes in the slope geometry over time.
To process the point clouds, each dataset was parsed using the software associated with each TLS system. After the datasets were parsed, vegetation, slope mitigation (i.e., drape mesh), and erroneous points were manually removed.
Each of the TLS scans was processed and aligned as sections, to reduce computation time for data processing and file size. Scans of WCW were processed in three sections and scans of WCE were processed in two sections. Each section overlapped adjacent sections to permit alignment and the development of overall slope surface models of each side of the WC.
To align the datasets, the Optech datasets were imported into PolyWorks and the Riegl datasets were imported into RiScan Pro for registration. Point clouds were aligned to common baselines based on the epoch in which they were captured. The general workflow for the registration process involved a manual point picking of common shared points between the two point clouds. Following the manual point picking, an iterative closest point (ICP) (Besl and McKay 1992) matching algorithm was applied to refine the alignment. Both the Optech and Riegl datasets were imported into RiScan Pro to register the two datasets and establish a common baseline across all scan dates for analysis. The alignment error varied across the scans. The average alignment error varied from 0.018 to 0.07 m. The error tended to be higher for datasets before November 2014. The Riegl system appeared to be more sensitive to colder weather scanning than the Optech system and experienced more pronounced temperature drift. As a result, the cold weather scan datasets were manually partitioned into smaller sections and aligned to previous datasets to reduce this effect. If misalignment was detected in the Optech scans, they were imported and realigned in RiScan Pro.
After the registration process was completed, multiscale model-to-model cloud comparison (M3C2) (Lague et al., 2013) was used for all distance computations between the point cloud TLS datasets. M3C2 is a vector-based distance computation that operates directly on point clouds. The M3C2 implementation in CloudCompare (Girardeau-Montaut 2018) was used for this study following the process outlined by DiFrancesco et al. (2020). In brief, the CloudCompare API was accessed via a custom Python script. The M3C2 distance computations were then performed in batch on all of the TLS datasets. The point clouds were subsampled to 0.10 m, and a 0.50-m diameter was used for surface normal vector computations. The projection diameter was set to 0.25 m, and the max depth for the M3C2 cylinder was set to 15 m for distance computations. The M3C2 parameters were selected from previous experience working at the site and the work presented by DiFrancesco et al. (2020).
Complete slope models were generated for WCW and WCE by aligning a set of TLS scans and ALS datasets. The TLS datasets used were captured a week before the ALS survey in October 2015. These models were generated and used to project the visualization displayed in the Results section. The TLS coverage is displayed in Figure 6B.
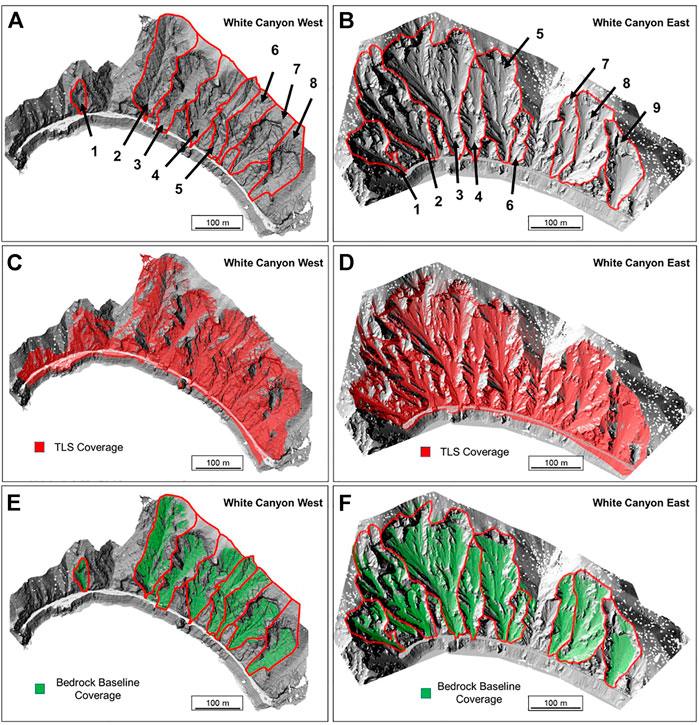
FIGURE 6. Channel delineations for the WC. (A) WCW and (B) WCE. TLS coverage for the WC. (C) WCW and (D) WCE. Bedrock baseline coverage for the in-channel stored debris volume estimates. (E) WCW and (F) WCE.
3.2.2 Debris-Monitoring Methodology
To assess the volume of debris that was stored in each catchment in the WC, a monitoring methodology was developed. Figure 7 displays a visual representation of the monitoring methodology that was developed, building on preliminary work reported by Bonneau et al. (2019a). Panoramic images and TLS scans were used to develop a bedrock baseline model for each channel analyzed. Areas of exposed bedrock were recorded for every single data capture campaign and were combined into a full model over time. The bedrock baseline model was then used to conduct M3C2 change detection with the TLS scans to assess the volume of debris in the channel and where it is located (Figure 8).
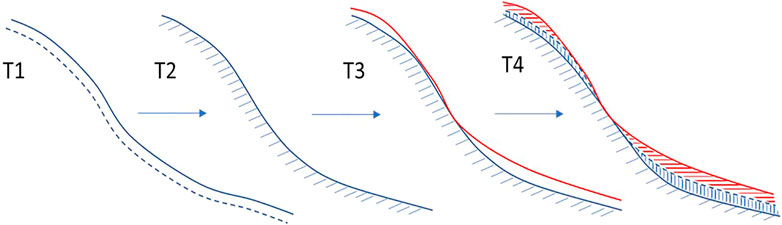
FIGURE 7. Overview of the proposed recharge monitoring methodology. T1—initial scan of channel. T2—debris-flow has occurred and scoured channel to the bedrock baseline (idealized). T3—channel begins to recharge from rockfall and rockslides. T4—debris-flow occurs. Using the baseline, the degree of debris and bedrock incision can be calculated.
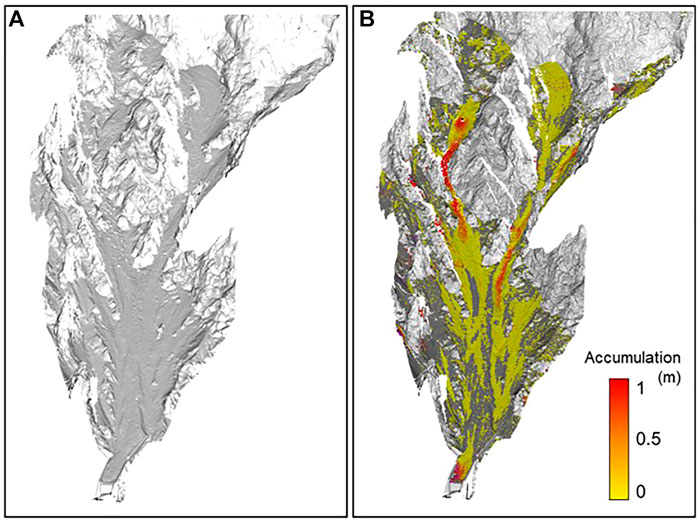
FIGURE 8. Visual example of the in-channel stored debris volume estimate using the 2 March 2020 WCW Channel 4 scan. (A) Overview of the channel and (B) distance computation between the bedrock baseline model and the 2 March 2020 scan. Color scale denotes distance from the bedrock baseline model.
Not all areas in the channels were exposed to bedrock throughout the monitoring period. As a result, to supplement the bedrock baseline models, a lowest elevation cell approach was used to fill in the baseline models. The Open3D Python library (Zhou et al., 2018) was used to grid the point clouds of each of the channel catchment areas. Once a grid was established for a given catchment, the lowest points within each grid cell were extracted, resulting in a lowest elevation point cloud for the entire channel catchment. A cell size of 10 cm was used for the grid. After these points were extracted, they were filtered by verticality. This process was used to segment out the near vertical outcrop from the remaining channel areas. A statistical outlier filter was applied to the point cloud to remove any noise from the segmentation process. A merged point cloud of the manually mapped bedrock baselines and the lowest elevation point cloud were used to assess all in-channel stored debris.
For this study, only primary channels/catchments in the White Canyon were analyzed. The channels used in the current work are outlined and numbered in Figure 6A. These channels promote the accumulation of debris, in contrast to some of the minor channelized or planar areas of the study slope. Seventeen channels were analyzed for this work in both parts of the WC. Two channels on WCW and one channel on WCE were excluded from the study due to a lack of coverage in the TLS datasets.
3.2.3 Normalized Heatmaps of Change Generation
To identify overall concentrations of erosion and deposition in the change detection results, normalized heatmaps were generated from the point clouds and change detection results. Heatmaps were generated for both the detected erosion and deposition separately. Cumulative, yearly, and seasonal maps were generated for each side of the WC. The seasons are defined as spring (March–May), summer (June–August), fall (September–November), and winter (December–February). Normalization was required to be able to facilitate comparison of the erosion and deposition that occurred in the different catchments for each of the periods analyzed (i.e. seasonal vs. yearly vs. cumulative).
The heatmaps were generated by setting a grid (0.25 m) across the entire point cloud change maps and quantifying the frequency and magnitude of the detected change in the grid cells. Therefore, the normalized average change could be visually displayed across the catchments. The values were normalized by the maximum amount of change across all datasets.
3.2.4 Digital Rockfall Inventory
In this work, the authors developed a digital rockfall database derived from sequential TLS scans captured at the White Canyon. Results of the rockfall database have been also reported by DiFrancesco et al. (2021a).
The process involved computing change detection both forward and backward between two sequential datasets. The change detection was then filtered based on the limit of detection. The limit of detection was defined as two-times the standard deviation of the alignment error (Abellan et al., 2014). A threshold was applied to the change detection results, and the results were filtered and clustered using a 3D clustering algorithm (i.e., density-based spatial clustering of applications with noise (DBSCAN)—Ester et al. (1996)). Each identified cluster was then meshed to calculate a volume (Bonneau et al., 2019c; DiFrancesco et al., 2021b). Each of these changes was assigned a classification (i.e., rockfall or debris movement) using the approach presented in Bonneau et al. (2019b). This approach used majority voting, where the identified change points searched the masked point cloud to find the nearest mapped class points, and a classification was assigned (i.e., rockfall or debris movement). Further details on the process used in this work and the database can be found in DiFrancesco et al. (2021a, 2021b).
3.2.5 Weather Data
Weather data were collected from the Lytton weather station using the Pacific Climate Impacts Consortium data portal (Pacific Consortium Climate Impacts, 2021). This weather station was the closest station that provided complete coverage over the course of the monitoring period. Additional data were collected from the Queen’s White Canyon weather station, located in WCW, between October 2016 and February 2020. For each of the weather stations, precipitation and temperature are recorded. The Lytton station only outputs daily precipitation, while the Queen’s White Canyon weather station outputs a measurement every 15 min. The number of daily freeze–thaw cycles was computed using the available temperature data. An overview of the datasets can be seen in Supplementary Figure S2.
4 Results
4.1 Rockfall Inventory
Throughout the 2,514-days monitoring period, 72,501 rockfalls were identified in the change detection analysis, including 37,088 rockfalls in WCW and 35,413 rockfalls in WCE. The rockfall volumes ranged from 0.010 m3 to 2,650 m3 event. The 2,650 m3 event occurred on 5 June 2013 in WCW and is described in detail by Kromer et al. (2015). This event, however, did not occur in a channel, but adjacent to the rail line.
As shown in Figure 9, rockfalls have been documented to occur throughout the entire study slope, in all lithologies, providing debris to recharge the channels. The cumulative rockfall volume detected in WCW and WCE was 8,723 m3 and 3,146 m3, respectively. Despite a similar number of rockfalls being detected on both sides of the WC, the rockfalls are, on average, larger in WCW than WCE (0.24 vs. 0.09 m3).
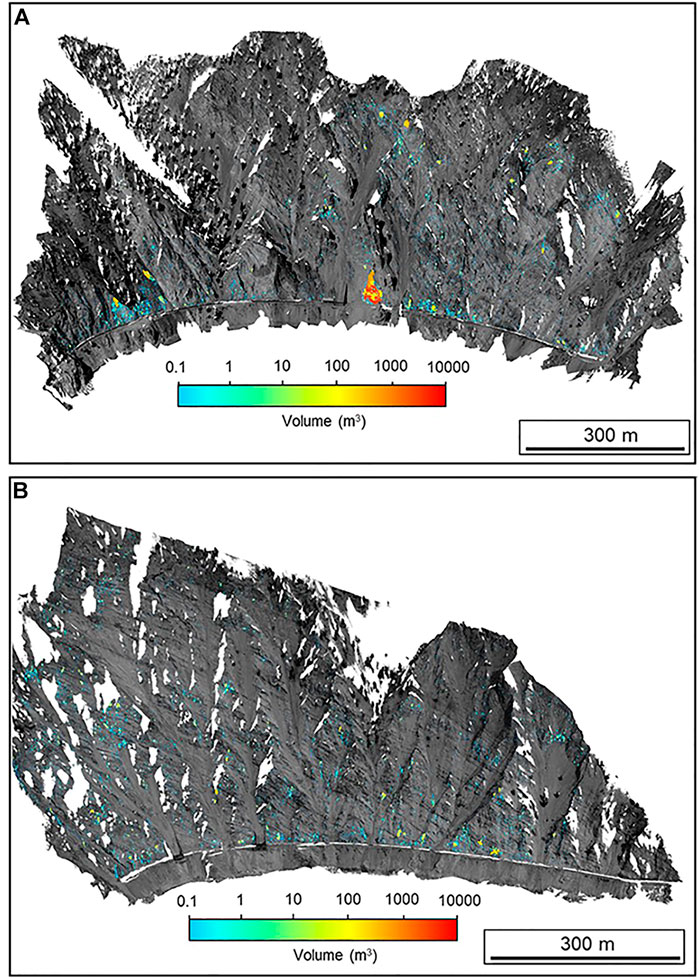
FIGURE 9. Detected rockfall events that occurred in the White Canyon between April 2013 and March 2020. The color scale corresponds to the magnitude of the rockfall. The lower limit of 0.1 m3 was established as the lowest event visible from this scale of visualization. (A) WCW and (B) WCE. Modified from DiFrancesco et al. (2021a).
4.2 Normalized Heatmaps of Change Results
The transfer of debris in the WC occurs at a variety of scales, ranging from raveling of the debris in the channel to evacuation of the debris channels. These forms of movement result in changes in the channel topography and were documented throughout the monitoring period with the TLS scans.
The normalized heatmaps provide insights into the changing morphology of the channels at the WC. These maps allow concentrations of erosion and deposition to be identified in each of the channels. Figures 10, 11 display the cumulative normalized heatmaps for WCW and WCE. The normalized heatmaps also reduce more than 52 sets of change detection results into a single image for the identification of areas of high net changes. For example, in WCE channel 3, the western-most subchannel displayed the highest concentration of both erosion and deposition within the channel, indicating it was the most active area of the channel during the monitoring period.
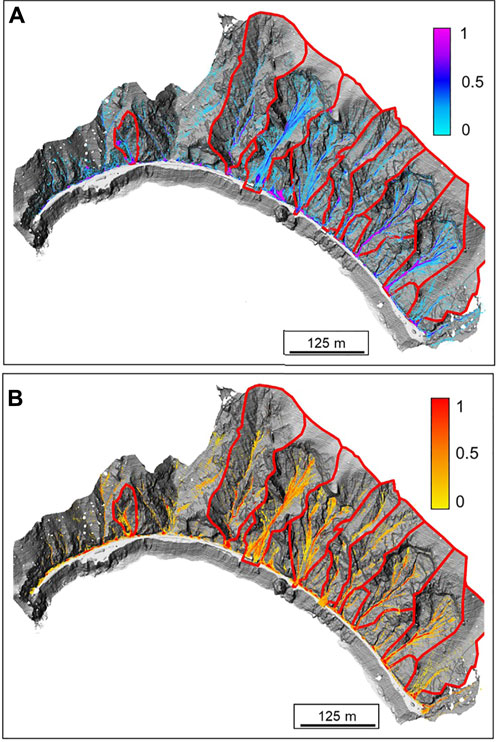
FIGURE 10. Normalized cumulative heatmap for WCW. (A) Overview of the negative change and (B) overview of the positive change.
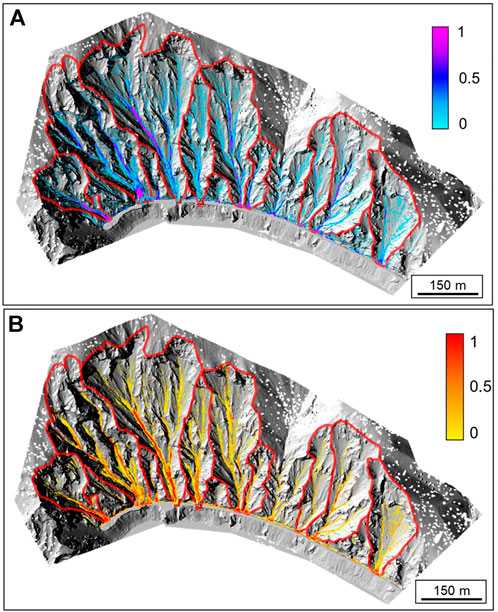
FIGURE 11. Normalized cumulative heatmap for WCE. (A) Overview of the negative change and (B) overview of the positive change.
Concentrations of negative and positive changes can be seen along the rail line. These concentrations in the heatmaps are a result of debris accumulating in the ditches and then subsequently being removed by the operators.
4.3 Temporal Censoring
The results of the M3C2 change detection for 11 Riegl scans for Channel 7 on WCW are displayed in Figure 12, considering data collected between 3 September 2017 and 2 March 2019.
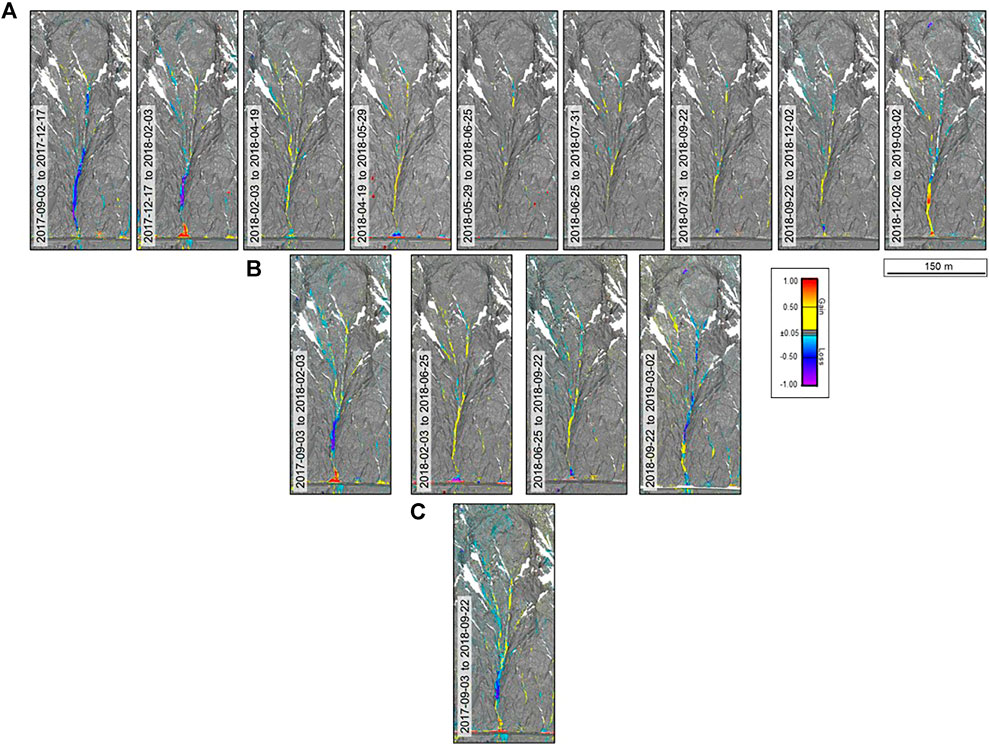
FIGURE 12. Change detection results for Riegl scans captured of WCW Channel 7, highlighting the implications of the timing of data collection. (A) Full dataset processed within change detection. (B) Tri-annual data collection with data captured in February, June, and September. (C) Annual data collection with data captured in September.
Throughout this monitoring period, using all datasets available, there were at least three detected instances where the channel experienced a large-scale debris movement. These debris movements occurred in the fall and winter seasons each year (Figure 12A).
The change detection results for the times between the larger debris movements revealed that the channel was being replenished with debris. Debris was transported from the steep cliff faces to subchannels during the summer months and was concentrated in the primary channel in this catchment (Figure 12A).
As noted by van Veen et al. (2017) and Williams et al. (2019), the frequency of data collection affects the outcome of analysis of both the volume and timing of rockfall events. Longer elapsed times between data acquisitions will result in the accumulation of smaller volume, discrete events being recorded as a single event. To examine this effect on the data analyzed here, three different analyses were completed. The results of analysis of all of the data are provided in Figure 12A. Analysis was also completed on datasets, representing triannual data collection (February, June, and September) as displayed in Figure 12B. In this case, the second event that occurred between 3 September 2017 and 3 February 2018 (Figure 12A) was not recorded in the change detection. Figure 12C displays the change detection results for the scenario where only one single scan per year is possible. In this case, the change detection results display a single debris movement with deposition near the track.
4.4 In-Channel Stored Debris
The results of all channels analyzed in the WC and the detected rockfall volumes can be found within Supplementary Figures S3 and S4. Figure 13 displays the normalized in-channel stored debris for all catchment areas in the WC. The results of the estimated in-channel stored debris for three channels on WCW are displayed in Figure 14.
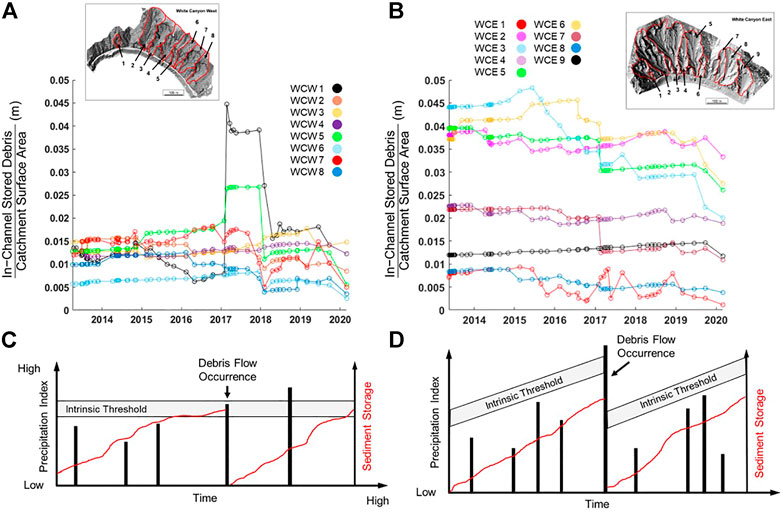
FIGURE 13. Estimated in-channel stored debris volumes, normalized to the catchment area, for the monitoring period. (A) WCW. (B) WCE. Conceptual models of weathering-limited (supply-limited) basins with regard to the occurrence of debris-flows. (C) Jakob (1996) model. (D) Brayshaw and Hassan (2009) model.
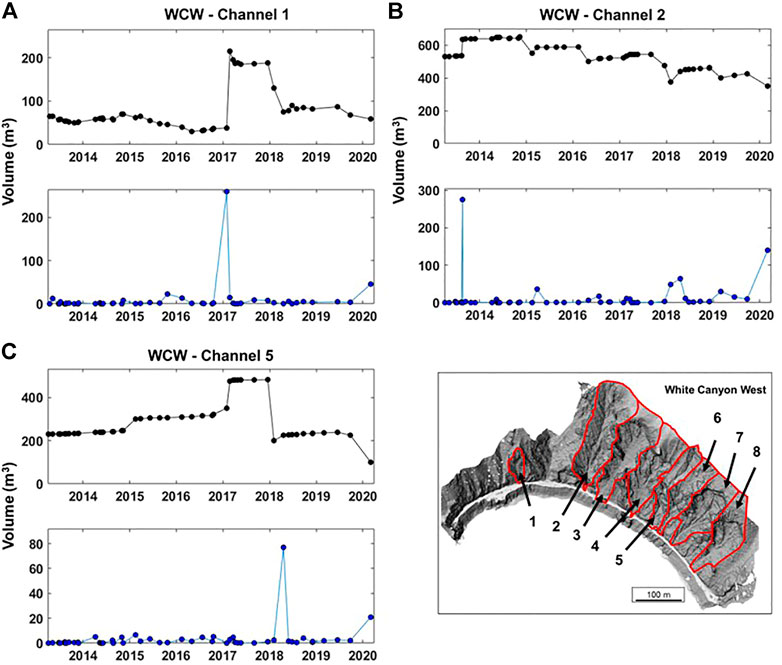
FIGURE 14. Overview of the estimated in-channel stored sediment for three of the analyzed channels on WCW. Upper graph corresponds to the volume of estimated in-channel stored sediment for each TLS scan (black) and the volume of rockfall volume added to the channel during the period elapsed between scans (blue). Example channels from WCW are displayed: (A) Channel 1, (B) Channel 2, (C) Channel 5.
As demonstrated in Figure 14, each channel displays a variety of behaviors despite experiencing similar climate conditions throughout the monitoring period. In some cases, the detected volume of rockfall that occurred in the catchment does not directly correlate to the change of in-channel stored debris. There are several possibilities for this type of response. First, depending on the size and degree of fragmentation (or lack thereof), not all rockfall events will remain in the channel. In some situations, the blocks can propagate downslope and potentially out of the channel before the next scan date. Alternatively, a rockfall event could potentially trigger the movement of debris, causing a net loss of in-channel stored debris as debris is moved downslope and out of the channel. There are, however, cases where the rockfall volume added to the channel directly corresponds to an increase in the in-channel stored debris. The best example of this was observed in WCW channel 1 (Figure 14A). A large portion of the rockslide volume that occurred between the scans captured on 30 January 2017 and 23 February 2017 was retained in the channel.
There are cases where there was an increase in the stored debris (Figure 14C), but seemingly no rockfall volume was being added to the channel. In these cases, debris or a movement of debris can be added to the channel from areas that are outside the extents of the TLS scans. An example of this type of response is demonstrated in WCW Channel 5. Debris from a channelized area beyond the spatial monitoring domain of the TLS scans entered the upper reaches of the channel. This sequence of events occurred between 30 January 2017 and 23 February 2017. The debris in this location remained in the upper reaches until further storms in November 2017 caused the debris to mobilize downslope and deposit on the flat-topped rock shed at the base of the channel.
The depth of debris varied spatially throughout the monitoring period and between channels. In the major channels, the depth of debris in the subchannels ranged from a small veneer (<5 cm—LoD) of debris to instances with more than 2 m of debris cover. Channel topography influences its ability to accumulate sediment. Using WCW Channel 5 as an example again, the upper reach of the channel is relatively incised and shallower (30°) than the rest of the channel (36°). During an influx of debris in February 2017, the upper reach stored debris with depths of approximately 2.3 m in this location. Sections beneath the upper section are too steep to promote the accumulation of debris.
4.5 Known Events
Throughout the monitoring period, to the authors’ current knowledge, there were only three instances when the timing of a debris movement was known within 12 h or less. Figure 15 displays an event that occurred in the early morning on 16 February 2017 in WCE. The volume of the event was approximately 122 m3 and impacted the rail line. The event appears to have been initiated in the upper reaches of WCE channel 5. Erosion can be seen in the panoramic images (Figure 15C) captured 6 days after the event. This area is at the limits of TLS scan coverage, however, incision and scour of the colluvium can be seen along the entire channel length. There is no deposit at the base of the channel in the change detection, as it was removed by the rail operators before the scan captured on 21 February 2017.
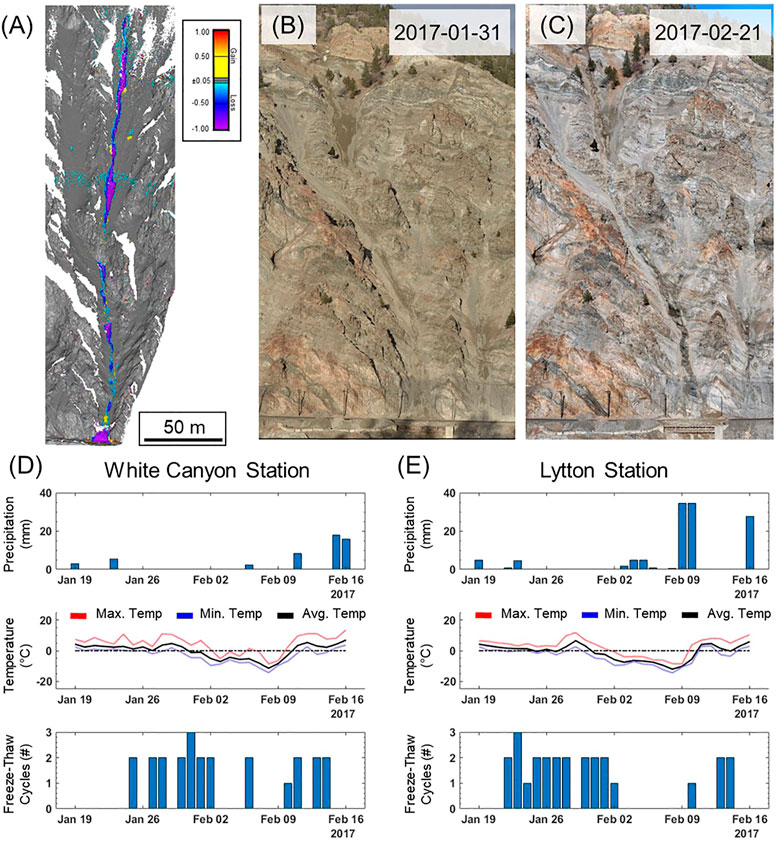
FIGURE 15. Overview of the 16 February 2017 debris-flow in WCE. (A) M3C2 change detection between scans captured on 31 January 2017 and 21 February 2017. Panoramic images of the channel captured on (B) 31 January 2017 and (C) 21 February 2017. Climate signatures leading up to the debris-flow (D) White Canyon weather station and (E) Lytton weather station.
In February 2018, a dry granular flow was documented in WCE. The debris fragments propagated downslope for approximately 6–10 s. It is unclear if a rockfall triggered this movement or if it was the result of the oversteepening of the debris accumulation. In all of the movements that were witnessed, there did not appear to be water present in the debris. This observation could be biased by the timing of the scans; however, as field work was not conducted during heavy rainstorms. In addition, the observations were made from across the river, 400–500 m away from the slope.
5 Discussion
A 7-year TLS record provided insights into the debris transfer and accumulation processes occurring in the WC. Over 50 TLS models of each side of the WC were analyzed to investigate the transfer of debris. It was demonstrated that the use of TLS monitoring provides a means to capture very high-resolution topographic data for analysis. The collection of multitemporal datasets and M3C2 change detection was highlighted to provide insights into the debris movements and rockfall activity occurring in each of the channels.
5.1 Revisiting the Supply Theory
The debris stored in the WC channels is shown in Figure 13. These data are compared to debris movement theories, including Jakob’s (1996) definition of a weathering-limited system (supply-limited), whereby exceedance of an intrinsic precipitation threshold will generate a debris-flow, provided sufficient debris is present in the channel (Figure 13C). Brayshaw and Hassan (2009) presented an updated model of sediment recharge, whereby the threshold value for debris-flow initiation is dependent on the volume of sediment in the gully channel, on sediment recharge rate, and time, since the last debris flow. A debris-flow occurrence resets the volume threshold value to a lower level (Figure 13D).
In the WC, over the course of the monitoring period, each channel demonstrated a unique response to storms. The storms that occurred in February 2017 and later in November/December 2017 are of note. During these events, each channel demonstrated a different response to a local climatic signature that operated similarly on each of the channels. When a debris movement occurred, the channels did not fully evacuate as suggested by Jakob’s (1996) model. Furthermore, in the WC, the activity within subchannels was also variable. Selected subchannels showed erosion and deposition, while adjacent subchannels did not show any activity in the change detection analysis. These cases demonstrate a variety of responses to storms, even within a single catchment.
There is a stark difference between the channel types in the WC and those analyzed by Jakob (1996) and Brayshaw and Hassan (2009). The channels of the WC are steep and smaller in the area than those investigated in the aforementioned studies. Furthermore, they are truncated by the rail line. In addition, the proximity of the transfer/transport zones to the source zones at this site may mute the apparent response to rainfall. For example, more debris may be moved down a channel during a big storm, but that same rainfall may also trigger more rockfalls/slides that simultaneously recharge the channel, so the observed debris storage volume may not change much, even though a lot of material may have moved.
The use of TLS to populate a digital rockfall database is one of the great advantages of using this technique to monitor rock slopes. A detailed 3D database was constructed from the change detection analyses over the monitoring period. Despite the abundance of rockfall events, the vast majority of them were small-magnitude events (<1 m3). The overall rockfall volumes being added to the channels were relatively low. In only a few channel cases, the debris volumes were matched by the replenishment of debris from rockfall events. In most cases, the channels were being depleted of debris. A potential reason for this imbalance is that the WC has not experienced a large magnitude rockfall/rockslide that replenishes the channels with debris. As a result, the channels are in a stage of a cycle where the current debris is in the process of moving out of the system. It is very difficult to distinguish how long the debris remains in the channel, due to the long range and relatively infrequent timing of the observations. Very few rock blocks could be tracked as they migrated down the channel. The color of the debris fragments and timing between data captures makes it difficult to track blocks downslope.
5.2 A Conceptual Model of White Canyon Debris Transfer
Building on the observations from the monitoring program at the WC, a conceptual model of the in-channel debris responses was generated, as shown in Supplementary Figure S5. Within the model, there are three general responses within the channel, including net depletion, net neutral, and net accumulation.
In the case of net depletion, there is a decrease in the estimated in-channel stored debris over time. Debris transfer out of the catchment dominates and far surpasses the rate of accumulation of debris provided by rockfall and rockslides. The depletion is a result of either operator intervention (i.e. ditching or debris removal from the rock sheds) and natural evacuation of the channels through debris movements.
In the case of net neutral, the rate of debris transfer out of the system is at equilibrium with the rate of debris accumulation provided by rockfall and rockslides. In this scenario, there appears to be no changes in the estimated in-channel stored debris despite debris moving out of the system. In this case, geomorphic activity may not be detected by the TLS monitoring, because changes are smaller than the limit of detection. Potential examples of this include raveling of debris on the upper reaches of the slope or fragmental rockfalls where the accumulated deposit was below the limit of detection.
Last, the final case is net accumulation. In this scenario, the rate of debris accumulation exceeds the rate of debris transfer out of the catchment. The primary contributor to debris accumulation in the WC is rockfalls and rockslides. However, due to the height and distance of the upper slope reaches from the scanning location, debris enters the catchments from areas outside the spatial monitoring extents.
5.3 Importance of Study Length
In addition to the sensitivity of the results to data collection frequency, as noted previously by others (van Veen et al., 2017; Williams et al., 2019), the length of the study period was demonstrated to be an important component of the analysis. If a shorter timeframe was analyzed, an unrepresentative level of activity occurring on the study slope may be documented. It is essential to monitor sites for extended periods of time and/or monitor a number of sites on a regional-scale (Benjamin et al., 2020) to gain a better understanding of the mechanisms, timing, and lifecycles of processes occurring on the slopes. As previously noted, the channels currently appear to be in a period of debris depletion; therefore, only further monitoring will reveal the timeframe over which debris replenishment occurs.
It is apparent that there could be several different cycles operating at different timescales, contributing to the debris transfer processes. These coupled cycles include the rockfall supply, debris transfer, and debris removal.
The rockfall supply cycle relates to the frequency and magnitude of rockfall and rockslide occurrences and, ultimately, the material being added to the channels. However, this cycle is directly tied to the weather conditions at the site and can operate on a variety of timescales, from hourly to much longer. The influences of conditioning and triggering factors on rock slopes remain uncertain, but are central to understanding the rockfall supply cycle (Volkwein et al., 2011). Therefore, further investigation of rockfall contributing factors may help resolve the expected rockfall supply per catchment.
The debris transfer cycle relates to the redistribution of the debris in the channels. This cycle involves the transfer of debris from benches and beneath cliff faces to the central portions or subchannels within each catchment. There were instances when these debris transfers occurred within weeks and areas in the catchment where no change was detected over the course of the monitoring period. The timing of these cycles needs further investigation.
The final consideration is the debris removal cycle. This cycle includes removal of debris during maintenance activities by the rail operators, as well as the natural evacuation of the stored debris from the channels. Timing of maintenance by the rail operators relates to logistics, weather, and remaining available ditch catchment capacity. Manual removal of debris accumulation from the roof of the rock sheds was identified to have been necessary twice over the study period. Typically, the debris would naturally pass over the structure on its own. Generally, this work affects debris on the lower reaches of the slope, where its influence remains largely unknown.
The natural debris removal cycle at this site ranges from seasonal to multiple years. Not all channels displayed a similar response to the climate during the monitoring period. Further and more detailed monitoring would help define the different mechanisms and timeframes of these cycles.
5.4 Implications for Debris-Flow Risk Management
The volume and location of debris and rockfall activity within debris-flow channel headwaters was successfully monitored using the proposed method. Any point cloud dataset can be used within the introduced monitoring framework.
In this work, the recharge and evacuation cycles were monitored in 17 channels in the WC, using the introduced monitoring framework. This information can be used by the rail operators to ensure that there is sufficient ditch capacity at the base of the channel to retain probable debris volumes. In the case where the ditch retention capacity is not sufficient in comparison to the volume of debris within the catchment, alternative mitigation options can be explored.
As real-time monitoring systems become increasingly common (Kromer et al. (2017); Williams et al. (2018)), the monitoring framework introduced in this work can be used to provide near-real-time updates of the debris volumetrics within a debris-flow channel system. If a permanent TLS system was installed, the approaches introduced in this work could be incorporated into the data processing pipeline. In addition to change detection results with each new data capture, the scripts developed in this work can also be used to compare the new data with the bedrock baseline models to provide an update to the debris volumetrics.
A conceptual model can also be proposed that integrates the debris-monitoring methodology and the previous work on debris-flow initiation utilizing intensity-duration relationships for precipitation (Coe et al. (2008)). By generating a three-axis plot of rainfall intensity, duration, and in-channel stored debris, a hypothetical surface can be fit to the datasets (Supplementary Figure S6). The surface could potentially define the initiation conditions for debris-flow occurrence, incorporating in-channel stored debris. Most importantly, defining this relationship would allow rail operators to incorporate meteorological forecasts and predictions into slope hazard management. Rail operators could take the most recent point cloud and assess the debris volumetrics within the channel. Meteorological analysis could give insights into a potential intensity-duration for an upcoming storm system. Operators could therefore assess if debris-flow initiation is likely to occur in select channels in response to the storm and enact mitigation steps. This proposed conceptual model aims to combine actual debris conditions within debris-flow catchments in precipitation intensity-duration analyses.
The approaches and data presented in this work represent a step toward developing such a model. However, the key element that is lacking at the White Canyon is a high temporal resolution of data collection, for both the laser scanning and weather data. These represent the next challenges to overcome in an attempt to develop such a model.
5.5 Limitations and Uncertainties
Change detection analyses provide an overview of the net change that has occurred between two scan dates. Therefore, the activity that actually occurs between scans is one of the greatest uncertainties with this work. Although change can be documented to occur, the timing and mechanism(s) of movement remain unclear. Therefore, during extended periods of time between scans, it is not possible to distinguish if the channel was evacuated in a single event or a series of pulses of debris movement downslope, continuously overprinting one another. Uncertainties are further compounded when there is intervention by the rail operators to remove debris from ditches, from behind lock-block walls and from flat-topped rock sheds. These activities may cause retrogressive debris movement upslope, which cannot be separated from natural slope processes within the dataset.
The effects of temporal censoring from TLS data on change detection analyses of debris movements are highlighted in Section 4.3. These temporal censoring effects increase at longer scanning intervals, where it was demonstrated that debris movements overprint one another. In these situations, debris burial or erosion destroys evidence of previous activity. As a result, the volume and return interval of such movements may be incorrectly calculated.
Previous studies of TLS monitoring of debris catchments largely do not address this uncertainty. A recent study by Morino et al. (2018) acknowledges this uncertainty; however, they still attempted to investigate debris-flow initiation processes using data collected in 2007 and 2013. Although temporal censoring may not be addressed in many other studies, the effects may also not be as severe as in the WC. The slopes of the WC are very steep and there is an abundance of rockfall activity (at least 72,501 events in a 2,514-day period), which results in a higher level of activity than some of the other sites described in the literature (Loye et al., 2016; Morino et al., 2018; Imaizumi et al., 2019). These issues will only be resolved with a higher temporal frequency of monitoring at the WC and other sites around the world.
The process of manually delineating the areas of bedrock in each channel is a time-consuming process. Shadows, fog, dust or wildfire smoke, and otherwise poor imagery can make identification of these bedrock areas in the panoramic photographs challenging. To supplement this process, a lowest cell elevation approach was proposed. With this method, however, it is critical to ensure that there is a quality alignment between the scans. Any deviation or errors in the alignments will compound not only in the change detection but also in all aspects of the process, which can result in over- or under-estimates of the in-channel stored debris. Furthermore, it is essential to remove all vegetation, mitigation (i.e., drape mesh), etc. from each of the scans. These features erroneously contribute to the estimated in-channel stored sediment if they are left in the point clouds. In addition, not all areas of each of the catchments have been monitored because of occlusion from the accessible TLS scanning locations. Therefore, these areas could be a source of rockfall and contain areas where additional debris is stored on the slope (Abellan et al., 2014). As a result, these considerations could be contributing to error and uncertainty with the rockfall and estimated in-channel debris volume estimates.
6 Conclusion
To investigate the transfer and accumulation of debris in the WC, the authors processed and conducted change detection analysis on 7 years of TLS scanning data. Central to the analysis was the development of a new method to analyze the spatiotemporal accumulation of debris in each of the channels. An approach was proposed to supplement manual mapping to establish bedrock baseline models for each of the channels. Using the bedrock baseline models, in-channel stored sediment was estimated for each of the channels for each scan in the monitoring period. To assess recharge in each of the channels, a remotely sensed rockfall database was used.
Cycles of recharge and discharge in the channels were identified from the analysis. During the fall and winter months, debris was typically discharged and evacuated from the channels. During this annual time period, the WC experienced the greatest amount of precipitation and the highest number of freeze-thaw cycles. In addition, this timeframe was typical when the highest level of rockfall activity occurred. A combination of both of these factors could be contributing to the higher channel activity during these months. During the summer months, however, debris was redistributed in the channels to the subchannels as dry granular flows. This timeframe also corresponds to when maintenance work was typically conducted to remove material from the rock sheds and ditches in the WC.
The ability to monitor the volume and spatial distribution of debris within debris-flow channel headwaters can be used by rail operators for slope hazard management. The presented approach can be used to ensure that there is sufficient ditch capacity at the base of the channel to retain probable debris volumes.
While TLS provides a high-resolution spatial dataset, the periodic nature of the data capture of topography is presently insufficient when attempting to understand the detailed behavior of initiation and debris movement dynamics. The topography at the WC is constantly in flux; therefore, there are major challenges trying to decipher mechanisms of movement from change detection analyses taken at quarterly intervals. In spite of these limitations, the change detection analysis does provide an overview of the net change that has occurred between the two scan dates. In order to understand detailed debris transfer mechanisms and processes, higher frequency monitoring and weather data are required.
Data Availability Statement
The datasets presented in this article are not readily available because a Data-Sharing Agreement with Canadian National (CN) Railway is required. Requests to access the datasets should be directed to DJH, aHV0Y2hpbmpAcXVlZW5zdS5jYQ==.
Author Contributions
Conceptualization, DB, DJH, and SM; formal analysis, DB; funding acquisition, DB, DJH, P-MD; investigation, DB; methodology, DB and P-MD; project administration, DJH and SM; resources, DJH and SM; software, DB and P-MD; supervision, DJH and SM; visualization, DB; writing—original draft, DB; and Writing—review & editing, all. All authors have read and agreed to the published version of the manuscript.
Funding
This research program was funded by the Natural Sciences and Engineering Research Council of Canada (NSERC) Collaborative Research and Development Grant (CRDPJ 470162-2014) at Queen’s, in collaboration with the University of Alberta, and supported by CN and CP Rail. The NSERC Graduate Research Program provided support to DB (PGS D3 - 519,475–2018) and P-MD (CGS D3 - 546,935–2020). The Queen’s University research group was also supported by the NSERC Discovery Grant (RGPIN: 05,668-2019) held by DH.
Conflict of Interest
The authors declare that the research was conducted in the absence of any commercial or financial relationships that could be construed as a potential conflict of interest.
Publisher’s Note
All claims expressed in this article are solely those of the authors and do not necessarily represent those of their affiliated organizations, or those of the publisher, the editors, and the reviewers. Any product that may be evaluated in this article, or claim that may be made by its manufacturer, is not guaranteed or endorsed by the publisher.
Acknowledgments
Past and present members of the Queen’s RGHRP team are gratefully acknowledged for their help with data collection at the White Canyon. We would also like to acknowledge the comments and suggestions from the reviewers, which helped improve the manuscript.
Supplementary Material
The Supplementary Material for this article can be found online at: https://www.frontiersin.org/articles/10.3389/feart.2022.883259/full#supplementary-material
References
Agisoft LLC (2018). Agisoft PhotoScan User Manual. St. Petersburg, Russia. Available at: www.agisoft.ru.
Benda, L., Dunne, T., Jaboyedoff, M., Rosser, N. J., Lim, M., and Lato, M. J. (2014). Terrestrial Laser Scanning of Rock Slope Instabilities. Earth Surf. Process. Landforms 39, 80–97.
Benda, L., and Dunne, T. (1997). Stochastic Forcing of Sediment Routing and Storage in Channel Networks. Water Resour. Res. 33, 2865–2880. doi:10.1029/97WR02387
Benjamin, J., Rosser, N. J., and Brain, M. J. (2020). Emergent Characteristics of Rockfall Inventories Captured at a Regional Scale. Earth Surf. Process. Landforms 45 (12), 2773–2787. doi:10.1002/esp.4929
Berger, C., McArdell, B. W., and Schlunegger, F. (2011a). Direct Measurement of Channel Erosion by Debris Flows, Illgraben, Switzerland. J. Geophys. Res. 116, a–n. doi:10.1029/2010JF001722
Berger, C., McArdell, B. W., and Schlunegger, F. (2011b). Sediment Transfer Patterns at the Illgraben Catchment, Switzerland: Implications for the Time Scales of Debris Flow Activities. Geomorphology 125, 421–432. doi:10.1016/j.geomorph.2010.10.019
Berti, M., Genevois, R., Simoni, A., and Tecca, P. R. (1999). Field Observations of a Debris Flow Event in the Dolomites. Geomorphology 29, 265–274. doi:10.1016/S0169-555X(99)00018-5
Besl, P. J., and McKay, N. D. (1992). A Method for Registration of 3-D Shapes. IEEE Trans. Pattern Anal. Mach. Intell. 14, 239–256. doi:10.1109/34.121791
Blasone, G., Cavalli, M., Marchi, L., and Cazorzi, F. (2014). Monitoring Sediment Source Areas in a Debris-Flow Catchment Using Terrestrial Laser Scanning. Catena 123, 23–36. doi:10.1016/j.catena.2014.07.001
Bonneau, D. A., Hutchinson, D. J., DiFrancesco, P.-M., Coombs, M., and Sala, Z. (2019b). Three-dimensional Rockfall Shape Back Analysis: Methods and Implications. Nat. Hazards Earth Syst. Sci. 19, 2745–2765. doi:10.5194/nhess-19-2745-2019
Bonneau, D. A., Hutchinson, D. J., and McDougall, S. (2019a). “Characterizing Debris Transfer Patterns in the White Canyon, British Columbia with Terrestrial Laser Scanning,” in Debris-Flow Hazards Mitigation: Mechanics, Monitoring, Modeling, and Assessment - Proceedings of the 7th International Conference on Debris-Flow Hazards Mitigation. Editors J. W. Kean, J. A. Coe, P. M. Santi, and B. K. Guillen .
Bonneau, D., DiFrancesco, P.-M., and Hutchinson, D. J. (2019c). Surface Reconstruction for Three-Dimensional Rockfall Volumetric Analysis. Ijgi 8, 548. doi:10.3390/ijgi8120548
Bovis, M. J., and Jakob, M. (1999). The Role of Debris Supply Conditions in Predicting Debris Flow Activity. Earth Surf. Process. Landforms 24, 1039–1054. doi:10.1002/(sici)1096-9837(199910)24:11<1039::aid-esp29>3.0.co;2-u
Brayshaw, D., and Hassan, M. A. (2009). Debris Flow Initiation and Sediment Recharge in Gullies. Geomorphology 109, 122–131. doi:10.1016/j.geomorph.2009.02.021
Coe, J. A., Glancy, P. A., and Whitney, J. W. (1997). Volumetric Analysis and Hydrologic Characterization of a Modern Debris Flow Near Yucca Mountain, Nevada. Geomorphology 20, 11–28. doi:10.1016/S0169-555x(97)00008-1
Coe, J. A., Kinner, D. A., and Godt, J. W. (2008). Initiation Conditions for Debris Flows Generated by Runoff at Chalk Cliffs, Central Colorado. Geomorphology 96, 270–297. doi:10.1016/j.geomorph.2007.03.017
Crosta, G. B., and Frattini, P. (2004). Controls on Modern Alluvial Fan Processes in the Central Alps, Northern Italy. Earth Surf. Process. Landforms 29, 267–293. doi:10.1002/esp.1009
Cucchiaro, S., Cavalli, M., Vericat, D., Crema, S., Llena, M., Beinat, A., et al. (2018). Monitoring Topographic Changes through 4D-Structure-From-Motion Photogrammetry: Application to a Debris-Flow Channel. Environ. Earth Sci. 77, 632. doi:10.1007/s12665-018-7817-4
DiFrancesco, P.-M., Bonneau, D. A., and Hutchinson, D. J. (2021b). Computational Geometry-Based Surface Reconstruction for Volume Estimation: A Case Study on Magnitude-Frequency Relations for a LiDAR-Derived Rockfall Inventory. Ijgi 10, 157. doi:10.3390/ijgi10030157
DiFrancesco, P.-M., Bonneau, D. A., and Hutchinson, D. J. (2021a). “Digital Rockfall Databases: Using LiDAR to Observe over 7-years of Detailed Rockfall Activity in the Thompson-Fraser Rail Corridor,” in Canadian & Cold Regions Rail Research Conference 2021, British Columbia, Canada, November 9 – 10th, 2021.
DiFrancesco, P.-M., Bonneau, D., and Hutchinson, D. J. (2020). The Implications of M3C2 Projection Diameter on 3D Semi-automated Rockfall Extraction from Sequential Terrestrial Laser Scanning Point Clouds. Remote Sens. 12, 1885. doi:10.3390/rs12111885
Ester, M., Kriegel, H.-P., Sander, J., and Xu, X. (1996). “A Density-Based Algorithm for Discovering Clusters in Large Spatial Databases with Noise,” in Knowledge Discovery and Data Mining 1996 (Elsevier), 226–231.
Girardeau-Montaut, D. (2018). CloudCompare. Available at: http://www.cloudcompare.org/.
Greig, C. J. (1989). Geology and Geochronometry of the Eagle Plutonic Complex, Coquihalla Area, Southwestern British Columbia. PhD Thesis (Vancouver, Canada: University of British Columbia).
Hungr, O., Leroueil, S., and Picarelli, L. (2014). The Varnes Classification of Landslide Types, an Update. Landslides 11, 167–194. doi:10.1007/s10346-013-0436-y
Imaizumi, F., Hayakawa, Y. S., Hotta, N., Tsunetaka, H., Ohsaka, O., and Tsuchiya, S. (2017). Relationship between the Accumulation of Sediment Storage and Debris-Flow Characteristics in a Debris-Flow Initiation Zone, Ohya Landslide Body, Japan. Nat. Hazards Earth Syst. Sci. 17, 1923–1938. doi:10.5194/nhess-17-1923-2017
Imaizumi, F., Masui, T., Yokota, Y., Tsunetaka, H., Hayakawa, Y. S., and Hotta, N. (2019). Initiation and Runout Characteristics of Debris Flow Surges in Ohya Landslide Scar, Japan. Geomorphology 339, 58–69. doi:10.1016/j.geomorph.2019.04.026
Imaizumi, F., Trappmann, D., Matsuoka, N., Tsuchiya, S., Ohsaka, O., and Stoffel, M. (2016). Biographical Sketch of a Giant: Deciphering Recent Debris-Flow Dynamics from the Ohya Landslide Body (Japanese Alps). Geomorphology 272, 102–114. doi:10.1016/j.geomorph.2015.11.008
Iverson, R. M., and George, D. L. (2019). “Valid Debris-Flow Models Must Avoid Hot Starts,” in Debris-Flow Hazards Mitigation: Mechanics, Monitoring, Modeling, and Assessment - Proceedings of the 7th International Conference on Debris-Flow Hazards Mitigation. Editors J. W. Kean, J. A. Coe, P. M. Santi, and B. K. Guillen (Golden, CO, 565–572. doi:10.25676/11124/173241
Jakob, M., Bovis, M., and Oden, M. (2005). The Significance of Channel Recharge Rates for Estimating Debris-Flow Magnitude and Frequency. Earth Surf. Process. Landforms 30, 755–766. doi:10.1002/esp.1188
Jakob, M., Holm, K., and McDougall, S. (2016). Debris-Flow Risk Assessment. Oxford University Press. doi:10.1093/acrefore/9780199389407.013.37
Jakob, M., and Hungr, O. (2005). In Debris-flow Hazards and Related Phenomena. Editors M. Jakob, and O. Hungr (Springer). doi:10.1007/3-540-27129-5_14
Jakob, M. (1996). Morphometric and Geotechnical Controls of Debris Flow Frequency and Magnitude in Southwestern British Columbia. PhD Thesis. Vancouver, Canada: University of British Columbia.
Johnson, A. M., and Rodine, J. R. (1984). “Debris Flow,” in Slope Instability. Editors D. Brunsden, D. B. Prior, and U. K. Chicheste (John Wiley & Sons), 257–361.
Jolivet, D., MacGowan, T., McFadden, R., and Steel, M. (2015). Slope Hazard Assessment Using Remote Sensing in White Canyon, Lytton, BC. Capstone Design Report. Kingston, ON: Queen’s University.
Kean, J. W., McCoy, S. W., Tucker, G. E., Staley, D. M., and Coe, J. A. (2013). Runoff-generated Debris Flows: Observations and Modeling of Surge Initiation, Magnitude, and Frequency. J. Geophys. Res. Earth Surf. 118, 2190–2207. doi:10.1002/jgrf.20148
Kromer, R. A., Abellán, A., Hutchinson, D. J., Lato, M., Chanut, M.-A., Dubois, L., et al. (2017). Automated Terrestrial Laser Scanning with Near-Real-Time Change Detection - Monitoring of the Séchilienne Landslide. Earth Surf. Dynam. 5, 293–310. doi:10.5194/esurf-5-293-2017
Kromer, R. A., Hutchinson, D. J., Lato, M. J., Gauthier, D., and Edwards, T. (2015). Identifying Rock Slope Failure Precursors Using LiDAR for Transportation Corridor Hazard Management. Eng. Geol. 195, 93–103. doi:10.1016/j.enggeo.2015.05.012
Lague, D., Brodu, N., and Leroux, J. (2013). Accurate 3D Comparison of Complex Topography with Terrestrial Laser Scanner: Application to the Rangitikei Canyon (N-Z). ISPRS J. Photogrammetry Remote Sens. 82, 10–26. doi:10.1016/j.isprsjprs.2013.04.009
Loye, A., Jaboyedoff, M., Theule, J. I., and Liébault, F. (2016). Headwater Sediment Dynamics in a Debris Flow Catchment Constrained by High-Resolution Topographic Surveys. Earth Surf. Dynam. 4, 489–513. doi:10.5194/esurf-4-489-2016
Morino, C., Conway, S. J., Balme, M. R., Hillier, J., Jordan, C., Saemundsson, Þ., et al. (2018). Debris-flow Release Processes Investigated through the Analysis of Multi-Temporal LiDAR Datasets in North-Western Iceland. Earth Surf. Process. Landforms 44, 144–159. doi:10.1002/esp.4488
Oppikofer, T. (2009). PhD Thesis. Lausanne, Switzerland: University of Lausanne. Detection, Analysis and Monitoring of Slope Movements by High-Resolution Digital Elevation Models.
Pacific Consortium Climate Impacts (2021). Data Portal: BC Station Data. BC Stn. Data. Available at: https://www.pacificclimate.org/data/bc-station-data (Accessed June 20, 2020).
Pierson, T. C. (1980). Erosion and Deposition by Debris Flows at Mt Thomas, North Canterbury, New Zealand. Earth Surf. Process. 5, 227–247. doi:10.1002/esp.3760050302
Scheidl, C., Rickenmann, D., and Chiari, M. (2008). The Use of Airborne LiDAR Data for the Analysis of Debris Flow Events in Switzerland. Nat. Hazards Earth Syst. Sci. 8, 1113–1127. doi:10.5194/nhess-8-1113-2008
Schürch, P., Densmore, A. L., Rosser, N. J., Lim, M., and Mcardell, B. W. (2011). Detection of Surface Change in Complex Topography Using Terrestrial Laser Scanning: Application to the Illgraben Debris-Flow Channel. Earth Surf. Process. Landforms 36, 1847–1859. doi:10.1002/esp.2206
Smith, M. W., Carrivick, J. L., and Quincey, D. J. (2016). Structure from Motion Photogrammetry in Physical Geography. Prog. Phys. Geogr. Earth Environ. 40, 247–275. doi:10.1177/0309133315615805
Theule, J. I., Liébault, F., Laigle, D., Loye, A., and Jaboyedoff, M. (2015). Channel Scour and Fill by Debris Flows and Bedload Transport. Geomorphology 243, 92–105. doi:10.1016/j.geomorph.2015.05.003
Theule, J. I., Liébault, F., Loye, A., Laigle, D., and Jaboyedoff, M. (2012). Sediment Budget Monitoring of Debris-Flow and Bedload Transport in the Manival Torrent, SE France. Nat. Hazards Earth Syst. Sci. 12, 731–749. doi:10.5194/nhess-12-731-2012
van Veen, M., Hutchinson, D. J., Kromer, R., Lato, M., and Edwards, T. (2017). Effects of Sampling Interval on the Frequency - Magnitude Relationship of Rockfalls Detected from Terrestrial Laser Scanning Using Semi-automated Methods. Landslides 14, 1579–1592. doi:10.1007/s10346-017-0801-3
Volkwein, A., Schellenberg, K., Labiouse, V., Agliardi, F., Berger, F., Bourrier, F., et al. (2011). Rockfall Characterisation and Structural Protection—A Review. Nat. Hazards Earth Syst. Sci. 11, 2617–2651. doi:10.5194/nhess-11-2617-2011
Westoby, M. J., Brasington, J., Glasser, N. F., Hambrey, M. J., and Reynolds, J. M. (2012). 'Structure-from-Motion' Photogrammetry: A Low-Cost, Effective Tool for Geoscience Applications. Geomorphology 179, 300–314. doi:10.1016/j.geomorph.2012.08.021
Williams, J. G., Rosser, N. J., Hardy, R. J., Brain, M. J., and Afana, A. A. (2018). Optimising 4-D Surface Change Detection: an Approach for Capturing Rockfall Magnitude-Frequency. Earth Surf. Dynam. 6, 101–119. doi:10.5194/esurf-6-101-2018
Williams, J. G., Rosser, N. J., Hardy, R. J., and Brain, M. J. (2019). The Importance of Monitoring Interval for Rockfall Magnitude‐Frequency Estimation. J. Geophys. Res. Earth Surf. 124 (12), 2841–2853. doi:10.1029/2019JF005225
Zhou, Q.-Y., Park, J., and Koltun, V. (2018). Open3D: A Modern Library for 3D Data Processing. Available at: http://arxiv.org/abs/1801.09847.
Keywords: debris-flow, rockfall, laser scanning, channel, erosion, deposition, change detection
Citation: Bonneau DA, Hutchinson DJ, McDougall S, DiFrancesco P-M and Evans T (2022) Debris-Flow Channel Headwater Dynamics: Examining Channel Recharge Cycles With Terrestrial Laser Scanning. Front. Earth Sci. 10:883259. doi: 10.3389/feart.2022.883259
Received: 24 February 2022; Accepted: 16 June 2022;
Published: 25 August 2022.
Edited by:
Douglas Stead, Simon Fraser University, CanadaReviewed by:
Nick Rosser, Durham University, United KingdomFabio Matano, National Research Council (CNR), Italy
Copyright © 2022 Bonneau, Hutchinson, McDougall, DiFrancesco and Evans. This is an open-access article distributed under the terms of the Creative Commons Attribution License (CC BY). The use, distribution or reproduction in other forums is permitted, provided the original author(s) and the copyright owner(s) are credited and that the original publication in this journal is cited, in accordance with accepted academic practice. No use, distribution or reproduction is permitted which does not comply with these terms.
*Correspondence: David A. Bonneau, ZGF2aWQuYm9ubmVhdUBxdWVlbnN1LmNh