 Sri Budhi Utami
 Juan Andùjar
 Fidel Costa
 Bruno Scaillet
 Hanik Humaida
 Simon Carn
- 1Asian School of the Environment, Nanyang Technological University, Singapore, Singapore
- 2Institut des Sciences de La Terre Orléans (ISTO), CNRS-Université D’Orléans-BRGM, Orléans, France
- 3Earth Observatory of Singapore, Singapore, Singapore
- 4Université Paris Cité, Institut de Physique Du Globe de Paris, CNRS, Paris, France
- 5Balai Penyelidikan Dan Perkembangan Teknologi Kebencanaan Geologi, Yogyakarta, Indonesia
- 6Michigan Technological University, Houghton, MI, United States
Understanding the role of various factors influencing eruption style is challenging, but it can aid in adapting different hazard mitigations and crisis responses for explosive or effusive events. Here, we focus on the role of magma storage conditions in controlling eruption styles at basaltic andesite volcanoes, and how they can be related to monitoring data. We study the cycle of explosive (1990, sub-Plinian) → effusive (2007, dome) → explosive (2014, sub-Plinian) eruptions from Kelud (Kelut) volcano, Indonesia. We conducted petrological analyses of the eruption products and phase equilibria experiments using pumice and explored a range of temperatures, pressures, oxygen fugacity, and volatile contents. We show that we can reproduce the main mineral assemblage (plagioclase ± pyroxenes ± magnetite ± amphibole ± olivine) and phenocryst content (30–50 wt%) of the magmas from the three eruptions at T = 975 ± 39°C, p = 175 ± 25 MPa, fO2 = nickel–nickel oxide buffer, and about 4–6 wt% water in the melt (ca. 3 to 5 wt% and ca. 4 to 7 wt% for the 1990 and 2014 eruptions, respectively). However, geothermobarometric results also indicate that some crystals of amphibole were sourced from higher pressures. We infer from a synthesis of our data and historical observations that the high phenocryst content of the 2007 dome (∼70 wt%) likely resulted from slow magma ascent toward the surface alongside progressive degassing and re-equilibration at a lower volatile content (∼1 wt% water in the melt). Mass balance calculations on the sulfur budget of the 1990, 2007, and 2014 magmas show that the explosive events contained an excess fluid phase at pre-eruptive conditions, and we propose that this led to their higher explosivity compared to the 2007 dome. The accumulation of excess fluids during decadal-long repose depends on how plugged the volcanic system is, or its ability to passively release magmatic fluids, prior to eruption. Such condition could be inferred from monitoring records, including changes in gravity of the plumbing system over time, and thus contribute to better anticipate eruptive style.
1 Introduction
Volcanoes can display a range of eruption styles, spanning from small phreatic events and dome growth to explosive events with tall eruptive columns. Moreover, changes can occur between consecutive eruptions from the same volcano, or within a single eruption. Some well-known examples of volcanoes that display large variations in eruptive styles between eruptions include Merapi (Indonesia; Surono et al., 2012), Soufrière Hills (Montserrat; Young et al., 1998), and Mt. St. Helens (United States; Pallister et al., 1992). Examples of how a single volcanic eruption can also rapidly transform from effusive to explosive and vice versa were observed in the 1991 Pinatubo eruption (Bernard et al., 1996; Pallister et al., 1996; Scaillet and Evans, 1999), the 2009 eruption at Redoubt (Bull and Buurman, 2013), the 2011 eruption at Puyehue-Cordón Caulle (Jay et al., 2014; Elissondo et al., 2016). The changes in eruptive style between eruptions are typically abrupt and difficult to anticipate, which makes the mitigation of associated hazards necessary but incredibly challenging.
Changes in eruptive styles can be due to a range of factors. For example, effusive to explosive eruption transition within an eruptive period can be driven by syn-eruptive processes related to water exsolution from the melt and microlite crystallization, which can induce rapid changes in physical properties of the magma that dramatically alter its potential for explosivity in the conduit (Woods and Koyaguchi, 1994; Melnik and Sparks, 2002; 1999). The magma’s density, viscosity, and ascent rate change as the magma moves toward the surface and goes through the brittle–ductile transition (Dingwell et al., 1993; Cashman and Sparks, 2013). The evolution of these parameters is inter-related as a high volatile content in the melt that can produce a buoyant magma, which may accelerate during ascent as long as the volatile bubbles and magma do not decouple (Corsaro and Pompilio, 2004).
The physical and chemical properties of the magmas before ascent can be primed at their pre-eruptive storage zones. This includes the storage pressure, temperature, crystallinity, melt composition, and dissolved volatile contents. The pre-eruptive volatile content of the melt is particularly important in determining how parameters change, namely, the magma viscosity, buoyancy, and ascent rate (Giordano et al., 2008; Gonnermann and Manga, 2013; Cassidy et al., 2018). In addition, the presence of an excess volatile phase at pre-eruptive conditions due to second boiling (Sisson and Bacon, 1999) and volatile fluxing (Caricchi et al., 2018) has also been shown to be important in driving explosive eruptions (Scaillet and Evans, 1999; Shinohara, 2008; Longpré et al., 2014; Edmonds and Woods, 2018), although it may have the opposite effect and lead to effusive eruptions (Popa et al., 2021; 2020). Yet it is still unclear whether the build-up of excess volatiles in the magma can influence the style of consecutive eruptions, and how these relate to unrest records.
In this study, we experimentally investigate the crystallization conditions and processes of the explosive-effusive-explosive eruptions of Kelud volcano (Indonesia), as exemplified by the 1990, 2007, and 2014 events. We also report new petrological observations and calculate mineral-melt geothermobarometers that we combine with experimental results to constrain the pre-eruptive storage conditions of the three eruptions. We found that the magmas that fed the 1990, 2007, and 2014 events were essentially stored at similar temperatures, pressures, and water content in the melt. Comparison of the S emissions to the atmosphere by satellite data with those degassed from the melt suggest that the explosivity of the 1990 and 2014 eruptions was driven by the presence of an exsolved excess volatile phase prior to eruption, which was lacking in the 2007 dome eruption. The existence of an exsolved phase at the source likely induced higher buoyancy and faster ascent rates compared to the slower ascent, enhanced degassing, and subsequent re-equilibration of the magma toward the surface that ultimately produced a dome in 2007.
2 Kelud volcano and an overview of the 1990, 2007, and 2014 eruptions
Kelud (Kelut) volcano is an active basaltic-andesite semi-plugged composite strato-cone complex situated in East Java, Indonesia (Wirakusumah, 1991; Whelley et al., 2015). The volcano hosts a persistent circum-neutral crater lake during repose (Bernard and Mazot, 2004), and explosive eruptions typically generate syn-eruptive and post-eruptive cold lahars (Thouret et al., 1998). Kelud typically generates short-lived explosive eruptions that escalate from the onset of unrest to eruption in mere hours (Lesage and Surono, 1995; Global Volcanism Program, 2013; Maeno et al., 2019a). Kelud has erupted at least 32 times in the last 100 years (Global Volcanism Program, 2013), but here we focus on the last three eruptions in 1990, 2007, and 2014.
The 1990 explosive eruption began after ∼3 months of unrest followed by quiescence for ∼3 weeks (Bourdier et al., 1997a; 1997b). The final escalation toward eruption occurred in hours, giving communities only 1 hour to evacuate their homes (Global Volcanism Program, 1990a). The explosive eruption in 2014 largely followed a similar pattern in terms of duration of heightened unrest period of the 1990 eruption, although this was condensed into 1 month starting in January 2014. The final escalation toward eruption in 2014 was a steep increase in seismicity of only a few hours (Hidayati et al., 2019). These 1990 and 2014 events generated eruptive columns as high as 10–17 km (Bourdier et al., 1997a; Kristiansen et al., 2015; Nakashima et al., 2016) with a VEI of 4 and dense rock equivalent (DRE) volumes of 6.3 × 10⁷ m3 (1990) and 2.1 × 10⁸ m3 (2014), respectively (Maeno et al., 2019a). Moreover, the eruptions were short-lived and volcanic activity and unrest returned to background levels within days to weeks of the main eruptive phase (Global Volcanism Program, 1990b; Global Volcanism Program, 2014; Global Volcanism Program 1990b).
The lava dome extrusion of November 2007 was preceded by some unrest that started as early as January 2007 (Lubis, 2014), with up to 11 cm of inflation around the summit region detected using ALOS-PALSAR interferometric synthetic aperture radar (InSAR). From July to August 2007, unrest involved intense degassing on the lake floor and an increase in seismicity (Hidayati et al., 2019), and lake temperature rising up (from ∼30 to ∼75°C), as well as heightened CO2 emissions from the lake (Global Volcanism Program, 2007; Kunrat, 2009; Caudron et al., 2012). Continuous seismic unrest started around September 2007, involving multiple swarms and low frequency earthquakes (Hidayati et al., 2009). The seismic unrest was further accompanied by inflation from 9th October until 3rd November, when the signal changed to deflation and gave way to slow dome extrusion (Hidayati et al., 2019). The 2007 dome was 200 m high and 400 m wide, with a volume of 3.5 × 10⁷ m3, which is about half the volume of the 1990 eruption (Global Volcanism Program, 2008), but about one order of magnitude smaller than the 2014 event (Maeno et al., 2019a). Despite the diverse monitoring data available, it is still difficult to anticipate eruptions at Kelud, including whether the ensuing eruption will be effusive or explosive (Nakamichi et al., 2017), and this is the main subject of our study.
3 Materials and methods
We conducted petrological analyses of two 2007 dome fragments, previously studied in Humaida (2013), two pumices were sampled following the 2014 eruption (sampled by H. Humaida), and it included the data from the six main-stage pumices from the 1990 eruption studied in Utami et al. (2021). We chose one basaltic andesite pumice from the 1990 eruption studied by Utami et al. (2021) (KELUD1990PL1, or ‘PL1’) as the starting material for our phase equilibria experiments. The pumice had the same mineral assemblage as other samples, except for the absence of olivine.
3.1 Selection of experimental conditions
We experimentally investigated a range of intensive variables that includes the estimates from mineral-melt geothermobarometers (Utami et al., 2021). We varied the temperature from 950 to 1,060°C, pressure from 100 to 400 MPa, fO2 at the Ni–NiO buffer (NNO) and up to two log units above (NNO +2), and varied a volatile composition in the capsule from pure water to pure CO2 (see below for more details).
3.2 Preparation of experimental charges
A starting glass was prepared by finely crushing the pumice using a ceramic mortar and pestle and homogenized by fusing the powder at 1,400°C and atmospheric pressure for around 6 h in a standard thermconcept furnace at 1750°C. EPMA analyses of the fused glass confirmed that the glass was homogenous and of the same composition as the whole rock. This glass was crushed again to a fine dry powder with an agate mortar and pestle, which was used as a starting material for all phase equilibrium experiments. About 0.03 g of dry glass was loaded in Au capsules (of size 10–15 mm × 2.5 × 0.2 mm wall thickness) for the 950 and 1,000°C experiments, whereas Au–Pd capsules were used for the 1,060°C experiments.
We varied the fluid composition in the charges (referred to as XH2Oin = initial H2O/[H2O+ CO2] in moles) from 0 to 1 by adding various amounts of deionized water and CO2 (in the form of silver oxalate) to the dry glass powder, according to the methodology of Scaillet et al. (1995). All the successful runs were fluid saturated. The capsules were arc-welded and weighed before being stored in a 60°C oven to homogenize the fluid content for 6–12 h. After each experiment, the capsule was re-weighed again to check for fluid loss during storage and subsequent experiments. To determine whether the charges were properly sealed, their weight had to be within 0.0005 g of the original value, which is the precision of the analytical balance. We observed that capsules from successfully quenched experiments were shrunk and flattened but had the same weight as before the experiment. Upon opening, the charges ejected gas with an audible pop. In contrast, failed charges appeared bloated and commonly showed a difference in mass (>0.0005 g) between before and after the experiments.
3.3 Experimental equipment
All experiments were conducted at the Institut de Sciences de la Terre Orléans, France using internally heated pressure vessels (IHPV), following the procedure outlined in Scaillet and Evans (1999). Argon was used as a pressurizing medium mixed with different H2 concentrations at room temperature to establish different fO2 conditions (ranging from NNO to NNO +2), and using a Shaw membrane to establish and maintain the fH2 osmotic equilibrium (Scaillet et al., 1992). A factory calibrated pressure transducer was used to measure and monitor pressure (±2 MPa), whereas temperature was monitored with unsheathed type-S thermocouples, and the temperature of the IHPV “hotspot” was maintained at T < 10°C and with an uncertainty of ±5°C (Scaillet et al., 1992). Experiment temperatures were increased from room temperature directly up to run temperature in around an hour: each experimental run contained around 4–7 capsules, including one sensor for fO2 (see below). Once the target conditions were achieved, experiments were run for 18–66 h. Experiments were terminated with a drop-quench device, allowing the sample holder to fall in the cold part of the vessel at the bottom (<50°C), ensuring isobaric quenching and cooling rates of 100°C/s. A fast quench device was set up as part of the experiments (Roux and Lefèvre, 1992). Previous studies (Scaillet and Evans, 1999; Prouteau and Scaillet, 2003; Costa et al., 2004; Andújar et al., 2013) have shown that crystal-melt equilibrium is attained using the same set of protocols. General observations of equilibrium include homogeneous glass composition within the charge, lack of chemical zoning in experimental crystals, and systematic changes in petrologic variables (e.g., crystal content) with experimental variables (temperature and water content). Equilibrium, rather than quench-textures, are characteristic of the run products we report, and we believe they reflect attainment of chemical equilibrium at the desired run conditions.
3.4 Calculation of fO2 and dissolved water content in experimental charges
The oxygen fugacity (fO2) was calculated using a sensor capsule containing two water-saturated (10 mg added water), hand-pressed Ni–Pd–NiO powder pellets separated by inert ZrO powder (Taylor et al., 1992). We forgot to add a sensor capsule for one experimental run (T = 1,060°C, p = 200 MPa), and thus the final calculated fO2 for the fluid saturated charge (XH2Oin = 1.0) is the average fO2 of the two closest isobaric runs (T = 1,060°C, p = 100 and 400 MPa). For unsaturated charges, we calculated the fO2 according to the following formula employed by Scaillet and Evans (1999):
where fO2 (charge) is the calculated oxygen fugacity of the charge, fO2 (sensor) is the sensor oxygen fugacity, and the
We also compared our dissolved water contents with water contents calculated using the mixed H2O–CO2 ‘MagmaSat’ model of Ghiorso and Gualda (2015) using VESIcal (v. 1.0.1; Iacovino et al., 2021). The differences between our initial calculation and MagmaSat model were ≤1 wt% (see Supplementary Material), which use as the nominal error in the water contents we reported. We used the 1σ of this difference as the error in the water content. To maintain consistency in other water contents reported, we calculated the saturation pressures with the same model. To do this, we also used VESIcal (v. 1.0.1; Iacovino et al., 2021) to calculate the saturation pressure with the hybridized models of Shishkina et al. (2010) pure H2O and Dixon (1997, “VolatileCalc”) pure CO2 model for all three eruptions. This hybridized model simulated the models we used to calculate the water content in the melt. We find that the differences are <300 bars or <30 MPa, which was within error of mineral-melt geobarometers.
3.5 Analytical techniques
Whole-rock analyses of samples, including the pumice starting material, were ground and fused into a lithium tetraborate disk before being analyzed for whole rock major element oxide compositions using X-ray fluorescence (XRF) at the Activation Laboratory in Ancaster, Canada, following the approach outlined in Norrish and Hutton (1969). Mineral proportions were obtained by counting the phenocryst content, using JMicrovision software on plain polarized images of the entire thin section (for the 1990 samples), and using a Pelcon mechanical point counting stage (for the 2007 and 2014 samples). For each sample, we counted between ca. 1,400–1,600 points to ensure statistically significant results with relative errors of <10%. Results from point counting (Table 2) and mineral compositions (Table 3) allowed us to determine the composition of the calculated matrix of the 1990, 2007, and 2014 samples (Table 1) by subtracting the mineral compositions weighted with their proportions from the whole rock compositions. Such calculations were necessary to remove the effect of the extensive microlite crystallization for the 2007 dome and to compare with experimental glass. We also used the calculated matrix for geothermobarometric calculations.
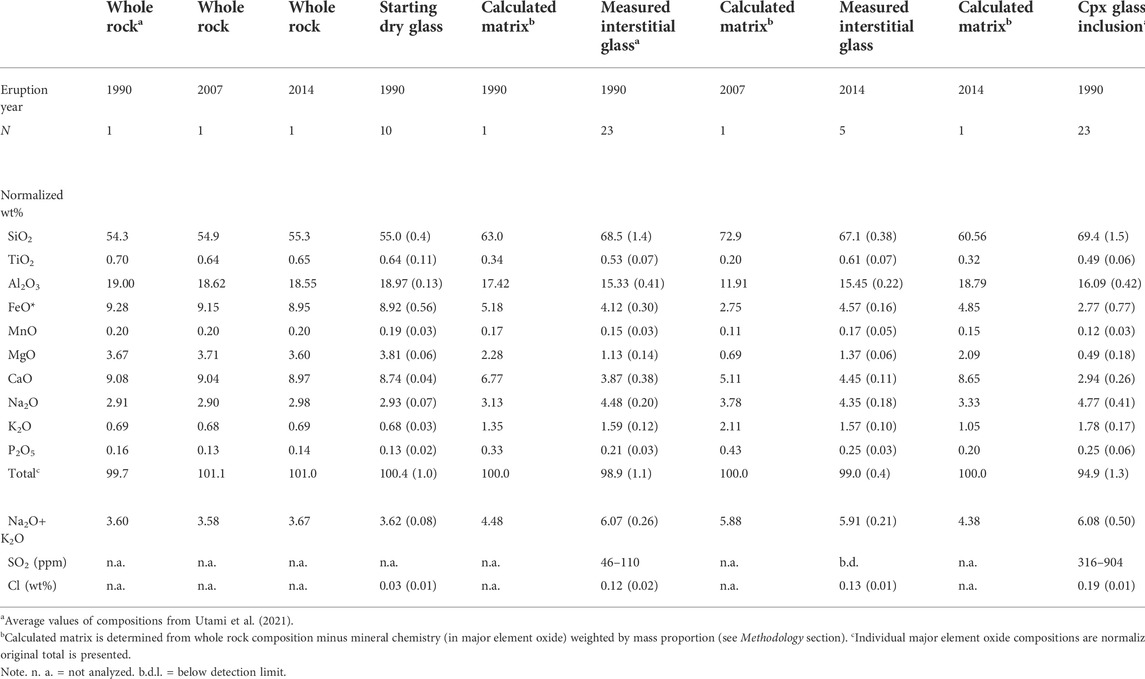
TABLE 1. Representative whole rock and glass compositions for the starting glass, whole rock, clinopyroxene-hosted melt inclusions, and interstitial glass from the 1990, 2007, and 2014.
We made general observations of experimental charges and identified phases using the scanning electron microscope (SEM) at ISTO-Orléans, France and the Earth Observatory of Singapore. From these images, we determined the crystal content of the experimental charges by thresholding the greyscale of multiple back-scattered electron (BSE) images of a charge map using ImageJ, and we estimated the volumetric area of phases in all charges. With these results, we calculated the mass proportions of the main minerals using standard mineral densities.
Minerals and glass from natural samples and experimental charges were analyzed for their chemical compositions on the JEOL JXA-8530F electron microprobe (EPMA) at the Facility for the Analyses Characterization, Testing, and Simulation (FACTS), Nanyang Technological University, Singapore. Analyses of orthopyroxene, clinopyroxene, olivine, and Fe–Ti oxides were performed on the EPMA in spot mode with 15 kV accelerating voltage, beam size of 1 μm, and 20 nA beam current. Amphibole and plagioclase were analyzed in spot mode with 15 kV accelerating voltage, beam size of 1 μm, and 10 nA current. Glass was analyzed in spot mode with 6 kV, beam size of 10 μm, and 5 nA current. The same conditions and procedures were used to observe and analyze the glasses and minerals of the 2007 and 2014 rocks. For clinopyroxene-hosted glass inclusions, we corrected for post-entrapment crystallization of the melt inclusion walls (Bucholz et al., 2013). The relative errors for glasses are 0.4–0.8% for SiO2, Al2O3, and CaO; 1–3% for MgO, FeO, Na2O, K2O; and 9–41% MnO, TiO2, P2O5, and Cl. For pyroxenes, the relative errors are 0.2–1.0% for SiO2, Al2O3, CaO, MgO, FeO; 1–30% for Na2O and K2O; and 2–55% MnO, TiO2, and Cr2O3. Relative errors for Fe–Ti oxide analyses are 0.3–0.6% for FeO, 0.5–7.5% for TiO2, 0.5–1.8% for MgO. For olivine analyses are 0.2–0.5% SiO2, MgO, FeO; and 0.8–18% Al2O3, CaO, MnO. The relative error for amphibole analysis is 0.3–0.8% for SiO2, Al2O3, CaO, FeO, MgO; 4.2–4.4% MnO, TiO2; and 11–30% for Na2O and K2O.
The mineral end-members were calculated using their molar compositions as in Utami et al. (2021), and with formulations according to Deer et al. (1992). Pyroxenes are characterized with the Mg # (Mg # = 100 × Mg/[Mg + Fe*] in mol, where Fe* is total iron as Fe2+). We further characterize pyroxenes using their wollastonite (Wo = 100 × Ca/[Ca + Mg + Fe*]), ferrosilite (Fs = 100 × Fe/[Ca + Mg + Fe*]), and enstatite (En = 100 × Mg/[Ca + Mg + Fe*]) endmembers. Plagioclase end member compositions were classified using their molar compositions for anorthite (An = 100 × Ca/[Ca + Na + K]), albite (Ab = 100 × Na/[Ca + Na + K]), and orthoclase (Or = 100 × K/[Ca + Na + K]). Olivine is characterized using the forsterite content (Fo = 100 × Mg/[Mg + Fe*]), whereas amphibole is classified according to the compositional end-members outlined in Leake et al. (1997), as determined by Ridolfi et al. (2010). Glass compositions were characterized using their normalized to 100% anhydrous major element oxides and total alkali-silica (TAS) composition. It was difficult to obtain good quantitative analyses of plagioclase crystals in experimental charges as they are typically small and may contain Fe–Ti oxide inclusions. To be able to report approximate An contents of plagioclase, we have filtered for analyses with FeO* < 1 wt% and TiO2 < 0.1 wt%, and subtracted the composition of magnetite from the electron microprobe analyses to match these constraints. We report these recalculated compositions to fit the structural formulas labeled ‘-N.’
3.6 Remote sensing of SO2 emissions
To evaluate sulfur dioxide (SO2) emissions from Kelud during the 2007 effusive eruption, we used ultraviolet (UV) satellite data from the Ozone Monitoring Instrument (OMI) on NASA’s Aura satellite. Aura/OMI was launched in 2004 and has a spatial resolution at nadir of 13×24 km and high sensitivity to atmospheric SO2, permitting detection of small plumes emitted by weak or passive volcanic degassing (Carn et al., 2016). OMI measurements since 2004 have provided a long-term record of passive and eruptive volcanic SO2 emissions that continues to the present (Carn et al., 2017, 2016; Carn, 2022). Column amounts of SO2 are derived from the UV OMI measurements using a low-noise principal component analysis (PCA) retrieval algorithm (Li et al., 2017); the SO2 column amounts measured in a volcanic plume are integrated to obtain SO2 mass. The OMI SO2 retrievals are altitude-dependent, and here we assume a lower tropospheric (TRL) SO2 plume altitude (∼3 km above sea level) to approximate the expected volcanic plume altitudes at Kelud (summit elevation ∼2 km). The results presented here are the first detailed analysis of OMI SO2 measurements for the 2007 Kelud eruption.
We note that Kelud was not identified as a major source of persistent volcanic SO2 emissions in the 2005–2015 period covered by the global inventory of Carn et al. (2017), indicating that passive SO2 emissions from the volcano are generally absent or below OMI detection limits (∼20–80 tons/day). However, Semeru, Bromo, Raung and Kawah Ijen volcanoes, located to the east of Kelud, are all persistently active (Carn et al., 2017), and their SO2 plumes are often advected west over the Kelud region, which can impact the detection of Kelud’s SO2 emissions in an easterly wind regime. Frequent cloud cover and convection over the higher elevations of East Java can also hamper the detection of volcanic SO2 emissions by OMI.
4 Results
4.1 Petrological observations and geothermobarometry of the 1990–2007–2014 magmas
We document petrological observations and calculate geothermobarometric estimates from the deposits of the 1990, 2007, and 2014 eruptions. Whole rock major elements vary over a small range across eruptions, and samples are classified as basaltic andesite (Table 1). The calculated matrix compositions, the measured interstitial glasses, and clinopyroxene-hosted melt inclusions are of a similar dacitic composition (see Utami et al., 2021). The three eruptions have deposits with different phenocryst (>100 µm) content: 31–47 wt% in the 1990 pumices; 70–72 wt% for the 2007 dome; and 29–35 wt% in 2014 pumices (Table 2). The mineral assemblage for all three eruptions includes phenocrysts of plagioclase (Plag), clinopyroxene (Cpx), orthopyroxene (Opx), and magnetite (Mag).
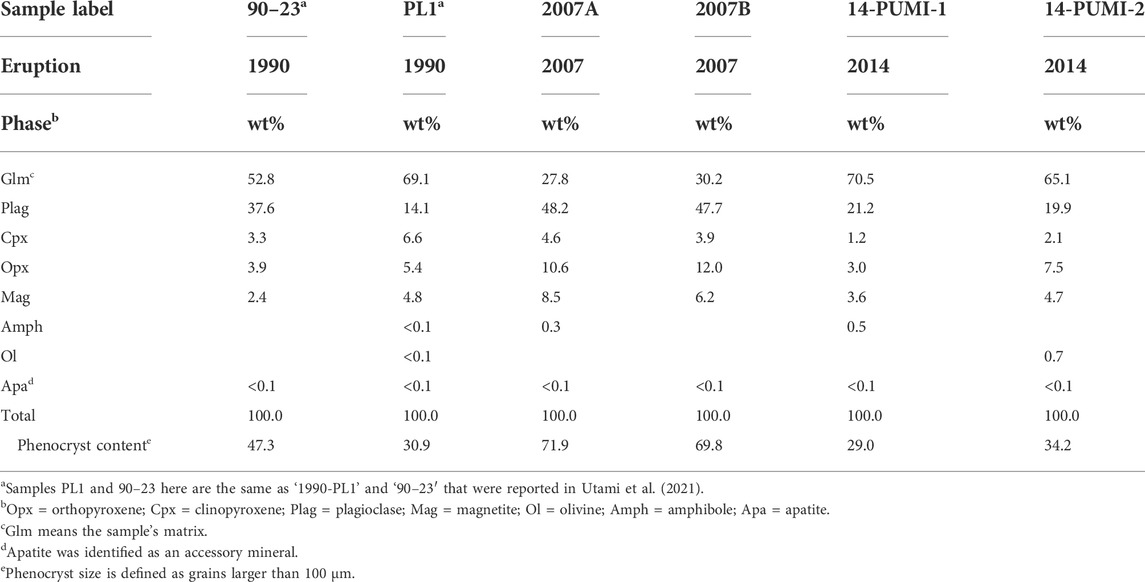
TABLE 2. Mineral assemblage and phenocryst content of samples from 1990, 2007, and 2014 eruptions.
Accessory minerals include apatite (Apa), which is found in all three eruptions. Quartz (Qz)-rich enclaves occur in the 1990 late-stage pumice; cristobalite (Crs) is found as vesicle infill in the 2007 dome samples (see Supplementary Figure S3). Ilmenite (Ilm) is present as rims around Mag in the 1990 late-stage pumice and as exsolution lamellae in Mag in the 2007 deposits (see Supplementary Material). The 1990 and 2014 pumices also host partially reacted amphibole (Amph), and we have also identified pseudomorphs of Amph megacrysts and symplectites after Ol breakdown in the 2007 dome, meaning that both Amph and Ol may have also been stable in the 2007 magma (see Supplementary Figure S3). We also found partially reacted olivine (Ol) microphenocrysts (<100 µm) in the 2014 pumice. The compositions of the main minerals of the three eruptions are also broadly similar, with the histograms of compositional mineral indicators (e.g., Mg Number) typically overlap for the three eruptions (Figures 1A–C; Table 3) and are also similar to those of previous studies from the same eruptions (e.g., Jeffery et al., 2013; Cassidy et al., 2019; 2016).
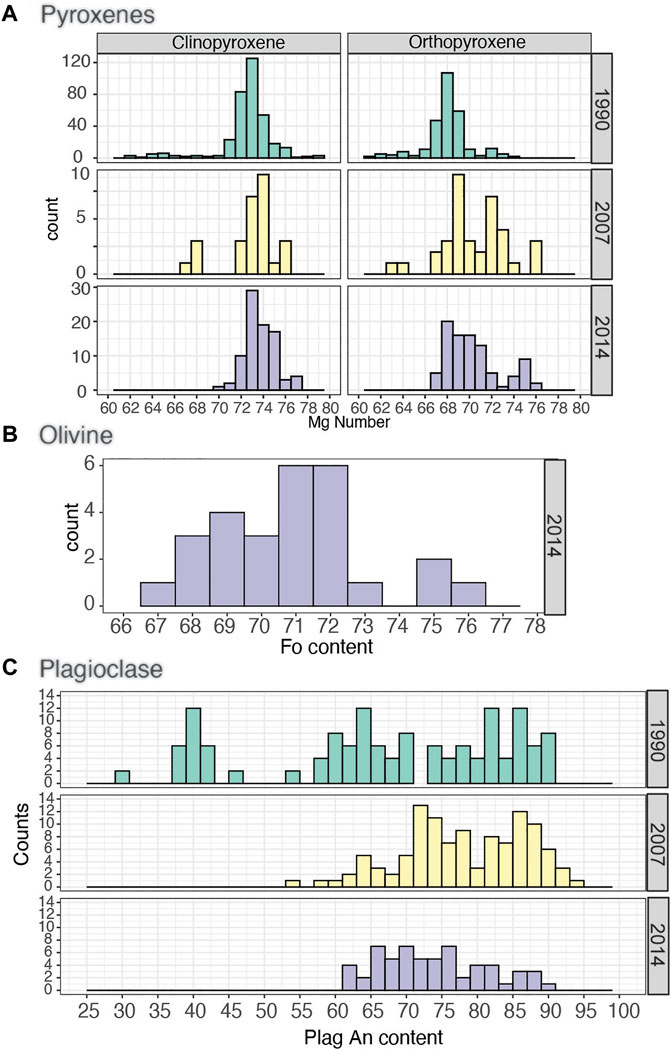
FIGURE 1. Histograms of representative mineral compositions from the 1990–2014 eruptions (A) pyroxenes, (B) olivine, and (C) plagioclase. Plagioclase composition from the 2014 eruption comes from a combination of this study and Cassidy et al. (2016) and those of the 1990 from Utami et al. (2021).
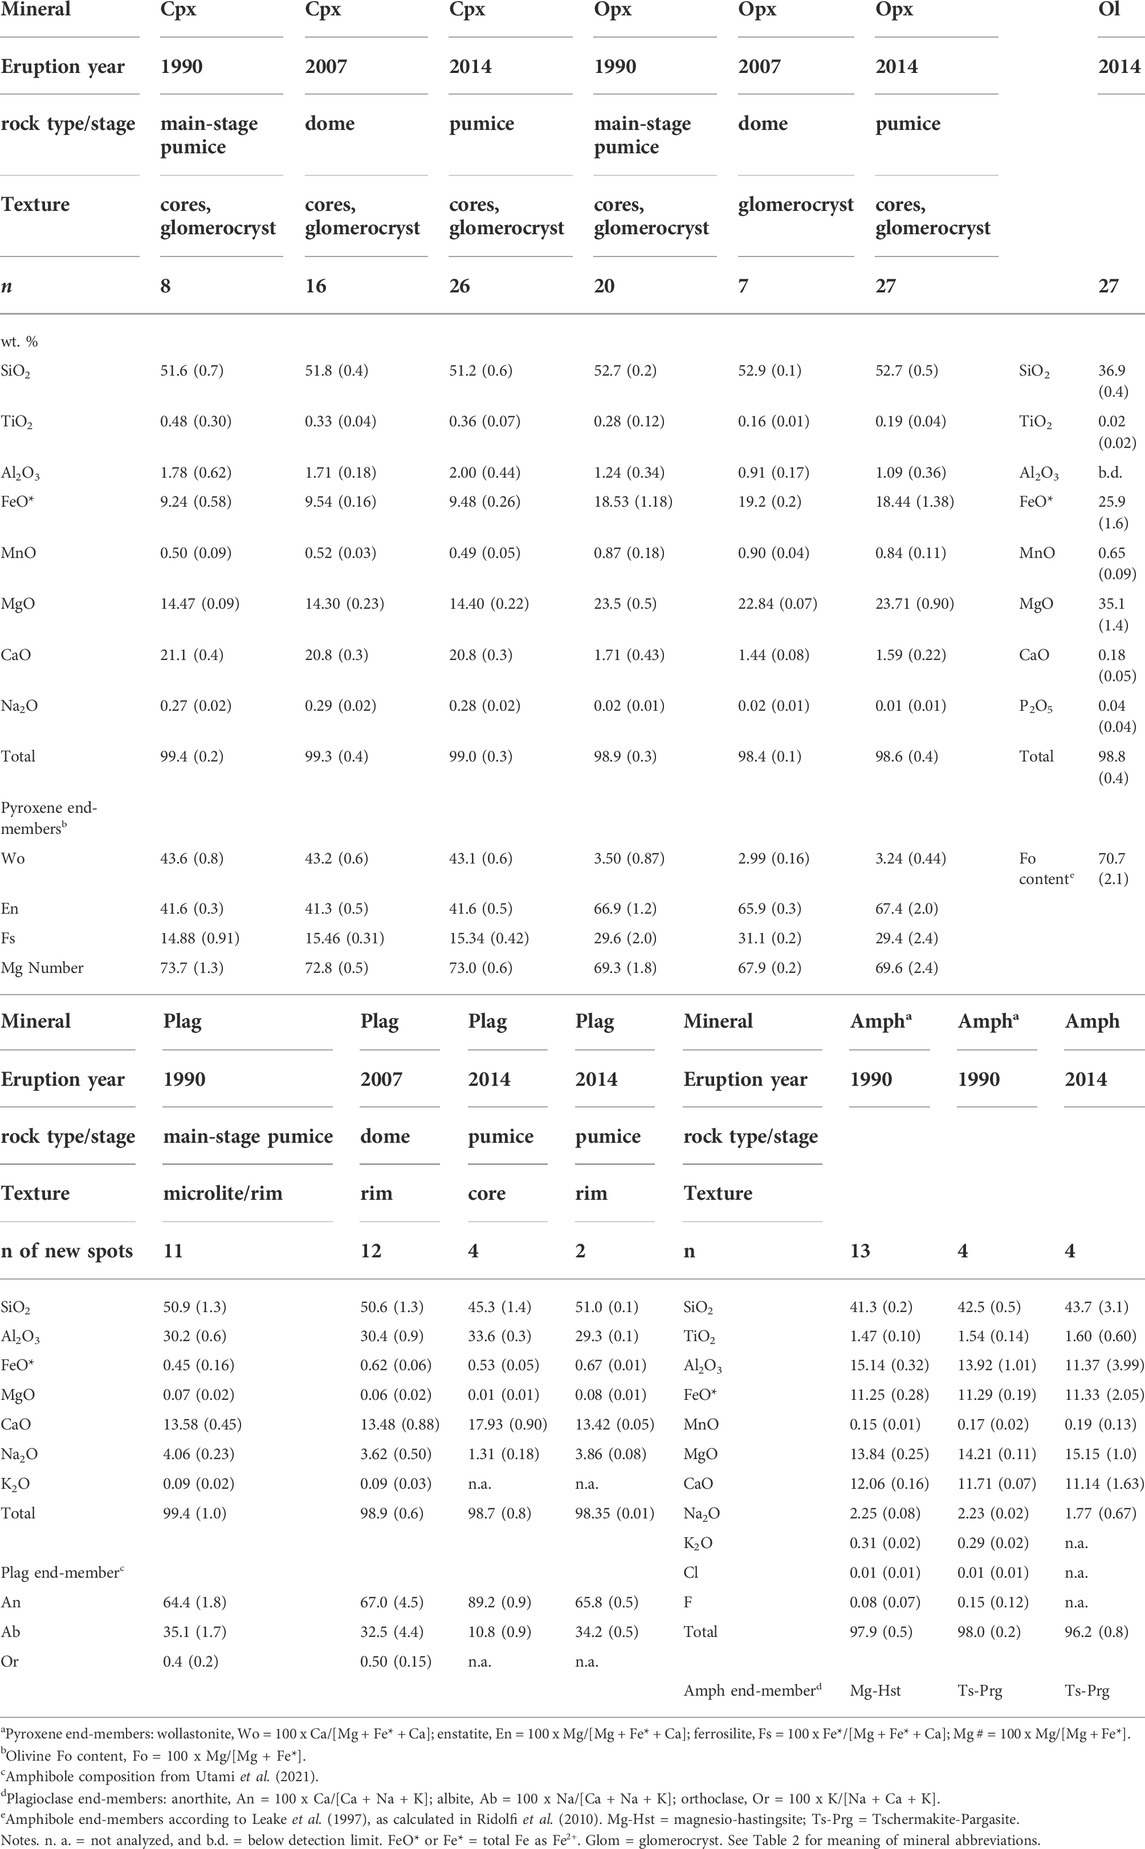
TABLE 3. Summary of representative mineral compositions from the 1990–2014 eruptions.
We made geothermobarometric estimates under the 1990–2014 magma storage conditions from mineral and whole rock/calculated matrix compositions (Table 4). For this we use core-whole rock and rim-calculated matrix pairs (see also Utami et al., 2021 for the 1990 eruption). The pyroxene-liquid or two pyroxene equilibria formulations of Putirka (2008) give temperatures that range from about 1,030°C for the crystal cores, to about 975°C (down to 950°C) for the crystal rims. Moreover, the mineral and glass compositions of the three eruptions give pre-eruptive temperatures that are within about ±30°C (Table 4). These temperature estimates also overlap with those obtained from amphibole-melt equilibria at about 960°C for the 1990 and 2014 eruptions. Pressure estimates we obtained come from the amphibole-melt geobarometer formulation of Putirka (2016), where pressures range from 450 MPa up to 700 MPa for the 1990 and 2014 eruptions, respectively.
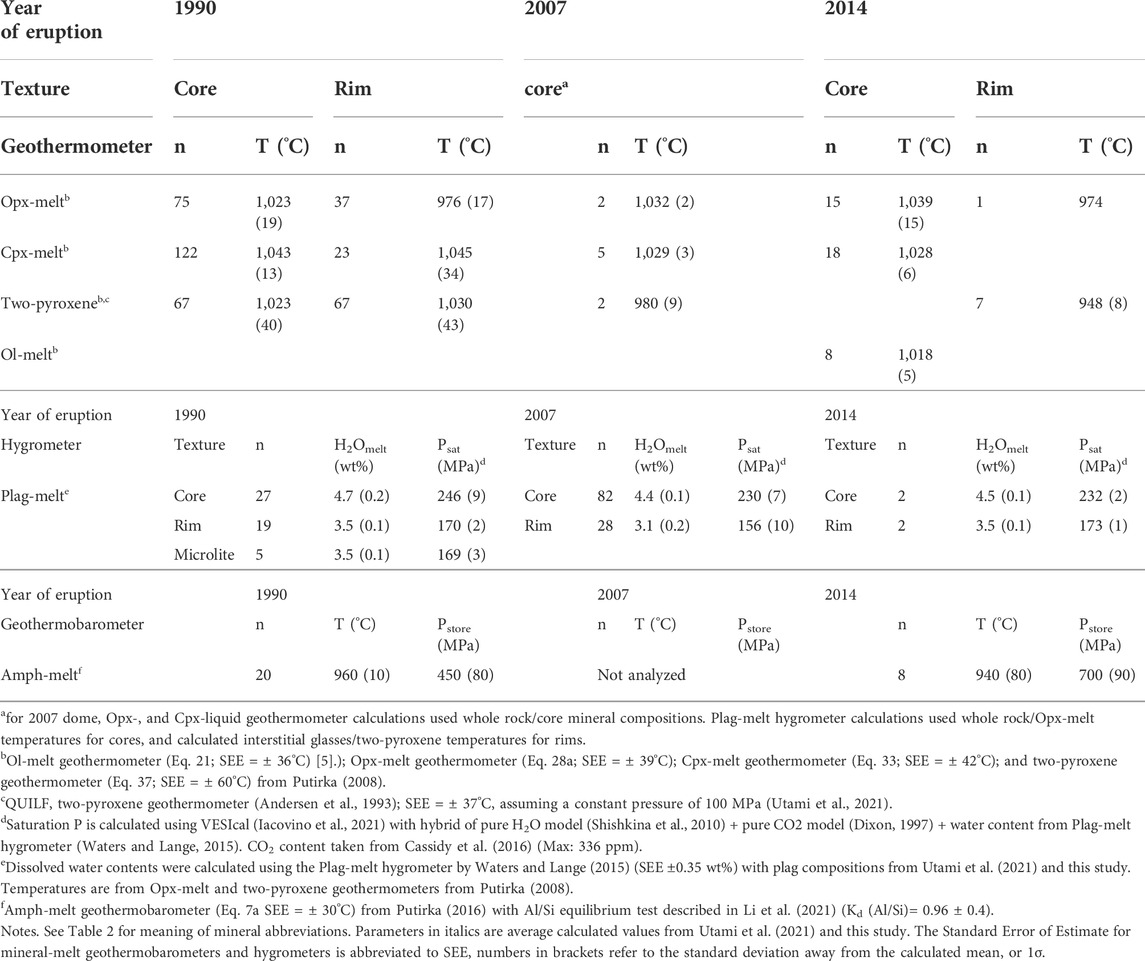
TABLE 4. New storage condition estimates from mineral-melt geothermobarometers, hygrometers, and H2O–CO2 saturation models for the 1990, 2007, and 2014 mineral populations.
The dissolved water content in the 1990 and 2014 magmas are calculated using the plagioclase-melt hygrometer of Waters and Lange (2015), with temperatures calculated using Opx-melt geothermometers of mineral core/whole rock and rim/calculated matrix pairs. For the 2007 dome, we use the core/whole rock pair for the Opx-melt temperatures and adjacent Opx–Cpx pairs for the two-pyroxene temperatures. Water contents range from 3.1 to 4.7 wt% (Table 4), which are consistent with previous estimates in Utami et al. (2021). These water contents in the melt correspond to H2O–CO2 saturation pressures of ∼170–220 MPa using the combined model of Shishkina et al. (2010) and Dixon (1997). These pressures are also similar to the range of pressures obtained in Utami et al. (2021). The water content in the melt estimated for the 2007 samples using plagioclase rim and core, and the calculated matrix glass is about 3 wt% water, which is slightly lower than those of the 1990 and 2014 eruptions.
4.2 General observations from the experimental results
Successful experimental charges range from complete glass to almost fully crystallized. Glass-rich charges are devoid of vesicles (Figure 2). Most charges (Figures 2B–H) have a porphyritic texture, with subhedral to euhedral crystals set in interstitial glass with vesicles. Crystals may vary in size from phenocrysts (>100 µm) to microlites (<10 µm). Typically, Opx and Ol are subhedral to euhedral, commonly with Mag and Plag inclusions (>100 µm) (Figure 2C). Some charges have clusters of Fe–Ti oxides microlites, as well as Fe–Ti oxides distributed throughout the charge (Figure 2D). Despite the large range in crystal sizes, minerals, and glass appear to be unzoned, according to BSE images, which is likely indicative of compositional equilibrium. Due to the small size of many crystals, it was very challenging to obtain a good quantitative chemical analysis, and thus we relied on mineral identification using EDS spectra obtained in SEM or electron probe. We obtained glass compositions from glass-rich experimental charges or for those where glass “pools” larger than about 10 μm, and we found that they are homogeneous in composition (Figures 2A–D). For charges with low water contents, phases are often very small to analyze. For charges that failed, that is, where the fluid escaped the capsule during the experiment, we consistently observe a very high crystal content and a quench texture, with abundant microlites of Opx and Plag, and rare Ilm and glass; these were not used further.
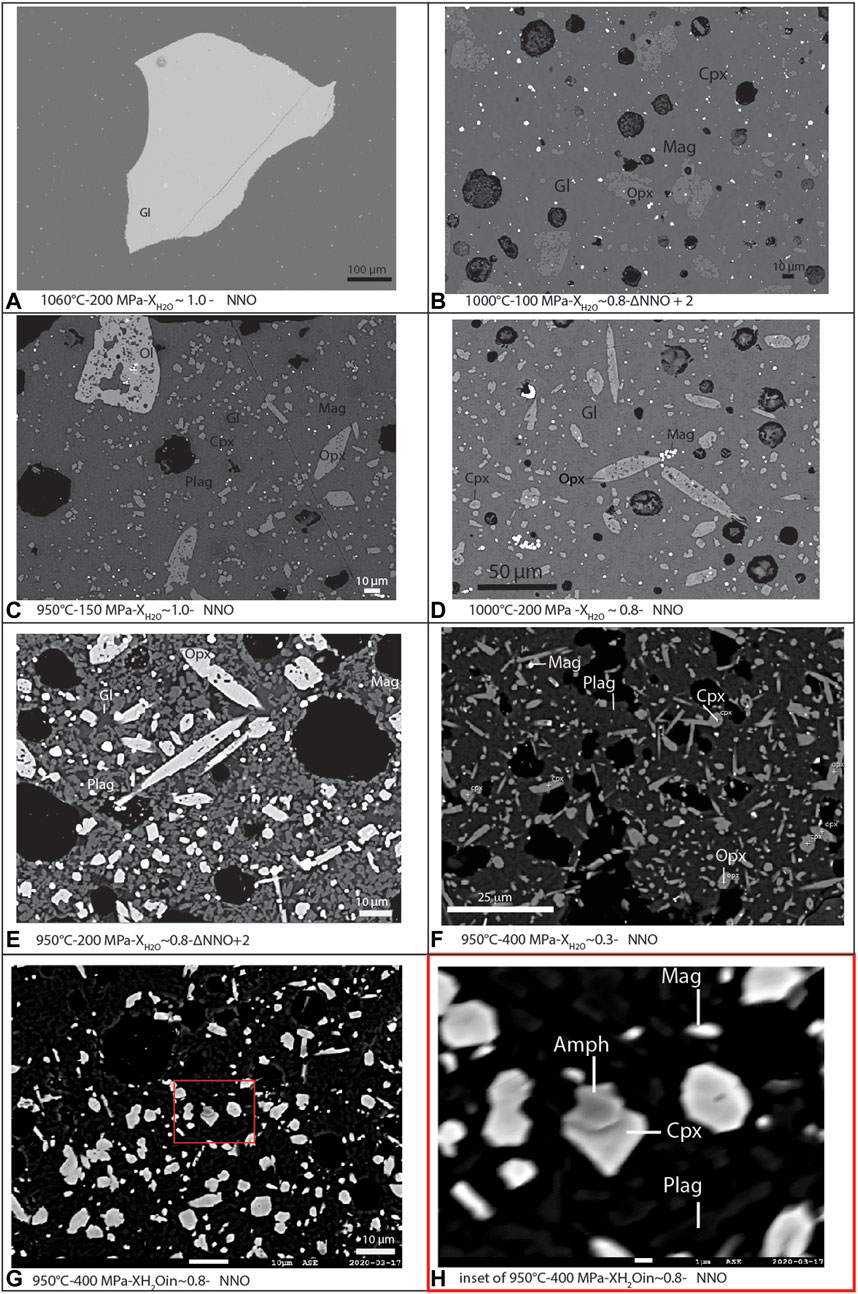
FIGURE 2. Annotated BSE images of selected representative experimental charges in order of increasing crystallinity. (A) 1,060°C-200 MPa-NNO. (B) 1,000°C-100 MPa-ΔNNO + 2. (C) 950°C-150 MPa-NNO. (D) 1,000°C-200 MPa-NNO. (E) 950°C-200 MPa-ΔNNO + 2. (F) 950°C-400 MPa-NNO. (G) 950°C-400 MPa-NNO. (H) Inset of charge in (G) Labeled with abbreviated mineral names (Gl = glass, Plag = plagioclase, Cpx = clinopyroxene, Opx = orthopyroxene, Mag = magnetite, and Amph = amphibole).
4.3 Phase relation, crystallinities, and mineral assemblages
The complete experimental phase assemblage of all charges includes Opx, Plag, Cpx, Mag, Ilm, Amph, Ol, and glass (Figures 2A–H). We did not identify experimental apatite, but it may be present. The crystal content from experimental charges varies from virtually none to about 88 wt% (Table 5). The crystal content generally increases as both temperature and water content decreases and as fO2 increases. We produced liquidus or near-liquidus experiments with <1 wt% of crystals, at 1,060°C (Figure 2B), and in charges at water saturated conditions (about 5–9 wt% H2O in the melt), 200–400 MPa, and fO2 of NNO (Figures 4A–C). These conditions match the model liquidus temperature calculated from rhyolite-MELTS in Utami et al. (2021). At 100 and 200 MPa and 1,000°C, the crystal content varies between about 68 and 44 wt% for 2–4 wt% water in the melt. Increasing the temperature to 1,060°C decreases the crystal content to 52 to 31 wt% at 3–4 wt% water in the melt, but it increases up to 74 wt% for <2 wt% in the melt. Similar changes in the crystal content with temperature and water content in the melt for different experimental pressures (see Supplementary Material). Increasing fO2 from NNO to NNO +2 results in an increase in the proportion of magnetite toward slightly higher crystal contents.
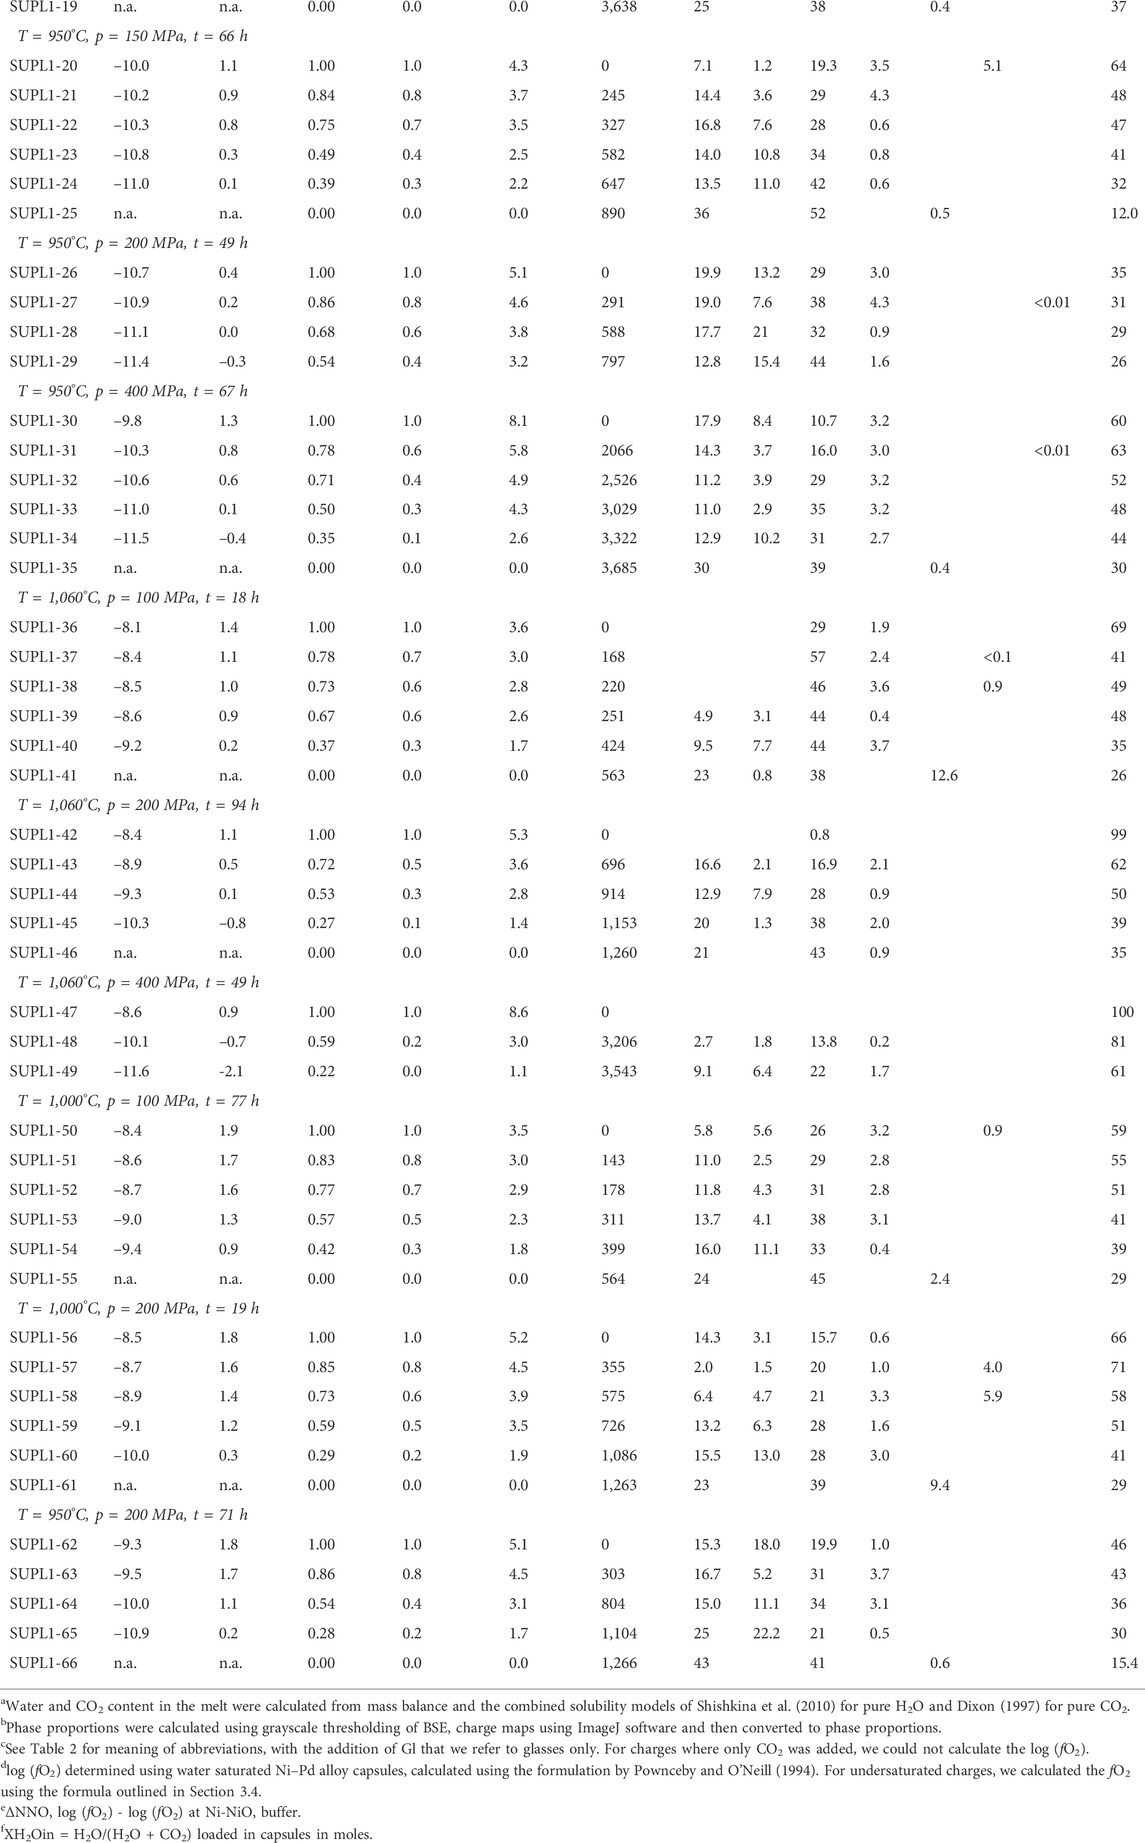
TABLE 5. Summary of experimental conditions, calculated melt volatile contents, and run products and their phase proportions.
The relationship between crystallinity, temperature, and water content in the melt can be used to obtain first-order constraints on the ‘pre-eruptive conditions’ (Figure 3). By ‘pre-eruptive conditions’ we mean those that best reproduce the natural phenocryst content, the mineral assemblage, and when possible, the phase compositions. They apply to the conditions before the magma started to move toward the surface and erupted. We have neither directly investigated the syn-eruptive processes, such microlite density or size, nor the vesicle characteristics, as was conducted in decompression experiments (Martel, 2012). Such definition of pre-eruptive storage conditions is relatively straightforward to apply to the explosive eruptions of 1990 and 2014, which quickly moved toward the surface. However, it is more ambiguous for the 2007 dome, which ascended more slowly and re-equilibrated to lower volatile contents, and contains a higher amount of phenocrysts. We attempt to clarify these differences in the following paragraphs.
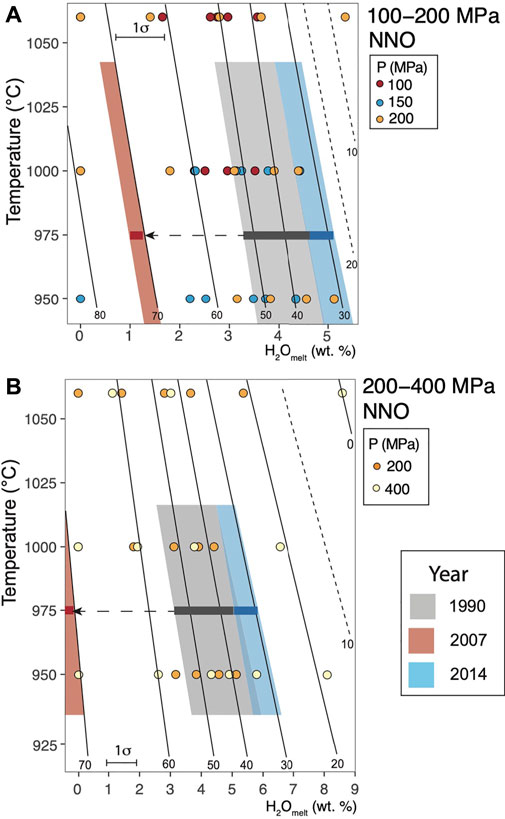
FIGURE 3. Dissolved water content in the melt vs. crystal content of experimental charges for (A) 200–400 MPa, NNO; (B) 100–200 MPa, NNO. Dashed lines denote extrapolated crystal contents of experimental charges. Gray, red, and blue semi-transparent boxes represent the field bounded by the phenocryst content of natural samples, water content in the melt for the given temperature with SEE errors from Opx-melt geothermometer (975 ± 39°C) for the 1990 pumices (explosive), 2007 dome fragments (effusive), and 2014 pumices (explosive). Dashed arrows indicate possible changes of water in the melt during ascent for the 2007 magma. The phenocryst contents of the erupted rocks are from Utami et al. (2021) and this study (Table 2). Average temperature estimates from each eruption are calculated from mineral-melt geothermobarometry listed in Table 4.
Using a temperature of magma storage of 975 ± 39°C for the three eruptions, as suggested by geothermobarometric data of all eruptions (Table 4), we find that the melt of the 1990 and 2014 magmas could contain about 4–6 wt% water at 150–200 MPa (Figures 3, 4). At 100 MPa and 400 MPa, this range corresponds to 3–4 wt% and 5–7 wt% water in the melt, respectively (Supplementary Figures S7, S8). The considerably higher phenocryst content of the 2007 dome would imply significantly lower water content in the melt (∼1 wt%). However, as we have discussed in the geothermobarometry results section earlier, we believe this does not reflect the storage conditions before the magma started to move toward the surface. In addition to the same temperature, the plagioclase-matrix equilibria suggest similar water contents in the melt for all eruptions. Thus, we propose that the trend reflects re-equilibration and maturation during slow ascent; in essence, we consider this an initial ascent phase of that eruption, which allowed for degassing and consequent crystallization.
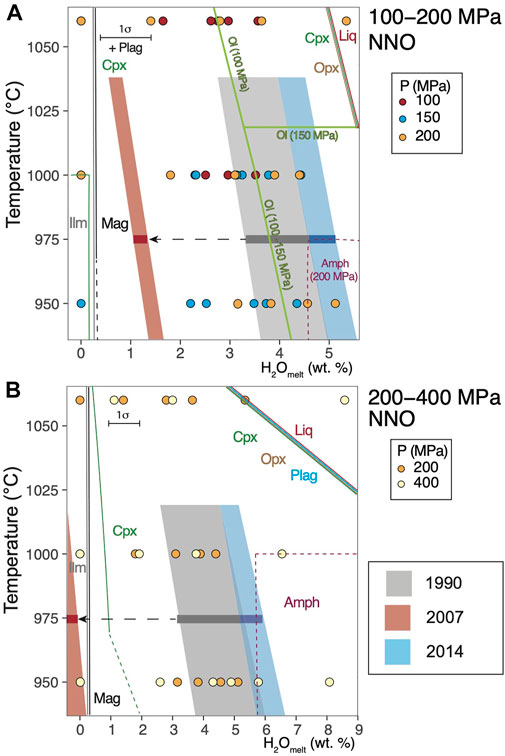
FIGURE 4. Phase relations for (A) 200–400 MPa, NNO; (B) 100–200 MPa, NNO. Gray, red and blue semi-transparent boxes represent the same parameters as Figure 3. Dashed lines denote inferred phase stability fields at the given temperature and water content. Dashed arrows indicate potential degassing pathways for the 2007 dome. Mineral name abbreviations are the same as in Figure 1, with the addition of Liq for liquid and Ilm for ilmenite. Pressure-specific stability is specified next to the boundary line. Red line with ‘liq’ represents the liquidus boundary at the given pressure and temperature.
We find that experimental Opx and Plag are present at all conditions below the liquidus, and the Cpx stability field is somewhat smaller (Figures 4A–C, Supplementary Figure S4). Although we suspect amphibole was stable in our charges by comparison with the results of other phase equilibrium studies with similar bulk compositions (Pichavant et al., 2002; Prouteau and Scaillet, 2003; Erdmann et al., 2016), we were not able to confidently identify it with EDS spectra or quantitative electron microprobe analysis owing to the high crystallinity of the charges and its small crystal size. To circumvent this problem, we applied principal component analysis to electron microprobe analyses of mineral compositions using the R package ‘FactoMineR’ (Lê et al., 2008), and we successfully identified experimental amphibole at 950–1,000°C and 200–400 MPa, with 4.5–6 wt% water in the melt (Figures 4A,B), which overlaps with our pressure estimates from natural amphiboles from the 1990 and 2014 eruptions. We identified experimental Ol with 3–4 wt% water in the melt at NNO and <150 MPa (Figure 4B). At NNO +2, Ol stability extends to higher pressures and water content (at 200 MPa, 1,000°C, and about 4–6 wt% water in the melt; Figure 4C). The stability of Fe–Ti oxides is also controlled by the dissolved water content and fO2. Ilmenite is stable at lower dissolved water contents than Mag, whereas with increasing fO2 makes magnetite more stable at low water contents.
4.4 Mineral and glass compositions
We strived to quantitatively analyze as many phases in as many charges as possible. However, we were only able to obtain a limited number of quantitative compositions, given the small sizes of many phases as described in the methods. This makes it difficult to directly make a close match between the natural phase compositions to the experimental ones, although we found some overlapping compositions at similar P-T-water under the melt conditions that was suggested by the crystallinity and phase assemblage relations (Figures 3, 4) Data tables for experimental mineral compositions are found in the Supplementary Tables S3–S7.
4.4.1 Glass
Experimental glass compositions vary with water content, temperature, and pressure (Figures 5A–L), with compositions evolving from basaltic andesite to dacite as temperature decrease from 1,060 to 950°C (Supplementary Table S3). The most evolved glass composition that we are able to analyze is dacitic with 68 wt% SiO2 at 200 MPa, 1,060°C, NNO, 1 wt% water in the melt, and with 50–54 wt% crystals in the charge (Figure 5A). The glass we analyzed from the rest of the charges ranges from basaltic andesite to andesite. For the same temperature, pressure, and fO2, the major element oxides such as SiO2 and K2O increase as the water content in the melt decreases, indicating the melt is becoming more evolved (Figures 5A–C,J–L). Conversely, oxides such as Al2O3 and CaO decrease with decreasing water content. Changing the fO2 from NNO to NNO +2 does not significantly affect the SiO2 content of the melt for the same pressure, temperature, and dissolved water content. The FeO* (3–9 wt%), MgO (1.5–7 wt%), and TiO2 (0.7–1.7 wt%) of experimental glasses (see Supplementary Figure S4) are controlled by crystallization of ferromagnesian minerals such as pyroxenes and magnetite. The limited number of natural and experimental glasses that we are able to analyze means we do not have a direct match to the natural compositions. Yet the calculated matrix and the experimental glasses overlap at around 950–1,000°C, 150–200 MPa, 4–4.5 wt% water in the melt, and fO2 of NNO to NNO +2. The general lack of agreement between the calculated matrix and experimental glasses in some major element oxides (e.g., FeO and K2O) could be due to the effect of syn-eruptive crystallization of Plag and oxide microlites in natural rocks. We also observe microlites in one 1990 pumice and the 2007 dome, which may explain why the natural rocks have a higher SiO2 content than the experimental glasses.
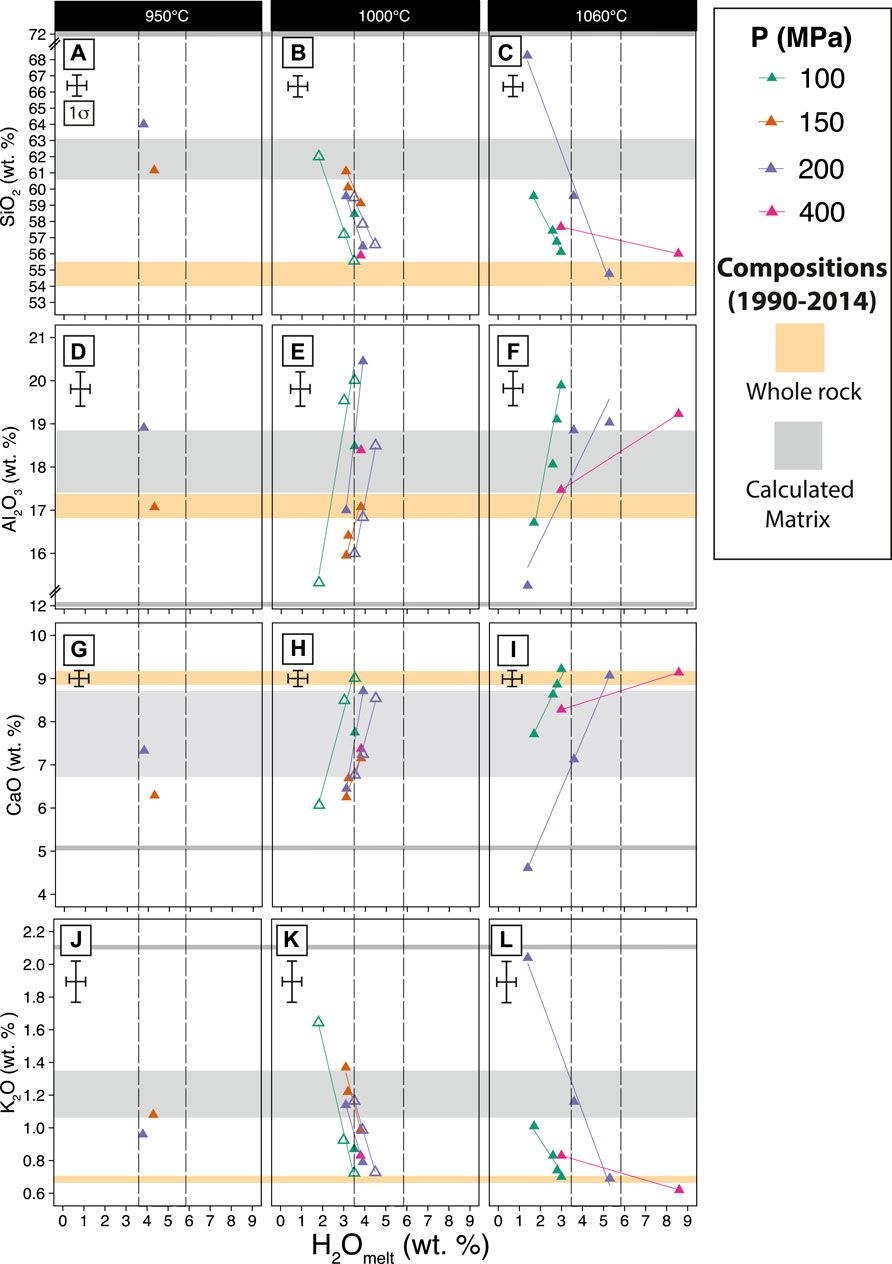
FIGURE 5. Major element oxide compositions of experimental glasses (in wt%) vs. dissolved water content in the melt according to three different temperatures SiO2 (A) 950°C, (B) 1,000°C, (C) 1,060°C; Al2O3 (D) 950°C; (E) 1,000°C, (F) 1,060°C; CaO (G) 950°C; (H) 1,000°C; (I) 1,060°C; K2O (J) 950°C, (K) 1,000°C, (L) 1,060°C. Yellow horizontal band denotes the range of whole rock compositions. The thick gray band is the composition of calculated matrix for the explosive eruptions (1990, 2014); the thin gray band is the calculated matrix of the 2007 dome (Table 1). The calculated matrix compositions for the 1990, 2007, and 2014 eruptions were estimated by mass balance calculations (Albarede, 1995) (see Methodology section). Vertical dashed lines are water content in the melt inferred from crystallinity and phase assemblage (Figures 3, 4). Filled symbols represent experiments at NNO; open lined symbols represent experiments at NNO +2.
4.4.2 Plagioclase
It is difficult to obtain “pure” analyses of experimental plagioclase due to its elongated shape (e.g., very thin in one direction) and the presence of mineral inclusions such as oxides and/or pyroxenes, so we report the recalculated analyses after subtraction of the effect of mineral inclusions (see Methodology section). We first filtered the experimental Plag analyses for their FeO* and TiO2 contents to remove Mag inclusions. Yet the MgO content remains higher than expected for a plagioclase (∼1 wt%). We thus suspect that there may be some analyses that are mixtures of Plag and Opx, which we have not attempted to correct further. However, this should not affect the relative Ca–Na–K concentrations and thus determination of the stoichiometric Plag end-members. Experimental plagioclase ranges in composition from about An59 to An65 (Supplementary Table S4; Figure 6A), and varies according to the water content in the melt and to a lesser extent, by temperature. For the same T, P, and fO2, we find that the water content negatively correlates with An content. We have neither been able to analyze experimental Plag for near liquidus charges nor from those with very high crystal content. Some of the experimental Plag compositions overlap with natural Plag microlites and rims from the 1990–2014 eruptions as described in Utami et al. (2021) and in this study with An65 (Figure 6A; Supplementary Table S1). Phenocryst rims and microlites (An content from 65 to 68) overlap with experimental Plag that crystallized at 200 MPa, 1,000°C, and 4 wt% water in the melt and at NNO.
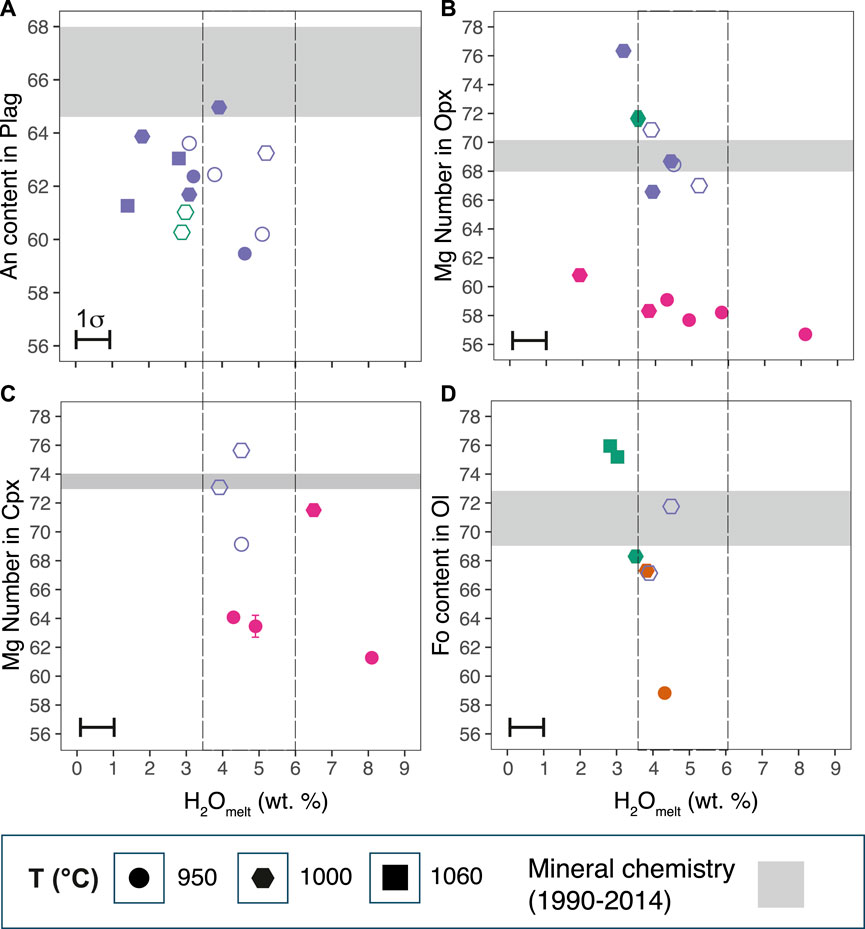
FIGURE 6. Experimental mineral compositions compared to natural minerals from the 1990, 2007, and 2014 eruptions (A) An content in Plag, (B) Mg Number in Opx, (C) Mg Number in Cpx, and (D) Fo content in Ol. Gray horizontal bands are of the mineral compositions from the three eruptions taken from the core compositions of the minerals (Data from Table 3 and Supplementary Table S2 of this study). Only the rim compositions of the Plag are to compare with experiments. Filled symbols represent the experiments at NNO; open-lined symbols represent experiments at NNO +2.
No experimental Plag composition that we analyzed have An content >65. However, we find that Plag cores and some oscillatory growth zones from all three eruptions with An content of >71 in this study by Utami et al. (2021) and Cassidy et al. (2016) (see Figure 1 and Supplementary Figure S3). To check whether it is possible to produce Plag with An content of >71 as observed in the 2014 cores (Table 2), we modeled the evolution of the Plag chemistry with rhyolite-MELTS v.1.2.0 using the mixed H2O–CO2 model by Ghiorso and Gualda (2015). We used the isobaric crystallization model and the composition of the starting material, with the addition of 4 wt% water and 336 ppm CO2 in the melt from Cassidy et al. (2016), and fO2 buffered at NNO. We found that Plag with An content of 70–86 can be produced through isobaric crystallization from 933 to 1,063°C, which is somewhat lower than the highest plagioclase An core compositions at 88–90 (Table 3).
4.4.3 Orthopyroxene
Experimental Opx composition mainly varies with temperature and water content in the melt (Mg Number: 57–71; Figure 6B, Supplementary Table S5). The Wo component of some of the experimental Opx is high (Wo6–10), and is thus classified as pigeonite according to Deer et al. (1992). For the same pressure and fO2 (e.g., 400 MPa, NNO), a temperature increase from 950 to 1,000°C results in a corresponding increase in the Mg Number of about 56–61; a decrease in the water content in the melt also results in an increase in the Mg Number. A strong influence of water content in the Opx-melt Mg Number partitioning was reported in previous experimental studies (Waters and Lange, 2017). The 1990–2014 Opx cores and glomerocrysts range from Mg Number 66 to 76 (average of 66). This Mg Number range overlaps with experimental orthopyroxene compositions at 1,000°C, 200 MPa, and 4–4.5 wt% water in the melt and NNO to NNO +2 for all eruptions. We have not identified pigeonite in the natural samples.
4.4.4 Clinopyroxene
Experimental Cpx is present in most charges (Mg Number: 61–76, Wo34–41En39–46Fs15–26) (Figure 6C, Supplementary Table S5). The Mg Number of experimental Cpx increases from 61 to 76, with increasing temperature and decreasing water content in the melt. There appears to be some effect of pressure, temperature, and water content on the Cpx composition. At 950°C, the experimental Cpx at 200 MPa have higher Mg Number (69–76) than at 400 MPa (61–64); one exception is one Cpx with Mg Number of 72 at 1,000°C, 400 MPa, NNO, and 6 wt% water. The Mg Number increases as water content decreases for isobaric charges at 950°C and 400 MPa. As we could not obtain good quantitative analysis of Cpx for all charges, we have no clear indication of the effect of fO2 on clinopyroxene composition. The 1990, 2007, and 2014 clinopyroxene cores and glomerocrysts compositions (Mg Number 70–76, average ∼74) somewhat overlaps with experimental clinopyroxene at 1,000°C, 200 MPa,∼ 4 wt% in the melt, and NNO +2.
4.4.5 Olivine
Experimental Ol (Fo content: 59–76) is present in charges at 950–1,000°C, p = 100–150 MPa at NNO, and 1,000°C, 200 MPa, at NNO +2 (Figure 6D, Supplementary Table S6). The Fo content increases strongly with temperature for a water content of 3–5 wt%. There is no discernible systematic change in Fo with increasing fO2 from NNO to NNO +2. We can only compare the experimental Ol compositions to Ol from the 2014 eruption because the Ol from the 1990 and 2007 eruptions have completely reacted to symplectites. The Ol population from the 2014 eruption ranges in the Fo content from 67 to 73. The 2014 eruption Ol overlaps with experimental Ol at 200 MPa, 1,000°C, NNO +2, and 4.5 wt% water.
4.4.6 Amphibole
It was particularly difficult to confidently identify Amph in our experimental charges, and we were only able to obtain good quantitative analysis of one experimental Amph (magnesio-hornblende; Mg Number = 69; Supplementary Table S6) in the charge at 950°C, 400 MPa, and 6 wt% dissolved water in the melt (Figures 2G,H). We also identified additional Amph crystals in other charges using principal component analyses of mineral compositions obtained with EPMA analysis (Supplementary Figure S2). Geothermobarometry results from the natural Amph of the 1990 and 2014 eruptions agree with the experimental Amph stability field we have found (Figure 4). We reconstructed the composition melt from natural Amph from 1990 to 2014 using the Al/Si values, and the methodology of Li et al. (2021) to compare the equilibrium SiO2 content of the parental melt of Amph with that of our glasses. We found that the Amph from 1990 is in equilibrium with 53–60 wt% SiO2 in the melt, which is close to the SiO2 content of the starting material glass. The Amph from 2014 is in equilibrium with more silica-rich melt of 68–70 wt% SiO2, which overlaps with the interstitial glasses. This shows that a range of amphibole composition are stable in the Kelud system. However, it is unclear if the difference between the 1990 and 2014 Amph represents a real difference under magmatic crystallization conditions or is an artifact of the sampling and the limited number of Amph compositions we have. We note that there are many examples of fully reacted Amph crystals in erupted products from the three eruptions. For the 2007 dome, this could be to the progressively shallowing of the magma (see the following discussion section); for the 1990 and 2014 eruptions it suggests that the magmas were stored at conditions straddling the boundary of the Amph stability field.
4.4.7 Fe–Ti oxides
Magnetite and less common ilmenite were produced in the experimental charges depending on the water content in the melt. Experimental magnetite (Xusp = 0.24–0.60) is present in almost all water-saturated charges (Supplementary Table S7). Ilmenite occurs in water poor charges. Although we have identified ilmenite in charges with EDS analyses, we were not able to quantitatively determine their compositions.
4.5 SO2 emissions of 2007 dome extrusion
Kelud emitted around 150 kT and 200–300 kT SO2 for the 1990 and 2014 eruptions, respectively (Carn, 2022). In 1990, ∼150 kT SO2 was measured on 11 February, around 1 day after the onset of the main Kelud eruption on 10 February. The measured SO2 emission is therefore a minimum amount. Similarly, most of the SO2 emissions from the 2014 eruption (∼200 kT) was injected during the main phase of the eruption and detected by satellites 12 h after the eruption, meaning the actual emissions could be higher (up to ∼300 kT). Thus, we used the total SO2 emissions for the 1990 eruption (∼150 kT) and a range of emissions for the 2014 eruption (∼200–300 kT) to calculate the excess SO2 from each eruption (Table 6).
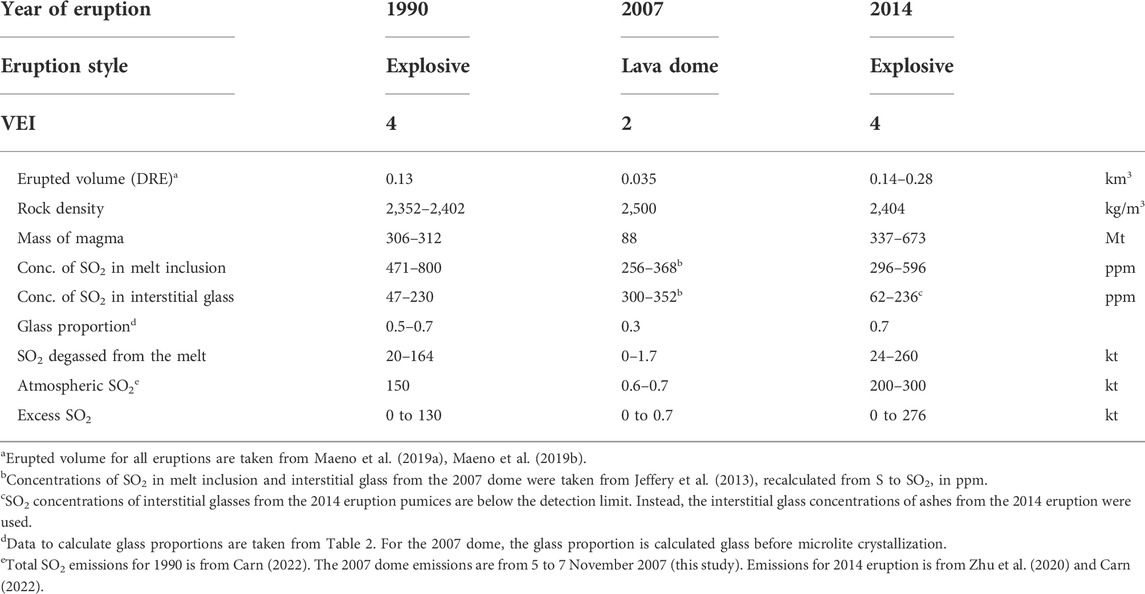
TABLE 6. Mass balance calculation of SO2 exsolved from the melt and measured by satellite.
We analyzed Aura/OMI SO2 measurements from July 2007 through May 2008, covering the few months prior to the 2007 dome extrusion at Kelud and the approximate duration of lava dome growth. Volcanic SO2 emissions clearly attributable to Kelud were only apparent on a few days during this period, although, as noted earlier, SO2 emissions from other active volcanoes in East Java are frequently advected over the Kelud region and may have obscured any weaker emissions from Kelud. However, significant SO2 emissions from Kelud would still have been detectable.
No significant SO2 emissions from Kelud were detected in July–October 2007, when Crater Lake temperatures and CO2 fluxes were elevated (Global Volcanism Program, 2007; Kunrat, 2009; Caudron et al., 2012). It is likely that any SO2 emissions in this period would have been scrubbed by Kelud’s hydrothermal system or Crater Lake. A drifting SO2 cloud (containing ∼100 tons SO2) was first observed west of Kelud on 2 November 2007, a few days before the new lava dome was first directly observed in the crater (Global Volcanism Program, 2008). This SO2 cannot be unequivocally attributed to Kelud but could represent emissions associated with the initial dome eruption. A clear SO2 plume (∼200 tons SO2) was observed south-west of Kelud on November 5, the day after fresh lava dome extrusion was confirmed (Global Volcanism Program, 2008). Further SO2 emissions from Kelud were detected on November 7 (∼140 tons SO2) and November 25 (∼200 tons SO2). These SO2 observations were made when a favorable wind direction and/or reduced activity at other East Javan volcanoes allowed us to attribute the detected SO2 emissions to Kelud with some confidence. After 25 November 2007, no further significant SO2 emissions from Kelud were detected by OMI during the November 2007—May 2008 dome extrusion phase.
Total observed volcanic SO2 emissions from Kelud during the 2007 dome extrusion thus amount to ∼600–700 tons. However, due to frequent cloud cover and generally weak emissions this likely represents a minimum amount. The coincidence of elevated SO2 emissions and the beginning of subaerial lava dome effusion in early November 2007 is consistent with other observations of effusive eruptions, which typically show a ‘waxing–waning’ trend in SO2 emissions, with peak gas fluxes close to the eruption onset. Using the emissions for the 2007 dome and SO2 concentrations from Plag-hosted melt inclusions (Jeffery et al., 2013), we calculated the excess SO2 for the 2007 dome eruption (Table 6).
5 Discussion
5.1 Geothermobarometry and experimental constraints on magma storage conditions of sub-Plinian eruptions and dome extrusions
Combining the geothermobarometric and experimental results, we found that the initial pre-eruptive magma crystallization conditions that match the phenocryst content (Figure 3), natural mineral assemblage (Figure 4), and some of the mineral compositions for the three eruptions (Figure 5) are at 975 ± 39°C, 175 ± 25 MPa, with about 4–6 wt% water in the melt and a fO2 of NNO. These conditions correspond to about 7 km of storage below the crater if we use a crustal density of 2,640 kg m−3. However, geothermobarometry indicates that amphibole which could also be derived from deeper parts are that the 1990 and 2014 amphibole record deep pressures of 450–700 MPa (Table 4), and many crystals are reacted (Utami et al., 2021; this study). Moreover, the reaction textures in olivine suggest that the magma storage could have straddled the stability fields of amphibole and olivine.
A key difference between the 1990 and 2014 eruptions and that of the 2007 dome is the much higher phenocryst content of the latter (Table 2). This could be due to crystal accumulation in the dome, but the whole-rock major and trace element compositions of the three eruptions are similar, including incompatible trace elements such as Zr (this study; Jeffery et al., 2013), meaning that the observed difference in the crystal content is due to in situ crystallization. According to experimental results, the lava dome’s higher phenocryst content (Table 2; Figure 3) can be reproduced with ∼1 wt% water in the melt for a temperature of about 975°C. Thus, we propose that although the storage conditions for the 2007 magma were similar to that of the 1990 and 2014 magmas before it started moving to the surface, the lower apparent water content is likely the result of slow transport toward the surface that in turn led to water loss and cooling. The slower ascent observed in 2007 resulted in the re-equilibration of phenocryst proportions and compositions to shallower depths.
Cassidy et al. (2019) performed partial melting experiments using samples from the 2014 eruption. They explored a smaller range of P-T and water conditions than we report, and they used a crushed rock as starting material and thus ‘partial equilibrium’ experiments (for discussion about full vs. partial equilibrium experiments, see Pichavant et al., 2007). Given the different experimental approaches, it is not straightforward to directly compare our results to those of Cassidy et al. (2019). Some notable differences are that our experiments crystallized amphibole and olivine (and we also find them in the natural rock), which are absent in Cassidy et al. (2019), but this is likely because we investigated a wider range of experimental parameters. Our inferred crystallization temperatures are similar to those of Cassidy et al. (2019) for all the eruptions, but we find higher pressures and water contents in the melt.
5.2 The importance of excess volatiles in modulating eruption style
The explosive → effusive → explosive eruption sequence shown by the 1990–2007–2014 events is one of the most interesting aspects of Kelud volcano. The contrasting eruptive style is particularly intriguing because we have shown that the “initial” (i.e., before ascent) conditions of temperature, pressure, and water content in the melt are broadly the same for the three events. Other factors that could be responsible for the differences in eruptive style are the conduit dynamics, where parameters such as the magma flow rate and overpressure work together to determine whether the magma will erupt explosively or effusively (Woods and Koyaguchi, 1994; Mastin, 2002; Campagnola et al., 2016). Syn-eruptive processes at the conduit level certainly played a key role in the eruption style at Kelud, but several observations point toward the importance of other parameters, especially the possible presence of a pre-eruptive volatile phase. Our mass balance calculations and those of Utami et al. (2021) for the SO2 budget of the 1990 and 2014 eruptions indicate the presence of an exsolved volatile phase at pre-eruptive conditions, with up to 130 kT SO2 for the 1990 eruption and 276 kT SO2 for the 2014 eruption (Table 6). In contrast, the calculated amount of the exsolved volatile fluid phase for the 2007 dome eruption is virtually negligible. Pre-eruptive excess fluid can be developed via progressive magma crystallization and volatile buildup to supersaturation (Tait et al., 1989; Tramontano et al., 2017; Arzilli et al., 2019; Cassidy et al., 2019), and/or with fluid fluxing from a deep-seated basaltic magma reservoir (Giuffrida et al., 2017; Caricchi et al., 2018), or limestone assimilation (Deegan et al., 2016, 2010; Jeffery et al., 2013). Although we can only calculate the amount of SO2, the fluid phase would have also included other volatiles including water and CO2. The presence of an exsolved fluid phase under pre-eruptive conditions means the magma buoyancy is greatly increased, as fluids can expand from the moment the magma starts its ascent, lithostatic pressure decreases (Gonnermann and Manga, 2013).
A critical aspect to the role of exsolved volatiles in the explosivity of the eruption is whether they separate from the melt during transport, and thus increase the magma permeability. Popa et al. (2021) proposed a model where effusive eruptions can be driven by magmas with an exsolved volatile phase under pre-eruptive conditions and a higher water content in the melt (and somewhat hotter due to mafic intrusion) than explosive events. The lower viscosity of the melt combined with the higher bubble content at the starting conditions would facilitate fluid escape through the magma column due to higher permeability, thus decreasing the explosivity. Although this may be responsible for the contrasting eruptive styles at the Nisyros–Yali volcanic system (Popa et al., 2021; 2020), at Kelud we did not find the magma that produced the dome in 2007 had a lower viscosity than the explosive events (Utami, 2021). There was also no initial explosive event recorded before the dome extrusion itself (Global Volcanism Program, 2008). Rather, we propose that the exsolved volatile phase that was likely related to the 2007 magma was passively released during the repose between 1990 and 2007, which was punctuated by at least two significant unrest events involving gas release (see below).
The accumulation of an excess fluid also requires the plumbing system to be a plugged or semi-plugged system during repose (Whelley et al., 2015), or with the mass flux of exsolved fluids production being larger than that, which is degassed, and further implying limited passive degassing between eruptions. Prior to the 1990 eruption, volatiles accumulating at depth were likely blocked by a plug of crystalline magma from the previous event in 1966 and ∼4 million m3 of lake water (Lesage and Surono, 1995; Vandemeulebrouck et al., 2000), whereas before the 2014 eruption, the volcano was plugged by the 2007 dome (Global Volcanism Program, 2014). In contrast, between the 1990 eruption and up until 2007 dome, the system appears to have been much more open for gas escape, including two unrest crisis (Figure 7 and next section). This included fumarolic activity and two heating crises observed in 1996 and 2001, when the lake water increased in temperature from 35 to 40–∼50°C (Bernard and Mazot, 2004). Hence, the observed post- and inter-eruptive crises between 1990 and 2007 suggest the magma system was partially open, allowing the shallow magma body to further degas volatiles out of the system and thus was not able to accumulate excess fluids.
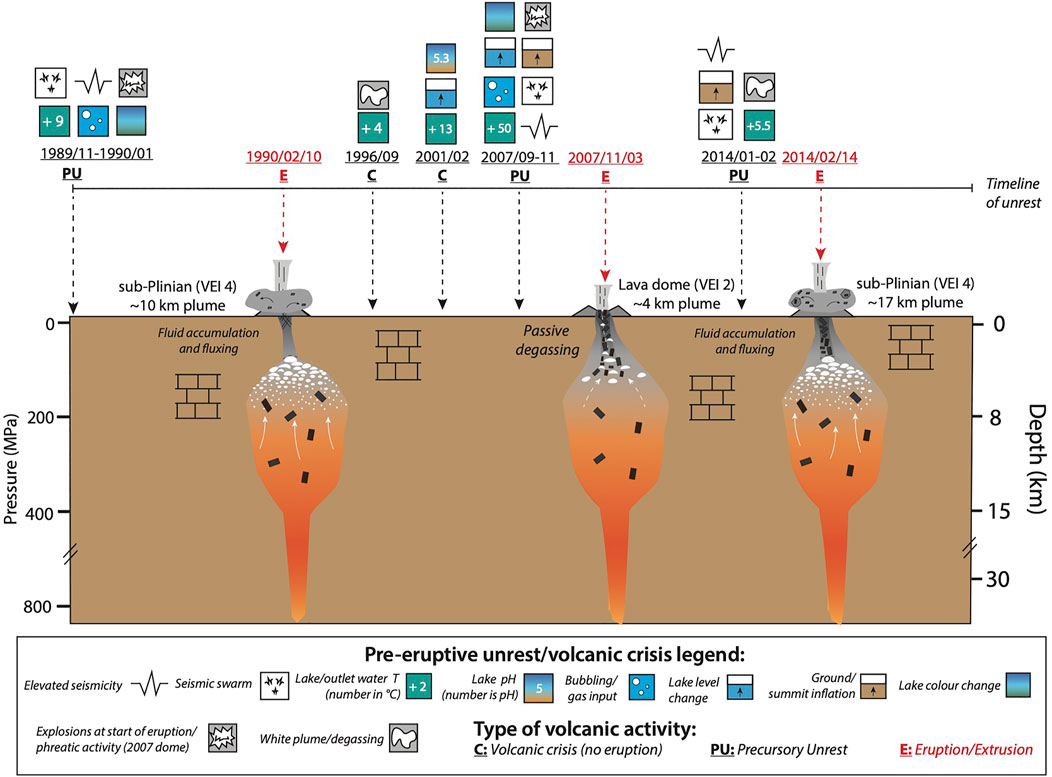
FIGURE 7. Conceptual model of the proposed magmatic conditions and processes occurring for the 1990–2014 eruptions. Black rectangles in the magma reservoirs represent the crystal cargo or crystallization in the conduit. White flattened circles represent accumulation of the pre-eruptive exsolved fluid phase. Solid white arrows represent fluid fluxing through the system either from a deep-seated degassing basaltic magma, or from limestone assimilation for explosive eruptions. Dashed white arrows represent fluid release through a semi-permeable conduit leading up to dome extrusion. Symbols and codes are listed in the legend. Storage pressures are converted to depth below the crater using the density calculated in Smyth et al. (2007). The volcaniclastic and carbonate layers are taken from Jeffery et al. (2013), and references therein. Volcano Explosivity Indices (VEI) reported come from Global Volcanism Program (2013). Plume height are reported in Bourdier et al. (1997a) for 1990; Global Volcanism Program (2008) for 2007 lava dome; and Kristiansen et al. (2015) for 2014. Timeline for volcanic unrest is provided for the 1990 eruption (Global Volcanism Program, 1990a; Global Volcanism Program, 1990b; Lesage and Surono, 1995; Vandemeulebrouck et al., 2000), 2007 dome extrusion (Global Volcanism Program, 2008; Caudron et al., 2012; Lubis, 2014; Hidayati et al., 2019), and 2014 eruption (Global Volcanism Program, 2014; Hidayati et al., 2019), as well as the inter-eruptive unrest in 1996 and 2001 (Global Volcanism Program, 1990a; Global Volcanism Program, 2007).
Our proposed interpretation, that the 1990 and 2014 eruptions resulted from the accumulation of pre-eruptive gas, is similar to that of Cassidy et al. (2019) and Cassidy et al. (2016). However, we do not find evidence for the replenishment of hotter and wetter magma involved in the 2007 dome extrusion. Instead, we propose the 2007 dome was the result of leftover magma from the 1990 eruption that underwent slow ascent and degassing until it extruded as a lava dome. This is possible even if the 2007 magma was likely stored under the same conditions as the 1990 and 2014 magmas before it started slow ascent toward the surface.
5.3 Relating magma storage conditions and transport to the surface with unrest signal
Volcanic unrest at Kelud before and during these three eruptions was monitored using a range of observations and data, including seismicity, deformation, and the chemistry and temperature of the lake. Unrest signals preceding all three events started around 2–3 months before eruption, and included seismic swarms with unrest signals spanning volcano-tectonic, shallow volcanic (VB-type), low frequency, and tremor seismicity (Lesage and Surono, 1995; Hidayati et al., 2019; 2009). Seismicity rapidly increased (e.g., < 24 h) before the 1990 and 2014 eruptions, and earthquake hypocenters are mostly at shallow depths beneath the crater (<7 km) (Lesage and Surono, 1995; Hidayati et al., 2019). Sharp increases in lake temperature and input of magmatic volatiles such as Cl- and CO2 into the lake have also been proposed for the unrest prior to the 1990 and 2007 eruptions (Vandemeulebrouck et al., 2000; Bernard and Mazot, 2004; Kunrat, 2009; Caudron et al., 2012).
Tiltmeters and interferometric synthetic aperture radar (InSAR) detected changes in local and regional deformation from inflation to rapid deflation, preceding 2014 eruption and 2007 dome extrusion, respectively (Lubis, 2014; Cassidy et al., 2019; Hidayati et al., 2019). Lubis (2014) analyzed InSAR images of the 2007 dome extrusion and detected inflation 1–2 months before the dome extrusion, where they further interpreted the inflation as due to an increase in volume of magma in a shallow reservoir and magma migration to the surface. Tiltmeters from two stations installed at Kelud recorded inflation in the radial and tangential directions in January 2014; rapid inflation was also recorded after a M4.5 volcano-tectonic earthquake was recorded in Blitar/Kediri (Hidayati et al., 2019). These observations both record inflation at least 1 month before the 2007 and 2014 eruptions.
An important observation is that during the inter-eruptive period between 1990 and 2007, the system seems to have been able to degas more freely. This is reflected in the volcanic crises that occurred in 1996 and 2001, when lake temperature increased by +4 and +13°C, respectively (Global Volcanism Program, 1990a; Global Volcanism Program, 2007) (Figure 7). Other unrest signals included white plumes (1996), lake pH decrease, and lake level increase (2001). These releases of heat/mass may represent purging of outgassed magmatic fluids. The 2007 magma would then have lost some of its volatile content, aiding final extrusion in an effusive manner. Given the high crystal content (70 vol%) and complex zoning observed in the crystal cargo, including oscillatory zoning of plagioclase, the lava dome was likely a residual magma batch from the 1990 eruption or earlier. Indeed, we find that the syn-extrusive 2007 dome SO2 emissions amounted to 0.6–0.7 kT, which is about 1,000 times lower than the 1990 and 2014 eruptions (150 and 200–300 kT, respectively) (Table 6). The low water content is also established in the experiments, which showed the 2007 magma had at most ∼1 wt% water in the melt. Due to frequent cloud cover and the relatively short atmospheric lifetime of SO2 in the tropics, the OMI satellite measurements of syn-extrusive 2007 dome SO2 emissions are likely underestimates of actual emissions. However, even in the unlikely event that Kelud had degassed SO2 continuously throughout the period of most active lava dome growth (November 2007—January 2008; Global Volcanism Program, 2013) at similar levels to those observed by OMI in November 2007, total SO2 emissions would only have amounted to ∼9 kT; that is, still two orders of magnitude lower than the 1990 and 2014 eruptions. We are therefore confident that the syn-extrusive 2007 lava dome emissions were significantly poorer in SO2 than the 1990 and 2014 eruptions.
If our hypothesis is correct, identifying and tracking whether a volcanic system is opened or closed to volcanic gases escaping could be useful to anticipate its likely eruptive style. A key component could therefore be to monitor for several unrest signals linked to volcanic gas escape from the magma, and changes to conduit permeability. This includes increased fumarolic activity, decreases in the pH of the lake water, visible upwelling and bubbling, increasing lake temperature, hydroacoustic signals, and clusters of VB-type seismicity (Lesage and Surono, 1995; Vandemeulebrouck et al., 2000; Bernard and Mazot, 2004; Hidayati, 2009). These unrest signals could suggest the impending eruption would be effusive. On the contrary, monitoring signals that could be related to fluid accumulation and magma degassing, or magma transfer within the plumbing system, could be useful in anticipating explosive eruptions. For example, identification of deep-long period seismicity using broadband seismometers, which could come from degassing of volatile-rich magma at depth (Melnik and Sparks, 2002) or deformation signals before and after the eruption (Spang et al., 2022). Finally, microgravity surveys or continuous gravity monitoring could be beneficial because we expect that significant fluid accumulation would lead to subtle changes in density of the plumbing system over time, which was demonstrated at Masaya volcano (Nicaragua) (Williams-Jones et al., 2003).
6 Conclusion
We present petrological and experimental constraints under the pre-eruptive storage conditions of the basaltic andesite magma feeding the 1990, 2007, and 2014 eruptions of Kelud volcano, which alternated between explosive → effusive → explosive eruption styles. The three eruptions share similar whole rock compositions and mineralogy, implying that their magma storage conditions were also similar. We found that the natural phenocryst content and mineral assemblage can be experimentally reproduced at 975 ± 39°C, 175 ± 25 MPa (∼7 km below the crater level), NNO, and with ca. 4–6 wt% water in the melt. We also infer that the 1990 and 2014 magmas co-existed with an exsolved volatile phase under pre-eruptive conditions and propose that this played a main role to their explosive style. Our mass balance of SO2 suggests the magma that led to the 2007 lava dome had no or negligible excess fluids. This is likely the result of several inter-eruptive crises after the 1990 eruption that likely allowed gases to be released. Thus, tracking the degree to which volcanoes may be opened or closed to gases escaping in inter-eruptive periods may help to anticipate eruption styles.
Data availability statement
The original contributions presented in the study are included in the article/Supplementary Material, and stored in the data repository of Nanyang Technological University, Singapore (DR-NTU).
Author contributions
SU: conceptualization, project administration, funding acquisition, formal analyses, investigation, data curation, visualization, and writing (original draft; review and editing). JA: methodology, investigation, formal analyses, resources, writing—review and editing, supervision, and final approval of manuscript. FC: conceptualization, investigation, resources, methodology, writing—review and editing, supervision, project administration, funding acquisition, and final approval of manuscript. BS: methodology, writing—review and editing, supervision, funding acquisition, and final approval of manuscript. HH: supervision, writing—review and editing, and final approval of manuscript. SC: analyses, writing—review and editing, and final approval of manuscript.
Funding
JA and BS acknowledge support from both LabEx VOLTAIRE (ANR-10-LABX-100-01) and EquipEx PLANEX (ANR-11-EQPX-0036) projects. SU acknowledges funding from the Stephen Riady Geosciences Scholarship 2018–2019. FC acknowledges support by the Earth Observatory of Singapore via its funding from the National Research Foundation Singapore and the Singapore Ministry of Education under the Research Centres of Excellence initiative. FC was funded by NRFi Award (NRFNRFI2017-06). This work comprises EOS contribution number 455. SC acknowledges funding from the NASA Interdisciplinary Research in Earth Science program (80NSSC20K1773).
Acknowledgments
We would like to thank R. Champallier and I. di Carlo from ISTO-Orléans for assistance with experiments and sensor analyses. Y-J Hsu and J. Oalmann from the Earth Observatory of Singapore are thanked for assistance with analyses on the analytical procedures and discussions around experimental petrology. We thank S. Jenkins, C. Widiwijayanti, P. Lesage, and P. Allard for discussions on Kelud volcano. We also thank K. Iacovino for assistance with understanding VESIcal v.1.0.1. We would like to acknowledge the Facility for Analysis, Characterization, Testing and Simulation, Nanyang Technological University, Singapore, for the use of their electron microscopy/X-ray facilities.
Conflict of interest
The authors declare that the research was conducted in the absence of any commercial or financial relationships that could be construed as a potential conflict of interest.
Publisher’s note
All claims expressed in this article are solely those of the authors and do not necessarily represent those of their affiliated organizations, or those of the publisher, the editors, and the reviewers. Any product that may be evaluated in this article, or claim that may be made by its manufacturer, is not guaranteed or endorsed by the publisher.
Supplementary material
The Supplementary Material for this article can be found online at: https://www.frontiersin.org/articles/10.3389/feart.2022.882097/full#supplementary-material
References
Andújar, J., Costa, F., and Scaillet, B. (2013). Storage conditions and eruptive dynamics of central versus flank eruptions in volcanic islands: The case of tenerife (canary islands, Spain). J. Volcanol. Geotherm. Res. 260, 62–79. doi:10.1016/j.jvolgeores.2013.05.004
Andersen, D. J., Lindsley, D. H., and Davidson, P. M. (1993). QUILF: A pascal program to assess equilibria among Fe-Mg-Mn-Ti oxides, pyroxenes, olivine, and quartz. Comput. Geosci. 19 (9), 1333–1350.
Arzilli, F., Morgavi, D., Petrelli, M., Polacci, M., Burton, M., Di Genova, D., et al. (2019). The unexpected explosive sub-Plinian eruption of Calbuco volcano (22-23 April 2015; southern Chile): Triggering mechanism implications. J. Volcanol. Geotherm. Res. 378, 35–50. doi:10.1016/j.jvolgeores.2019.04.006
Bernard, A., Knittel, U., Weber, B., Weis, D., Albrecht, A., Hattori, K., et al. (1996). “Petrology and geochemistry of the 1991 eruption products of Mount Pinatubo,” in FIRE and MUD: Eruptions and lahars of mount Pinatubo, Philippines. Editors C. G. Newhall, and R. S. Punongbayan (Seattle, Washington: Univ of Washington Press).
Bernard, A., and Mazot, A. (2004). “Geochemical evolution of the young crater lake of Kelud volcano in Indonesia,” in Water-rock interaction (WRI-11). Editors R. B. Wanty (Rotterdam, Netherlands: A.A. Balkema), 87–90.
Bourdier, J. L., Pratomo, I., Thouret, J. C., Georges Boudon, G., and Vincent, P. M. (1997a). Observations, stratigraphy and eruptive processes of the 1990 eruption of Kelut volcano, Indonesia. J. Volcanol. Geotherm. Res. 79, 181–203. doi:10.1016/s0377-0273(97)00031-0
Bourdier, J. L., Thouret, J. C., Pratomo, I., Vincent, P. M., and Boudon, G. (1997b). Menaces volcaniques au Kelut (Java, indonésie) : Les enseignements de l'éruption de 1990. Comptes Rendus de l'Académie des Sci. - Ser. IIA - Earth Planet. Sci. 324, 961–968. doi:10.1016/s1251-8050(97)83980-8
Bull, K. F., and Buurman, H. (2013). An overview of the 2009 eruption of Redoubt Volcano, Alaska. J. Volcanol. Geotherm. Res. 259, 2–15. doi:10.1016/j.jvolgeores.2012.06.024
Bucholz, C. E., Gaetani, G. A., Behn, M. D., and Shimizu, N. (2013). Post-entrapment modification of volatiles and oxygen fugacity in olivine-hosted melt inclusions. Earth Planet. Sci. Lett. 374, 145–155.
Campagnola, S., Romano, C., Mastin, L. G., and Vona, A. (2016). Confort 15 model of conduit dynamics: Applications to pantelleria green tuff and etna 122 BC eruptions. Contributions Mineralogy Petrology 171, 1–25. doi:10.1007/s00410-016-1265-5
Caricchi, L., Sheldrake, T. E., and Blundy, J. (2018). Modulation of magmatic processes by CO2 flushing. Earth Planet. Sci. Lett. 491, 160–171. doi:10.1016/j.epsl.2018.03.042
Carn, S. A., Clarisse, L., and Prata, A. J. (2016). Multi-decadal satellite measurements of global volcanic degassing. J. Volcanol. Geotherm. Res. 311, 99–134. doi:10.1016/j.jvolgeores.2016.01.002
Carn, S. A., Fioletov, V. E., McLinden, C. A., Li, C., and Krotkov, N. A. (2017). A decade of global volcanic SO2 emissions measured from space. Sci. Rep. 7, 44095. doi:10.1038/srep44095
Carn, S. A. (2022). Multi-satellite volcanic sulfur dioxide L4 long-term global database V4. Greenbelt, MD, United States: Goddard Earth Science Data and Information Services Center (GES DISC).
Cashman, K. v., and Sparks, R. J. (2013). How volcanoes work: A 25 year perspective. Geol. Soc. Am. Bull. 125, 664–690. doi:10.1130/b30720.1
Cassidy, M., Castro, J. M., Helo, C., Troll, V. R., Deegan, F. M., Muir, D., et al. (2016). Volatile dilution during magma injections and implications for volcano explosivity. Geology 44, 1027–1030. doi:10.1130/g38411.1
Cassidy, M., Ebmeier, S. K., Helo, C., Watt, S. F. L., Caudron, C., Odell, A., et al. (2019). Explosive eruptions with little warning: Experimental petrology and volcano monitoring observations from the 2014 eruption of Kelud, Indonesia. Geochem. Geophys. Geosystems, 1, 30. doi:10.1029/2018gc008161
Cassidy, M., Manga, M., Cashman, K., and Bachmann, O. (2018). Controls on explosive-effusive volcanic eruption styles. Nat. Commun. 9, 3. doi:10.1038/s41467-018-05293-3
Caudron, C., Mazot, A., and Bernard, A. (2012). Carbon dioxide dynamics in Kelud volcanic lake. J. Geophys. Res. Solid Earth 117, 5102. doi:10.1029/2011jb008806
Corsaro, R. A., and Pompilio, M. (2004). Buoyancy-controlled eruption of magmas at Mt Etna. Terra nova. 16, 16–22. doi:10.1046/j.1365-3121.2003.00520.x
Costa, F., Scaillet, B., and Pichavant, M. (2004). Petrological and experimental constraints on the pre-eruption conditions of holocene dacite from volcan san pedro (36 S, Chilean andes) and the importance of sulphur in silicic subduction-related magmas. J. Petrology 45, 855–881. doi:10.1093/petrology/egg114
Deegan, F. M., Troll, V. R., Freda, C., Misiti, V., Chadwick, J. P., McLeod, C. L., et al. (2010). Magma-carbonate interaction processes and associated CO2 release at Merapi volcano, Indonesia: Insights from experimental petrology. J. Petrology 51, 1027–1051. doi:10.1093/petrology/egq010
Deegan, F. M., Troll, V. R., Whitehouse, M. J., Jolis, E. M., and Freda, C. (2016). Boron isotope fractionation in magma via crustal carbonate dissolution. Sci. Rep. 6, 1–7. doi:10.1038/srep30774
Deer, W. A., Howie, R. A., and Zussman, J. (1992). An introduction to the rock-forming minerals. 2nd ed. Harlow, Essex, England: Longman Scientific & Technical.
Dingwell, D. B., Bagdassarov, N. S., Bussod, G. Y., and Webb, S. L. (1993). “Magma rheology,” in Experiments at high pressure and applications to the earth’s mantle: Short course handbook. Editor R. W. Luth (Edmonton: Mineralogical Association of Canada), 131–196.
Dixon, J. E. (1997). Degassing of alkalic basalts. Am. Mineralogist 82, 368–378. doi:10.2138/am-1997-3-415
Edmonds, M., and Woods, A. W. (2018). Exsolved volatiles in magma reservoirs. J. Volcanol. Geotherm. Res. 368, 13–30. doi:10.1016/j.jvolgeores.2018.10.018
Elissondo, M., Baumann, V., Bonadonna, C., Pistolesi, M., Cioni, R., Bertagnini, A., et al. (2016). Chronology and impact of the 2011 cordón Caulle eruption, Chile. Nat. Hazards Earth Syst. Sci. 16, 675–704. doi:10.5194/nhess-16-675-2016
Erdmann, S., Martel, C., Pichavant, M., Bourdier, J.-L., Champallier, R., Komorowski, J.-C., et al. (2016). Constraints from phase equilibrium experiments on pre-eruptive storage conditions in mixed magma systems: A case study on crystal-rich basaltic andesites from mount Merapi, Indonesia. J. Petrol. 57, 535–560. doi:10.1093/petrology/egw019
Ghiorso, M. S., and Gualda, G. A. R. (2015). An H2O-CO2 mixed fluid saturation model compatible with rhyolite-MELTS. Contrib. Mineral. Pet. 169, 53. doi:10.1007/s00410-015-1141-8
Giordano, D., Russell, J. K., and Dingwell, D. B. (2008). Viscosity of magmatic liquids: A model. Earth Planet. Sci. Lett. 271, 123–134. doi:10.1016/j.epsl.2008.03.038
Giuffrida, M., Holtz, F., Vetere, F., and Viccaro, M. (2017). Effects of CO2flushing on crystal textures and compositions: Experimental evidence from recent K-trachybasalts erupted at Mt. Etna. Contributions Mineralogy Petrology 172, 1–18. doi:10.1007/s00410-017-1408-3
Global Volcanism Program (GVP) (1990a). Report on Kelut (Indonesia). Report. Bull. Glob. Volcanism Netw.
Global Volcanism Program (GVP) (2007). Report on Kelut (Indonesia). Report. Bulletin of the Global Volcanism Network.
Gonnermann, H. M., and Manga, M. (2013). “Dynamics of magma ascent in the volcanic conduit,” in Modeling volcanic processes: The physics and mathematics of volcanism. Editors S. Fagents, T. K. P. Gregg, and R. M. C. Lopes (Cambridge University Press), 55–84. doi:10.1017/cbo9781139021562.004
Hidayati, S., Basuki, A., and KristiantoMulyana, I. (2009). Emergence of lava dome from the crater lake of Kelud volcano. East Java 4, 229–238. doi:10.17014/ijog.v4i4.83
Hidayati, S. (2009). Emergence of lava dome from the crater lake of Kelud volcano, East Java. Indonesian J. Geoscience 4, 229–238. doi:10.17014/ijog.vol4no4.20091
Hidayati, S., Triastuty, H., Mulyana, I., Adi, S., Ishihara, K., Basuki, A., et al. (2019). Differences in the seismicity preceding the 2007 and 2014 eruptions of Kelud volcano, Indonesia. J. Volcanol. Geotherm. Res. 382, 50–67. doi:10.1016/j.jvolgeores.2018.10.017
Humaida, H. (2013). A geochemical study on Merapi and Kelud volcanic eruptions (Unpublished PhD Thesis). Yogyakarta, Indonesia: Universitas Gadjah Mada.
Iacovino, K., Matthews, S., Wieser, P. E., Moore, G. M., and Bégué, F. (2021). VESIcal Part I: An open-source thermodynamic model engine for mixed volatile (H2O-CO2) solubility in silicate melts. Earth Space Sci. 8, 1–55. doi:10.1029/2020ea001584
Jay, J., Costa, F., Pritchard, M., Lara, L., Singer, B., and Herrin, J. (2014). Locating magma reservoirs using InSAR and petrology before and during the 2011-2012 Cordón Caulle silicic eruption. Earth Planet. Sci. Lett. 395, 254–266. doi:10.1016/j.epsl.2014.03.046
Jeffery, A. J., Gertisser, R., Troll, V. R., Jolis, E. M., Dahren, B., Harris, C., et al. (2013). The pre-eruptive magma plumbing system of the 2007-2008 dome-forming eruption of Kelut volcano, East Java, Indonesia. Contrib. Mineral. Pet. 166, 275–308. doi:10.1007/s00410-013-0875-4
Kristiansen, N. I., Prata, A. J., Stohl, A., and Carn, S. A. (2015). Stratospheric volcanic ash emissions from the 13 February 2014 Kelut eruption. Geophys. Res. Lett. 42, 588–596. doi:10.1002/2014gl062307
Kunrat, S. L. (2009). Geochemical and thermodynamic modeling of volcanic fluids and their interpretation for volcano monitoring (Unpublished MSc thesis). Brussels, Belgium: Universite Libre de Bruxelles.
Lê, S., Josse, J., and Husson, F. (2008). FactoMineR: An R package for multivariate analysis. J. Stat. Softw. 25, 1–18. doi:10.18637/jss.v025.i01
Leake, B. E., Woolley, A. R., Arps, C. E. S., Birch, W. D., Gilbert, M. C., Grice, J. D., et al. (1997). Nomenclature of amphiboles report of the subcommittee on amphiboles of the international mineralogical association commission on new minerals and mineral names. ejm 9, 623–651. doi:10.1127/ejm/9/3/0623
Lesage, P., and Surono, (1995). Seismic precursors of the february 10, 1990 eruption of Kelut volcano, Java. J. Volcanol. Geotherm. Res. 65, 135–146. doi:10.1016/0377-0273(94)00051-h
Li, C., Krotkov, N. A., Carn, S. A., Zhang, Y., Spurr, R. J. D., and Joiner, J. (2017). New-generation NASA Aura Ozone monitoring instrument (OMI) volcanic SO<sub>2</sub> dataset: Algorithm description, initial results, and continuation with the suomi-NPP Ozone mapping and profiler suite (OMPS). Atmos. Meas. Tech. 10, 445–458. doi:10.5194/amt-10-445-2017
Li, W., Costa, F., and Nagashima, K. (2021). Apatite crystals reveal melt volatile budgets and magma storage depths at Merapi volcano, Indonesia. J. Petrology 62, egaa100. doi:10.1093/petrology/egaa100
Longpré, M. A., Stix, J., Costa, F., Espinoza, E., and Muñoz, A. (2014). Magmatic processes and associated timescales leading to the January 1835 eruption of Cosigüina Volcano, Nicaragua. J. Petrology 55, 1173–1201. doi:10.1093/petrology/egu022
Lubis, A. M. (2014). Uplift of Kelud volcano prior to the november 2007 eruption as observed by L-band insar. J. Eng. Technol. Sci. 46, 245–257. doi:10.5614/j.eng.technol.sci.2014.46.3.1
Maeno, F., Nakada, S., Yoshimoto, M., Shimano, T., Hokanishi, N., Zaennudin, A., et al. (2019a). A sequence of a plinian eruption preceded by dome destruction at Kelud volcano, Indonesia, on February 13, 2014, revealed from tephra fallout and pyroclastic density current deposits. J. Volcanol. Geotherm. Res. 382, 24–41. doi:10.1016/j.jvolgeores.2017.03.002
Maeno, F., Nakada, S., Yoshimoto, M., Shimano, T., Hokanishi, N., Zaennudin, A., et al. (2019b). Eruption pattern and a long-term magma discharge rate over the past 100 years at Kelud Volcano, Indonesia. J. Disaster Res. 14, 27–39. doi:10.20965/jdr.2019.p0027
Martel, C. (2012). Eruption dynamics inferred from microlite crystallization experiments: Application to plinian and dome-forming eruptions of Mt. Pelee (Martinique, lesser antilles). J. Petrology 53, 699–725. doi:10.1093/petrology/egr076
Mastin, L. G. (2002). Insights into volcanic conduit flow from an open-source numerical model. Geochem. Geophys. Geosystems 3, 229–235. doi:10.1029/2001gc000192
Melnik, O., and Sparks, R. S. J. (2002). “Modelling of conduit flow dynamics during explosive activity at Soufrière Hills Volcano, Montserrat,” in Geological society (London: Geological Society Publications), 21, 307–317. doi:10.1144/gsl.mem.2002.21.01.14Memoirs
Melnik, O., and Sparks, R. S. J. (1999). Nonlinear dynamics of lava dome extrusion. Nature 402, 37–41. doi:10.1038/46950
Nakamichi, H., Iguchi, M., Triastuty, H., Hendrasto, M., and Mulyana, I. (2017). Differences of precursory seismic energy release for the 2007 effusive dome-forming and 2014 Plinian eruptions at Kelud volcano, Indonesia. J. Volcanol. Geotherm. Res. 15, 68–80. doi:10.1016/j.jvolgeores.2017.08.004
Nakashima, Y., Heki, K., Takeo, A., Cahyadi, M. N., Aditiya, A., and Yoshizawa, K. (2016). Atmospheric resonant oscillations by the 2014 eruption of the Kelud volcano, Indonesia, observed with the ionospheric total electron contents and seismic signals. Earth Planet. Sci. Lett. 434, 112–116. doi:10.1016/j.epsl.2015.11.029
Norrish, K., and Hutton, J. T. (1969). An accurate X-ray spectrographic method for the analysis of a wide range of geological samples. Geochimica Cosmochimica Acta 33, 431–453. doi:10.1016/0016-7037(69)90126-4
Pallister, J. S., Hoblitt, R. P., Crandell, D. R., and Mullineaux, D. R. (1992). Mount st. Helens a decade after the 1980 eruptions: Magmatic models, chemical cycles, and a revised hazards assessment. Bull. Volcanol. 54, 126–146. doi:10.1007/bf00278003
Pallister, J. S., Hoblitt, R. P., Meeker, G. P., Knight, R. J., and Siems, D. F. (1996). “Magma mixing at mount Pinatubo: Petrographic and chemical evidence from the 1991 deposits,” in FIRE and MUD: Eruptions and lahars of mount Pinatubo, Philippines. Editors C. G. Newhall, and R. S. Punongbayan (Seattle, Washington: Univ of Washington Press).
Pichavant, M., Costa, F., Burgisser, A., Scaillet, B., Martel, C., and Poussineau, S. (2007). Equilibration scales in silicic to intermediate magmas implications for experimental studies. J. Petrology 48, 1955–1972. doi:10.1093/petrology/egm045
Pichavant, M., Martel, C., Bourdier, J.-L., and Scaillet, B. (2002). Physical conditions, structure, and dynamics of a zoned magma chamber: Mount Pelée (Martinique, Lesser Antilles Arc). J. Geophys. Res. 107, 1–28. doi:10.1029/2001jb000315
Popa, R. G., Dietrich, V. J., and Bachmann, O. (2020). Effusive-explosive transitions of water-undersaturated magmas. The case study of methana volcano, south aegean arc. J. Volcanol. Geotherm. Res. 399, 106884. doi:10.1016/j.jvolgeores.2020.106884
Popa, R. G., Tollan, P., Bachmann, O., Schenker, V., Ellis, B., and Allaz, J. M. (2021). Water exsolution in the magma chamber favors effusive eruptions: Application of Cl-F partitioning behavior at the Nisyros-Yali volcanic area. Chem. Geol. 570, 120170. doi:10.1016/j.chemgeo.2021.120170
Pownceby, M. I., and O'Neill, H. S. C. (1994). Thermodynamic data from redox reactions at high temperatures. IV. Calibration of the Re-ReO2 oxygen buffer from EMF and NiO+Ni-Pd redox sensor measurements. Contr. Mineral. Pet. 118, 130–137. doi:10.1007/bf01052864
Prouteau, G., and Scaillet, B. (2003). Experimental constraints on the origin of the 1991 Pinatubo dacite. J. Petrology 44, 2203–2241. doi:10.1093/petrology/egg075
Putirka, K. (2016). Amphibole thermometers and barometers for igneous systems and some implications for eruption mechanisms of felsic magmas at arc volcanoes. Am. Mineralogist 101, 841–858. doi:10.2138/am-2016-5506
Putirka, K. D. (2008). Thermometers and barometers for volcanic systems. Rev. Mineralogy Geochem. 69, 61–120. doi:10.2138/rmg.2008.69.3
Ridolfi, F., Renzulli, A., and Puerini, M. (2010). Stability and chemical equilibrium of amphibole in calc-alkaline magmas: An overview, new thermobarometric formulations and application to subduction-related volcanoes. Contrib. Mineral. Pet. 160, 45–66. doi:10.1007/s00410-009-0465-7
Roux, J., and Lefèvre, A. (1992). A fast-quench device for internally heated pressure vessels. ejm 4, 279–282. doi:10.1127/ejm/4/2/0279
Scaillet, B., and Evans, B. W. (1999). The 15 june 1991 eruption of mount Pinatubo. I. Phase equilibria and pre-eruption P-T-fO2-fH2O conditions of the dacite magma. J. Petrology 40, 381–411. doi:10.1093/petroj/40.3.381
Scaillet, B., Pichavant, M., and Roux, J. (1995). Experimental crystallization of leucogranite magmas. J. Petrology 36, 663–705. doi:10.1093/petrology/36.3.663
Scaillet, B., Pichavant, M., Roux, J., Humbert, G., and Lefevre, A. (1992). Improvements of the Shaw membrane technique for measurement and control of fH2 at high temperatures and pressures. Am. Mineralogist 77, 647–655.
Shinohara, H. (2008). Excess degassing from volcanoes and its role on eruptive and intrusive activity. Rev. Geophys. 46, 1–31. doi:10.1029/2007rg000244
Shishkina, T. A., Botcharnikov, R. E., Holtz, F., Almeev, R. R., and Portnyagin, M. V. (2010). Solubility of H2O- and CO2-bearing fluids in tholeiitic basalts at pressures up to 500MPa. Chem. Geol. 277, 115–125. doi:10.1016/j.chemgeo.2010.07.014
Sisson, T. W., and Bacon, C. R. (1999). Gas-driven filter pressing in magmas. Geol 27, 613–616. doi:10.1130/0091-7613(1999)027<0613:gdfpim>2.3.co;2
Smyth, H. R., Hamilton, P. J., Hall, R., and Kinny, P. D. (2007). The deep crust beneath island arcs: Inherited zircons reveal a gondwana continental fragment beneath East Java, Indonesia. Earth Planet. Sci. Lett. 258, 269–282. doi:10.1016/j.epsl.2007.03.044
Spang, A., Burton, M., Kaus, B. J. P., and Sigmundsson, F. (2022). Quantification of volcano deformation caused by volatile accumulation and release. Geophys. Res. Lett. 49, 1–10. doi:10.1029/2021gl097502
Surono, , , Jousset, P., Pallister, J., Boichu, M., Buongiorno, M. F., Budisantoso, A., et al. (2012). The 2010 explosive eruption of Java's Merapi volcano-A ‘100-year' event. J. Volcanol. Geotherm. Res. 241-242, 121–135. doi:10.1016/j.jvolgeores.2012.06.018
Tait, S., Jaupart, C., and Vergniolle, S. (1989). Pressure, gas content and eruption periodicity of a shallow, crystallising magma chamber. Earth Planet. Sci. Lett. 92, 107–123. doi:10.1016/0012-821x(89)90025-3
Taylor, J. R., Wall, V. J., and Pownceby, M. I. (1992). The calibration and application of accurate redox sensors. Am. Mineralogist 77, 284–295.
Thouret, J.-C., Abdurachman, K. E., Bourdier, J.-L., and Bronto, S. (1998). Origin, characteristics, and behaviour of lahars following the 1990 eruption of Kelud volcano, eastern Java (Indonesia). Bull. Volcanol. 59, 460–480. doi:10.1007/s004450050204
Tramontano, S., Gualda, G. A. R., and Ghiorso, M. S. (2017). Internal triggering of volcanic eruptions: Tracking overpressure regimes for giant magma bodies. Earth Planet. Sci. Lett. 472, 142–151. doi:10.1016/j.epsl.2017.05.014
Utami, S. B., Costa, F., Lesage, P., Allard, P., and Humaida, H. (2021). Fluid fluxing and accumulation drive decadal and short-lived explosive basaltic andesite eruptions preceded by limited volcanic unrest. J. Petrology 62, egab086. doi:10.1093/petrology/egab086
Utami, S. B. (2021). Petrological and monitoring insights into the mechanisms driving eruptions of Kelud volcano, Indonesia (Unpublished PhD Thesis). Singapore: Nanyang Technological University.
Vandemeulebrouck, J., Sabroux, J.-C., Halbwachs, M., Surono, N., Poussielgue, J., Grangeon, J., et al. (2000). Hydroacoustic noise precursors of the 1990 eruption of Kelut Volcano, Indonesia. J. Volcanol. Geotherm. Res. 97, 443–456. doi:10.1016/s0377-0273(99)00176-6
Waters, L. E., and Lange, R. A. (2017). An experimental study of Fe2+-MgKD between orthopyroxene and rhyolite: A strong dependence on H2O in the melt. Contributions Mineralogy Petrology 172, 1–13. doi:10.1007/s00410-017-1358-9
Waters, L. E., and Lange, R. A. (2015). An updated calibration of the plagioclase-liquid hygrometer-thermometer applicable to basalts through rhyolites. Am. Mineralogist 100, 2172–2184. doi:10.2138/am-2015-5232
Whelley, P. L., Newhall, C. G., and Bradley, K. E. (2015). The frequency of explosive volcanic eruptions in Southeast Asia. Bull. Volcanol. 77, 1. doi:10.1007/s00445-014-0893-8
Williams-Jones, G., Rymer, H., and Rothery, D. A. (2003). Gravity changes and passive SO2 degassing at the Masaya caldera complex, Nicaragua. J. Volcanol. Geotherm. Res. 123, 137–160. doi:10.1016/s0377-0273(03)00033-7
Wirakusumah, A. D. (1991). Some studies of volcanology, petrology and structure of Mt. Kelut, east Java, Indonesia (Unpublished PhD Thesis). Wellington, New Zealand: Victoria University of Wellington.
Woods, A. W., and Koyaguchi, T. (1994). Transitions between explosive and effusive eruptions of silicic magmas. Nature 370, 641–644. doi:10.1038/370641a0
Young, S. R., Sparks, R. S. J., Aspinall, W. P., Lynch, L. L., Miller, A. D., Robertson, R. E. A., et al. (1998). Overview of the eruption of soufriere Hills volcano, Montserrat, 18 july 1995 to december 1997. Geophys. Res. Lett. 25, 3389–3392. doi:10.1029/98gl01405
Keywords: experimental petrology, Kelud, Kelut, eruption style, volatiles, volcano monitoring, basaltic andesite, arc volcanoes
Citation: Utami SB, Andùjar J, Costa F, Scaillet B, Humaida H and Carn S (2022) Pre-eruptive excess volatiles and their relationship to effusive and explosive eruption styles in semi-plugged volcanoes. Front. Earth Sci. 10:882097. doi: 10.3389/feart.2022.882097
Received: 23 February 2022; Accepted: 29 July 2022;
Published: 09 September 2022.
Edited by:
Jacob B. Lowenstern, United States Geological Survey, United StatesReviewed by:
Kayla Iacovino, Johnson Space Center (NASA), United StatesMike Cassidy, University of Oxford, United Kingdom
Copyright © 2022 Utami, Andùjar, Costa, Scaillet, Humaida and Carn. This is an open-access article distributed under the terms of the Creative Commons Attribution License (CC BY). The use, distribution or reproduction in other forums is permitted, provided the original author(s) and the copyright owner(s) are credited and that the original publication in this journal is cited, in accordance with accepted academic practice. No use, distribution or reproduction is permitted which does not comply with these terms.
*Correspondence: Sri Budhi Utami, c3JpLmJ1ZGhpLnV0YW1pQGdtYWlsLmNvbQ==