- 1Research Institute of Petroleum Exploration and Development, Beijing, China
- 2Xinjiang Oil Company, PetroChina, Karamay, China
As an unconventional petroleum reservoir, the volcanic reservoir is essential for finding large-scale oil and gas reserves in deep sedimentary basins. Based on basin modeling, organic geochemistry, and organic petrology, this study evaluates the exploration potential of the Carboniferous volcanic-petroleum system in the Jimsar Sag of the southeastern Junggar Basin. The Carboniferous source rocks in the study area were developed in the Lower Carboniferous Songkharsu Formation, a set of marine–terrigenous transitional source rocks, lithologically composed of carbonaceous mudstone, mudstone, and coal. The kerogen is characterized by type II2–III, indicating a gas-prone source rock. Carbonaceous mudstones, mudstone, and coal are classified as medium–good, medium, and poor source rocks, respectively. The hydrocarbon-generating potential is close to that of the Kelameili gas field. The Carboniferous-reservoir oil in well J15 is characterized by 13C-enriched stable carbon isotopes, relatively high ƩC31–35/C30 and Pr/Ph ratios, relatively low density, gammacerane index, regular C29-sterane content, and undetected β-carotene, indicating a Songkharsu origin. The Carboniferous-reservoired gas from well J3301 has stable carbon isotope composition enriched in 13C, similar to the gas from the Kelameili gas field, and should be from the Songkharsu source rock. This set of source rocks is widely distributed in the Jimsar Sag with considerable thickness, among which thickness >100 m reaches 580 km2, accounting for 38.7% of the whole sag. The Songkharsu source rocks entered the main oil-generating window at the end of the Early Jurassic. The area of Songkharsu source rocks in the Jimsar Sag with gas-generating intensity greater than 20 × 108 m3/km2 reaches 1,015 km2, whereas that with oil-generating intensity greater than 500 × 104 t/km2 reaches 1,146 km2. However, 13 Carboniferous volcanic lithological traps were found in the sag, covering an area of 230 km2. The Carboniferous volcanic-petroleum system in the Jimsar Sag has the resource potential to form large and medium oil and gas fields, which could become a critical replacement field for volcanic oil and gas exploration in the Junggar Basin after the Klameili gas field.
1 Introduction
Volcanic reservoirs are unconventional petroleum reservoirs whose physical properties are not constrained by depth (Zou et al., 2008) and are important for finding large-scale oil and gas reserves in deep sedimentary basins. Since the first discovery of volcanic reservoirs in the San Joaquin Basin, California, United States, in 1887 (Petford and Mccaffrey, 2003), there has been a history of volcanic oil and gas exploration for more than 130 years. Volcanic reservoirs, such as Scott Reef (Australia), Jatibarang (Indonesia), Kudu (Namibia), Lake Kivu (Congo), Ben Khalala (Algeria), Samgori (Georgia), Urucu (Brazil), Yaraktin (Russia), and Ragusa (Italy) have been discovered globally (Petford and Mccaffrey, 2003).
Volcanic rocks are in and around sedimentary basins in China, and the exploration of volcanic reservoirs has been conducted for more than 60 years. Currently, China has made a series of significant breakthroughs in oil and gas exploration for volcanic reservoirs in the Junggar, Songliao, Erlian, Tarim, Santanghu, and Sichuan basins; volcanic oil and gas resources have been developed (Zou et al., 2008; Dai et al., 2021). Among them, the Junggar Basin has the highest degree of exploration for volcanic-petroleum reservoirs, and several large and medium volcanic reservoirs have been discovered in the northwest margin (Cao et al., 2010; Chang et al., 2019), hinterland (Chen et al., 2017; Zhi et al., 2022), and east (Yu et al., 2014; Sun et al., 2016; Guo et al., 2020) of the basin. In 2006, the Kelameili gas field was discovered in the northeastern part of the basin (Figure 1A), with proven reserves of 1,033 × 108 m3, the largest volcanic gas reservoir discovered in China (Gong et al., 2019,2021).
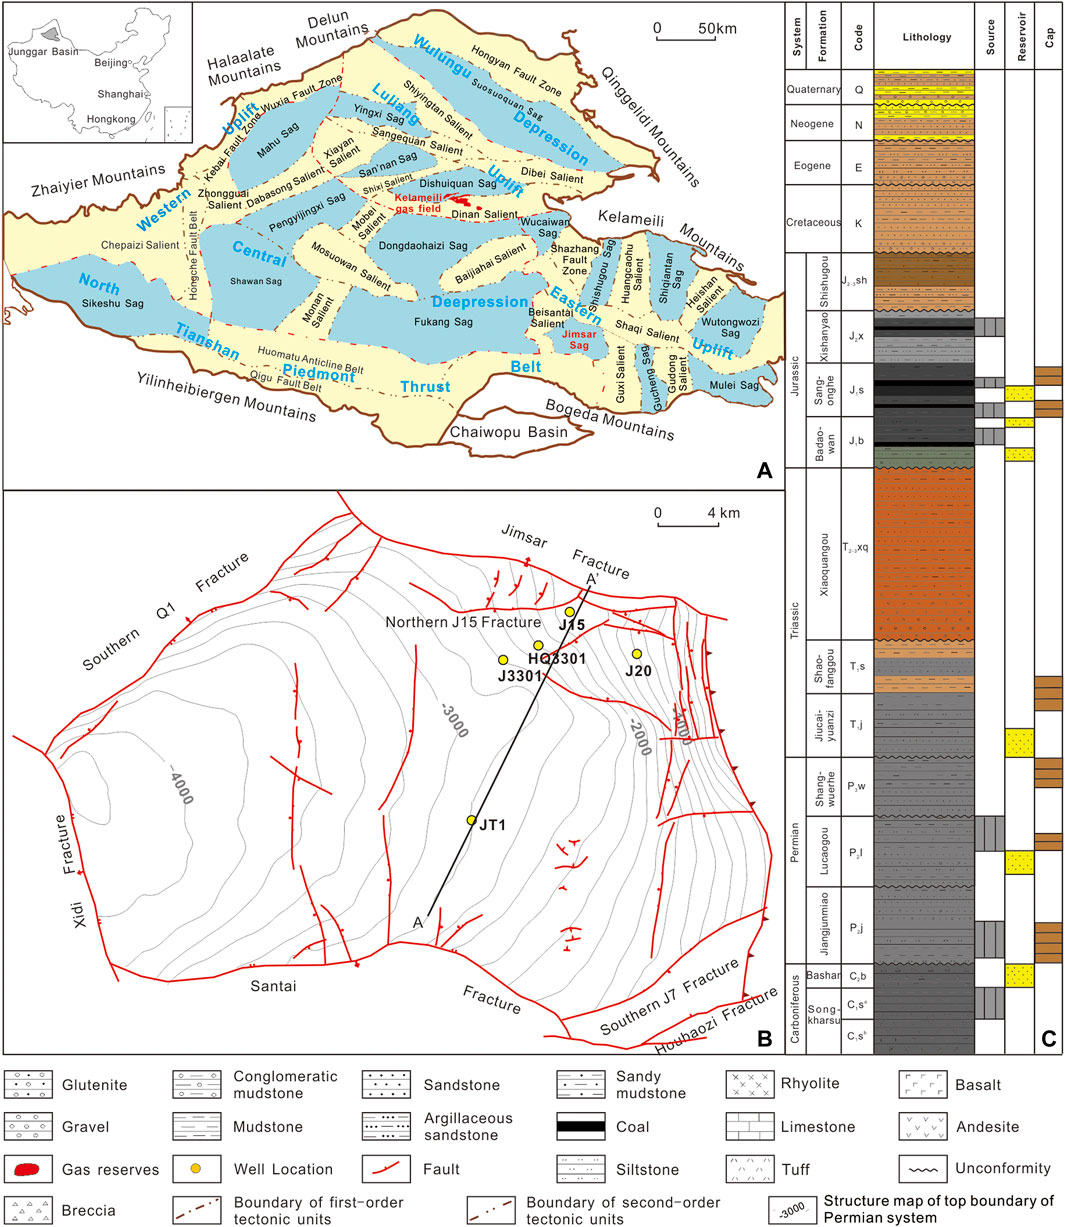
FIGURE 1. Geological background of Jimsar Sag in the southeastern Junggar Basin. (A): The geological setting of Junggar Basin; (B): The geological setting of Jimsar Sag; (C): The stratigraphic column in the Jimsar Sag.
The Jimsar Sag is approximately 120 km southeast of the Kelameili gas field (Figure 1A). Its shale reservoir in the Permian Lucaogou Formation (P2l) has a billion-ton resource scale, which has become an important shale oil production base in China (Bai et al., 2017; Hu et al., 2018). The Kelameili gas field and the Jimsar Sag share a similar geotectonic setting during the Carboniferous; they are both parts of the remnant ocean basin formed after the closure of the Paleo-Asian Ocean (Carroll et al., 1995; Xiao W. J. et al., 2008). In 2001, well J15 in the Jimsar Sag obtained an industrial oil flow of 5.1 t/d in the Carboniferous system. In 2019, well J3301 obtained an excellent oil and gas in the Carboniferous system (Figure 1B). In addition, wells JT1 and J20 drilled in the Carboniferous encountered huge thick volcanic reservoirs (Figure 1B). The information shows that the Carboniferous petroleum system of this sag has excellent exploration prospects.
However, in the past 20 years, efforts have focused on exploring and developing P2l shale oil in this area. Thus, the source rock quality, oil/gas source, and hydrocarbon accumulation conditions of the Carboniferous petroleum system have not been studied. By analyzing organic geochemistry, organic petrology, and basin modeling, this study evaluates the exploration potential of the Carboniferous volcanic reservoirs in the Jimsar Sag and reveals a potential giant volcanic-petroleum system. The research results have important implications for domestic and international exploration of volcanic reservoirs.
2 Geological Background
The Junggar Basin, located in northwest China (Figure 1A), is an intraland superimposed basin that developed from the Early Carboniferous to the Quaternary (Xiao W. J. et al., 2008). It is at the intersection of Kazakhstan, Siberian, and Tarim Paleoplates (Xiao W. J. et al., 2008; He et al., 2018). Based on the Permian tectonic pattern, the basin can be divided into six first-order tectonic units (Central Depression, Wulungu Depression, Luliang Uplift, Western Uplift, Eastern Uplift, and North Tianshan Piedmont Thrust Belt). These first-order tectonic units can be further subdivided into 44 second-order tectonic units (Figure 1A) (He et al., 2018).
The Jimsar Sag is a “dustpan-shaped” sag developed on a Carboniferous folded basement. It is a second-order tectonic unit of the Eastern Uplift covering approximately 1,500 km2 (Figures 1A,B) (Bai et al., 2017). During the Late Carboniferous, the Shaqi Salient to the north and the Gusi Salient to the east of the sag were uplifted under the influence of the Hercynian movement (Xiao W. J. et al., 2008; He et al., 2018). The water in the Jimsar Sag was connected to that of the Bogda Mountain Front Sag and the Fukang Sag simultaneously (Li et al., 2015a,b; Zhang L. et al., 2020). During the early Middle Permian, the study area subsided dramatically and became a relatively independent sedimentary unit (Li et al., 2015a,b; Zhang L. et al., 2020). At the end of the Triassic, the Shaqi Salient was strongly uplifted by the Indochinese movement, and the Permian and Triassic strata of the east slope of the Jimsar Sag suffered different denudation (Novikov, 2013; Li et al., 2015a,b; Zhang L. et al., 2020). During the Late Jurassic–Cretaceous, the southeast corner of the sag uplifted, and the study area denudated under the influence of Acts II and III of the Yanshan Movement (He et al., 2013; Novikov, 2013). During the Himalayan period, the sag was uplifted from east to west, and the strata were thinned to the east, forming the present-day tectonic pattern (He et al., 2013; Li et al., 2015a,b).
The Jimsar Sag is developed with Carboniferous–Quaternary strata from the bottom up, with five regional unconformities (i.e., top Carboniferous, top Middle Permian, top Triassic, top Jurassic, and top Cretaceous) (Figure 1C). P2l is the most crucial source rock formation in the study area (Carroll, 1998; Wang et al., 2013). It was formed in a saline lacustrine environment after the closure of the residual sea, with high organic matter abundance, and is an excellent oil-prone source rock (Bai et al., 2017; Hu et al., 2018). The Carboniferous in the study area contains the Lower Carboniferous Songkharsu Formation (C1s) and Upper Carboniferous Bashan Formation (C2b) (Du, 2010; Yu et al., 2014) (Figure 1C). These two sets of strata are coastal–offshore deposits, comprising volcanic clastic rocks with a maximum cumulative thickness of more than 4 km (Du, 2010; Yu et al., 2014). Medium and acidic volcanic lavas and tuffaceous volcanic clastic rocks dominate the lower section of the Songkharsu Formation (C1sa) (Du, 2010; Gong et al., 2019). The upper section (C1sb) is a clastic rock deposited during the lull volcanic activity, locally interbedded with thin coal seams (Figure 1C), which is the primary source-rock-bearing section of the Carboniferous system in the eastern Junggar Basin (Du, 2010; Gong et al., 2019). C2b is dominated by medium-basic volcanic lava interspersed with tuffaceous volcanic clastic rocks (Figure 1C).
Four sets of the reservoir–caprock assemblages are developed in the Jimsar Sag: 1) a reservoir–caprock with volcanic breccia and volcanic clastic rocks at the top of the Carboniferous as reservoirs and mudstones in the lower part of the Middle Permian Jiangjunmiao Formation (P2j) as caprocks; 2) a reservoir–caprock assemblage with sandstones in the lower part of the P2l and Upper Permian Shangwuerhe Formation (P3w) as reservoirs and mudstones in the middle and upper part of P3w as caprocks; 3) a reservoir–caprock assemblage with sandstones in the Lower Triassic Jiucaiyuanzi (T1j) and Shaofanggou (T1s) Formations as reservoirs and thick mudstones developed in their upper part as caprocks; 4) reservoir–caprock assemblages formed by the sand and gravels developed at the bottom of Jurassic groups as reservoirs and mudstones developed in the interior or middle and upper parts as caprocks (Bai et al., 2017; Hu et al., 2018; Zhang S. et al., 2020) (Figure 1C).
3 Samples and Experimental Methods
3.1 Sampling
In this study, 137 source rock samples (21 from Jimsar Sag and 116 from Kelameili gas field), 36 oil samples (1 from Carboniferous reservoir and 35 from P2l reservoir in the Jimsar Sag), and 21 gas samples (1 from Jimsar Sag and 20 from Kelameili gas field) were discussed, with part of the well locations shown in Figure 1B. Natural gas was collected at the wellheads and stored in 1-L gas-tight cylinders. Oil and condensates were collected at the wellheads under ambient pressure and stored in 5-ml glass containers with screw-on Teflon-lined caps. The samples were refrigerated to below –6°C.
3.2 Analytical Processes
3.2.1 Total Organic Carbon (TOC) and Rock-Eval Analysis
The analyses were conducted at the China University of Petroleum (Beijing). First, the 146 rock samples were crushed to powder for TOC analysis (Table 1). In addition, the powdered samples were split into 200-mg subsamples and treated using HCl at 60°C to remove the carbonates and then washed using distilled water to remove the HCl. Finally, the washed subsamples were dried overnight at 50°C, and their carbon contents were determined using LECO CS–230 analyzers.
For rock-eval pyrolysis, 100 g of each crushed rock sample was placed in the vessel of an OGE-II instrument. These samples were heated from 300 to 600°C in a helium atmosphere at a heating rate of 50°C/min, and their Rock-Eval parameters (S1, S2, and Tmax) were measured. In this study, S1 is the amount of free hydrocarbon that can be volatilized from the rock sample (mg HC/g rock); S2 is the amount of hydrocarbon produced by the cracking of organic matter (mg HC/g rock). Tmax (°C) is the temperature at which the S2 yield is maximized, which estimates the thermal maturity of the sediment (Peters, 1986).
3.2.1 Organic Petrology Analysis and Measurement of Vitrinite Reflectance
Optical microscopy analyses were conducted on thin rock sections at the China University of Geoscience (Beijing) (Table 2). Before being embedded in a homogeneous mixture of Buehler’s epoxy resin and hardener (ratio 5:1), 11 core samples from eight wells were sectioned perpendicular to the bedding. The preparations involve drying and polishing, as described by Taylor et al. (1998) and Amijaya and Littke (2006). The thin rock sections were examined at different magnifications and under different light conditions (incident white- and blue-light excitation) to characterize the organic matter features of C1sb source rock. The optical instrument was a Nikon LV 100 microscope.
The vitrinite reflectances (Ro) of 46 samples were measured at the China University of Geoscience (Beijing) (Table 1), using a Zeiss Scope A1 incident light microscope at a wavelength (λ) of 546 nm. The reflectances of samples, rich in vitrinite or solid bitumen particles, were measured at least 50 times.
3.2.2 GC and GC–MS Analysis
Mass spectrometry (MS) and gas chromatography MS (GC–MS) analyses were performed at the China University of Petroleum (Beijing). Soxhlet apparatus was used to extract 30 samples using CHCl3 for 72 h. The resulting extracts were fractionated using open silica gel column chromatography with n-hexane. The resulting saturated hydrocarbons were analyzed using GC and GC–MS.
The GC analysis was performed in an Agilent 7890A gas chromatograph fitted with a 60 m × 0.25 mm × 0.25 µm capillary column with nitrogen (99.999%) as the carrier gas. The GC oven temperature was at 40°C for 10 min, and then, it ramped from 40 to 70°C at 4°C/min and 300°C at 8°C/min, and finally held at 300°C for 40 min.
The GC–MS analysis was performed in an Agilent 7890–5975C using the same column type as in the GC analysis but with helium (99.999%) as the carrier gas. During the GC–MS analysis, the GC oven temperature was held at 50°C for 1 min before it ramped to 120°C at 20°C/min, from 120 to 250°C at 4°C/min, and from 250 to 310°C at 3°C/min. Finally, it was held at 310°C for 30 min.
3.2.3 Geochemical Analysis of Natural Gas
The geochemical analysis of the natural gas was conducted at the Experimental and Testing Institute of PetroChina Xinjiang Oilfield Company and Northwest Institute of Eco-Environment and Resources, Chinese Academy of Sciences. A Hewlett–Packard 6890 II gas chromatograph (GC) analyzed the natural gas components. The hydrocarbon gas component was separated using capillary columns (Plot Al2O3 50 m × 0.53 mm). The furnace temperature of the GC was first set to be 30°C and held for 10 min. Then, the temperature was ramped up to 180°C at a rate of 10°C/min. Stable carbon isotope analysis of alkane gas (C1–C4) was conducted using a Finnigan Mat Delta S mass spectrometer interfaced with an HP 6890II gas chromatograph. The alkane gas components (C1–C4) and CO2 were separated using a chromatographic column (Plot Q 30 m × 0.32 mm). The column heating process was as follows: the heating rate was 8°C/min at 35–80°C; the temperature was then increased to 260°C at a heating rate of 5°C/min. The final temperature was held for 10 min. Each sample was analyzed three times with an accuracy of ± 0.3‰ (VPDB).
3.2.4 Basin Modeling
The burial and thermal histories of the source rocks in the study area were reconstructed using PetroMod software. The current heat flow and thermal conductivity values of the source rocks were adopted from previous studies (Wang et al., 2000a,b; Qiu et al., 2000,2001; Qiu, 2002). The Ro values were calculated using the Easy%Ro model proposed by (Sweeney and Burnham, 1990; Ren et al., 2020). This model can be applied Ro ranging of 0.3–4.6%.
4 Results and Discussion
4.1 Source Rock Evaluation
4.1.1 Types of Organic Matter
The type of organic matter determines the hydrocarbon-generating capacity and product type in a source rock (Tissot et al., 1984; Bordenave, 1993). Therefore, the organic macerals of source rocks and their assemblage characteristics can be studied to characterize the types of organic types (Tissot et al., 1984; Bordenave, 1993; Taylor et al., 1998; Suárez et al., 2012). In this study, the whole-rock maceral contents of C1sb source rocks with three different lithologies (coal, carbonaceous mudstone, and mudstone) in the Jimsar Sag were analyzed based on thin section, oil immersion, and fluorescence observations (Figure 2; Table 1). Organic macerals can be classified into four major groups: sapropelite, exinite, vitrinite, and inertinite (Tissot et al., 1984; Bordenave, 1993; Taylor et al., 1998; Suárez et al., 2012). The hydrocarbon generation capacity of the four macerals decreases sequentially, with their products transiting from liquid hydrocarbons to natural gas. The inert maceral group has almost no hydrocarbon-generating capacity.
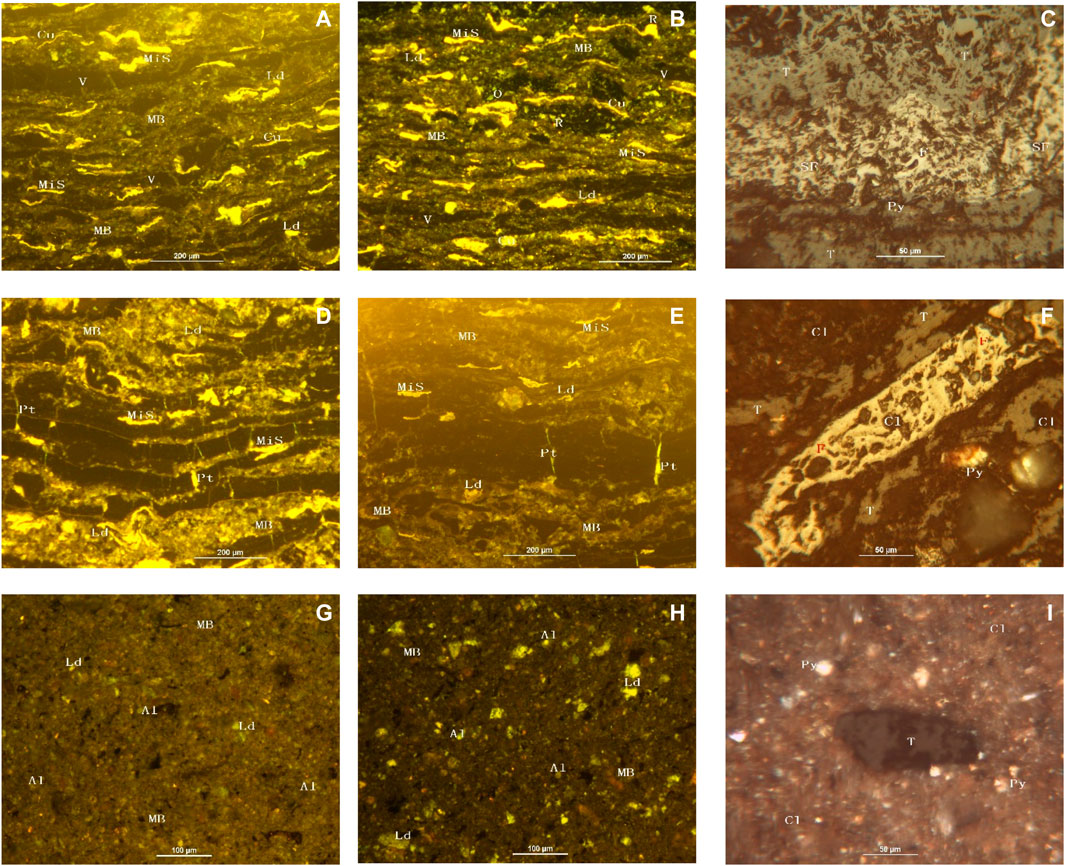
FIGURE 2. Photomicrographs of macerals for C1sb source rock in the southeastern Junggar; Note:clay minerals (Cl); mineral bituminous (MB); microsporinite (Mis); vtrinite (V); liptodetrinite (Ld); cutinite (Cu); resinite (R); oil satins (O); telinite (T); semi-fusinite (SF); fusinite (F); Pyrite (Py); asphaltenite (Pt); alginate (Al). (A–C) demonstrate the coal sample from well J15 (2,860 m, core). (D–F) demonstrate the carbonaceous mudstone sample from well J3301 (4,135 m, cuttings). (G–I) demonstrate the carbonaceous mudstone sample from well J3301 (4441 m, core). (A,B,D,E,G,H) are inspired by blue light (reflected fluorescence). (C,F,I) are inspired by reflected light (oil immersion).
The original matrices of the sapropelite maceral are primarily lower organisms (i.e., algal and bacteria) and zooplankton (Taylor et al., 1998; Suárez et al., 2012). This study is characterized by mineral bituminous exhibiting weak fluorescence (Figure 2). In addition, sporadically distributed alginate was found in the mudstone samples (Figures 2G,H). The primitive matrices of the exinite group are mainly the plant’s reproductive organs and the epidermis and secretions of branches, leaves, and roots (Tissot et al., 1984; Bordenave, 1993; Taylor et al., 1998; Suárez et al., 2012). The exinite maceral group in the C1sb source rocks of the Jimsar Sag mainly include microsporinite, liptodetrinite, cutinite, and resinite (Figure 2). Some dark striped vertical fractures are filled with sphaltenite (Figures 2D,E). The parent material of both the vitrinite and inertinite groups is the xylem of higher plants. The former formed in a reducing–semi-oxidizing environment and the latter in a semi-oxidizing–oxidizing environment (Tissot et al., 1984; Bordenave, 1993; Taylor et al., 1998; Suárez et al., 2012). In this study, the vitrinite maceral consists of telinite, collinite, semi-fusinite, and fusinite (Figure 2). Fragments of broken fusinite were visible in the center of some semifusinite (Figure 2C). Most of them preserved the woody cell structure, indicating that they underwent different degrees of cell wall swelling (Figure 2C). Various components can be seen in a parallel arrangement under the microscope, reflecting the hydrostatic sedimentary microenvironment (Figure 2B), confirmed by the widespread pyrite observed in C1sb source rocks (Figure 2).
The maceral components of the C1sb source rocks, with different lithologies in the Jimsar Sag, are dominated by the vitrinite group (>50%), reflecting their gas-prone characteristics (Figure 2; Table 1). The oil-prone maceral content (the sum of the sapropelite and exinite groups) of the mudstone and carbonaceous mudstone reached 22.3 and 16.9%, respectively (Table 1), showing a bit oil-generating potential (Figure 2; Table 1). The “oil stains” identified through fluorescence observation are evidence (Figure 2B).
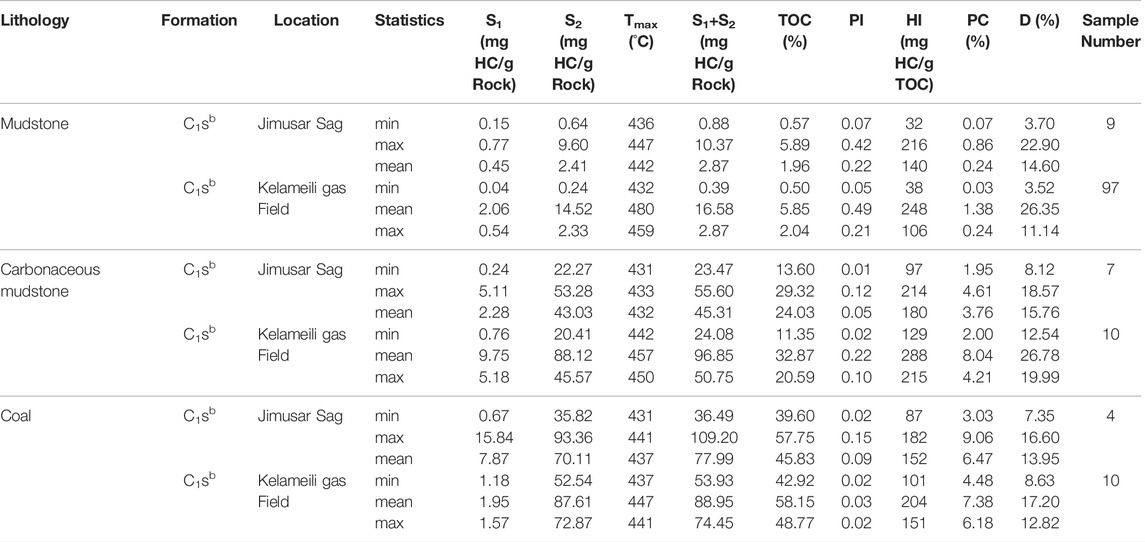
The Rock-Eval hydrogen index [HI = (100 × S2)/TOC] is a fast and economical method to distinguish organic matter types of the source rocks (Tissot et al., 1984; Bordenave, 1993). Based on the HI values of 600, 300–600, 200–300, 50–200, and less than 50 mg HC/g TOC, the organic matter can be classified into five types: Type I (extremely oil-prone), Type II (oil-prone), Type II/III (oil-prone/gas-prone), Type III (gas-prone) and Type IV (barren source rock) (Tissot et al., 1984; Bordenave, 1993). Among the C1sb source rocks of the Jimsar Sag, the HI values of mudstone, carbonaceous mudstone, and coal ranged from 32 to 216 mg HC/g TOC (average 140 mg HC/g TOC), 97–214 mg HC/g TOC (average 180 mg HC/g TOC), and 87–183 mg HC/g TOC (average 152 mg HC/g TOC), respectively (Figure 3; Table 2). The C1sb source rocks were dominated by kerogen type III. Carbonaceous mudstone is more oil-prone than coal, and mudstone has the poorest oil-generating capacity (Figure 3; Table 2). Some of the carbonaceous mudstone samples have high HI values (>200 mg HC/g TOC) and show some oil-generating capacities (Figure 3; Table 2). Among the C1sb source rocks in the Kelameili gas field, the average HI ratios for mudstone, carbonaceous mudstone, and coal are 106, 215, and 151 mg HC/g TOC, respectively, and the overall characteristics are close to those of the Jimsar Sag (Figure 3; Table 2).
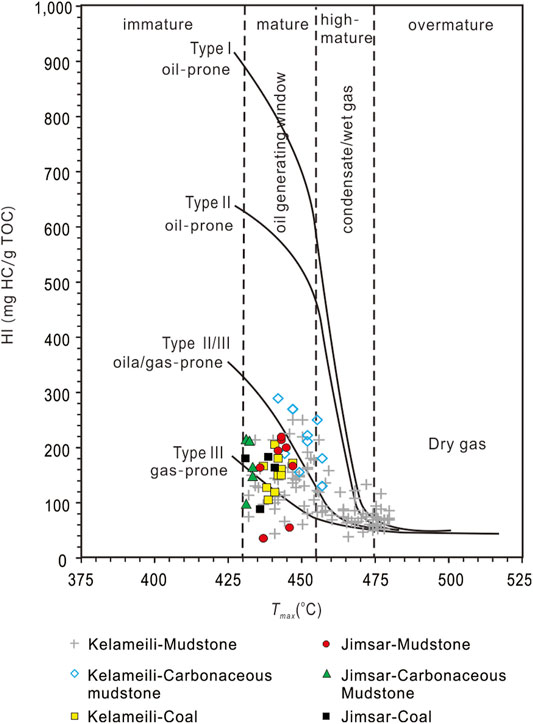
FIGURE 3. The Tmax vs hydrogen index (HI) plot of the C1sb source rock in the Jimsar Sag and Kelameili gas field.
4.1.2 Source Rock Maturity
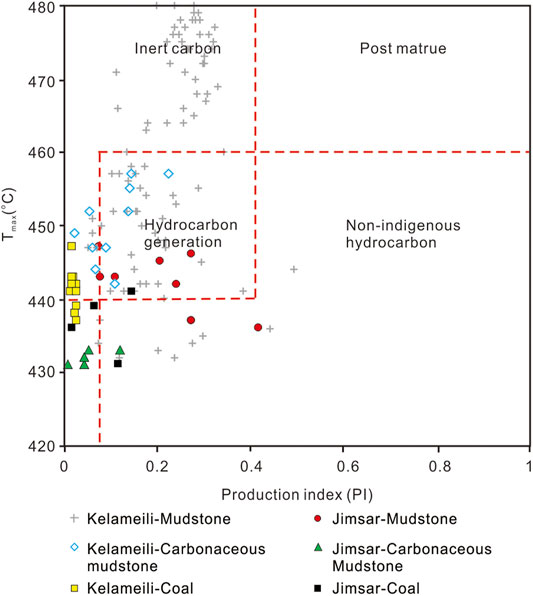
In this study, Ro data were obtained for three C1sb source rock samples from the Jimsar Sag. The Ro value of the sample from well J15 (2860 m) is 0.65%, and the Ro values of the two samples from well J3301 (4,441 and 4,445 m) are 1.38 and 1.41%, respectively. Well J15 is in the eastern margin of the Jimsar Sag (Figure 1B) and has a lower maturity. According to the Ro values of well J3301, the C1sb source rocks have recently entered at least the main oil-generating window in the depression area. The Rock-Eval maturity indicators of C1sb source rocks in the study area and the Kelameili gas field are similar. Their hydrocarbon production indices [PI = S1/(S1+S2)] and Tmax are distributed between 0.8 and 1.0 and 440 and 460°C, respectively, in the main oil-generating window and samples with low PI and Tmax values are in the immature stage (Figure 4; Table 2). A few samples with a poor correlation between PI and Tmax may have suffered from the contamination of nonindigenous hydrocarbons (Figure 4). Some of the C1sb mudstone samples from the Kelameili gas field fall within the “inert carbon” (Figure 4), suggesting that those mudstone samples with low HI in Figure 3 have a poor initial hydrocarbon-generating capacity, in addition to the effect of thermal maturation.
Based on the Ro and Tmax data of C1sb source rock samples from the Jimsar Sag and previous studies on the Ro-depth relationship in the eastern Junggar Basin (Gong et al., 2021), and combined with the tectonic map of the C1sb bottom boundary of the sag, the Ro contour map of the study area was plotted (Figure 5A). The area of the C1sb source rocks in the Jimsar Sag entering the main oil-generating window (Ro > 0.7%) and condensate-generating stage (Ro = 1.3–2.0%) reaches 980 and 490 km2, respectively (Figure 5A). Considering that the humic source rocks produce large amounts of natural gas at the main oil-generating window (Dai et al., 1992; Petersen, 2002; Petersen and Nytoft, 2006; Petersen et al., 2011), the Jimsar Sag favor large- and medium-gas field formation.
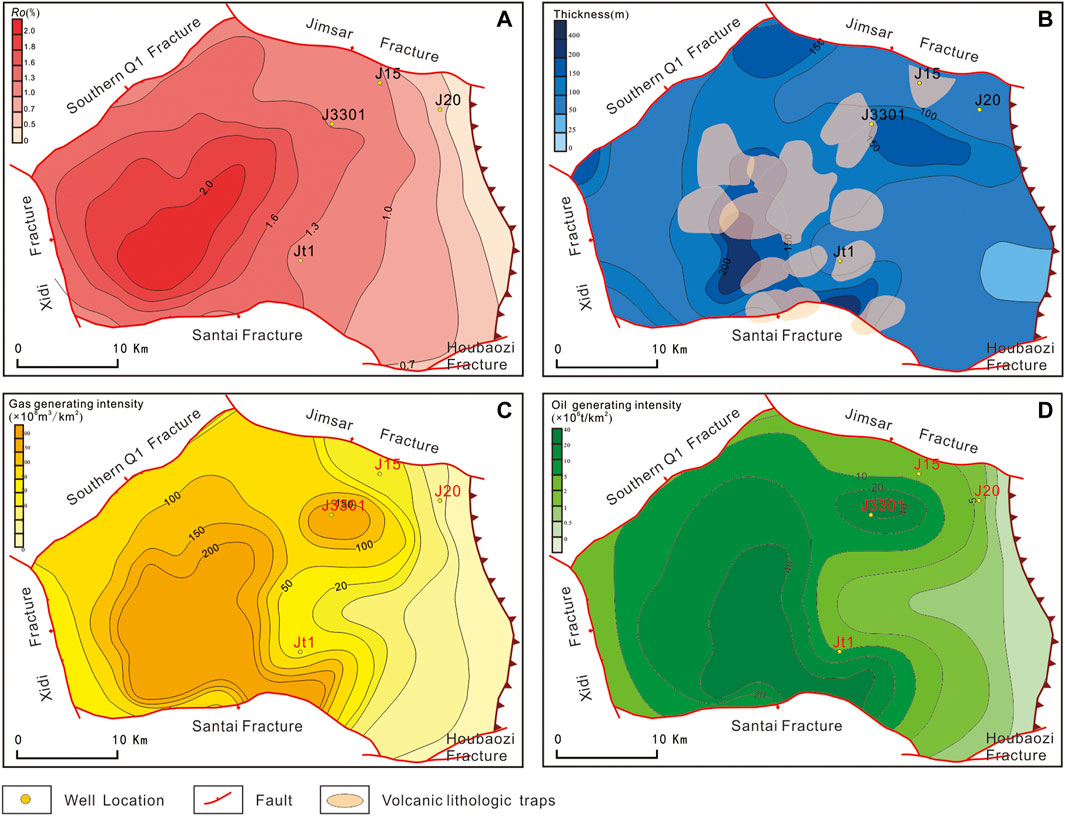
FIGURE 5. The contour map of (A) Ro, (B) thickness, (C) gas-generating potential, and (D) oil generating potential for C1sb source rocks in the Jimsar Sag.
In this study, a two-dimensional seismic profile, running longitudinally through the Jimsar Sag in a nearly north-south direction, was selected to recover the burial and thermal evolution history of the C1sb source rocks. At the end of the Carboniferous (∼305 Ma), the C1sb source rocks were in the immature–low maturity stage (Ro < 0.7%) and had not reached the main oil-generating window (Figure 6A). After that, the C1sb source rocks slowly subsided, and by the end of the Early Jurassic (∼182 Ma), they entered the early stage of the oil-generating window (Ro = 0.7–1.0%) (Figure 6B). Subsequently, the subsidence rate accelerated, and the C1sb source rocks entered the late stage of the oil-generating window (Ro = 1.0–1.3%) and the condensate/wet gas-generating window (Ro = 1.3–2.0%) stages in the Cretaceous (∼100 Ma). The Ro of the deepest part of the sag reached 1.7% (Figure 6C). In addition, regional tectonic uplift occurred in the study area, and the hydrocarbon-generating process of C1sb source rocks was temporarily stalled (Figure 6D). With further deep burial, the maturity of C1sb source rocks continues to increase. Recently, the deep C1sb source rocks in the Jimsar Sag have entered the massive condensate generation stage. In contrast, the maturity of source rocks at the edge of the sag is low, and a few of them enter the main oil-generating window (Figure 6E).
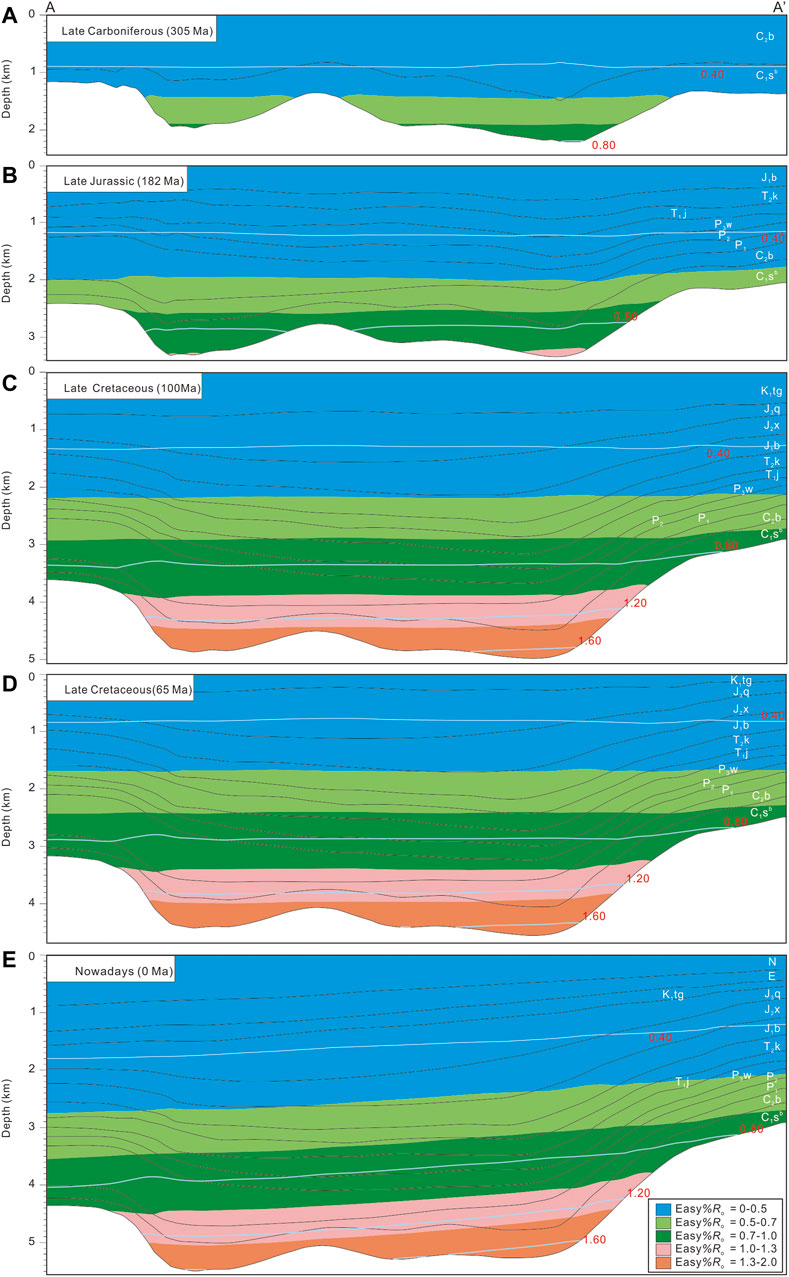
FIGURE 6. The hydrocarbon generating profile for C1sb source rocks in the Jimsar Sag. (A): The thermal evolution history in the Late Carboniferous (305 Ma). (B): The thermal evolution history in the Late Jurassic (182 Ma); (C): The thermal evolution history in the Late Cretaceous (100 Ma); (D): The thermal evolution history in the Late Cretaceous (65 Ma); (E): The thermal evolution history in nowadays (0 Ma);
4.1.3 Hydrocarbon-Generating Potential
Humic source rocks form in fresh marsh-phase environments (oxidizing–semi-oxidizing), whereas lacustrine/marine source rocks form in reducing–semi-reducing environments (Tissot et al., 1984; Bordenave, 1993; Gong et al., 2019). Thus, there are differences in hydrocarbon-generating mechanisms and product types between the two. Their evaluation criteria should be more demanding than those for lacustrine/marine source rocks. The coaly source rocks are rich in aromatic functional groups and poor in lipid functional groups (carbon-rich and hydrogen-poor) and have high inert carbon content (Chen et al., 1997; Petersen, 2002; Petersen and Nytoft, 2006; Petersen et al., 2011). Based on thousands of Rock-Eval data of terrigenous source rocks of different lithologies in the major proliferous basins in northwest China, Chen et al. (1997) proposed a scheme to evaluate the hydrocarbon-generating potential of coaly (humic) source rocks using lithologies (mudstone, carbonaceous mudstone, and coal). This scheme has been well tested in the practice of evaluating terrigenous source rocks in China. This study evaluates the hydrocarbon-generating capacity of C1sb source rocks in Jimsar Sag based on this scheme.
The TOC of C1sb mudstone in the study area ranged from 0.57 to 5.89%, with an average of 1.96%; the hydrocarbon-generating potential (S1+S2) ranged from 0.88 to 10.37 mg HC/g rock, with an average of 2.87 mg HC/g rock. Thus, the C1sb mudstone belonged to medium–good source rocks (Figure 7A; Table 2). Chen et al. (1997) found that for carbonaceous mudstones and coal, the correlation between S1+S2 and HI is better than that between S1+S2 and TOC, and it is more suitable as an index for evaluating organic matter abundance. The C1sb carbonaceous mudstone is dominated by medium source rocks, with their S1+S2 and HI ratios being 23.47–55.60 mg HC/g rock (average 45.31 mg HC/g rock) and 97–214 mg HC/g TOC (average 180 mg HC/g TOC), respectively (Figure 7B; Table 2). The average S1+S2 and HI values of coal were 77.99 mg HC/g rock and 152 mg HC/g TOC, respectively, indicating a poor source rock (Figure 7C; Table 2). The hydrocarbon-generating capacity of C1sb source rocks in the Jimsar Sag and Kelameili gas fields is similar (Figure 7; Table 2).

FIGURE 7. The abundance of organic matters for C1sb (A) mudstones, (B) carbonaceous mudstones, and (C) coals in the Jimsar Sag and Kelameili gas field (Plot after Chen et al., 1997).
4.2 Oil and Gas Sources
4.2.1 Ga Source Correlation
One gas sample from the Carboniferous reservoir has been obtained in the Jimsar Sag (from well J3301). The methane content of the natural gas is 78.79%, and the drying factor (C1/∑C1–4) is 0.89, indicating a wet gas (C1/∑C1–4 < 0.95). The methane content of the natural gas from the Kelameili gas field ranged from 84.90 to 93.56%, with an average of 88.80%. The natural gases have their C1/∑C1–4 ratios ranging from 0.89 to 0.96 (average 0.92), and wet gas accounted for 85.9% of the total samples. The C1/∑C1–4 ratios of the gas from the Kelameili gas field are higher than those of the Jimsar Sag, reflecting a relatively higher thermal maturity.
The stable carbon isotope compositions of methane (δ13C-CH4), ethane (δ13C-C2H6) and propane (δ13C-C3H8) in well J3301 are –33.8‰, –28.6‰, and –26.8‰, respectively (Figure 8). The δ13C-CH4, δ13C-C2H6, and δ13C-C3H8 of natural gas from Kelameili gas field are –32.3‰ ∼ –29.2‰ (average –30.5‰), –28.9‰ ∼ –25.6‰ (average –27.1‰), and –26.8‰ ∼ –23.1‰ (average –24.7‰), respectively, which are more enriched in 13C than those of the gas from well J3301 (Figure 8). Considering similar carbon isotopic compositions of kerogen (δ13Ckerogen) in the C1sb source rocks of the Jimsar Sag and Kelameili gas field (Gong et al., 2019,2021), the difference in the stable carbon isotopic compositions of the two types of gas reflects the higher maturity of the gas in the Kelameili gas field, consistent with that in C1/∑C1–4 ratios. The humic source rocks are characterized by kerogen types III and II2, composed of aromatic structures relatively enriched in 13C isotopes (Barry and Fang., 2014; Dai et al., 2014; Liu et al., 2008; Liu et al., 2019; Yao et al., 2020). In contrast, the sapropelic source rocks are characterized by kerogen types I and II1, composed of aliphatic structures enriched in 12C isotopes (Barry and Fang., 2014; Dai et al., 2014; Liu et al., 2019; Wu et al., 2020). Therefore, when humic and sapropelic source rocks generate natural gas at similar maturity, the former generates natural gas (coal-type gas) with a more enriched 13C carbon isotope composition than the latter (oil-type gas).
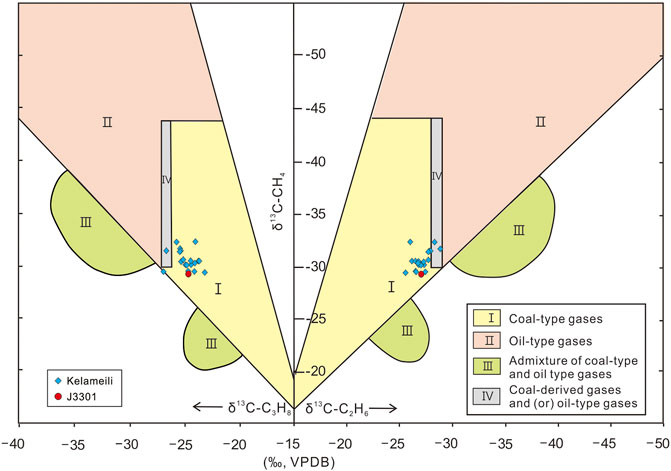
FIGURE 8. Using the δ13C-CH4–δ13C-C2H6–δ13C-C3H8 plot to identify the genetic types of natural gases in the Jimsar Sag (Plot after Dai et al., 1992, 2014).
Previous studies have confirmed that natural gas from the Kelameili gas field is derived from C1sb source rocks (Dai et al., 2016; Sun et al., 2016), which exhibit the characteristics of coal-type gas in the δ13C-CH4–δ13C-C2H6–δ13C-C3H8 diagram proposed by (Dai et al., 2014) (Figure 8). The natural gas from well J3301 has 13C-CH4, δ13C-C2H6, and δ13C-C3H8 values similar to those from the Kelameili gas field (Figure 8), demonstrating the gas was derived from C1sb source rocks. Although influenced by maturity, the δ13C-C2H6 values are more reflective of the original parent material and can distinguish coal-type gas from oil-type gas (Dai et al., 2005; Liu et al., 2016; Wu et al., 2021). Previous studies have shown that the limit of δ13C-C2H6 value for both is around –29.0‰ (Fu et al., 1990; Gang et al., 1997; Liu et al., 2004; Dai et al., 2005, 2014; Xiao Z. H. et al., 2008; Liang et al., 2013; Liu et al., 2016; Wu et al., 2021). The δ13C-C2H6 value of gas from well J3301 is –28.6‰, which shows the characteristics of coal-type gas (Figure 8).
Oil-type gas is drier than coal-type gas at the same thermal evolutionary stages (Bernard et al., 1978; Whiticar, 1999; Liu et al., 2019; Ci et al., 2020). In the δ13C-CH4–C1/C2+3 gas genetic identification plate, gases from the J3301 well and Kelameili field gas fall in the evolution trend line of coal-type gas (Figure 9), reflecting their origin from C1sb source rocks. Figure 9 reflects the lower maturity of gas from well J3301 than gas from the Kelameili gas field.
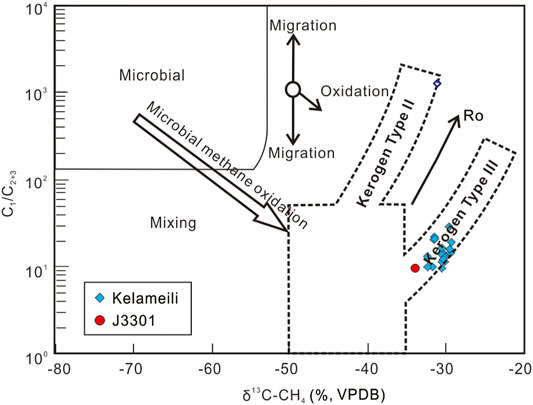
FIGURE 9. Using the C1/C2+3 vs δ13C-CH4 plot to identify the genetic types of natural gases in the Jimsar Sag (Plot after Bernard et al., 1978; Whiticar, 1999).
4.2.2 Oil–Source Correlation
Two sets of effective source rocks, i.e., P2l and C1sb, were developed in the Jimsar Sag (the Middle and Lower Jurassic source rocks are immature). Previous studies showed that the P2l source rocks are brackish lacustrine source rocks deposited in a reducing environment (Bai et al., 2017; Hu et al., 2018). The oil from the Jimsar billion-ton shale oil field is derived from this set of source rocks (Bai et al., 2017; Hu et al., 2018). The C1sb source rocks are a set of marine–terrigenous transitional deposits in an oxidizing environment with a predominantly terrestrial higher plant input (Gong et al., 2019,2021). A tiny amount of oil has been obtained in the Jimsar Sag from the Carboniferous weathered crust reservoir in well J15. This study compared the physical properties, biomarker fingerprints, and carbon-isotope characteristics of oil samples from well J15 with oil from the P2l reservoirs in the Jimsar Sag.
As discussed in Section 4.2.1, sapropelic source rocks (P2l) have more 13C-depleted δ13Ckerogen values than the humic source rocks (C1sb) when their maturity is close. In addition, the carbon isotopic composition of global Carboniferous sediments is enriched in 13C (Wang et al., 2013). Therefore, the carbon isotopes of oil derived from C1sb source rock should be more 13C-enriched than those from P2l source rocks. The stable carbon isotopic compositions of saturated (δ13Csaturated) and aromatic (δ13Caromatic) fractions of oil from well J15 are –26.7‰ and –25.9‰, respectively. The δ13Csaturated and δ13Caromatic values of P2l reservoired oil in the study area are –33.4‰ to –29.8‰ (average –31.9‰) and –31.4‰ to –27.6‰ (average –30.4‰), respectively, which are lower than those in the J15 well. Therefore, the J15 oil should be derived from C1sb source rock.
The β-carotene is associated with anoxic/saline environments (Jiang and Fowler, 1986; Peters et al., 2005). The prevalence of β-carotene is a characteristic of Permian-sourced oils in the Junggar Basin (Wang et al., 2013; Cao et al., 2020). In this study, β-carotene was undetected in the oil from well J15 (Figure 11A), whereas some amount of β-carotene was detected in the P2l reservoired oil (Figure 11D), reflecting the different genetic sources of the two.
The main precursors of pristane (Pr) and phytane (Ph) are chlorophylls of photosynthetic organisms, and their abundance is related to the sedimentary environment (Powell, 1988; Peters et al., 2005). The high Pr/Ph value of 1.76 for oil from well J15 (Figure 10B, Figure 11A) indicates an oxidizing environment with abundant terrigenous organic matter input Powell, corresponding to the C1sb source rock. In contrast, Pr/Ph values for oil from the P2l reservoir are lower, ranging from 0.83 to 1.52, with an average of 1.30 (Figure 10B, Figure 11D), reflecting that the source rocks were deposited in a reducing–oxidizing transitional environment dominated by algal and bacterial inputs, with some input from the terrigenous higher plant (Powell, 1988; Peters et al., 2005).
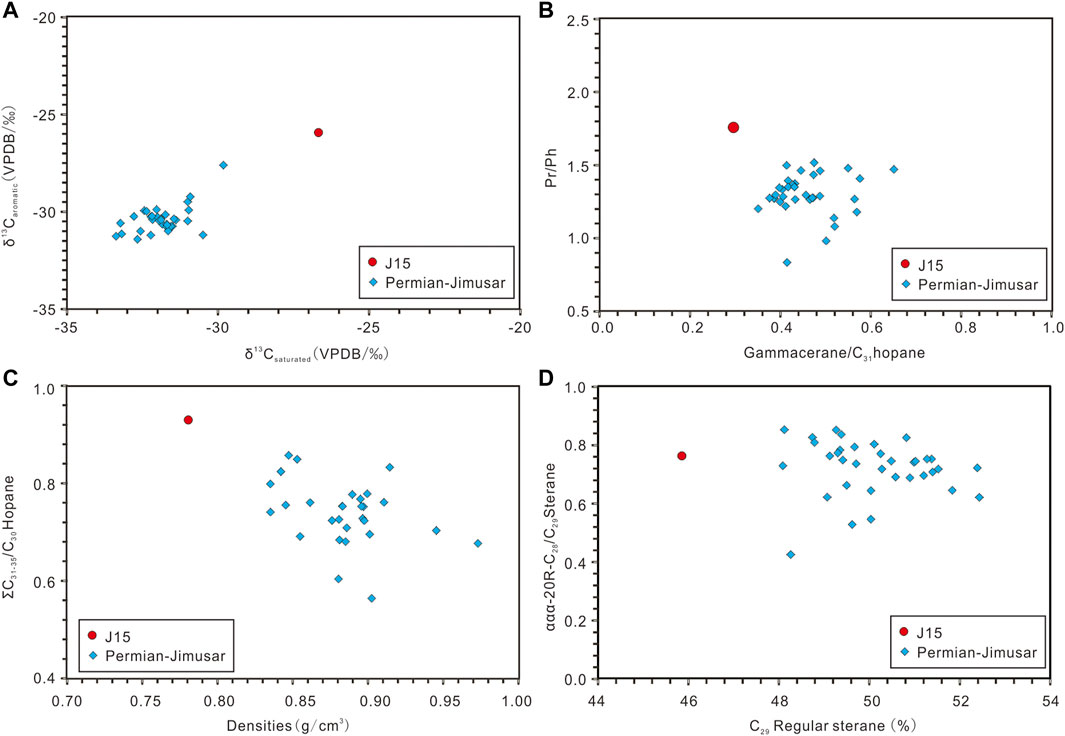
FIGURE 10. The geochemical characteristics of biomarker fingerprints for oils with different types in the Jimsar Sag. (A): The δ13Caromatic vs δ13Csaturated plot; (B): The Pr/Ph vs gammacerane index plot; (C): The Pr/Ph vs gammacerane index plot; (B): The ƩC31–35/C30 hopane ratio vs density plot; (D): The ααα-20R-C28/C29 sterane ratio vs C29 regular steranes rato plot.
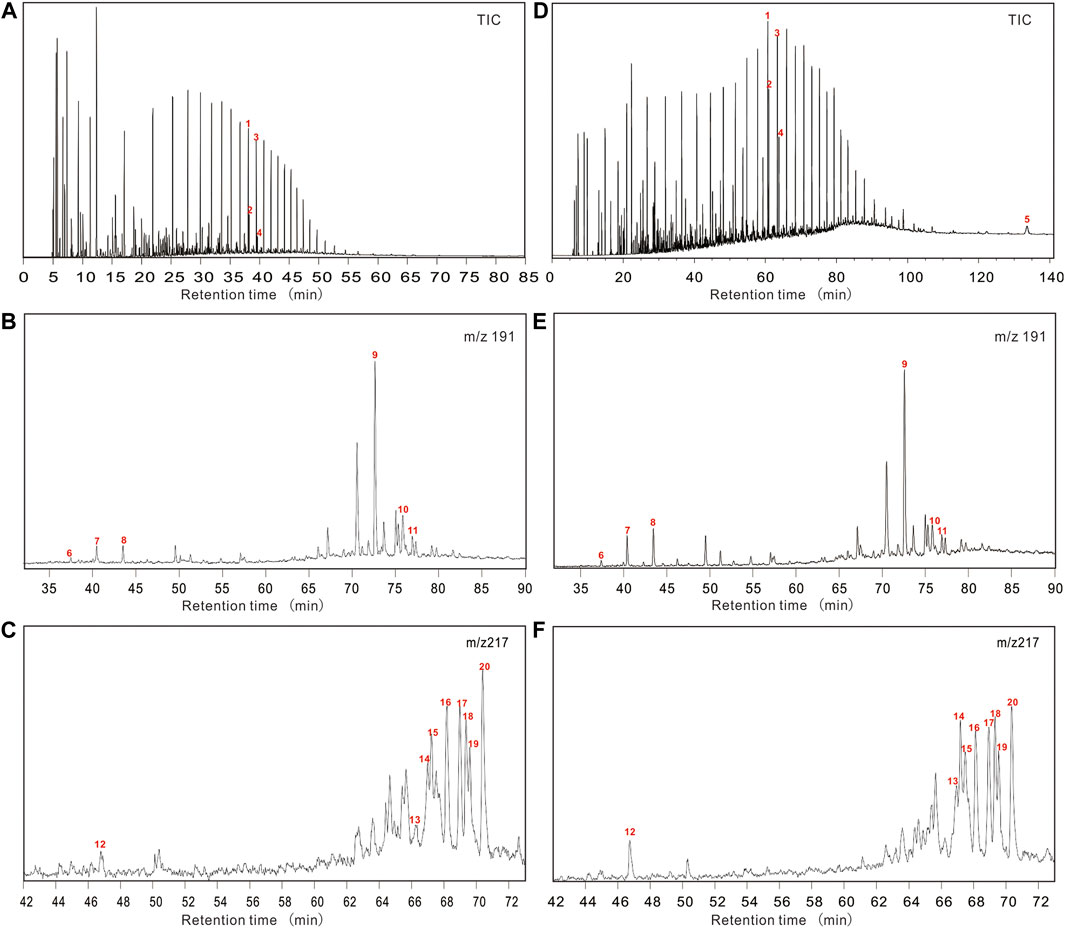
FIGURE 11. The biomarker spectrograms of oils with different origins in the Jimsar Sag. (A,D): TIC chromatograms of oils from wells J15 (Carboniferous reservoir) and J251–H (P2l reservoir); (B,E): m/z 191 chromatograms of oils from wells J15 (Carboniferous reservoir) and J251–H (P2l reservoir); (C,F): m/z 217 chromatograms of oils from wells J15 (Carboniferous reservoir) and J251–H (P2l reservoir). Note: (1) n-C17; (2) Pr; (3) n-C18; (4) Ph; (5) β-carotene; (6) C19 tricyclic terpane; (7) C20 tricyclic terpane; (8) C21 tricyclic terpane; (9) C30 hopane; (10) gammacerane; (11) C31 hopane20S; (12) pregnanes; (13) ααα-C2820S-regular sterane; (14) αββ-C2820R-regular sterane; (15) αββ-C2820S-regular sterane; (16) ααα-C2820R-regular sterane; (17) ααα-C2920S-regular sterane; (18) αββ-C2920R-regular sterane; (19) αββ-C2920S-regular sterane; (20) ααα-C2920R-regular sterane.
Note:1) n-C17; 2) Pr; 3) n-C18; 4) Ph; 5) β-carotene; 6) C19 tricyclic terpane; 7) C20 tricyclic terpane; 8) C21 tricyclic terpane; 9) C30 hopane (10) gammacerane 11) C31 hopane20S 12) pregnanes 13) ααα-C2820S-regular sterane 14) αββ-C2820R-regular sterane 15) αββ-C2820S-regular sterane 16) ααα-C2820R-regular sterane 17) ααα-C2920S-regular sterane 18) αββ-C2920R-regular sterane 19) αββ-C2920S-regular sterane (20)ααα-C2920R-regular sterane.
The gammacerane reflects the stratified water in the depositional environments in which different source rocks were developed (Peters et al., 2005). The stratified water is due to the longitudinal salinity gradients (Sinninghe et al., 1995; Vu et al., 2009). An increase in water salinity increases the gammacerane index [gammacerane/(gammacerane + C31 hopane)] and decreases the Pr/Ph values (Sinninghe et al., 1995; Vu et al., 2009). The P2l reservoired oils have a higher gammacerane index of 0.35–0.65 (average 0.46), showing that they were derived from a set of saline and reducing source rock (Figure 10B, Figure 11E). In contrast, the gammacerane index of oil from well J15 is lower at 0.30 (Figure 10B, Figure 11B), indicating a set of fresh source rock (Sinninghe et al., 1995; Vu et al., 2009), corresponding to the C1sb source rocks.
The oil density from well J15 is 0.7898 g/cm3, approximately 0.1 g/cm3 lower than that of the P2l reservoired oil (0.8352–0.9732 g/cm3, average 0.8809 g/cm3), indicating that they may have different genetic sources (Figure 10C). A higher abundance of C31–35 hopane is a feature of the marine environment (Peters et al., 2005). The ƩC31–35/C30 hopane ratio of the P2l reservoired oil is low, ranging from 0.56 to 0.86 (average 0.74) (Figure 10C). In contrast, the ƩC31–35/C30 hopane ratio of oil from well J15 is higher, 0.96 (Figure 10C), corresponding to the depositional environment of C1sb source rock whose sediment environment was affected by seawater (Du, 2010).
From the ααα-20R-C28/C29 sterane ratio, the difference between the oil from well J15 and P2l reservoir is negligible (Figure 10D, Figures 11C,F). However, the relative content of C29 regular steranes in oil from well J15 was low at 45.86% compared to 48.08–52.43% (average 50.12%) for the P2l reservoired oil (Figure 10D, Figures 11C,F). High levels of C29 steranes indicate significant plant biomass input, reflecting a poor organic matter type (Volkman, 1986; Schwark and Empt., 2006), which seems to be the opposite of the situation in the study area. In previous studies, abundance C29-regular steranes appeared in some algae, such as diatoms and green algae (Orcutt and Patterson, 1975; Grantham, 1986; Volkman, 1986). However, the abundance of C29 steranes in oil does not signify that most organic matter comes from vascular plants. One possible explanation is that the C29-regular steranes in P2l reservoired oil may come from specific zooplankton that feeds on algae and bacteria. Similar situations have appeared in Paleozoic oils in Oman and the Tarim Basin in China (Grantham, 1986; Zhang and Cheng, 2021).
4.3 Oil and Gas Exploration Potential
It is confirmed that a set of C1sb marine–terrigenous transitional source rocks was developed in the Jimsar Sag and that oil and natural gas derived from this set of source rocks have been identified. A planar tracing based on 2D and 3D seismic data evaluated the scale of this source rock. The results show that C1sb source rocks are distributed in the Jimsar Sag with considerable thickness, among which the range of thickness >100 m reaches 580 km2, accounting for 38.7% of the whole sag; the range of thickness >50 m reaches 220 km2 (Figure 5B). Three subdepositional centers developed in the sag (Figure 5B).
The lithology of C1sb source rocks in Jimsar Sag is dominated by carbonaceous mudstone, followed by mudstone, and a few thin coal seams are developed. Therefore, kinetic simulation of hydrocarbon generated from C1sb carbonaceous mudstone and mudstone was conducted in a closed system (golden tubes), adopting Tang et al. (2000) and Xiong et al. (2004) experimental method (the details will be discussed in another manuscript). The experimental results showed that the maximum gas yield of the mudstone and carbonaceous mudstone is 213.69 and 250.16 mg HC/g TOC, respectively, at a heating rate of 2°C/h. Their maximum oil yield was 26.22 and 162.46 mg HC/g TOC, respectively. Based on the obtained parameters, such as pre-exponential factor and activation energy, according to the Arrhenius formula, and the characteristics of thermal evolution and hydrocarbon generation histories of source rocks (Figure 6), this study sketched the planar contour maps of the gas- (Figure 5C) and oil- (Figure 5D) generating intensities of C1sb source rocks in the Jimsar Sag.
The relationship between the distribution of large and medium gas fields and the gas-generating intensity of source rocks in China shows that large gas fields (proven geological reserves >300 × 108 m3) in China are distributed in areas with gas-generating intensity >20 × 108 m3/km2 (Dai et al., 1996,1999,2000; Li et al., 2020; Wei et al., 2020). The area of C1sb source rocks in the Jimsar Sag with gas-generating intensity >20 × 108 m3/km2 reaches 1,015 km2 (Figure 5C), accounting for 67.7% of the study area. Approximately one-third of the sag has gas-generating intensity >100 × 108 m3/km2 (Figure 5C). The area of C1sb source rocks with the oil-generating intensity >500 × 104 and 1,000 × 104 t/km2 are 1,146 and 702 km2 (Figure 5D), respectively, showing a favorable oil-generating potential.
Seismic, gravitational, and magnetic data identified 13 Carboniferous volcanic lithologic traps (buried hills), covering 230 km2, in the Jimsar Sag (Figure 5). These traps are distributed in areas with high gas and oil-generating intensities, and source rocks have entered the main oil-generating window (Figure 5), conducive for forming self-generated and -stored petroleum reservoirs. In summary, the Jimsar Sag has the resource potential to form large and medium oil/gas fields and is an alternative for petroleum exploration in the Junggar Basin after the Kelameili gas field.
5 Conclusion
1) In the Jimsar Sag (in the southeastern part of Junggar Basin), a set of marine–terrigenous transitional source rocks were developed in the Lower Carboniferous Songkharsu Formation, comprising carbonaceous mudstone and mudstone. They belong to medium–good source rocks that are characterized by kerogen types II2–III and are primarily gas-prone, with some oil-generating ability. The quality of C1sb source rocks in the Jimsar Sag is close to that in the Kelameili gas field. At the end of the Early Jurassic, C1sb source rocks reached the oil-generating peak in the Jimsar Sag. Recently, most of them have reached the highly-mature stage.
2) The Carboniferous-reservoired oil in well J15 has more 13C-enriched δ13Csaturated and δ13Caromatic values and higher ƩC31–35/C30 hopane and Pr/Ph values (0.96 and 1.76) than the P2l-reservoired oil. The density, gammacerane index, and C29 regular sterane content of the J15 oil are 0.7898 g/cm3, 0.39, and 45.86%, respectively, which were lower than those of the oil from the P2l reservoir. The β-carotene was undetected in the J15 oil. Therefore, J15 oil should be derived from C1sb source rock.
3) The δ13C-CH4, δ13C-C2H6, and δ13C-C3H8 values of gas from well J3301 are –33.8‰, –28.6‰ and –26.8‰, respectively, which are similar to carbon isotope values from the Kelameili gas field and show the characteristics of coal-type gas, indicating a C1sb origin.
4) The C1sb source rocks are distributed in the Jimsar Sag with considerable thickness, among which the area with thickness >100 m reaches 580 km2, accounting for 38.7% of the study area. In addition, 13 Carboniferous volcanic lithological traps have been identified in the Jimsar Sag, covering 230 km2. The Carboniferous petroleum system of the Jimsar Sag can form large and medium oil and gas fields, which would be an alternative oil and gas exploration in volcanic reservoirs in the Junggar Basin after the Kelameili gas field.
Data Availability Statement
The original contributions presented in the study are included in the article/Supplementary Material, further inquiries can be directed to the corresponding author.
Author Contributions
DG: Conceptualization, Writing Review; Editing, Supervision; YS: Writing Original Draft, Formal analysis; MP: Formal analysis, Methodology; CL: Investigation, Data Curation; RW: Investigation, Data Curation; WW: Geophysical research.
Funding
This study received funding from the Chinese National Natural Science Foundation (No. 41802177), the Prospective and Fundamental Project of PetroChina (2021DJ0206), and the Fund for Basic Science Research of PetroChina (2020D–5008–04). The funder was not involved in the study design, collection, analysis, interpretation of data, the writing of this article, or the decision to submit it for publication.
Conflict of Interest
YS, MP, and CL were employed by Xinjiang Oil Company.
The remaining authors declare that the research was conducted in the absence of any commercial or financial relationships that could be construed as a potential conflict of interest.
Publisher’s Note
All claims expressed in this article are solely those of the authors and do not necessarily represent those of their affiliated organizations, or those of the publisher, the editors, and the reviewers. Any product that may be evaluated in this article, or claim that may be made by its manufacturer, is not guaranteed or endorsed by the publisher.
References
Amijaya, H., and Littke, R. (2006). Properties of Thermally Metamorphosed Coal from Tanjung Enim Area, South Sumatra Basin, Indonesia with Special Reference to the Coalification Path of Macerals. Int. J. Coal Geology. 66, 271–295. doi:10.1016/j.coal.2005.07.008
Bai, H., Pang, X., Kuang, L., Pang, H., Wang, X., Jia, X., et al. (2017). Hydrocarbon Expulsion Potential of Source Rocks and its Influence on the Distribution of Lacustrine Tight Oil Reservoir, Middle Permian Lucaogou Formation, Jimsar Sag, Junggar Basin, Northwest China. J. Pet. Sci. Eng. 149, 740–755. doi:10.1016/j.petrol.2016.09.053
Barry, K., and Fang, L. (2014). Lacustrine basin Unconventional Resource Plays: Key Differences [J]. Mar. Pet. Geology. 56, 255–265. doi:10.1016/j.marpetgeo.2014.02.013
Bernard, B. B., Brooks, J. M., and Sackett, W. M. (1978). Light Hydrocarbons in Recent Texas continental Shelf and Slope Sediments. J. Geophys. Res. 83, 4053–4061. doi:10.1029/jc083ic08p04053
Cao, J., Jin, Z., Hu, W., Zhang, Y., Yao, S., Wang, X., et al. (2010). Improved Understanding of Petroleum Migration History in the Hongche Fault Zone, Northwestern Junggar Basin (Northwest China): Constrained by Vein-Calcite Fluid Inclusions and Trace Elements. Mar. Pet. Geology. 27, 61–68. doi:10.1016/j.marpetgeo.2009.08.014
Cao, J., Xia, L., Wang, T., Zhi, D., Tang, Y., and Li, W. (2020). An Alkaline lake in the Late Paleozoic Ice Age (LPIA): A Review and New Insights into Paleoenvironment and Petroleum Geology. Earth-Science Rev. 202, 103091. doi:10.1016/j.earscirev.2020.103091
Carroll, A. R., Graham, S. A., Hendrix, M. S., Ying, D., and Zhou, D. (1995). Late Paleozoic Tectonic Amalgamation of Northwestern China: Sedimentary Record of the Northern Tarim, Northwestern Turpan, and Southern Junggar Basins. Geol. Soc. America Bull. 107 (5), 571–594. doi:10.1130/0016-7606(1995)107<0571:lptaon>2.3.co;2
Carroll, A. R. (1998). Upper Permian Lacustrine Organic Facies Evolution, Southern Junggar Basin, NW China. Org. Geochem. 28, 649–667. doi:10.1016/s0146-6380(98)00040-0
Chang, X., Wang, Y., Shi, B., and Xu, Y. (2019). Charging of Carboniferous Volcanic Reservoirs in the Eastern Chepaizi Uplift, Junggar Basin (Northwestern China) Constrained by Oil Geochemistry and Fluid Inclusion. Bulletin 103 (7), 1625–1652. doi:10.1306/12171818041
Chen, J. P., Zhao, C. Y., and He, Z. H. (1997). Criteria for Evaluating the Hydrocarbon Generating Potential of Organic Matter in Coal Measures. Pet. Exploration Develop. 24, 1–5. (in Chinese with English abstract).
Chen, Z., Wang, X., Wang, X., Zhang, Y., Yang, D., and Tang, Y. (2017). Characteristics and Petroleum Origin of the Carboniferous Volcanic Rock Reservoirs in the Shixi Bulge of Junggar Basin, Western China. Mar. Pet. Geology. 80, 517–537. doi:10.1016/j.marpetgeo.2016.12.028
Ci, X., Zhang, H., Niu, Q., Zhu, D., Kang, S., Hu, J., et al. (2020). Analysis of Tight Oil and Gas Charging Characteristics by the Carbon Isotope On-Site Detection Technology: A Case Study of the Northern Slope of the Minfeng Subsag in the Bohai Bay Basin. Nat. Gas Industry B 7 (3), 197–204. doi:10.1016/j.ngib.2019.11.002
Dai, J., Gong, D., Ni, Y., Huang, S., and Wu, W. (2014). Stable Carbon Isotopes of Coal-Derived Gases Sourced from the Mesozoic Coal Measures in China. Org. Geochem. 74, 123–142. doi:10.1016/j.orggeochem.2014.04.002
Dai, J., Li, J., Luo, X., Zhang, W., Hu, G., Ma, C., et al. (2005). Stable Carbon Isotope Compositions and Source Rock Geochemistry of the Giant Gas Accumulations in the Ordos Basin, China. Org. Geochem. 36, 1617–1635. doi:10.1016/j.orggeochem.2005.08.017
Dai, J., Ni, Y., Dong, D., Qin, S., Zhu, G., Huang, S., et al. (2021). 2021-2025 Is a Period of Great Development of China's Natural Gas Industry: Suggestions on the Exploration and Development of Natural Gas during the 14th Five-Year Plan in China. J. Nat. Gas Geosci. 6 (4), 183–197. doi:10.1016/j.jnggs.2021.08.001
Dai, J. X., Pei, X. G., and Qi, H. F. (1992). Natural Gas Geology of China, 1. Beijing: Petroleum Industry Press, 46–50. (in Chinese with English abstract).
Dai, J. X., Song, Y., and Zhang, H. F. (1996). Main Controlling Factors of Large and Middle Sized Gas fields in China[J]. Sci. China: Ser. D. 26 (6), 481–487.
Dai, J. X., Xia, X. Y., Hong, F., Zhao, L., Sun, D. M., and Shi, X. (1999). Main Controlling Factors of Large and Middle Sized Coal-Formed Gas fields in China[J]. Chin. Sci. Bull. 44 (22), 2455–2464.
Dai, J. X., Zhong, N. N., Liu, D. H., Xia, X. Y., Yang, J. Y., and Tang, D. Z. (2000). Geologic Bases and Major Controlling Factors of Large and Medium Humic Gas Fields in China[M]. Beijing: Petroleum Industry Press. (in Chinese).
Dai, J. X., Zou, C. N., Li, W., and Hu, G. Y. (2016). Giant Coal-Derived Gas Fields and Their Gas Sources in China. New York: Academic Press.
Du, J. H. (2010). Petroleum Exploration for Volcanic Reservoirs in the Northern Xinjiang[M]. Beijing: Petroleum Industry Press. (in Chinese).
Fu, J. M., Liu, D. H., and Sheng, G. Y. (1990). Geochemistry of Coal-Derived Hydrocarbons. Beijing: Science Press, 103–113. 31–32(in Chinese).37–76
Gang, W. Z., Gao, G., Hao, S. S., Huang, Z. L., and Zhu, L. (1997). Carbon Isotope of Ethane Applied in the Analyses of Genetic Types of Natural Gas. Pet. Geology. Exp. 19 (2), 164–167. (in Chinese with English abstract).
Gong, D., Song, Y., Wei, Y., Liu, C., Wu, Y., Zhang, L., et al. (2019). Geochemical Characteristics of Carboniferous Coaly Source Rocks and Natural Gases in the Southeastern Junggar Basin, NW China: Implications for New Hydrocarbon Explorations. Int. J. Coal Geology. 202, 171–189. doi:10.1016/j.coal.2018.12.006
Gong, D. Y., Wang, X. L., Zhou, C. M., Zheng, M. L., Jiang, W. L., and Wu, W. A. (2021). Discovery of Large-Scale Carboniferous Source Rocks and Natural Gas Exploration Potential in the Southeast of Junggar Basin. Acta Petrolei Sinica 42, 836–852. (in Chinese with English abstract). doi:10.7623/syxb202107002
Grantham, P. J. (1986). The Occurence of Unusual C27 and C29 Sterane Predominances in Two Types of Oman Crude Oil. Org. Geochem. 9 (1), 1–10. doi:10.1016/0146-6380(86)90077-x
Guo, J. M., Fan, H. L., Zhang, S. Y., Liu, X., Wu, T., Ma, W. Y., et al. (2020). Petrological, He-Ne-Ar and Sr-Nd-Pb Geochemical of Volcanic Rocks Constraint on Tectonic Settings and Geodynamic Process of the Carboniferous, East Junggar. J. Nat. Gas Geosci. 5 (1), 91–104. doi:10.1016/j.jnggs.2020.02.002
He, D.-F., Li, D., Fan, C., and Yang, X.-F. (2013). Geochronology, Geochemistry and Tectonostratigraphy of Carboniferous Strata of the Deepest Well Moshen-1 in the Junggar Basin, Northwest China: Insights into the continental Growth of Central Asia. Gondwana Res. 24 (2), 560–577. doi:10.1016/j.gr.2012.10.015
He, D. F., Zhang, L., Wu, S. T., Li, D., and Zhen, Y. (2018). Tectonic Evolution Stages and Features of the Junggar Basin. Oil Gas Geology. 39, 845–861. (in Chinese with English abstract). doi:10.11743/ogg20180501
Hu, T., Pang, X. Q., and Jiang, S. (2018). Oil Content Evaluation of Lacustrine Organic-Rich Shale with strong Heterogeneity: A Case Study of the Middle Permian Lucaogou Formation in Jimusaer Sag, Junggar Basin, NW China [J]. Fuel, 221.
Jiang, Z. S., and Fowler, M. G. (1986). Carotenoid-derived Alkanes in Oils from Northwestern China. Org. Geochem. 10, 831–839. doi:10.1016/s0146-6380(86)80020-1
Li, D., He, D., Santosh, M., Ma, D., and Tang, J. (2015a). Tectonic Framework of the Northern Junggar Basin Part I: The Eastern Luliang Uplift and its Link with the East Junggar Terrane. Gondwana Res. 27 (3), 1089–1109. doi:10.1016/j.gr.2014.08.015
Li, D., He, D., Santosh, M., Ma, D., and Tang, J. Y. (2015b). Tectonic Framework of the Northern Junggar Basin Part II: The Island Arc basin System of the Western Luliang Uplift and its Link with the West Junggar Terrane. Gondwana Res. 27 (3), 1110–1130. doi:10.1016/j.gr.2014.08.019
Li, W., Yu, Z., Wang, X., Yu, Z., Lu, X., and Feng, Q. (2020). Formation Mechanisms of Deep and Ultra-deep over Pressure Caprocks and Their Relationships with Super-large Gas fields in the Petroliferous Basins of China. Nat. Gas Industry B 7 (5), 443–452. doi:10.1016/j.ngib.2020.09.002
Liang, D. G., Zhang, S. C., Chen, J. P., Wang, F. Y., and Wang, P. R. (2013). Organic Geochemistry of Oil and Gas in the Kuqa Depression, Tarim Basin, NW China. Org. Geochem. 34, 873–888.
Liu, Q., Dai, J., Jin, Z., Li, J., Wu, X., Meng, Q., et al. (2016). Abnormal Carbon and Hydrogen Isotopes of Alkane Gases from the Qingshen Gas Field, Songliao Basin, China, Suggesting Abiogenic Alkanes? J. Asian Earth Sci. 115, 285–297. doi:10.1016/j.jseaes.2015.10.005
Liu, Q., Qin, S., Li, J., Liu, W., Zhang, D., Zhou, Q., et al. (2008). Natural Gas Geochemistry and its Origins in Kuqa Depression. Sci. China Ser. D-earth Sci. 51, 174–182. doi:10.1007/s11430-008-5003-3
Liu, Q., Wu, X., Wang, X., Jin, Z., Zhu, D., Meng, Q., et al. (2019). Carbon and Hydrogen Isotopes of Methane, Ethane, and Propane: A Review of Genetic Identification of Natural Gas. Earth-Science Rev. 190, 247–272. doi:10.1016/j.earscirev.2018.11.017
Liu, W. H., Zhang, D. W., Wang, X. F., and Nan, Q. (2004). Geochemistry Study on Gas Source Correlation of Natural Gas. Acta Sedimentologica Sinica 22 (Suppl. l), 27–32. (in Chinese with English abstract).
Novikov, I. S. (2013). Reconstructing the Stages of Orogeny Around the Junggar basin from the Lithostratigraphy of Late Paleozoic, Mesozoic, and Cenozoic Sediments. Russ. Geology. Geophys. 54 (2), 138–152. doi:10.1016/j.rgg.2013.01.002
Orcutt, D. M., and Patterson, G. W. (1975). Sterol, Fatty Acid and Elemental Composition of Diatoms Grown in Chemically Defined media. Comp. Biochem. Physiol. B: Comp. Biochem. 50 (4), 579–583. doi:10.1016/0305-0491(75)90093-0
Peters, K. E. (1986). Guidelines for Evaluating Petroleum Source Rock Using Programmed Pyrolysis. AAPG Bull. 70, 318–329. doi:10.1306/94885688-1704-11d7-8645000102c1865d
Peters, K. E., Walters, C. C., and Moldowan, J. M. (2005). The Biomarker Guide [M]. second edition. Cambridge: Cambridge University Press.
Petersen, H. I. (2002). A Re-consideration of the "Oil Window" for Humic Coal and Kerogen Type Iii Source Rocks. J. Pet. Geol 25, 407–432. doi:10.1111/j.1747-5457.2002.tb00093.x
Petersen, H. I., Holme, A. C., Thomsen, E., Whitaker, M. F., Brekke, T., Bojesen-Koefoed, J. A., et al. (2011). Hydrocarbon Potential of Middle Jurassic Coaly and Lacustrine and Upper Jurassic - Lowermost Cretaceous Marine Source Rocks in the Søgne Basin, North Sea. J. Pet. Geology. 34, 277–304. doi:10.1111/j.1747-5457.2011.00506.x
Petersen, H. I., and Nytoft, H. P. (2006). Oil Generation Capacity of Coals as a Function of Coal Age and Aliphatic Structure. Org. Geochem. 37, 558–583. doi:10.1016/j.orggeochem.2005.12.012
Petford, N., and Mccaffrey, K. J. W. (2003). Hydrocarbons in Crystalline Rocks [M]. London: The Geological Society of London.
Powell, T. G. (1988). Pristane/phytane Ratio as Environmental Indicator. Nature 333, 604. doi:10.1038/333604a0
Qiu, N. S. (2002). Characters of thermal Conductivity and Radiogenic Heat Production Rate in Basins of Northwest China. Chin. J. Geology. 37, 196–206. (in Chinese with English abstract).
Qiu, N. S., Wang, X. L., Yang, H. B., and Xiang, Y. (2001). The Characteristics of Temperature Distribution in the Junggar Basin. Chin. J. Geology. 36, 350–358. (in Chinese with English abstract).
Qiu, N. S., Zha, M., and Wang, X. L. (2000). Simulation of Geothermal Evolution History in Junggar Basin. Xinjiang Pet. Geology. 21, 39–41. (in Chinese with English abstract).
Ren, Z., Cui, J., Qi, K., Yang, G., Chen, Z., Yang, P., et al. (2020). Control Effects of Temperature and thermal Evolution History of Deep and Ultra-deep Layers on Hydrocarbon Phase State and Hydrocarbon Generation History. Nat. Gas Industry B 7 (5), 453–461. doi:10.1016/j.ngib.2020.09.003
Schwark, L., and Empt, P. (2006). Sterane Biomarkers as Indicators of Palaeozoic Algal Evolution and Extinction Events. Palaeogeogr. Palaeoclimatol. Palaeoecol. 240, 225–236. doi:10.1016/j.palaeo.2006.03.050
Sinninghe, J. S., Kenig, F., Koopmans, M. P., Köster, J., Schouten, S., Hayes, J. M., et al. (1995). Evidence for Gammacerane as an Indicator of Water Column Stratification. Geochimica et Cosmochimica Acta 59, 1895–1900. doi:10.1016/0016-7037(95)00073-9
Suárez-Ruiz, I., Flores, D., Mendonça Filho, J. G., Hackley, P. C., and Hackley, P. C. (2012). Review and Update of the Applications of Organic Petrology: Part 1, Geological Applications. Int. J. Coal Geology. 99, 54–112. doi:10.1016/j.coal.2012.02.004
Sun, P. A., Wang, Y., Leng, K., Li, H., Ma, W., and Cao, J. (2016). Geochemistry and Origin of Natural Gas in the Eastern Junggar Basin, NW China. Mar. Pet. Geology. 75, 240–251. doi:10.1016/j.marpetgeo.2016.04.018
Sweeney, J. J., and Burnham, A. K. (1990). Evaluation of a Simple Model of Vitrinite Reflectance Based on Chemical Kinetics. AAPG Bull. 74, 1559–1570. doi:10.1306/0c9b251f-1710-11d7-8645000102c1865d
Tang, Y., Perry, J. K., Jenden, P. D., and Schoell, M. (2000). Mathematical Modeling of Stable Carbon Isotope Ratios in Natural Gases. Geochimica et Cosmochimica Acta 64 (15), 2673–2687. doi:10.1016/s0016-7037(00)00377-x
Taylor, G. H., Teichmüller, M., Davis, A., Diessel, C. F. K., and Robert, P. (1998). Organic Petrology[M]. Berlin-Stuttgart: Borntraeger.
Volkman, J. K. (1986). A Review of Sterol Markers for marine and Terrigenous Organic Matter. Org. Geochem. 9, 83–99. doi:10.1016/0146-6380(86)90089-6
Vu, T. T. A., Zink, K.-G., Mangelsdorf, K., Sykes, R., Wilkes, H., and Horsfield, B. (2009). Changes in Bulk Properties and Molecular Compositions within New Zealand Coal Band Solvent Extracts from Early Diagenetic to Catagenetic Maturity Levels. Org. Geochem. 40, 963–977. doi:10.1016/j.orggeochem.2009.06.002
Wang, S., Hu, S., Li, T., Wang, J., and Zhao, W. (2000b). Terrestrial Heat Flow in Junggar Basin, Northwest China. Chin.Sci.Bull. 45, 1808–1813. doi:10.1007/bf02886273
Wang, S. J., Hu, S. B., and Wang, J. Y. (2000a). The Characteristics of Heat Flow and Geothermal fields in Junggar Basin. Chin. J. Geophys. 43, 771–779. (in Chinese with English abstract). doi:10.1002/cjg2.98
Wang, X. L., Zhi, D. M., Wang, Y. T., Chen, J. P., and Qin, Z. J. (2013). Organic Geochemistry of Source Rocks and Hydrocarbons in the Junggar Basin. Beijing: Petroleum Industry Press. (in Chinese).
Wei, G., Yang, W., Liu, M., Xie, W., Jin, H., Wu, S., et al. (2020). Distribution Rules, Main Controlling Factors and Exploration Directions of Giant Gas fields in the Sichuan Basin. Nat. Gas Industry B 7 (1), 1–12. doi:10.1016/j.ngib.2020.01.001
Whiticar, M. J. (1999). Carbon and Hydrogen Isotope Systematics of Bacterial Formation and Oxidation of Methane [J]. Chem. Geology. 161 (1-3), 291–314. doi:10.1016/s0009-2541(99)00092-3
Wu, X., Chen, Y., Wang, Y., Zeng, H., Jiang, X., and Hu, Y. (2021). Geochemical Characteristics of Natural Gas in Tight sandstone of the Chengdu Large Gas Field, Western Sichuan Depression, Sichuan Basin, China. J. Nat. Gas Geosci. 6 (5), 279–287. doi:10.1016/j.jnggs.2021.09.003
Wu, X., Chen, Y., Zhai, C., Zhou, X., Liu, W., Yang, J., et al. (2020). Gas Source and Exploration Direction of the Middle Triassic Leikoupo Formation in the Sichuan Basin, China. J. Nat. Gas Geosci. 5 (6), 317–326. doi:10.1016/j.jnggs.2020.10.001
Xiao, W. J., Han, C. M., Yuan, C., Sun, M., Lin, S. F., Chen, H. L., et al. (2008a). Middle Cambrian to Permian Subduction Related Accretionary Orogenesis of Northern Xinjiang, NW China: Implications for the Tectonic Evolution of Central Asia[J]. J. Asian Earth Sci. 32 (2–4), 102–117. doi:10.1016/j.jseaes.2007.10.008
Xiao, Z. H., Xie, Z. Y., Li, Z. S., Ma, C. H., and Sun, Q. W. (2008b). Geochemical Characteristics of Natural Gas of Xujiahe Formation in Southern and Middle Sichuan. J. Southwest Pet. Univ. (Science Tech. Edition) 30 (4), 27–30. (in Chinese with English abstract).
Xiong, Y., Geng, A., and Liu, J. (2004). Kinetic-simulating experiment Combined with GC-IRMS Analysis: Application to Identification and Assessment of Coal-Derived Methane from Zhongba Gas Field (Sichuan Basin, China). Chem. Geology. 213 (4), 325–338. doi:10.1016/j.chemgeo.2004.07.007
Yao, W., Xu, J., Xia, W., Wang, Q., Rao, D., and Chen, Q. (2020). A Characteristic Analysis between Acidolysis Gas and Absorbed Gas and its Application to Gas Source Correlation in Mao 1 Member, Fuling Area, Sichuan Basin. Nat. Gas Industry B 7 (1), 24–29. doi:10.1016/j.ngib.2019.06.001
Yu, S., Wang, X., Xiang, B., Liao, J., Wang, J., Li, E., et al. (2014). Organic Geochemistry of Carboniferous Source Rocks and Their Generated Oils from the Eastern Junggar Basin, NW China. Org. Geochem. 77, 72–88. doi:10.1016/j.orggeochem.2014.09.011
Zhang, L., He, D., Yi, Z., and Li, D. (2020a). Tectonic Relationship between the Kelameili Range and the Dajing Depression: Insights into the Carboniferous Tectonic-Sedimentary Framework. Pet. Exploration Develop. 47 (1), 30–45. doi:10.1016/s1876-3804(20)60003-9
Zhang, M., and Cheng, Q. S. (2021). Distribution and Significance of High Abundance C29 Regular Sterane in the Crude Oil of Lower Paleozoic in Tarim Basin. J. Yangtze Univ. (Natural Sci. Edition) 18 (1), 11–19.
Zhang, S., Zhang, S., Fang, L., Lu, X., Guo, H., and Shi, J. a. (2020b). Petrological and Geochemical Constraints on Tectonic Settings of the Late Carboniferous-Early Permian, Central Junggar, China. J. Nat. Gas Geosci. 5 (1), 1–10. doi:10.1016/j.jnggs.2019.12.002
Zhi, D., Wang, X., and Qin, Z. (2022). Geneses, Sources and Accumulation Process of Natural Gases in the Hinterland of the Junggar Basin. Front. Earth Sci. 10. doi:10.3389/feart.2022.843245
Keywords: Junggar basin, Jimsar Sag, Carboniferous, volcanic rocks, hydrocarbon-generating potential, oil and gas sources, exploration domain
Citation: Gong D, Song Y, Peng M, Liu C, Wang R and Wu W (2022) The Hydrocarbon Potential of Carboniferous Reservoirs in the Jimsar Sag, Northwest China: Implications for a Giant Volcanic-Petroleum Reserves. Front. Earth Sci. 10:879712. doi: 10.3389/feart.2022.879712
Received: 20 February 2022; Accepted: 17 March 2022;
Published: 13 April 2022.
Edited by:
Guanglong Sheng, Yangtze University, ChinaReviewed by:
Shu Tao, China University of Geosciences, ChinaBin Cheng, China University of Petroleum, China
Copyright © 2022 Gong, Song, Peng, Liu, Wang and Wu. This is an open-access article distributed under the terms of the Creative Commons Attribution License (CC BY). The use, distribution or reproduction in other forums is permitted, provided the original author(s) and the copyright owner(s) are credited and that the original publication in this journal is cited, in accordance with accepted academic practice. No use, distribution or reproduction is permitted which does not comply with these terms.
*Correspondence: Deyu Gong, ZGV5dWdvbmdAcGV0cm9jaGluYS5jb20uY24=
 Deyu Gong
 Yong Song2
