- School of Geoscience and Technology, Southwest Petroleum University, Chengdu, China
With the development of unconventional oil and gas exploration “from sea to land,” lacustrine fine-grained sedimentary rocks (FSR) have gradually attracted the attention of scholars and become an important topic in the field of unconventional oil and gas, but the research is still in its initial stage. In this study, lacustrine FSR in the Dongying Depression of the Bohai Bay Basin are used as the research object, and nuclear magnetic resonance (NMR) and quantitative image characterization are used to characterize the pore structure of the reservoir in the study area on multiple scales, analyze the reservoir characteristics control factors, and classify and evaluate the reservoir. The results show that: 1) the favorable petrographic phases of the FSR reservoir can be classified into six types of organic-rich lime mudstone, organic-rich laminoid lime clay rock, organic-rich laminoid clay micritic limestone, organic-bearing banding clay micritic limestone, organic-rich banding lime clay rock, and organic-bearing lumpy clay micritic limestone. With an average porosity of 12.3% and an average permeability of 10.58 mD, the overall reservoir is a typical low-porosity-low-permeability type; 2) the reservoir space types are diverse, with strong microscopic inhomogeneity; pores with a pore size of less than 2 nm almost have no contribution to the reservoir space; the pore volume and pore area are mainly provided by organic matter pores at the 100 nm level, mineral intergranular pores, and clay mineral shrinkage pores/slits. The FSR reservoirs in the study area are classified into three categories, and the pore structure of the reservoirs from categories I to III deteriorates in turn. This study provides a basis for the microscopic characterization, classification, and evaluation of lacustrine FSR reservoirs and their exploration.
1 Introduction
In recent years, a rising number of exploration achievements have shown that fine-grained sediments in lacustrine basins have great potential for oil production and storage (Wu et al., 2013; Zhang et al., 2014; Zeng et al., 2021; Yang et al., 2022). Compared with the pure muddy shale in deep sea and deep lakes, the fine-grained sedimentary rocks (FSR) in the gently sloping zone of the lake basin margin are diverse in composition, nonhomogeneous and complex in the deposition mechanism (Zhang et al., 2019; Zhang et al., 2020a; Liu et al., 2020; Li S et al., 2021). As an important carrier of oil gas distribution, FSR are often located in the transition zone between the conventional and unconventional oil gas reservoirs in lacustrine basins, and therefore, the studies of their depositional mechanisms, reservoir characteristics, and oil gas enrichment patterns are of great importance to the integration of conventional and unconventional oil gas exploration and exploitation (Xie et al., 2018; Zhang et al., 2020b; Li W et al., 2021; Pan et al., 2021).
Reservoir microscopic pore structure characteristics are key factors that affect reservoir physical properties (Deng et al., 2014; Wang et al., 2020; Gao, 2021; Yu et al., 2022), and characterization of pore structures has become a hot topic in the study of FSR reservoirs (Curtis, 2002; Cusack et al., 2010; Clarkson et al., 2013; Curtis et al., 2012; Gao et al., 2018). Compared with conventional reservoirs, the pores of FSR reservoirs are distributed at scales from nanometer to millimeter, and the mixture of sedimentary components also makes their reservoir space types diverse and their pore throat structures complex. Therefore, conventional observation techniques such as cast thin section and scanning electron microscopy (SEM) are limited by resolution to accurately and comprehensively characterize their pore microstructure, and cannot quantitatively and intuitively portray the pore throat size, distribution, and non-homogeneity (Guo et al., 2014; Jiao et al., 2014). With the advancement of pore structure characterization techniques, high-pressure mercury compression, nuclear magnetic resonance (NMR), and gas adsorption have provided new ideas for an in-depth portrayal of the microscopic pore structure of FSR (Fredrich et al., 1995; Javadpour, 2009, 2012; Li et al., 2016; Devarapalli et al., 2017; Zhu et al., 2017; Zhang et al., 2020c; Zhang et al., 2022). In addition, the argon ion polishing SEM technique with Image J image processing provides an accurate and rapid means to quantitatively characterize structural parameters such as pore morphology, pore size distribution, probability entropy, and pore area contribution (Liu et al., 2011; Chalmers et al., 2012; Loucks et al., 2012; Giffin et al., 2013). With the advancement of technology, scholars worldwide have analyzed the unconventional reservoirs regarding their collectivity, occurrence state of oil and gas, and the reservation pattern (Hickey and Henk, 2007; Chalmers and Bustin, 2008; Loucks et al., 2009, 2012; Yao et al., 2011; Milliken et al., 2012; Mastalerz et al., 2013; Yang et al., 2016; Fan et al., 2018; Zeng et al., 2021). However, rarely have studies been conducted on the microscopic characterization of mixed FER reservoirs in the sloping region of the lacustrine basin or on the control factors of reservoir characteristics.
The Paleogene of the Dongying Depression in the Bohai Bay Basin is one of the basins with more developed FSR in China (Xie et al., 2018), and in recent years, significant breakthroughs have been made in oil and gas exploration in the gently sloping southern part of this Depression (Dong et al., 2011; Song et al., 2013; Xie et al., 2018; Duan et al., 2020). This work studied the FSR reservation in the fourth member of the Shahejie Formation (Es4) in the Chenguanzhuang area of the southern gently sloping zone of the Dongying Depression, Bohai Bay Basin. NMR technology was applied for full pore size analysis; argon ion polishing SEM and Image J image processing technique were adopted to quantitatively characterize the reservoir microstructure parameters. The structural characteristics and pore area contribution of different pore types were discussed in detail. Finally, the FSR reservoirs in the study area were classified and evaluated based on the petrography, physical characteristics, and pore types and structures. This study can provide theoretical guidance for the exploration of FSR reservoirs in the study area. Besides, the findings offer a new basis for the study of oil and gas accumulation patterns in lacustrine basins.
2 Geological Settings
The Bohai Bay Basin is located in eastern China (Figure 1A), bordered by the Jiao-Liao Uplifted area to the east, the Taihang Mountains Uplift to the west, the Luxi Uplift to the south, and the Yanshan Fold Belt to the north. It is a Meso-Cenozoic fault basin developed as a result of Palaeozoic sedimentation as well as the movements during the Indo-Chinese and Yanshanian epoch of the Sino-Korean paraplatform, covering an area of about 1.5 × 10⁵ km2. Overall, the basin underwent two major stages of tectonic evolution: the contemporaneous rift stage and the oligocene post-rift stage. During the Paleogene, a series of north-east and north-west trending orthogonal faults were formed as a result of the rifting of the basin, forming a series of grabens and half-grabens. By the late Oligocene, the basin had entered a post-rifting phase and tectonically stabilized, with these graben and half-graben assemblages forming the present-day Bohai Bay Basin. The Jiyang Depression is a secondary tectonic unit located in the southeastern part of the Bohai Bay Basin (Figure 1B), and is one of the most gas and oil-rich depressions in the Bohai Bay Basin, sharing a common geodynamic background with the Bohai Bay Basin. The basin has undergone five stages of regional tectonic evolution, i.e., early crystalline basement formation, Paleozoic-Middle Jurassic platform cover development, Late Jurassic-Early Cretaceous fault subsidence, Paleoproterozoic fault subsidence, and Neoproterozoic-Quaternary depression, where the Paleoproterozoic fault subsidence was mainly controlled by the Xishan movement. The basin evolution went through four stages of fault subsidence, i.e., the initial stage, the development stage, the prime stage, and the shrinking stage. Accordingly, there are four stages of episodic evolution, namely, the Kongdian Formation, the fourth member of the Shahejie Formation (Es4), the lower subsection of the Es3-Es2, and the upper subsection of Es2-Dongying Formation (Figure 1C). The sedimentary stage of the Es4 was during the period of fault development and was active from 50.5 to 42.0 Ma. It can be further divided into the Upper subsection (Es4S) and the Lower subsection (Es4X) based on its depositional rotation. As can be seen from Figure 1C, the top interface of ES4S is a disintegration with the ES3. During this period, the entire Jiyang Depression basin continued to be influenced by the tectonic transition adjustment of the Kongdian Formation, and a series of fracture systems were formed under the influence of rightward advection movements (Figure 1B), with several independent sedimentation centers being developed. The Dongying Depression is a secondary depression located to the south of the Jiyang Depression, inheriting its tectonic evolution. It is a typical asymmetrical half graben depression with a northern break and a southern overtop, being steep in the north and gentle in the south. The depression is bounded in the north by the Chenjiazhuang Bulge, in the south by the Luxi Uplift, in the east by the Qingtuozi Bulge, and in the west by the Binxian Bulge and the Qingcheng Bulge. A series of internal homogenous orthotropic faults further divide the depression into secondary tectonic units, including a steep-slope zone in the north, a central back-slope zone, a gently sloping zone in the south, and multiple fracture zones.
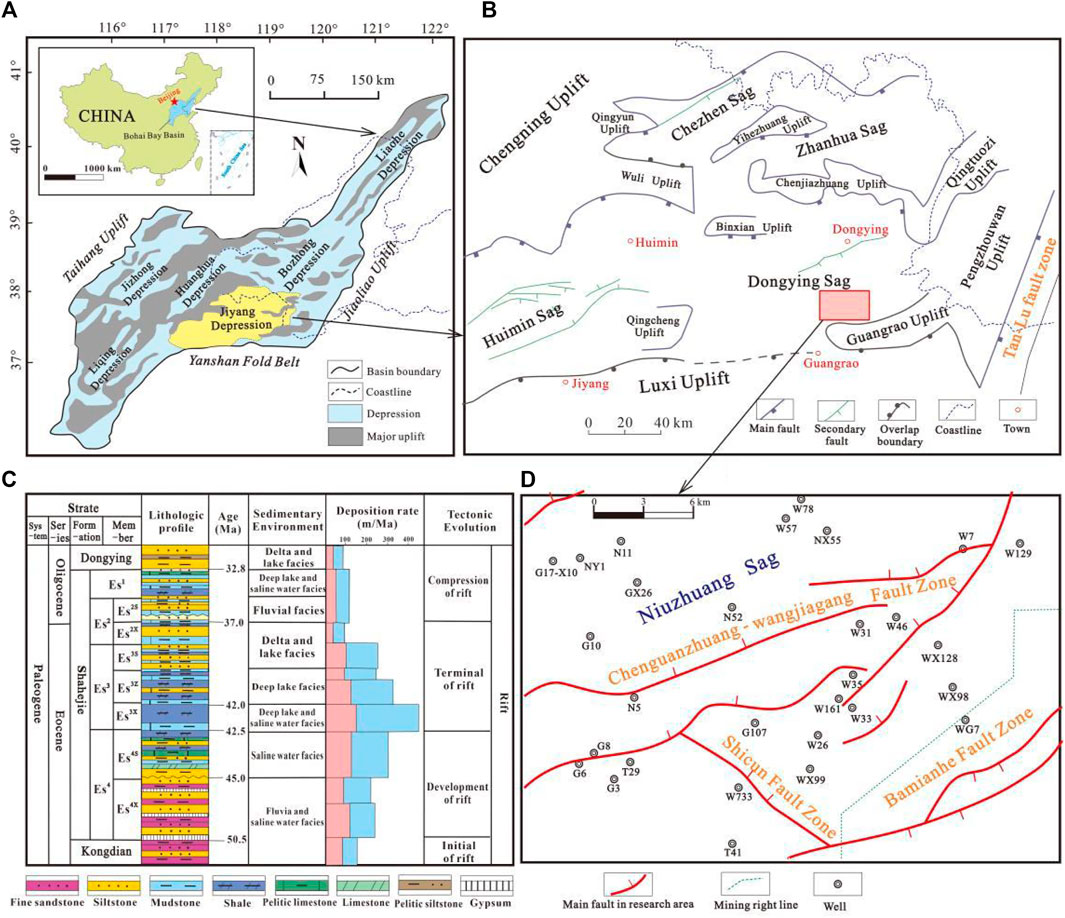
FIGURE 1. Comprehensive bar diagram of regional geology and sedimentary evolution. (A) Tectonic overview of the Bohai Bay Basin; (B) tectonic overview of the Jiyang Depression and the location of the study area; (C) comprehensive bar chart of the Shahejie Formation stratigraphy in the study area; (D) tectonic overview of the study area.
The Chenguanzhuang of the study area is located in the eastern part of the southern slope of the Dongying Depression, geographically situated in the northern part of Guangrao County, Dongying City, Shandong Province. Stretching to the Le’an Oilfield in the south and to the Niuzhuang Depression in the north, it is adjacent to the Chunhua Oilfield in the west and connected to the Dingjiawuzi tectonic zones in the east. The study area covers an area of approximately 200 km2 and is high in the south and low in the north generally, cut by faults into complex fault-step tectonic zones, internally controlled by three main fault zones, i.e., near east-west trending Chen Guanzhuang-Wangjiagang fault zone, the near north-south trending Shicun fault zone, and the Bamianhe fault zone that is located at its southeastern direction (Figure 1D). During the depositional period of Es4S, the water body in the study area gradually became deeper from south to north, transitioning from a shallow lacustrine environment to a semi-deep-lacustrine one. At the same time, it was receiving a supply of land-derived debris from the Guangrao Bulge in the southeast, and depositing a suite of FSR dominated by lacustrine carbonates in a dynamic context of frequent fault activity (Ma et al., 2020).
3 Samples, Experiments, and Data Sources
A total of 281 rock samples were collected from 11 core wells, including NY1, WX128, GX27, and WG7, and then were ground into centimeter-sized pieces for SEM observation. 430 microscopic photographs were taken (Table 1). The samples were ground, cleaned, dried, and coated with a conductive adhesive layer by the stratigraphic laboratory of Exploration and Development Research Institute, Sinopec Shengli Oilfield Company. The microscopic observation, description, and photography were all completed under a QUANTA FEG250 field emission environment SEM to achieve high-resolution backscattered electron images with micro- and nano-scale pore characteristics and accurate calibration. The sections of 16 rock samples from one of the wells, GX27, were observed after argon ion polishing (Table 2), and the representative electron microscope photographs were processed in Image J software to obtain pore structure parameters such as face porosity, shape factor, and fractal dimension.
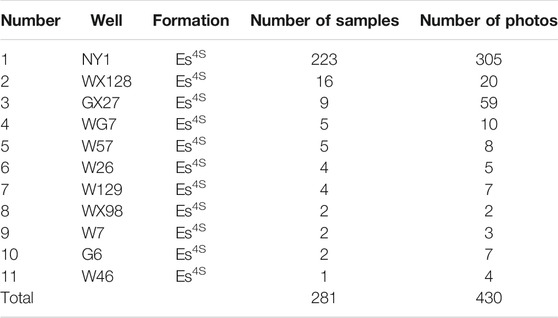
TABLE 1. The number, well name, formation, number of samples, and number of photos used in scanning electron microscope (SEM) observation. See Figure 1 for the well location.
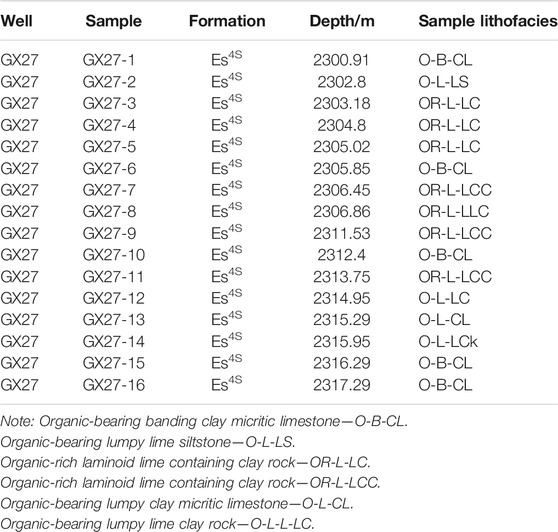
TABLE 2. Argon Ion Polished SEM Sample Information. See Figure 1 for the well location.
A total of 50 rock samples from eight coring wells, including NY1, NX55, GX27, W129, and NX55, etc., were collected and ground to 3–5 g of powder of 200–350 mesh for X-ray diffraction whole-rock analysis (Table 3). The samples were milled, pressed, and pretreated by the stratigraphic laboratory of Exploration and Development Research Institute, Sinopec Shengli Oilfield Company. The X-rays analysis was carried out under an Ultima IV diffractometer, and the experimental data were processed and transcoded using the RINT-2000 Binary Pattern model in Jade software.

TABLE 3. The number, well name, formation, depth range of samples, and number of samples used in X-ray diffraction (XRD) experiment. See Figure 1 for the well location.
Meter of 2.5 cm and a length greater than 0.5 cm were cut; the end faces were ground and polished, first oiled and salted, immersed in a KCL solution with a concentration of approximately 0.5 mg/L. Then the samples were saturated under vacuum for 8 h at a saturation pressure of 0.3 MPa until they were fully saturated with brine. The NMR test was completed on a Newmark MicroMR20-G core analyzer and the T2 spectrum under the fully saturated state was obtained (Table 4).
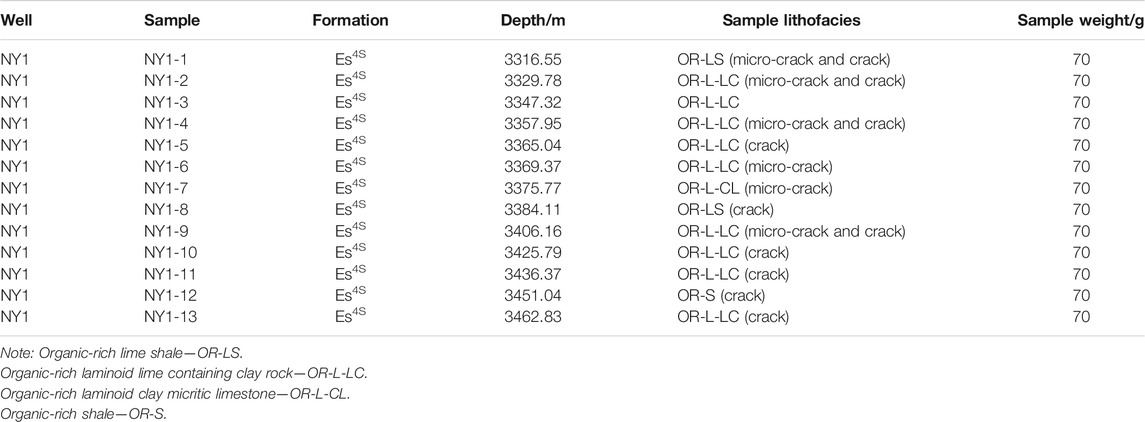
TABLE 4. NMR experimental sample information sheet. See Figure 1 for the well location.
4 Results and Discussion
4.1 Fine-Grained Sedimentary Rock Reservoir Characteristics
4.1.1 Classification of Favorable Petrographic Phases
According to the X-ray diffraction whole-rock analysis data, the main mineral constituents of the FSR in the study area include calcite, quartz, and clay with a minor amount of secondary minerals such as dolomite, pyrites, feldspar, and organic matter (Table 5; Figure 2). The carbonate constituents include calcite and dolomite, with the average content of 57.7%. The average content of the clay minerals is 34.9%. The land-derived debris constituents mainly include feldspar and quartz, with the average content of 13.8%. Besides, pyrite also exists here in a minor quantity, with the average organic matter content of 1.6%. According to the thin section authentication in combination with the comparison between the oil gas indication in the well logging and the explanation to the fluid property in the well logging, it can be seen that the rock types of the favorable reservoirs are mainly lime shale, lime clay rock, and organic-rich laminoid clay micritic limestone (Figure 2).
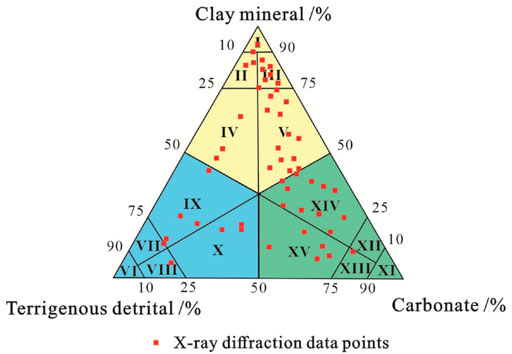
FIGURE 2. X-ray diffraction data projection points in a triangle chart I. Clay rock; II. Silt-bearing clay rock; III. Lime-/dolomite-bearing clay rock; IV. Silty clay stone; V. Lime/dolomitic clay rock; VI. Siltstone; VII. Clay-bearing siltstone; VIII. Limestone-/dolomite-bearing siltstone; IX. Clay siltstone; X. Lime/dolomitic siltstone; XI. Limestone/dolomite; XII. Clay-bearing limestone/dolomite; XIII. Silt-bearing limestone/dolomite; XIV. Clay limestone/dolomite; XV. Silty limestone/dolomite.
To better serve for the exploration and exploitation of oil gas, the study adopted a relatively mainstream petrographic classification scheme for FSR (Ning et al., 2017; Peng et al., 2022), i.e., the form of “organic matter + sedimentary structure + basic rock type” as the way of naming petrographic phases. The FSR sedimentary structures were classified into four types, which are the lumpy, banding, laminoid, and lamella types. Among them, the lumpy structure features the single constituent thickness ≥ 5 cm and homogeneity internally without obvious lamina. The banding structure features the single constituent thickness ≥ 1 mm and rhythmic interbedding consisting of two to three constituents. The laminoid structure features the single constituent thickness < 1 mm and rhythmic interbedding consisting of two to three constituents. The organic matter content, as the key indicator of hydrocarbon generation and reservation capacities, was classified based on the content of 2%, which above 2% classified as organic-rich and otherwise as organic-bearing. Based on the core observation and thin section authentication in combination with the comparison of oil-bearing properties between every petrographic phase, the favorable petrographic phases were classified into six types, including organic-rich lime shale (OR-LS), organic-rich laminoid lime clay rock (OR-L-LC), organic-rich laminoid clay micritic limestone (OR-L-AM), organic-bearing banding clay micritic limestone (OM-B-AM), organic-rich banding lime clay rock (OR-B-LC), and organic-bearing lumpy clay micritic limestone (OM-M-AM).
The organic-rich lime shale features an obvious lamella structure, with clear and dense lamellation cracks connected with each other under the lamellae, and contains high clay mineral content reaching 70–80% and the lime content of 20–30%, embodied by the rhythmically developed micritic calcite laminas, with stable thickness and the single-layer lime lamina thickness less than 1 mm, containing high organic matter content and generally bearing oil (Figure 3A). The organic-rich laminoid lime clay rock is embodied as the dual interbedding between micritic calcite laminas and clay laminas with the thickness less than 1 mm under microscopy, with bedding cracks locally developed. It has the clay mineral content a bit higher than the calcite content, and its clay lamina thickness is 500–700 μm, rich in organic matter, whereas its calcite lamina thickness is 200–400 μm. Both of the two types of laminas are relatively straight and flat morphologically. This type of petrographic phase also bears oil generally (Figure 3B). The organic-rich laminoid clay micritic limestone is similar to the organic-rich laminoid lime clay rock in petrographic phase, but contains much higher lime content, embodied by the increase of the calcite lamina thickness to 200–600 μm and the decrease of the clay lamina thickness to 200–400 μm. The dual interbedding between the two types of laminas becomes denser, with basically straight and flat morphology, slightly corrugated or lenticular deformation in some local lime laminas, and few bedding cracks. This type of petrographic phase features good oil-bearing properties at the same time (Figure 3C). The organic-bearing banding clay micritic limestone is embodied as the banding interbedding of micritic calcite and clay minerals with corrugated deformation in local parts. The calcite bands are 1–1.5 mm thick, whereas the thickness of the clay bands varies a lot with a wide distribution of 0.1–1.0 mm, occasionally mixed with a little land-derived debris distributed in a scattered way. This type of petrographic phase basically has no bedding cracks developed, with low content of organic matter and certain oil-bearing properties (Figure 3D). The organic-rich banding lime clay rock has the mineral constituents dominated by clay minerals. The clay bands are relatively thick, approximately 1–3 mm, whereas the micritic calcite laminas/bands that are slim and straight and interbedded with the clay bands are thin, approximately 0.1–0.5 mm, mixed with land-derived debris distributed in a scattered way. It features bedding cracks locally developed, high organic matter content, and good oil-bearing properties (Figure 3E). The organic-bearing lumpy clay micritic limestone contains relatively homogeneous lumps, with the clay mineral content approximately 30–40%, the micritic calcite content approximately 60–70%, and the scattered distribution of land-derived debris in local parts. This type of petrographic phase has low content of organic matter and certain oil-bearing properties (Figure 3F).
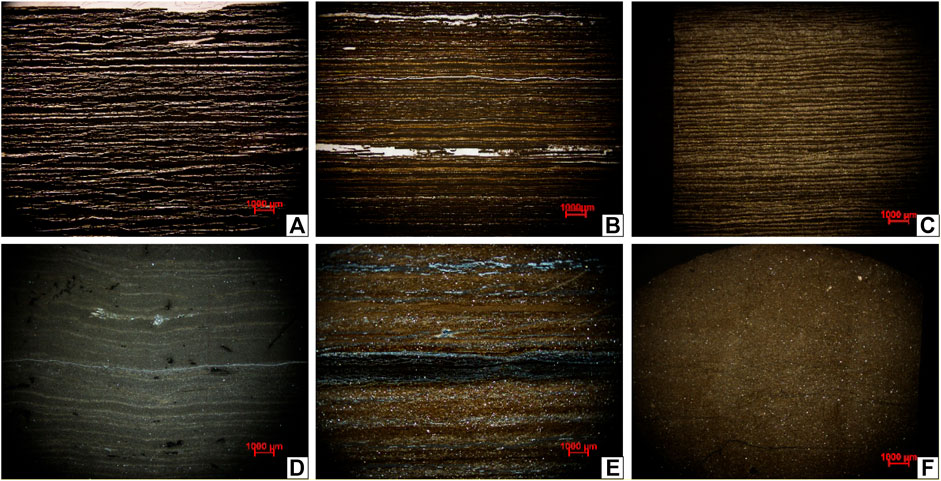
FIGURE 3. Microscopic characteristics of six favorable petrographic phase types. (A) Organic-rich lime shale (OR-LS), W33, 1,950.95–1,950.96 m, 1x (−); (B) organic-rich laminoid lime clay rock (OR-L-LC); G3, 2,159–2,159.02 m, 1x (−); (C) organic-rich laminoid clay micritic limestone (OR-L-AM), W161, 1,985.7–1,985.72 m, 1x (+); (D) organic-bearing banding clay micritic limestone (OM-B-CL), G6, 2,145.76–2,145.77 m, 1x (+); (E) organic-rich banding lime clay rock (OR-B-LC), T29, 2,069.8–2,069.82 m, 1x (+); (F) organic-bearing lumpy clay micritic limestone (OM-L-CL), W161, 1,908.44–1,908.46 m, 1x (+).
4.1.2 Physical Characteristics
According to the statistics of the physical data of the 107 cores collected from the FSR reservoirs of the study area, the maximum, minimum, and average porosity values of the Es4S FSR reservoirs of Chenguanzhuang area are 26.32, 0.511, and 12.3%, respectively. The porosity is mainly distributed in the range of 5–10%, accounting for 35% of the samples, followed by the range of 10–15% accounting for 22% of the samples (Figure 4A). Meanwhile, the maximum, minimum, and average permeability values are 130.51, 0.001, and 10.58 mD, respectively, with the permeability of approximately 43% of the samples < 1 mD, and that of another 20% distributed in the range of 1–5 mD (Figure 4B). Generally speaking, the FSR reservoirs in the study area are typical low-porosity-and-permeability reservoirs.

FIGURE 4. Physical characteristics of FSR reservoirs. (A) Histogram of porosity distribution frequency; (B) histogram of permeability distribution frequency; (C) intersection figure of porosity and permeability.
Based on the porosity and permeability and the correlation curve between them (Figure 4C), the correlation curve equation is
4.1.3 Reservoir Space Types
According to the thin section authentication and scanning electron microscopy (SEM) observation, most of the samples from the FSR reservoirs in the study area are compact, and thus their reservoir space is limited, with various types and high heterogeneity. Besides, their reservoir space is dominated by secondary pores and consists of a few primary pores and cracks. Therefore, the reservoir space can be classified into three major categories, i.e., pores, cracks, and micro-cracks. The pores consist of nano-scale pores including organic-matter shrinkage pores, mineral intergranular pores and clay mineral shrinkage pores, and micron-scale pores including residual interparticle pores and a few organism coelom pores and boring pores. Cracks are mainly micron-scale bedding cracks, while micro-cracks are intermediately developed, and dominated by nano-scale cracks including organic-matter shrinkage cracks, clay mineral shrinkage cracks, and micro-cracks caused by tectonic activity (Figure 5). Among them, the organic-matter shrinkage pores/cracks often exist inside organic matter aggregates, mostly in a long-strip or elliptic shape (Figures 5A,B). Meanwhile, the intergranular pores are mainly developed between mineral crystals such as pyrites, secondary carbonate minerals, secondary silicon minerals, with hundred-nano-scale diameters (Figures 5C–E). Additionally, the clay mineral shrinkage pores/cracks are secondary pores in an elliptic, hive, or scattered shape, associated with the thermal evolution of clay minerals (Figures 5F,G). The interparticle pores are mainly residual primary pores that have not been destroyed during the diagenesis and transformation in the late stage, with a very limited quantity (Figure 5H). Usually, the organism coelom pores are mainly attributed to micro-organisms (Figure 5I), whereas the boring pores are mainly attributed to macro-organisms of brachiopoda and gastropod, with relatively big diameters (Figure 5J). However, organism pores are rare in the study area. Besides, in the petrographic phase of mixed sedimentary rocks in a laminoid or banding structure, the bedding cracks that are vastly distributed from micron scale to millimeter scale (Figures 5K,L) are also effective reservoir space.
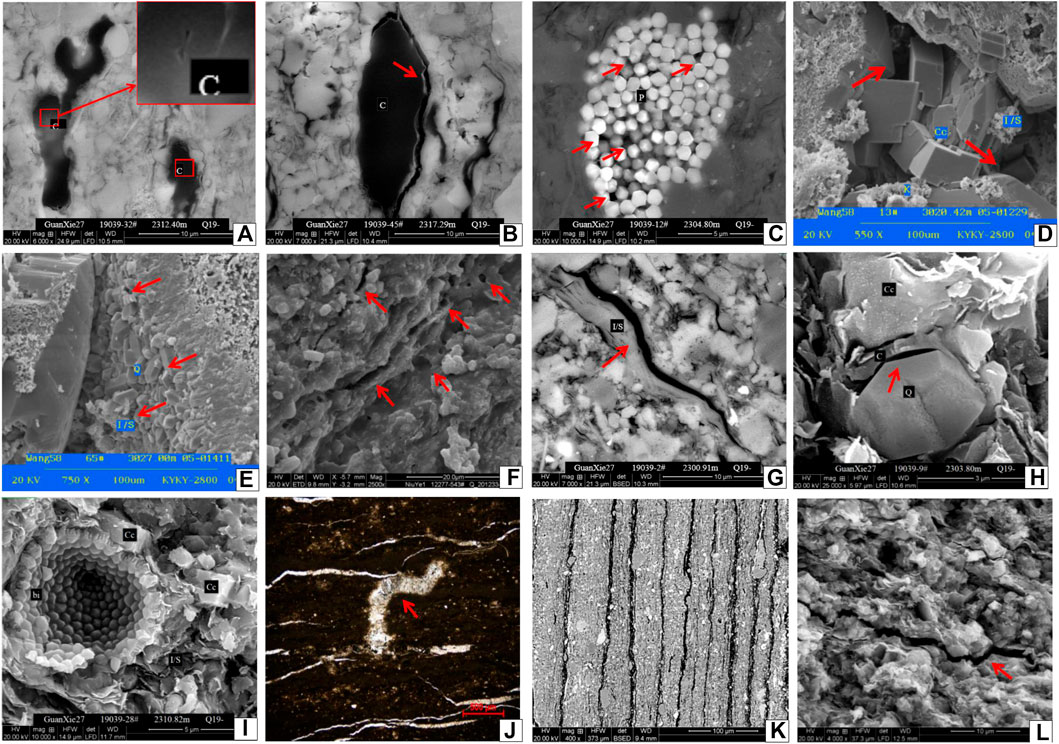
FIGURE 5. Reservoir space types of FSR reservoirs in the study area (A) organic-matter thermal evolution shrinkage pores, GX27 Well, 2,305.85 m, 6,000x; (B) organic-matter thermal evolution shrinkage cracks, GX27 Well, 2,317.29 m, 7,000x; (C) authigenic intergranular pores in pyrites, GX27 Well, 2,310.02 m,10,000x; (D) authigenic intergranular pores in calcite, W57 Well, 3,419.13 m, 550x; (E) authigenic intergranular pores in quartz, W58 Well, 3,027.00 m, 750x; (F) intergranular pores of clay mineral flocculate, NY1 Well, 3,431.93 m, 2,500x; (G) clay-mineral thermal evolution shrinkage cracks, NY1 Well, 3,437.98 m, 7,000x; (H) residual primary interparticle pores developed between calcite and quartz particles, GX27 Well, 2,303.80 m, 25,000x; (I) organism coelom pores, GX27 Well, 10,000x; (J) boring pores, almost occupied by calcite internally, T29 Well, 2,072.8 m, 5 (+); (K) bedding cracks, GX27 Well, 2,306.86 m, 400x; (L) bedding cracks existing in clay laminoid, GX27 Well, 2,316.29 m, 4,000x.
4.1.4 Pore Structure Characterization
With respect to the characteristics of various types and complex structures of the mixed lacustrine FSR pores, this study conducted multiscale qualitative analysis and quantitative characterization on the reservoir pore structures using NMR and the Image J image processing technique.
4.1.4.1 Full Pore Size Distribution Converted From NMR T2 Spectrum
The conversion of NMR T2 spectrum distribution was used to demonstrate the full pore size distribution curve of the micro-nanopores of the FSR reservoirs in the study area (Zeng et al., 2011; Lai et al., 2016; Wang et al., 2017). Meanwhile, 13 rock samples collected from NY1 Well were mainly the petrographic types with good oil-bearing quality like laminoid lime clay rock, lime shale, etc. All the samples demonstrated florescent display and most of them had developed cracks. The 13 samples in the test were used for the calculation of pore size-pore volume conversion and the three types of pore size–pore volume distribution curves were obtained (Figure 6).
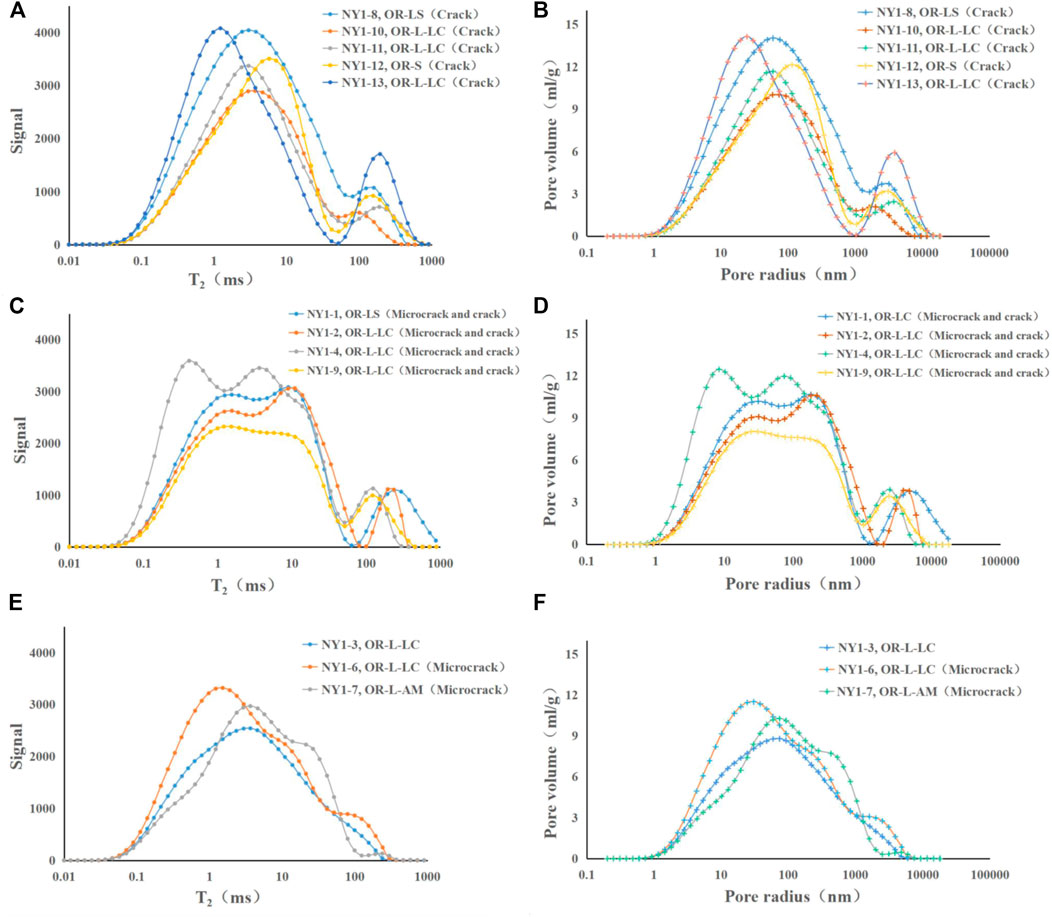
FIGURE 6. NMR test signal distribution curves and pore structure curves. (A) Type I NMR test signal curve; (B) Type I pore structure curve; (C) Type II NMR test signal curve; (D) Type II pore structure curve; (E) Type III NMR test signal curve; f. Type III pore structure curve.
The pore size–pore volume conversion calculation was conducted on the 13 samples in the test, and three types of pore size–pore volume distribution curves were obtained thereafter (Figure 6).
Type I curves show relatively obvious double-peak characteristics (Figures 6A,B), which are common in the pore structure curve of organic-rich lime shale and organic-rich laminoid lime clay rock that have developed cracks. The main peak of pore volume corresponds to pore sizes close to the hundred-nano scale, whereas a secondary peak exists in the pore size range of 1–10 μm. Therefore, the reservoir pore structures reflected in this type of curves are dominated by mesopores (2–50 nm) and macropores (>50 nm), each contributing 43.20 and 55.97% of the total pore volume, with micropores (<2 nm) accounting for only 0.82%.
Type II curves show obvious double-peak characteristics, with the main peak existing in the evidently differential section or the transient platform section (Figures 6C,D). This form is common in the pore structure curve of organic-rich lime shale with obviously developed cracks and micro-cracks and organic-rich laminoid lime clay rock. The first pore volume peak appears in the hundred-nano range. Compared with Type I curves, Type II curves feature a transient platform section near the main peaks, which can be deemed as the differentiation of the main peak value in a small range that generates the second pore volume peak value with a smaller volume in the pore size range of 1–10 μm. In general, Type II curves, with the typical characteristics of platform sections near main peaks, are also dominated by mesopores and macropores, each contributing 44.48 and 54.72% of the total pore volume, while micropores contributing 0.79%.
Type III curves show obvious single-peak characteristics, featuring standard or approximately standard normal distribution (Figures 6E,F). This form is common in the pore structure curve of organic-rich laminoid lime clay rock and organic-rich laminoid clay mitritic limestone. The micropores, mesopores, and macropores contribute 1.01, 45.43, and 53.54%, respectively, of the total pore volume.
According to the combined research results of the reservoir space types, the curves of all three types have their maximum pore volume peaks near 80–300 nm. Therefore, it was concluded that the nano-scale pores, including organic-matter shrinkage pores, secondary mineral intergranular pores, clay mineral shrinkage pores, etc., contributed the most of the pore volume. Meanwhile, they were also the most frequently observed reservoir space by microscope or SEM. Type II curves corresponded to the rock samples with highly developed cracks and micro-cracks. By comparing them with Type I curves, it can be seen that the micro-cracks formed by clay mineral shrinkage or organic-matter thermal evolution are the cause for the differentiation or transient platform sections in the main peak. Additionally, Samples NY1-6 and NY1-7 in Type III curves, which have developed cracks, have minor differentiation in the section right after the main peak, proving once more that the existence of micro-cracks effectively extends the main peak distribution of pore volume. By comparing Type I and Type III curves, it can be seen that the pore structure curves of the samples with developed macro-cracks often have secondary peak values in the range of 1–10 μm after the main peak. Based on the comparison of sample information, it can be seen that macro-cracks including structural cracks, lamellation cracks, abnormal-pressure cracks, etc. are the main reason for the occurrence of secondary peak values. According to the pore structure curves of all rock samples, the pores < 2 nm contribute almost nothing to reservoir space. Even if it is case of the extremely compact shale reservoirs in the study area, mesopores and macropores are still dominant, which tallies with the research results of reservoir space types observed by thin section authentication and SEM.
4.1.4.2 Quantitative Characterization of Micro-Nanopores Based on the FESEM Image Processing Technique
The SEM images with polished argon ions were binarized in the Image J software, with the background in black and the pores in white. Afterward, the pores were manually calibrated, finely tuned, and colored in the Coreldraw software, using different colors for different types of pores (Figure 7). Since image statistical analysis requires not only precise observation, but also a maximum viewing area, based on the combination of previous research results, and multiple attempts and data analyses, it is concluded that SEM images magnified by 5,000X and below are more typical (the minimum statistical pore size under such a viewing area is approximately 20–30 nm) (Jiao et al., 2019). The observations were processed by quantitative statistics based on the calculation of pixels, and various structural parameters of different types of pores were then obtained (Table 6). Among those pores, the organic-matter shrinkage pores are the smallest, with a pore size range of 20–500 nm and an average pore size of 50 nm. However, they were extensively developed with the thermal evolution of organic matter, and finally feature an average pore area of 297 nm2 or so and an average form factor of 0.835. Hence, they have the most uniform morphology among all types of pores, and most of them are close to a round or ellipse in shape. The probability entropy and fractal dimensions reveal that they are directionally arranged, with relatively low inhomogeneity in size and morphology. The secondary mineral intergranular pores of different mineral constituents are a bit different from each other in pore size, with the dominant pore size range in 80–700 nm, an average pore size of 200 nm or so, an average pore area of 29,400 nm2 or so, and an average form factor of 0.631. It indicates that such pores have smooth and neat edges and minor difference in morphology. Besides, their probability entropy is 0.205, demonstrating that the arrangement in their space has a certain direction, which was caused by the relatively uniform growing direction of secondary minerals. The clay mineral shrinkage pores have an extensive pore size distribution range due to different levels of thermal evolution shrinkage, with the minimum pore size of approximately 50 nm and the maximum as large as 2 μm. In addition, they have an average pore size of approximately 500 nm, an average pore area of 0.23 μm2, and an average form factor of 0.412, indicating that such pores have complex and rough edges morphologically. Their probability entropy is 0.524, indicating that the arrangement in their space has random directions and no uniformity. Moreover, their fractal dimension is 1.403, further revealing that those pores feature evident difference from each other in morphology and high inhomogeneity. The organism coelom pores and boring pores are both micron-scale pores, and similar to each other in morphology to some extent since their formation mechanisms are both related to organisms or organism activities, thus low in fractal dimensions. The bedding cracks exist extensively in the laminoid samples, and have the probability entropy of 0.05 and the fractal dimension of 1.404, indicating that the bedding cracks have uniform arrangement directions, but difference in opening degree. The organic-matter shrinkage cracks, clay mineral shrinkage cracks, and structural micro-cracks are micro-nano-scale micro-cracks formed due to different causes. According to their structural parameters, these three kinds of cracks are significantly different from each other in morphology, and have relatively random space arrangements. Therefore, they are highly inhomogeneous pores.
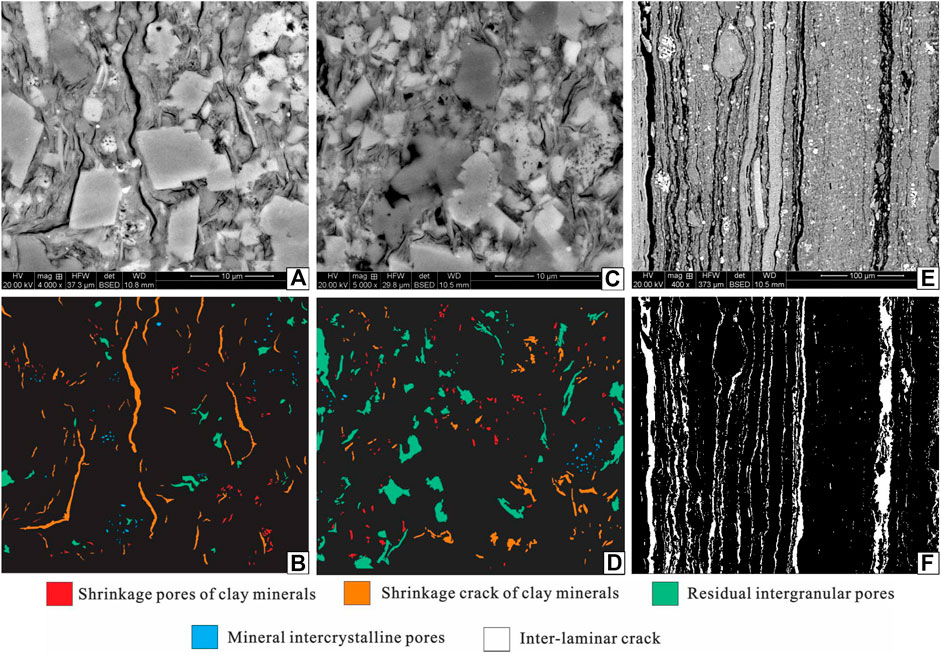
FIGURE 7. SEM images after argon ion polishing and images after Image J processing. (A) Argon ion polishing SEM image of organic-bearing lumpy lime clay rock, showing reservoir space including micro-cracks, clay mineral shrinkage pores, clay mineral intergranular pores, etc., 4,000x, GX27 Well, 2,314.95 m; (B) Image (A) processed with Image J; (C) Argon ion polishing SEM image of organic-bearing lumpy clay micritic limestone, showing reservoir space including interparticle pores, mineral intergranular pores, etc., 5,000x, GX27 Well, 2,315.29 m; (D) Image (C) processed with Image J; (E) Argon ion polishing SEM image of organic-rich laminoid lime clay rock, with extensively developed bedding cracks, 400x, GX27 Well, 2,313.75 m; (F) Image (E) processed with Image J.

TABLE 6. Pore type and structural parameter statistics after SEM observation and Image J processing.
The probability entropy
The fractal dimension
The Feret diameters (Feret-X, Feret-Y, Feret-Max, and Feret-Min adopted based on the general consideration of the pore and crack morphology) and pore areas both obtained after Image J processing were taken as the objects of statistics, and used to plot the pore size distribution histograms and the pore size–pore area proportion histogram (Figure 7). It can be seen that the pore sizes are mainly distributed in the range <400 nm, accounting for more than 80% of the total amount of the pores. Additionally, according to the detailed analysis on the distribution frequency of the pore sizes within 400 nm, the pores of 100–150 nm are the most developed (Figure 8A). In the histograms of pore distribution and pore area proportion, it can be seen that the pores within 400 nm are dominant not only in quantity, but also in pore area proportion. Besides, the pores of 400–600 nm are not absolutely dominant in quantity, but make evident contribution to the pore area. Furthermore, the pores > 2 μm are extremely low in quantity, but their existence takes up a large portion of the pore area according to the high-magnification SEM images. Therefore, the data obtained from the calculation based on the high-magnification SEM images show that the pores > 2 μm also have a high value in the pore area distribution (Figure 8B). Based on the combination of the quantity and pore area proportions, it was concluded that the dominant pore size range which makes evident contribution to the pore area is <600 nm. Meanwhile, the pore size distribution ranges of different types of pores were plotted through the statistics of their data, whereas the final pore area contribution curve (Figure 8C) was obtained by weighted average calculation based on the combination of the development frequency and pore area proportions of different pore types. Among them, the organic-matter pores/cracks, mineral intergranular pores, and clay mineral shrinkage pores/cracks have the pore sizes distributed within the dominant pore size range, and their contributions to the pore area are demonstrated as high values in the broken line chart, especially the contribution from the clay mineral shrinkage pores as high as 21.3%. The bedding cracks do not have pore sizes within the dominant pore size range, but they often exist in groups, providing considerable reservoir space. The residual interparticle pores, organism coelom pores, and boring pores make relatively low contributions to the pore area as they are limited in quantity.
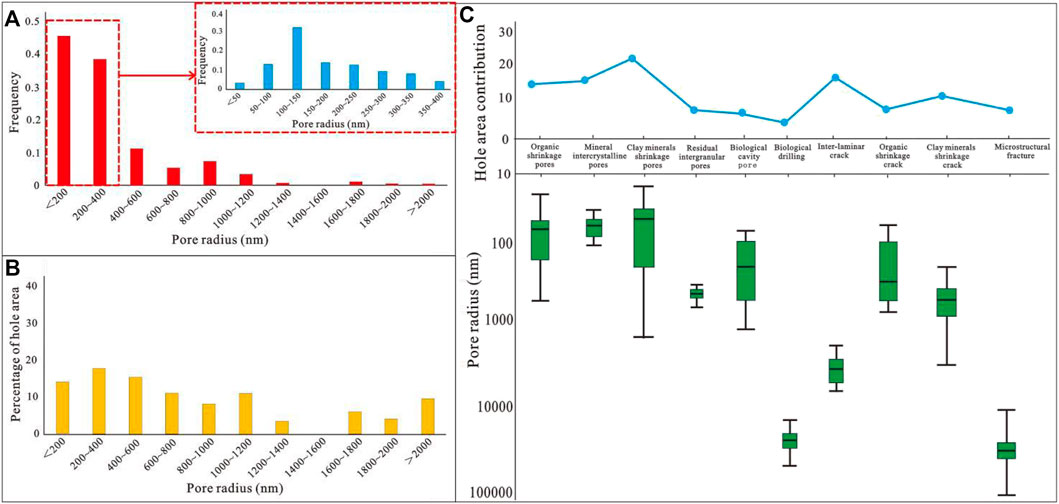
FIGURE 8. Statistics chart of pore sizes and areas based on Image J processing. (A) Histogram of pore size distribution frequency. (B) Histogram of pore size–pore area proportion distribution. (C) Pore size distribution range boxplot and pore area contribution curve of different pore types.
4.2 FSR Reservoir Classification and Evaluation
Petrographic phases are the direct carriers of oil gas reservation as well as the geological indicators for reservoir classification. Meanwhile, porosity and permeability are the direct parameters to embody reservoir characteristics. In addition, different reservoir space types and their pore structure parameters including pore size ranges, morphological factors, fractal dimension, etc. can characterize the micro-structures of various reservoirs more objectively. Therefore, based on the research in the petrographic phases, physical characteristics, pore types, and pore structure characteristics in combination with the dynamic productivity data of the production wells in the study area, the FSR reservoirs in the study area were classified into three types, i.e., Type I, Type II, and Type III, ranked in a descending order from Type I to Type III regarding quality (Table 7).
Type I: The reservoirs of this type are dominated by organic-rich lime shale (Figure 3A) and organic-rich lime clay rock (Figure 3B), and have porosity dominated by nano-scale pores with the average porosity more than 20% and the average permeability as high as 120 mD. Their reservoir space mainly includes organic-matter shrinkage pores/cracks, mineral intergranular pores, bedding cracks, and clay mineral shrinkage pores/cracks. The full pore size distribution curve is mainly Types I and II. The form factor of their pores is in the range of 0.2–0.85 with an average of 0.47, whereas the fractal dimension of their pores is in the range of 1.38–1.80 with an average of 1.59. The reservoirs of this type generally contain rich organic matter and high content of clay minerals, and are often associated with macro-cracks, thus evaluated as high-quality reservoirs. In the study area, the sections of 2,695.7–2,792.1 m in G120 Well, 2,684.5–2,684.0 m in WX119 Well, and 3,000.6–3,150.0 m in N119 Well are typical reservoirs of Type I, with a daily average oil output as high as 40.3 t/d.
Type II: The reservoirs of this type are dominated by organic-rich laminoid clay micritic limestone (Figure 3C) and organic-rich banding lime clay rock (Figure 3E), and have porosity dominated by nano-scale pores. They have poorer physical properties compared with Type I since their porosity is in the range of 5.1–12.3% and their permeability is in the range of 5.58–97.93 mD. Their reservoir space mainly includes mineral intergranular pores and clay mineral shrinkage pores/cracks, plus a few boring pores and organism coelom pores. The full pore size distribution curve is mainly Type I or III. The form factor of their pores is in the range of 0.2–0.71 with an average of 0.56, whereas the fractal dimension of their pores is in the range of 1.43–1.8 with an average of 1.61. Therefore, Type II has higher inhomogeneity than Type I. The reservoirs of this type contain high content of organic matter, with carbonate minerals as the main constituents, thus comprehensively evaluated as above-average-quality reservoirs. In the study area, the sections of 2,745.6–2,790.4 m in G120 Well, 3,141.9–3,240.5 m in N52 Well, 2,896.2–3,000.0 m in G119 Well, and 2,614.8–2,618.3 m in G7 Well are typical reservoirs of Type II, with a daily average oil output as high as 12.5 t/d.
Type III: The reservoirs of this type are dominated by organic-bearing banding clay micritic limestone (Figure 3D) and organic-bearing lumpy clay micritic limestone (Figure 3F), and have porosity dominated by nano-scale pores. Their physical properties are even poorer than those of Type II since their porosity is in the range of 0.5–6.3% and their permeability is generally lower than 2.2 mD. Their reservoir space mainly includes mineral intergranular pores and clay mineral shrinkage pores, with a few residual interparticle pores. The full pore size distribution curve is mainly Type III. The form factor of their pores is in the range of 0.41–0.63 with an average of 0.48, whereas the fractal dimension of their pores is in the range of 1.4–1.75 with an average of 1.65. Therefore, Type III has the highest inhomogeneity among the three types of reservoirs. The reservoirs of this type contain low content of organic matter, with carbonate minerals as the main constituents, thus comprehensively evaluated as poor-quality reservoirs. In the study area, the sections of 1,836.0–1,900.0 m in W667 Well and 2,564.4–2,607.1 m in W108 Well are typical reservoirs of Type III, with a daily average oil output as high as 6.1 t/d.
5 Conclusion
1. The Es4S FSR reservoir of the Chenguanzhuang area in the southern slope of the Dongying Depression contains calcite and clay minerals as the primary mineral constituents, and feldspar, dolomite and pyrite as the secondary mineral constituents, and the rock types in its favorable reservoir are mainly lime shale, lime clay rock, and clay micritic limestone. Based on the sedimentary structures and organic matter content, the reservoir is classified into six types, i.e., organic-rich lime shale, organic-rich laminoid lime clay rock, organic-rich laminoid clay micritic limestone, organic-bearing banding clay micritic limestone, organic-rich banding lime clay rock, and organic-bearing lumpy clay micritic limestone. With the average porosity of 12.3% and average permeability of 10.58 mD, this reservoir is a typical low-porosity and low-permeability reservoir. Besides, it has diverse types of reservoir space, including nano-scale pores such as organic-matter shrinkage pores, mineral intergranular pores and clay mineral shrinkage pores, and micron-scale pores such as residual interparticle pores plus a few organism coelom pores, boring pores, and cracks.
2. The NMR full pore size distribution curves were classified into three types, of which Types I and II are double peak curves and Type III is single-peak curves, with platform sections adjacent to the peak as the typical feature of Type II. According to the results of the curve analysis, the pores with a size less than 2 nm hardly make any contribution to the reservoir space, whereas the main peak of pore volume is attributed to mesopores and macropores, and the secondary peak of pore volume is attributed to macro-cracks. According to the quantitative analysis results based on the argon ion polishing images, the hundred-nano-scale pores, including organic-matter shrinkage pores/cracks, secondary mineral intergranular pores, clay mineral shrinkage pore/cracks, etc., make the main contribution to the reservoir space. Besides, the pores of those types above are relatively homogeneous in their micro-morphology, directional to some extent, widely distributed in large numbers, and have various structural parameters superior to those of other pore types.
3. Based on the research in the petrographic phases, physical characteristics, pore types, and pore structure characteristics in combination with the dynamic productivity data of the production wells in the study area, the FSR reservoirs in the study area were classified into three types. Among them, Type I is dominated by organic-rich lime shale and organic-rich lime clay rock, features the best physical characteristics, and has the reservoir space dominated by organic-matter shrinkage pores/cracks, mineral intergranular pores, bedding cracks, and clay mineral shrinkage pores/cracks. It has the optimal pore structure parameters and the daily average oil output of 40.3 t/d, and thus is the best reservoir type in the study area regarding reservoir characteristics, followed by Type II and then Type III.
Data Availability Statement
The raw data supporting the conclusions of this article will be made available by the authors, without undue reservation.
Author Contributions
All authors listed have made a substantial, direct, and intellectual contribution to the work and approved it for publication.
Funding
This study was funded by the National Science and Technology Major Project of China (2016ZX05050006).
Conflict of Interest
The authors declare that the research was conducted in the absence of any commercial or financial relationships that could be construed as a potential conflict of interest.
Publisher’s Note
All claims expressed in this article are solely those of the authors and do not necessarily represent those of their affiliated organizations, or those of the publisher, the editors and the reviewers. Any product that may be evaluated in this article, or claim that may be made by its manufacturer, is not guaranteed or endorsed by the publisher.
Acknowledgments
We also thank the State Key Laboratory of Oil and Gas Reservoir Geology and Shengli Oilfield Company, SINOPEC, Dongying for providing samples and data, and for permission to publish this work.
References
Chalmers, G., and Bustin, R. (2008). Lower Cretaceous Gas Shales in Northeastern British Columbia, Part II: Evaluation of Regional Potential Gas Resources. Bullentin Can. Pet. Geol. 56 (1), 22–61.
Chalmers, G., Bustin, R., and Power, I. (2012). Characterization of Gas Shale Pore Systems by Porosimetry, Pycnometry, Surface Area, and Field Emission Scanning Electron Microscopy/Transmission Electron Microscopy Image Analyses: Examples from the Barnett, Woodford, Haynesville, Marcellus, and Doig Units. AAPG bulletin 96 (6), 1099–1119.
Clarkson, C. R., Solano, N., Bustin, R. M., Bustin, A. M. M., Chalmers, G. R. L., He, L., et al. (2013). Pore Structure Characterization of North American Shale Gas Reservoirs Using USANS/SANS, Gas Adsorption, and Mercury Intrusion. Fuel 103, 606–616. doi:10.1016/j.fuel.2012.06.119
Curtis, J. B. (2002). Fractured Shale-Gas Systems. AAPG Bull. 86 (11), 1921–1938. doi:10.1306/61eeddbe-173e-11d7-8645000102c1865d
Curtis, M. E., Sondergeld, C. H., Ambrose, R. J., and Rai, C. S. (2012). Microstructural Investigation of Gas Shales in Two and Three Dimensions Using Nanometer-Scale Resolution Imaging. Bulletin 96 (4), 665–677. doi:10.1306/08151110188
Cusack, C., Beeson, J., Stoneburner, D., and Robertson, G. (2010). The Discovery, Reservoir Attributes, and Significance of the Hawkville Field and Eagle Ford Shale Trend, Texas. Gulf Coast Assoc. Geol. Societies Transac-tions. 60, 165–179.
Devarapalli, R., Islam, A., Faisal, T., Sassi, M., and Jouiad, X. (2017). Micro-CT and FIB-SEM Imaging and Pore Structure Characterization of Dolomite Rock at Multiple Scales. Arab. J. Geosci. 10 (16), 1–12.
Dong, Y., Zhu, X., Hua, S., Cheng, K., Yu, X., Li, D., et al. (2011). Genetic Types and Evolutionary Model of Mixed Clastic-Carbonate Deposits in the Lower Part of the Sha-1 Formation, the Huanghua Depression[J]. Oil Gas Geol. 32 (1), 98–107.
Deng, H., Zhou, W., Guo, R., Fu, M., Xie, R., Chen, W., et al. (2014). Pore Structure Characteristics and Control Factors of Carbonate Reservoirs: The Middle-Lower Cretaceous Formation, AI Hardy Cloth Oilfield, Iraq. Acta Petrologica Sinica 30 (3), 801–812. (in Chinese with English abstract). 1000-0569/2014/030(03)-0801-12.
Duan, Y., Xie, J., Li, B., Wang, M., Zhang, T., and Zhou, Y. (2020). Lithology Identification and Reservoir Characteristics of the Mixed Siliciclastic-Carbonate Rocks of the Lower Third Member of the Shahejie Formation in the South of the Laizhouwan Sag, Bohai Bay Basin, China. Carbonates and Evaporites 35, 1–19.
Fan, Z., Hou, J., Xin, D., Ge, X., and Zhang, F. (2018). Core NMR Experiments for Low Permeability Reservoir and its Field Application. J. China Univ. Petroleum(Edition Nat. Science) 43 (1), 53–59. (in Chinese with English abstract). doi:10.3969/j.issn.1673-5005.2019.01.006
Fredrich, J. T., Menéndez, B., and Wong, T.-F. (1995). Imaging the Pore Structure of Geomaterials. Science 268 (5208), 276–279. doi:10.1126/science.268.5208.276
Gao, Z., Wang, X., Li, J., Cui, J., Jin, X., and Zhou, C. (2018). Quantitative Characterization and Distribution of Pore Throat Assemblages of Cretaceous Reservoir in the Kelasu Tectonic Belt, Kuqa Depression. Journal of Petroleum 6, 645–659. (in Chinese with English abstract).
Gao, F. (2021). Influence of Hydraulic Fracturing of strong Roof on Mining-Induced Stress Insight from Numerical Simulation. J. Mining Strata Control. Eng. 3 (2), 023032.
Giffin, S., Littke, R., Klaver, J., and Urai, J. (2013). Application of BIB-SEM Technology to Characterize Macropore Morphology in Coal. Int. J. Coal Geol. 114, 85–95.
Guo, X., Li, Y., Liu, R., and Wang, Q. (2014). Characteristics and Controlling Factors of Micro-pore Structures of Longmaxi Shale Play in the Jiaoshiba Area, Sichuan Basin. Nat. Gas Industry 34 (11), 9–16. (in Chinese with English abstract). doi:10.3787/j.issn.1000-0976.2014.06.002
Hickey, J., and Henk, B. (2007). Lithofacies Summary of the Mississippian Barnett Shale, Mitchell 2 TP Sims Well, Wise County, Texas. AAPG Bullentin 91 (4), 437–443.
Javadpour, F., Moravvej Farshi, M., and Amrein, M. (2012). Atomic-force Microscopy: a New Tool for Gas-Shale Characterization. J. Can. Pet. Technol. 51 (04), 236–243. doi:10.2118/161015-pa
Javadpour, F. (2009). Nanopores and Apparent Permeability of Gas Flow in Mudrocks (Shales and Siltstone). J. Can. Pet. Technol. 48 (08), 16–21. doi:10.2118/09-08-16-da
Jiao, K., Xie, G., Pei, W., Liu, S., Liu, X., Kang, Y., et al. (2019). The Control Factors and Geological Implications of the Nanopore Morphology of the Lower Paleozoic Black Shales in the Sichuan Basin, China. Geol. J. China Univ. 25 (6), 847–859. (in Chinese with English abstract). doi:10.16108/j.issn1006-7493.2019080
Jiao, K., Yao, S., Wu, H., Li, M., and Tang, Z. (2014). Advances in Characterization of Pore System of Gas Shales. Geol. J. China Univ. 20 (1), 151–161. (in Chinese with English abstract). doi:10.16108/j.issn1006-7493.2014.01.009
Lai, J., Wang, G., Fan, Z., Chen, J., Wang, S., Zhou, Z., et al. (2016). Insight into the Pore Structure of Tight Sandstones Using NMR and HPMI Measurements. Energy Fuels 30 (12), 10200–10214. doi:10.1021/acs.energyfuels.6b01982
Li, M., Huo, Y., Luo, J., Chen, J., Luo, X., and Jia, Y. (2016). Burial, Diagenesis, Hydrocarbon Charging Evolution Process and Quantitative Analysis of Porosityevolution: A Case Study from He 8 Tight Sand Gas Reservoir of the Upper Paleozoic in EasternOrdos Basin. Oil and Gas Geology 37 (6), 882–892. (in Chinese with English abstract).
Li, S., Zhu, H., Liang, J., Du, X., Wang, Q., Yao, T., et al. (2021). Mixed Siliciclastic-Carbonate Deposition and Cyclical Evolution of the Upper Shahejie Formation and its Impact on Reservoir Development in the Eocene Huanghekou Sag, Bohai Bay Basin, East China. Interpretation 9 (2), SC17–SC30. doi:10.1190/int-2020-0171.1
Li, W., Zhu, X., Liu, Q., Zhu, S., and Li, H. (2021). Lacustrine Mixed Siliciclastic-Carbonate Sedimentary Rocks in the Paleogene Funing Formation of the Subei Basin, Eastern China: Characteristics and Origin. Interpretation 9 (2), SC1–SC16. doi:10.1190/int-2020-0088.1
Liu, C., Shi, B., Zhou, J., and Tang, C. (2011). Quantification and Characterization of Microporosity by Image Processing, Geometric Measurement and Statistical Methods: Application on SEM Images of clay Materials. Appl. Clay Sci. 54 (1), 97–106. doi:10.1016/j.clay.2011.07.022
Liu, H., Wang, Y., Yang, Y., and Zhang, S. (2020). Sedimentary Environment and Lithofacies of fine-grained Hybrid Sedimentary in Dongying Sag: A Case of fine-grained Sedimentary System of the Es4. Earth Sci. 45 (10), 3543–3555. (in Chinese with English abstract). doi:10.3799/dqkx.2020.156
Loucks, R. G., Reed, R. M., Ruppel, S. C., and Hammes, U. (2012). Spectrum of Pore Types and Networks in Mudrocks and a Descriptive Classification for Matrix-Related Mudrock Pores. Bulletin 96 (6), 1071–1098. doi:10.1306/08171111061
Loucks, R. G., Reed, R. M., Ruppel, S. C., and Jarvie, D. M. (2009). Morphology, Genesis, and Distribution of Nanometer-Scale Pores in Siliceous Mudstones of the Mississippian Barnett Shale. J. Sediment. Res. 79 (12), 848–861. doi:10.2110/jsr.2009.092
Ma, Y., Liu, H., Zhang, S., Lu, Y., and Liu, X. (2020). Types of Fine-Grained Mixed Sedimentary Rocks of Shanejie Formation and Evolution of Lake Basin in Jiyang Depression, Eastern China. J. Earth Sci. 45 (10), 3633–3644. (in Chinese with English abstract). doi:10.3799/dqkx.2020.192
Mastalerz, M., Schimmelmann, A., Drobniak, A., and Chen, Y. (2020). Porosity of Devonian and Mississippian New Albany Shale Across a Maturation Gradient: Insights from Organic Petrology, Gas Adsorption, and Mercury Intrusion. AAPG Bulletin 97 (10), 1621–1643.
Milliken, K., Esch, W., Reed, R., and Zhang, T. (2012). Grain Assemblages and Strong Diagenetic Overprinting in Siliceous Mudrocks, Barnett Shale (Mississippian), Fort Worth Basin, Texas. AAPG Bulletin 96 (8), 1553–1578.
Ning, F., Wang, X., Hao, X., Yang, W., Yin, Y., Ding, J., et al. (2017). Occurrence Mechanism of Shale Oil with Different Lithofacies in Jiyang Depression. ACTE PETROLEI SINICA 38 (2), 185–195. (in Chinese with English abstract). doi:10.11698/PED.2019.04.19
Pan, Y., Huang, Z., Li, T., Xu, X., Chen, X., and Guo, X. (2021). Pore Structure Characteristics and Evaluation of Lacustrine Mixed fine-grained Sedimentary Rocks: A Case Study of the Lucaogou Formation in the Malang Sag, Santanghu Basin, Western China. J. Pet. Sci. Eng. 201, 108545. doi:10.1016/j.petrol.2021.108545
Peng, J., Zeng, Y., Yang, Y., Yu, L., and Xu, T. (2022). Discussion on Classification and Naming Scheme of fine-grained Sedimentary Rocks. Pet. Exploration Develop. 49 (1), 106–115. doi:10.1016/s1876-3804(22)60009-0
Song, Z., Chen, Y., Du, X., Wang, Q., and Wang, X. (2013). Study on Sedimentary Characteristics and Reservoir of Second Member of Shanhejie Formation, A Structural Area, Bohai Sea. Offshore Oil (04), 13–18. (in Chinese with English abstract).
Wang, J., Zhang, C., Zheng, D., Song, W., and Ji, X. (2020). Stability Analysis of Roof in Goaf Considering Time Effect. J. Min Strat Control. Eng. 2 (1), 013011. doi:10.13532/j.jmsce.cn10-1638/td.2020.01.005
Wang, L., Fu, Y., Li, J., Sima, L., Wu, Q., Jin, W., et al. (2017). Experimental Study on the Wettability of Longmaxi Gas Shale from Jiaoshiba Gas Field, Sichuan Basin, China. J. Pet. Sci. Eng. 151, 488–495. doi:10.1016/j.petrol.2017.01.036
Wu, X., Gao, B., Ye, x., Bian, R., Nie, H., and Lu, F. (2013). Shale Oil Accumulationconditions and Exploration Potential of Faulted Basinsin the East of China. Oil &.Gas Geology. 34 (4), 455–462. (in Chinese with English abstract). doi:10.11743/ogg20130405
Xie, X., Ye, M., Xu, C., Du, X., and Du, X. B. (2018). High Quality Reservoirs Characteristics and Forming Mechanisms of Mixed Siliciclastic-Carbonate Sediments in the Bozhong Sag, Bohai Bay Basin. Earth Sci. 43 (10), 3526–3539. (in Chinese with English abstract). doi:10.11764/j.issn.1672-1926.2015.01.0001
Yang, T., Cao, Y., Wang, Y., Zhang, S., Zhang, H., and Wang, S. (2016). Effectiveness Evaluation of Low Permeability Turbidite Reservoirs in the Middle of the Third Member of Shahejie Formation in Dongying Sag. J. China Univ. Petroleum(Edition Nat. Science) 40 (4), 1–11. (in Chinese with English abstract). doi:10.3969/j.issn.1673-5005.2016.04.001
Yang, Y., Peng, J., Chen, Z., Zhou, X., Yao, Y., and Wang, Y. (2022). Sedimentary Models of Deep-Water Gravity-Flow in Lacustrine Basin and its Petroleum Geological Significance-Aa Case Study of Chang 6 Oil Reservoir Group in Heshui Area, Ordos Basin, China. Front. Earth Sci., 1262. doi:10.3389/feart.2021.786403
Yao, X., Fan, Y., and Sun, Z. (2011). Trilinear-Flow Well Test Model of Fractured Horizontal Well in Low Permeability Reservoir. Oil and Gas Well Testing 5 (05), 1–5+75. (in Chinese with English abstract).
Yu, X., Bian, J., and Liu, C. (2022). Determination of Energy Release Parameters of Hydraulic Fracturing Roof Near Goaf Based on Surrounding Rock Control of Dynamic Pressure Roadway. J. Mining Strata Control. Eng. 4 (1), 013016. doi:10.13532/j.jmsce.cn10-1638/td.20210908.001
Zeng, H., Wang, F., Luo, J., Tao, T., and Wu, S. (2021). Characteristics of Pore Structure of Intersalt Shale Oil Reservoir by Low Tempera-Ture Nitrogen Adsorption and High Pressure Mercury Pressure Methods in Qianjiang SagL. Bull. Geol. Sci. Technol. 40 (5), 242–252. (in Chinese with English abstract). doi:10.19509/j.cnki.dzkq.2021.0022
Zeng, X., Wang, Y., Yu, J., Wu, S., Zhong, M., Xu, S., et al. (2011). Coal Pyrolysis in a Fluidized Bed for Adapting to a Two-Stage Gasification Process. Energy Fuels 25 (3), 1092–1098. doi:10.1021/ef101441j
Zhang, J., Liu, G., Cao, Z., Tao, S., Felix, M., Kong, Y., et al. (2019). Characteristics and Formation Mechanism of Multi-Source Mixed Sedimentary Rocks in a saline lake, a Case Study of the Permian Lucaogou Formation in the Jimusaer Sag, Northwest China. Mar. Pet. Geology. 102, 704–724. doi:10.1016/j.marpetgeo.2019.01.016
Zhang, K., Jia, C., Song, Y., Jiang, S., Jiang, Z., Wen, M., et al. (2020a11597). Analysis of Lower Cambrian Shale Gas Composition, Source and Accumulation Pattern in Different Tectonic Backgrounds: a Case Study of Weiyuan Block in the Upper Yangtze Region and Xiuwu Basin in the Lower Yangtze Region. Fuel 263. doi:10.1016/j.fuel.2019.115978
Zhang, K., Jiang, S., Zhao, R., Wang, P., Jia, C., and Song, Y. (2022). Connectivity of Organic Matter Pores in the Lower Silurian Longmaxi Formation Shale, Sichuan Basin, Southern China: Analyses from Helium Ion Microscope and Focused Ion Beam Scanning Electron Microscope. Geol. J., 1–13. doi:10.1002/gj.4387
Zhang, K., Peng, J., Liu, W., Li, B., Xia, Q., Cheng, S., et al. (2020b). The Role of Deep Geofluids in the Enrichment of Sedimentary Organic Matter: a Case Study of the Late Ordovician-Early Silurian in the Upper Yangtze Region and Early Cambrian in the Lower Yangtze Region, South China. Geofluids 2020, 8868638. doi:10.1155/2020/8868638
Zhang, K., Peng, J., Wang, X., Jiang, Z., Song, Y., Jiang, L., et al. (2020c). Effect of Organic Maturity on Shale Gas Genesis and Pores Development: a Case Study on marine Shale in the Upper Yangtze Region, South China. Open Geosciences 12 (1), 1617–1629. doi:10.1515/geo-2020-0216
Zhang, L., Li, J., Li, Z., Zhang, J., Zhu, R., and Bao, Y. (2014). Advances in Shaleoil/Gas Research in North America and Considerationson Exploration for continental Shale Oil/gas in China. Adv. Earth Sci. 29 (6), 700–711. (in Chinese with English abstract). doi:10.11867/j.issn.1001-8166.2014.06.0700
Keywords: Bohai Bay Basin, Shahejie formation, fine-grained sedimentary rocks, pore structure, reservoir capabilities
Citation: Yang Y, Peng J, Xu T, Wang Y and Zeng Y (2022) Characterization, Classification, and Evaluation of the Reservoir Pore Structure Features of Lacustrine Fine-Grained Sedimentary Rocks. A Case Study of the Fourth Member of the Shahejie Formation in the Chenguanzhuang Area of the Southern Gently Sloping Zone of the Dongying Depression, Bohai Bay Basin. Front. Earth Sci. 10:878089. doi: 10.3389/feart.2022.878089
Received: 17 February 2022; Accepted: 03 March 2022;
Published: 24 March 2022.
Edited by:
Shu Jiang, The University of Utah, United StatesReviewed by:
Zhaobing Chen, Xi’an Shiyou University, ChinaChen Zhang, Chengdu University of Technology, China
Tingwei Li, Guangzhou Marine Geological Survey, China
Copyright © 2022 Yang, Peng, Xu, Wang and Zeng. This is an open-access article distributed under the terms of the Creative Commons Attribution License (CC BY). The use, distribution or reproduction in other forums is permitted, provided the original author(s) and the copyright owner(s) are credited and that the original publication in this journal is cited, in accordance with accepted academic practice. No use, distribution or reproduction is permitted which does not comply with these terms.
*Correspondence: Jun Peng, cGVuZ2p1bkBzd3B1LmVkdS5jbg==
 Yiming Yang
 Jun Peng*
