- 1Faculty of Engineering and Physical Sciences, University of Southampton, Southampton, United Kingdom
- 2National Oceanography Centre, Southampton, United Kingdom
- 3Diamond Light Source, Didcot, United Kingdom
Gas bubble in aquatic sediments has a significant effect on its geophysical and geomechanical properties. Recent studies have shown that methane gas and hydrate can coexist in gas hydrate–bearing sediments. Accurate calibration and understanding of the fundamental processes regarding such coexisting gas bubble dynamics is essential for geophysical characterization and hazard mitigation. We conducted high-resolution synchrotron imaging of methane hydrate formation from methane gas in water-saturated sand. While previous hydrate synchrotron imaging has focused on hydrate evolution, here we focus on the gas bubble dynamics. We used a novel semantic segmentation technique based on convolutional neural networks to observe bubble dynamics before and during hydrate formation. Our results show that bubbles change shape and size even before hydrate formation. Hydrate forms on the outer surface of the bubbles, leading to reduction in bubble size, connectivity of bubbles, and the development of nano-to micro-sized bubbles. Interestingly, methane gas bubble size does not monotonously decrease with hydrate formation; rather, we observe some bubbles being completely used up during hydrate formation, while bubbles originate from hydrates in other parts. This indicates the dynamic nature of gas and hydrate formation. We also used an effective medium model including gas bubble resonance effects to study how these bubble sizes affect the geophysical properties. Gas bubble resonance modeling for field or experimental data generally considers an average or equivalent bubble size. We use synchrotron imaging data to extract individual gas bubble volumes and equivalent spherical radii from the segmented images and implement this into the rock physics model. Our modeling results show that using actual bubble size distribution has a different effect on the geophysical properties compared to the using mean and median bubble size distributions. Our imaging and modeling studies show that the existence of these small gas bubbles of a specific size range, compared to a bigger bubble of equivalent volume, may give rise to significant uncertainties in the geophysical inversion of gas quantification.
Introduction
The presence of gas bubbles in aquatic (underwater) sediment pores affects both geomechanical and geophysical properties of the sediment (Sills et al., 1991; Best et al., 2004; Lee, 2004; Zheng et al., 2017). The presence of gas bubbles in pore space considerably reduces the sound speed (Sills et al., 1991; Kumar and Madhusudhan, 2012) and increases the attenuation (Best et al., 2004), in comparison to a fully water-saturated sediment state.
Hydrate is an ice-like solid comprising a hydrogen-bonded water lattice with trapped gas molecules that occurs within a pressure–temperature stability zone in seafloor sediments (Kvenvolden, 1993). Remote geophysics is used to quantify seafloor methane hydrates over large (km2) areas. Typically, these methods use models where the seismic velocity (e.g., Schnurle et al., 2004; Lee and Collett, 2006; Fohrmann and Pecher, 2012) and electrical resistivity (e.g., Weitemeyer et al., 2006; Schwalenberg et al., 2010; Hsu et al., 2014) increase in relation to hydrate replacement within saline water in sediment pore space. However, accurate quantification of methane hydrate saturation is hindered by uncertainties in the relationship between geophysical parameters and hydrate content (e.g., Schnurle et al., 2004; Lee and Collett, 2008; Hsu et al., 2014; Goswami et al., 2015). Hence, the estimates from geophysical data result in uncertainty of the carbon inventory stored in hydrate and resulting assessments of well stability and methane production from hydrate reservoirs (Sahoo et al., 2018a).
The hydrate content is estimated by correlating the electrical resistivity increase in the hydrate stability zone in comparison to background sediments with no hydrates (e.g., Weitemeyer et al., 2006; Lee and Collett, 2008; Schwalenberg et al., 2010; Hsu et al., 2014). This method would not differentiate between hydrate and gas, although they both have greater resistivity in comparison to saline pore fluid (Lee and Collet, 2008). An increase in gas content reduces sound speed, whereas an increase in hydrate content increases sound speed (Sills et al., 1991; Guerin et al., 1999; Fohrmann and Pecher, 2012). Due to the strong effect of gas presence on sound speed, even small amounts of gas hinder the p-wave-hydrate content estimation models.
The co-existence of gas can also be under two-phase water-hydrate stability conditions, as identified in field studies on characterizing gas hydrate–bearing sediments such as Guerin et al. (1999) from Blake Ridge and Paganoni et al. (2016) from NW Borneo. Two types of co-existing gas with hydrate and water in pore space have been identified by many research works (Suess et al., 2001; Milkov et al., 2004; Schicks et al., 2006; Chaouachi et al., 2015; Yang et al., 2016; Sahoo et al., 2018b), which are 1) connected (pore network) and 2) disconnected (individual bubbles) within the pore space. The disconnected bubbles may remain in the hydrate or could have been still present, where hydrate formation is not yet completed (Schicks et al., 2006). On the other hand, hydrate formation can block contacts between gas and water within sediment pores and form pockets of gas (which could include several pores, e.g., Chaouachi et al., 2015; Yang et al., 2016). The trapped gas bubbles may be consumed by the surrounding pore fluid over time by diffusion; however, in a dynamic pore fluid system with gas production, diffusion is unlikely to dominate due to its relatively slow rate (Suesset al., 2001; Milkov et al., 2004). Studies on kinetic modeling of hydrate formation and dissociation in porous media conclude that the hydrate may never achieve equilibrium due to the three-phase system (e.g., Vafaei et al., 2014). Accurate calibration and understanding of the fundamental processes regarding such coexisting gas bubble dynamics is, thus, essential for geophysical characterization and hazard mitigation. This study presents the results from high-resolution synchrotron imaging of methane hydrate formation and dissociation experiments in porous media. Here, we imaged and analyzed the gas, hydrate, and brine phase changes with the specimen. Particular attention was given to gas bubble dynamics, in terms of its shape and distribution during hydrate formation and dissociation stages. We used an effective medium rock physics model (Marín-Moreno et al., 2017) to study the gas bubble size and distribution effect on the geophysical properties during hydrate formation and dissociation stages.
Methodology
We conducted high-resolution synchrotron imaging to capture gas bubble dynamics during methane hydrate formation, using a miniature cylindrical hydrate rig (Sahoo et al., 2018b). The rig dimensions were 2 mm internal diameter, 0.8 mm wall thickness, and 10 mm sample scan height (23 mm total height). The pore pressure port at the bottom was used to apply methane/brine pore pressure (Figure 1A). The process of formation and dissociation of gas hydrate in sand was imaged using synchrotron X-ray computed tomography (XCT) at beamline I13-2, Diamond Light Source, United Kingdom. The distance between the specimen and detector, exposure time, and beam energy were optimized initially by trial scans. It was found that beam energy of 30 keV and exposure periods between 30 and 200 ms were optimum for the scans. We used x4 and x10 optical objectives after trial runs to obtain images at 0.650 and 0.325 μm resolution, respectively. The schematic of the rig is presented in Figure 1A along with the temperature control and measurement system (Figure 1B).
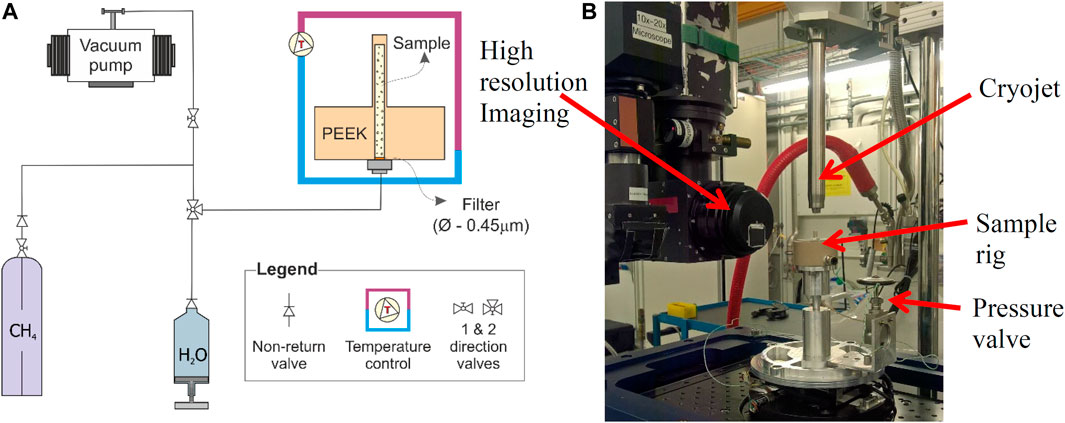
FIGURE 1. (A) Schematic of the experimental setup; (B) Photograph of the experimental setup at Diamond Light Source, United Kingdom.
Leighton Buzzard E sand (d50 = 100 μm) was weighed and tamped directly into a cylindrical hydrate rig (2 mm diameter and 23 mm height) to obtain a sample of 35% porosity. A vacuum of 1 Pa was applied to the sample to remove as much air as possible from the pore space. Brine (3.5 wt% NaCl solution in deionized and de-aerated water) was injected to partially fill the sample pore space, following the method of Waite et al. (2009), with a high (>83%) initial brine saturation. This method allows excess water condition (Ellis, 2008; Priest et al., 2009). The sample was left for 3 days so that the pore fluids could re-distribute throughout the sample by capillary action. The remaining pore space (∼17%), which was previously under vacuum, may have been occupied by water vapor and/or remaining air. Our hydrate formation method and experimental setup represent gas hydrate systems with localized gas flow, such as the base of the GHSZ or near gas chimneys. Methane gas of 10 MPa was then applied to the bottom of the rig, and the valve was closed before the start of the hydrate formation stage. Hydrate was formed by reducing the temperature to 1°C using a cryojet stream applied at the top of the rig (Figure 1B) and a thermistor at the bottom of the specimen. The synchrotron rig was scanned every 2–3 h to image the hydrate formation in the pore space. Hydrate dissociation was then performed by initially reducing the temperature to −2.0°C and then slowly increasing the temperature to 3.0°C till the specimen is out of the hydrate pressure–temperature boundary. The scans were performed every 15–20 min during the dissociation stage. After the trial scans, the in situ XCT data were collected using a polychromatic “pink beam” at 30 keV peak energy. The detector system used was a scintillator-coupled pco.edge 5.5 camera fitted with a x4 optic magnification lens, resulting in an effective pixel size of 0.8125 μm. The detector was placed at 6.5 mm behind the sample. The X-ray projection size was 2560 wide by 2160 pixels high. Reconstruction, segmentation, and isolation of gas bubbles were observed during methane hydrate formation.
Reconstruction of CT Scans
X-ray projections were reconstructed using Savu 2.4 (Atwood et al., 2015; Wadeson and Basham, 2016). The reconstruction resulted in 3D volumes consisting of 2650 × 2560 × 2000 voxels, as 80 slices each from the top and bottom were discarded due to the presence of distortion artifacts produced by reduced beam intensity in these regions. Figure 2 shows a 3D reconstructed image of the specimen after 3 h after initiation of hydrate formation.
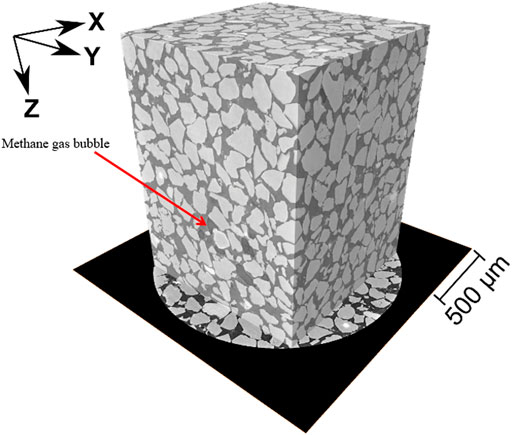
FIGURE 2. 3D reconstructed CT scan image of sand with pore space filled with brine and methane gas after 3 h of initiating hydrate formation.
Segmentation of CT Scans
As seen in Figure 2, it is important to identify the grayscale contrast between the four phases of the specimen, that is, methane gas, sand, brine, and gas hydrates. We used a novel semantic segmentation technique based on convolutional neural networks (CNNs) to observe bubble dynamics before and during hydrate formation (Alvarez-Borges et al., 2021). This methodology involved training U-Nets, a class of CNNs, to create models that could classify the synchrotron XCT data into three different phases: 1) sand, 2) brine + hydrates, and 3) methane gas. We used RootPainter (Smith et al., 2020) to perform this.
RootPainter is a client-server application that uses a graphical user interface (GUI) and interactive corrections to train a binary 2D U-Net model. The procedure involved, for each XCT volume, is the hand-annotation of 50 random XY slices using the GUI. From these, the software used 40 slices to train the model and 10 slices as the validation dataset to assess model accuracy at the end of each training cycle (or ‘epoch’) using the F-score parameter (F1). At the conclusion of each training epoch, the F1 number for the current and previous epochs was compared, and the associated model with the highest F1 was saved. This was repeated until 60 consecutive epochs were completed without improvements in F1. This led to minimum F1 values of approximately 0.98 and a single U-Net segmentation model per scan.
F1 is defined as (Smith et al., 2020) as follows:
where TP, FP, and FN are the number of true positive, false positive, and false negative pixel U-Net predictions, respectively, in each case.
The U-Net models were then used to segment a 1554 × 1554 × 2000 region of the original reconstructed volumes, therefore isolating the sand, brine + hydrate, and methane gas present in the image. This region was inscribed within the cylindrical field of view of the original volumes and omitted the dark black background generated during reconstruction. This was carried out to optimize computing time by reducing both the size of the 3D image and the number of labels required for annotation and prediction.
Table 1 presents the selected scans from the start of the hydrate formation stage that was processed to isolate the gas bubbles within the pore space. The temperature was maintained constant at 1°C throughout the hydrate formation stage. The porosity and the methane (CH4) gas content were calculated using the pore size distribution and methane gas in the specimen from the segmented volumes using Eqs. 1, 2, respectively.
Alvarez-Borges et al. (2021) found that the mean absolute errors for porosity and methane gas saturation measurements derived from these same XCT volumes segmented using this approach were below 1% and 0.05%, respectively. A detailed description of the implementation of this technique is given by these authors.
The segmented gas bubbles rendered using Avizo software during each selected time stamp of the hydrate formation stage are presented in Figure 3. Initially the gas within the pore space appears as a pipe-like structure, which may be due to an initial interconnected gas network that might have formed during the high pressure (10 MPa) gas injection before the hydrate formation process was initiated. As the hydrate begins to form in the pore space, the methane gas is consumed and the bubble size reduces from millimeter scale to micron and nano scale. Also, at the end of the hydrate formation, which was determined from our previous work by Sahoo et al. (2018b), methane gas still exists in the pore space, which is trapped within the newly formed hydrate pore structure. The coexistence of hydrate, brine, and gas in hydrate structure has been reported by many research works and our own work (Suess et al., 2001; Milkov et al., 2004; Schicks et al., 2006; Chaouachi et al., 2015; Yang et al., 2016; Sahoo et al., 2018b).
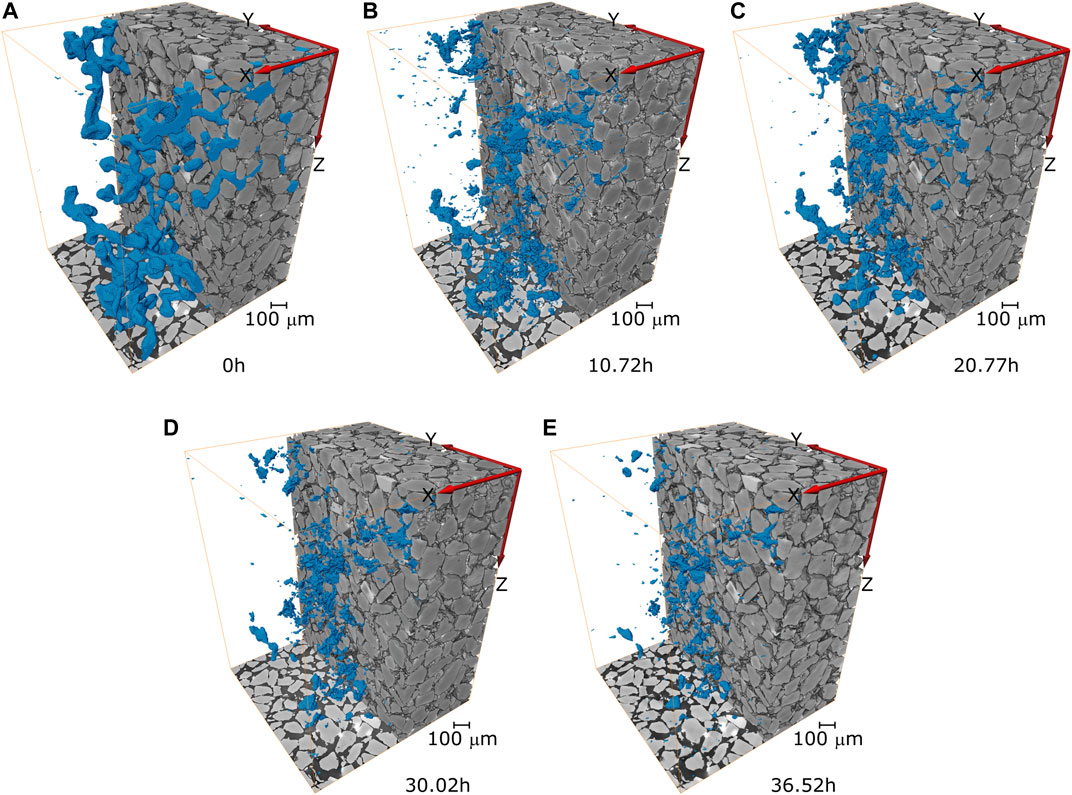
FIGURE 3. Segmented 3D reconstructed CT scan of the specimen showing the gas bubble distribution within the pore space during hydrate formation (A) 0 h, (B)10.2 h, (C) 20.77 h, (D) 30.02 h, and (E) 36.25 h after initiating the hydrate formation process.
Table 2 similarly presents the selected scans during the process of the hydrate dissociation stage that was processed to isolate the gas bubbles within the pore space. Figure 4 presents the segmented gas bubbles rendered using Avizo software during each selected time stamp of the hydrate dissociation stage. Initially, the volume of the gas trapped in the hydrate structure, which was never consumed during the hydrate formation stage, appears to be well-distributed within the specimen. Thereafter, as temperature increases and hydrates begin to dissociate within the pore space, the methane bubble increases in size very quickly. At the final scan, where the dissociation was complete, the methane bubbles seem to be well-distributed in the specimen. In comparison to the gas bubble size and distribution before formation, the gas bubble seems to be well-distributed and consistent after the completion of the gas hydrate dissociation.
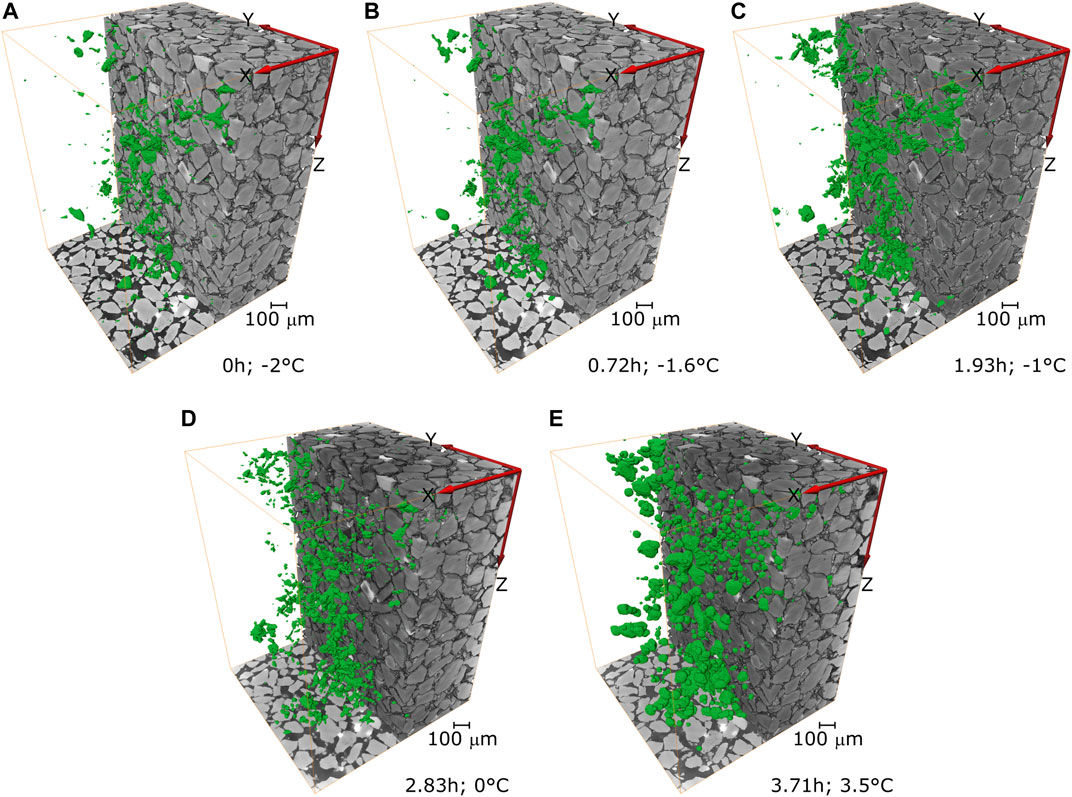
FIGURE 4. Segmented 3D reconstructed CT scan of the specimen showing the gas bubble distribution within the pore space during hydrate dissociation (A) 0 h, (B)0.72 h, (C) 1.93 h, (D) 2.83 h, and (E) 3.71 h after initiating the hydrate formation process.
Analysis of Gas Bubble Dynamics During Hydrate Formation and Dissociation Stages
The shape of the individual methane gas bubble within the pore space was analyzed by calculating spheres of the same volume as that of each bubble and thereafter determining the diameter of said spheres. In this way, an equivalent spherical diameter was derived for each individual bubble. This enabled the quantification of the gas bubble size distribution in each specimen and the observation of changes in bubble size during hydrate formation and dissociation. Figure 5 shows the bubble size distribution within the specimen pore space during the hydrate formation stage at time stamp 0, 10.72,, and 20.77 h. Initially, at the start of hydrate formation (0 h), due to the presence of large pipe-shaped bubbles (see Figure 3A), 60% of the bubbles are greater than 300 μm average size. Due to the formation of the hydrate, a large amount of gas is consumed, and hence less than 5% bubbles are greater than 300 μm. As hydrate formation continues, the bubble size analysis of t = 10.72 h shows good distribution from sizes 100 to 6 μm. This further evolves into a reduction in bubble size variability (homogenization of bubble size distribution) as seen from the analysis of specimen from scan after t-20.77 h.
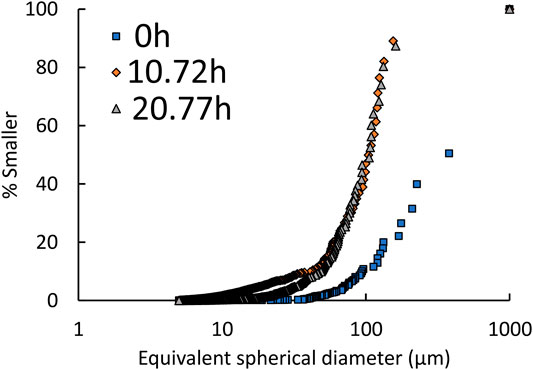
FIGURE 5. Evolution of bubble size distribution within the pore space of the specimen during the hydrate formation stage.
The porosity, methane gas saturation, and average bubble size of the specimen during hydrate formation and dissociation are obtained from the analysis of pores and methane bubbles from the scans. The porosity of the specimen reduces significantly at the initial hydrate formation stage, probably due to particle rearrangement as a result of the consumption of large volumes of methane as shown in Figure 6. This slightly densifies the specimen and is an irrecoverable change as the analysis from the dissociation stage indicates no change in porosity as methane gas is released back into the pore space. As expected, methane saturation reduces with the hydrate formation (Figure 7), but even after complete formation (t > 30 h), at least 1% methane is still trapped within the hydrate structure. The average bubble size (d50) dramatically drops at the initial hydrate formation stage; thereafter, there is a small change in average bubble size till completion of hydrate formation.
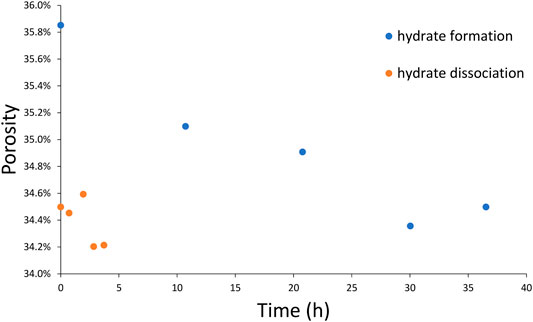
FIGURE 6. Result of porosity from the analyzed scans during hydrate formation and dissociation stages. Irrecoverable densification of the specimen was observed due to methane gas consumption for hydrate formation.
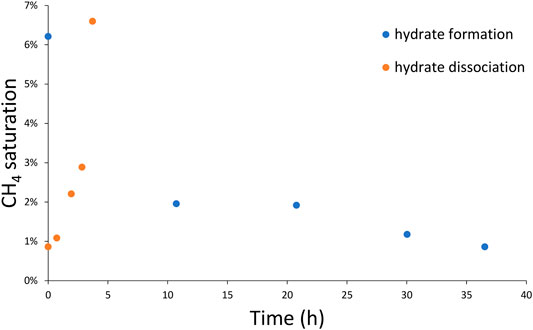
FIGURE 7. Methane gas consumption and expulsion with time during hydrate formation and dissociation stage.
Effective Medium Rock Physics Model Using Bubble Resonance
The presence of gas bubbles affects the geophysical properties of sediments. The extent or magnitude of this effect on the velocity of P and S waves depends on the gas bubble size and concentration (e.g., Marín-Moreno et al., 2017). We used an effective medium rock physics model to observe how the gas bubble size affects the geophysical properties. We used the hydrate-bearing effective sediment (HBES) model (Marín-Moreno et al., 2017) which is a development from the (Hydrate Effective Grain) model of Best et al. (2013). Our model accounts for the inertial fluid flow between different components of the system and gas bubble resonance (Figure 8). HBES also considers the effect of squirt flow in 1) inclusions in hydrates and 2) different aspect ratio pores created by hydrates. The over-reaching idea in this model is that hydrate-bearing porous medium is an effective medium of porous media (sediment) with solid hydrate and fluid in the pore space. The pore fluid comprises gas and liquid. The gas bubbles can give rise to resonance, modeled according to Smeulders and van Dongen (1997). Hydrate can have gas or liquid inclusions that can give rise to viscous (squirt) flow between these inclusions and pore fluid when an elastic wave passes through this effective medium, creating a pressure gradient. The hydrate formation in the pore space changes the aspect ratio of the pores, and squirt flow can occur between these newly formed hydrate and pore fluid. The squirt flow element is embedded in the Biot–Stoll global fluid flow model (Biot, 1956b; 1956a). This model uses different hydrate morphologies (cementing, pore-floating, and pore-bridging) as described by Ecker et al. (1998) and Helgerud et al. (1999), using model concepts developed by Leurer and Brown (2008) and Leurer (1997) for clay-squirt flow attenuation in marine sediments. We have used pore-bridging or load-bearing hydrate morphology as it is the most commonly occurring hydrate morphology in nature (e.g., Waite et al., 2009; Spangenberg et al., 2015). We have not used squirt flow due to inclusions in this study as we are interested in looking at the effect of gas bubbles. So, we have plotted the results as a change in velocity instead of absolute velocity, helping us to see how changes in gas bubble size affect the velocity. This model is explained in detail in Sahoo et al. (2018b). The input parameters used in the model are listed in Table 3.
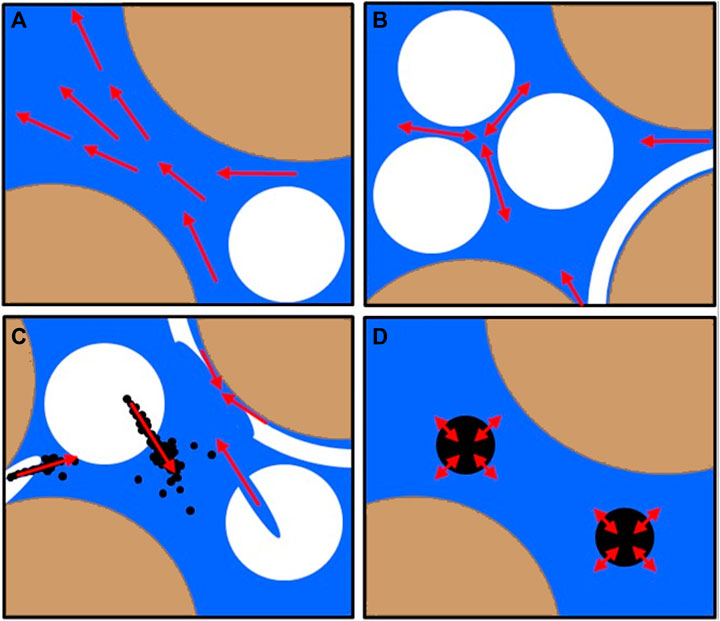
FIGURE 8. Conceptual model (Marín-Moreno et al., 2017) to examine the effect of methane hydrate (white) and gas (black) on the geophysical properties of brine (blue)-saturated sediment (yellow). (A) Biot’s type inertial fluid flow, (B) micro squirt flow, (C) sub-micro squirt flow due to inclusions of gas and water in hydrates, and (D) gas bubble resonance. Marín-Moreno et al. (2017).
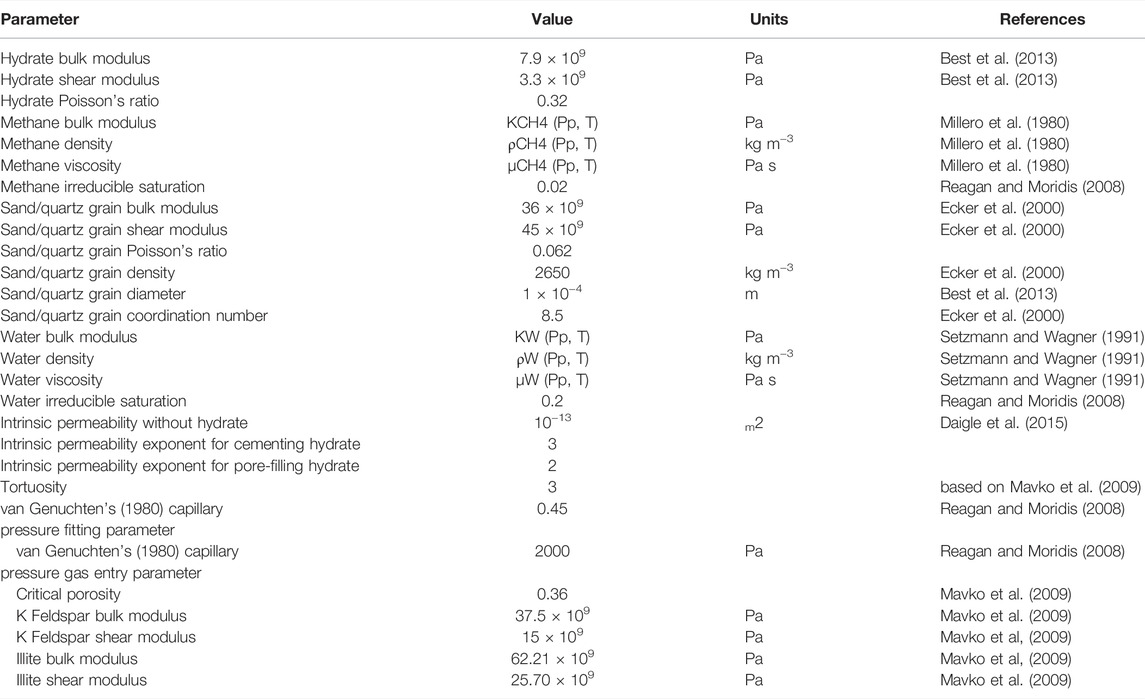
TABLE 3. Values used in the HBES model runs (Marín-Moreno et al., 2017).
Simulations were carried out to examine the effect of bubble size and distribution based on the results from the 3D image analysis of gas bubbles imaged during hydrate formation. The hydrate content increase with hydrate formation time was obtained from the synchrotron scans as described by Sahoo et al. (2018b). Using the hydrate content, the initial run was carried out assuming no gas was present in the hydrate structure. Thereafter, gas bubbles were introduced in the simulations in the following five different cases, and these were as follows: 1) uniform bubble size = 10 μm; 2) uniform bubble size = 100 μm; 3) uniform bubble size = d50 from Figure 9 for each hydrate content. 4) Uniform mean (or average) bubble size = dA from bubble size distribution plots as shown in Figure 5; 5) bubble size distribution from Figure 5 obtained for each hydrate content. The model runs on uniform bubble sizes 10 and 100 μm are carried out to cover the upper and lower bound limits of bubble sizes, whereas the d50 and dA use the mid-size and the average (or mean) size from bubble distribution. However, the ‘distribution’ run considered all the bubble sizes and distribution for the simulation. We grouped bubbles in bin size of 5 μm. We then calculated how much volume each of these bin-sized bubbles occupies. We used the mean bubble size of each bin (2.5 μm for a bin of 0–5 μm) and saturation of this bin (volume of this bin size bubbles/total pore volume) in the rock physics model to calculate velocity. Thereafter, we plot relative velocity for each bin size, defined as velocity with calculated hydrate saturation with no gas velocity with same hydrate saturation and gas saturation of this bin. We then added these relative velocities for each bin size to obtain the total effect of all the gas bubbles. Figures 10, 11 present comparative relative velocity change of P and S waves when gas bubbles of a given size are present compared to when no gas is present. We plot ΔVp and ΔVs, that is, V at a given gas saturation minus V at zero gas saturation. The bubble size and distribution play a significant role in the accurate determination of wave velocities. Variation of bubble size (uniform) from 100 to 10 μm has a significant effect on the wave velocities.
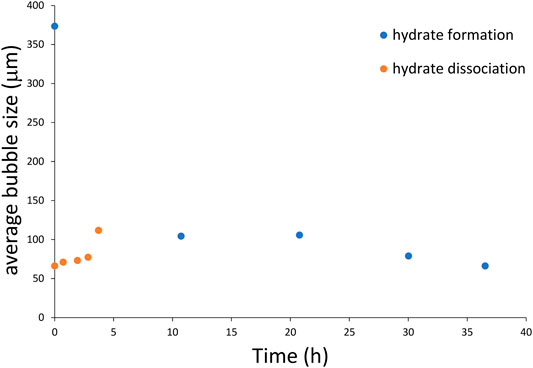
FIGURE 9. Average bubble size (d50) evolution with hydrate formation and dissociation. The large average bubble size before formation is observed, which is irrecoverable after the dissociation stage.
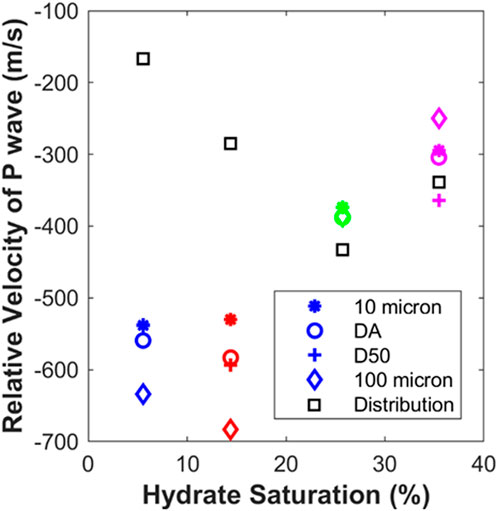
FIGURE 10. Effect of gas bubble size and distribution on P wave velocity during hydrate formation in porous sediment.
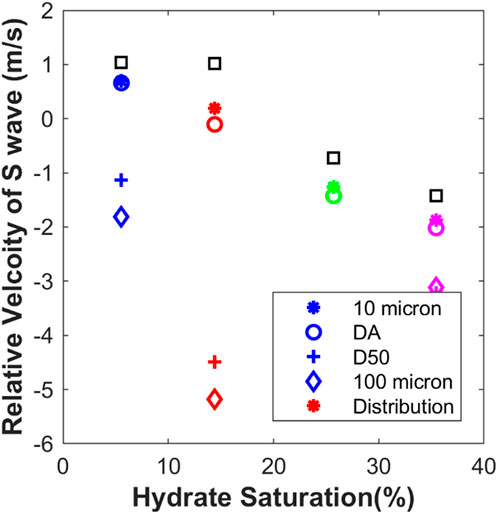
FIGURE 11. Effect of gas bubble size and distribution on S wave velocity during hydrate formation in porous sediment.
In the case of effect on P wave velocity, introducing a uniform bubble in the model results in significant reduction in P wave velocity for hydrate saturations <20%. However, beyond 20% hydrate saturation, the uniform d50 and uniform mean bubble size (DA) seem to predict the P wave velocities closer to reality. Simulations using actual bubble size distribution indicate less effect at low hydrate saturation (<10%), whereas the greatest reduction is found at 25% hydrate saturation, which might be due to the evolution of bubble sizes from well-distributed to more uniformly distributed bubble sizes (see Figure 5). In general, the relative change in S wave velocity might be smaller (Figure 11), but this is due to the assumed pore-filling hydrate morphology (Sahoo et al., 2018b) of the hydrates. The uniform average bubble size and 10 μm bubble produce a similar effect on S wave propagation, but 100 μm and d50 bubble size reduce S wave velocity. Simulations using actual bubble size distribution show less effect on S wave propagation in general, but they seem to coincide with simulations of 100 μm and d50 bubble size.
Discussion and Conclusion
We show 4D time-lapse, high-resolution synchrotron imaging of methane gas evolution during methane hydrate formation and dissociation in brine-saturated sand. To our knowledge, this is the first imaging of bubble dynamics during the formation and dissociation of hydrates in brine-saturated sand. Initially, before hydrate formation, methane gas shows pipe-like structures, spread across several pores. These pipe structures either separate or get interconnected as hydrate formation starts and thereafter becomes disconnected as methane is consumed to form more hydrates. The initial bubble size distribution is well-graded, covering bubble sizes as big as 1,000 μm–50 μm (before hydrate formation). As hydrate begins to form, the bubble size variation reduces to poorly graded, varying from 200 to 10 μm, and further tending toward uniformly graded bubble size (Figure 5). The methane gas may not be fully consumed even after maximum hydrate formation as hydrate formed on the gas bubble surface and prevented further contact between gas and water. This phenomenon has been observed in our previous work (Sahoo et al., 2018b) and also from field samples in the Hydrate Ridge, (Suess et al., 2001). Hydrate formation in the unconsolidated porous material leads to densification (Figure 6), initially as the bubble size reduces and then as the solid hydrate replaces the fluid hydrate.
The dissociation of methane hydrate releases the methane gas with uniform bubble size and these bubble sizes increase with hydrate dissociation. However, hydrate formation and dissociation lead to more uniformity in gas bubble distribution. There are no interconnected bubbles upon full hydrate dissociation compared to those observed before hydrate formation (Figures 3, 4).
Modeling the effect of bubble size and distribution using an effective medium rock physics model shows the actual bubble size distribution from the synchrotron data producing a very different effect on P wave propagation in comparison to representative uniform bubble size (either with an average diameter or D50), even though the actual average bubble size was used for comparative simulation. Our previous work by Sahoo et al. (2018b) on correlating hydrate morphology to geophysical properties, the hydrate morphology evolves from pore filling to pore bridging at hydrate saturation between 20%–30%, which is evidenced by the geophysical measurements. A similar observation about the transition from pore filling to pore bridging was also made by Priest et al. (2009) at hydrate saturations between 20% and 30%. Our simulations indicate uncertainty in predicting wave velocity because the presence of gas is higher when hydrate saturation is lower than 20%, which could be attributed to the pore filling nature of the hydrate structure. Hence, for pore filling hydrate morphology, the use of bubble size distribution can produce more accurate estimates of wave velocities. Pore bridging hydrate morphology is observed for >30% hydrate saturation and bubble size distribution is uniform; however, the size of the bubble becomes important in accurately predicting the wave velocities. The effect of bubble size and distribution plays a role in S wave velocity also, but the effect might be less for pore filling–type hydrate structure and further, this effect might be masked in pore bridging type hydrate structure due to an increase of the cementing effect as hydrate bridges with each other. This work clearly shows the significance of bubble size and distribution in predicting the geophysical properties of hydrate-bearing porous media.
Data Availability Statement
The datasets presented in this study can be found in online repositories. The names of the repository/repositories and accession number(s) can be found in the article/Supplementary Material.
Author Contributions
The conceptualization for synchrotron CT imaging and major writing was carried out by BM. SS developed and analyzed the results using an effective medium rock physics model using bubble resonance and contributed to writing the manuscript. FA-B contributed toward analyzing the synchrotron data and developed the necessary methodology and scripts to segment, reconstruct, and analyze the 3D CT scan data from Diamond Light Source, United Kingdom. SA was instrumental in carrying out and reconstructing the images, while also assisting FA-B to develop necessary scripts at Diamond Light Source, United Kingdom. LN was instrumental in developing the rig to image gas hydrate formation along with BM and SS. AB was the key to securing funding for this work, both experiments and numerical modeling, and also participated in the discussions about the results of the analyses.
Funding
We acknowledge funding from the United Kingdom Natural Environment Research Council (Grant NE/J020753/1 and NE/R000123/1). BNM was supported by the SMMI HIEF internal grant from the University of Southampton. The experimental data are available at the National Geoscience Data Centre, United Kingdom under the Grant NE/J020753/1.
Conflict of Interest
FA-B and SA are employed by Diamond Light Source Ltd. Diamond Light Source Ltd ("Diamond"), is UK's national synchrotron facility and is a not-for-profit limited company funded as a joint venture by the UK Government as part of UK Research and Innovation (UKRI) through the Science & Technology Facilities Council (STFC) in collaboration with the Wellcome Trust.
The remaining authors declare that the research was conducted in the absence of any commercial or financial relationships that could be construed as a potential conflict of interest.
Publisher’s Note
All claims expressed in this article are solely those of the authors and do not necessarily represent those of their affiliated organizations, or those of the publisher, the editors, and the reviewers. Any product that may be evaluated in this article, or claim that may be made by its manufacturer, is not guaranteed or endorsed by the publisher.
Acknowledgments
The authors are grateful to the Diamond Light Source, United Kingdom synchrotron CT facility for access to the I-13 beamline (proposal MT16205-1) and for the assistance of Shashidhara Marathe (Beamline Scientist) Kaz Wanelik (Data Acquisition and Scientific Computing). We thank the μ-VIS facility at the University of Southampton for image analysis capability and particularly Prof. Ian Sinclair for his help with the proposal to Diamond Light Source, United Kingdom.
Supplementary Material
The Supplementary Material for this article can be found online at: https://www.frontiersin.org/articles/10.3389/feart.2022.877641/full#supplementary-material
References
Alvarez-Borges, F. J., King, O. N., Madhusudhan, B., Connolley, T., Basham, M., and Ahmed, S. I. (2021). U-net Segmentation Methods for Variable-Contrast XCT Images of Methane-Bearing Sand. Earth and Space Science Open Archive. [Preprint]. doi:10.1002/essoar.10506807.1
Atwood, R. C., Bodey, A. J., Price, S. W., Basham, M., and Drakopoulos, M. (2015). A High-Throughput System for High-Quality Tomographic Reconstruction of Large Datasets at Diamond Light Source. Philos. Trans. A Math. Phys. Eng. Sci. 373, 2369–2393. doi:10.1098/rsta.2014.0398
Best, A. I., Priest, J. A., Clayton, C. R. I., and Rees, E. V. L. (2013). The Effect of Methane Hydrate Morphology and Water Saturation on Seismic Wave Attenuation in Sand under Shallow Sub-seafloor Conditions. Earth Planet. Sci. Lett. 368, 78–87. doi:10.1016/j.epsl.2013.02.033
Best, A. I., Tuffin, M. D., Dix, J. K., and Bull, J. M. (2004). Tidal Height and Frequency Dependence of Acoustic Velocity and Attenuation in Shallow Gassy Marine Sediments. J. Geophys. Res. 109 (B8), B08101. doi:10.1029/2003jb002748
Biot, M. A. (1956a). Theory of Propagation of Elastic Waves in a Fluid‐Saturated Porous Solid I Low‐Frequency Range. J. Acoust. Soc. Am. 28 (2), 168–178. doi:10.1121/1.1908239
Biot, M. A. (1956b). Theory of Propagation of Elastic Waves in a Fluid‐Saturated Porous Solid. II. Higher Frequency Range. J. Acoust. Soc. Am. 28 (2), 179–191. doi:10.1121/1.1908241
Chaouachi, M., Falenty, A., Sell, K., Enzmann, F., Kersten, M., Haberthür, D., et al. (2015). Microstructural Evolution of Gas Hydrates in Sedimentary Matrices Observed with Synchrotron X-Ray Computed Tomographic Microscopy. Geochem. Geophys. Geosyst. 16, 1711–1722. doi:10.1002/2015gc005811
Ecker, C., Dvorkin, J., and Nur, A. (1998). Sediments with Gas Hydrates: Internal Structure from Seismic AVO. Geophysics 63 (5), 1659–1669. doi:10.1190/1.1444462
Ellis, M. H (2008). Joint Seismic and Electrical Measurements of Gas Hydrates in Continental Margin Sediments. Doctoral Thesis. Southampton (England): University of Southampton, School of Ocean and Earth Science.
Fohrmann, M., and Pecher, I. A. (2012). Analysing Sand-Dominated Channel Systems for Potential Gas-Hydrate-Reservoirs Using an AVO Seismic Inversion Technique on the Southern Hikurangi Margin, New Zealand. Mar. Petroleum Geol. 38 (1), 19–34. doi:10.1016/j.marpetgeo.2012.08.001
Goswami, B. K., Weitemeyer, K. A., Minshull, T. A., Sinha, M. C., Westbrook, G. K., Chabert, A., et al. (2015). A Joint Electromagnetic and Seismic Study of an Active Pockmark within the Hydrate Stability Field at the Vestnesa Ridge, West Svalbard Margin. J. Geophys. Res. Solid Earth 120, 6797–6822. doi:10.1002/2015jb012344
Guerin, G., Goldberg, D., and Melser, A. (1999). Characterization of In Situ Elastic Properties of Gas Hydrate-Bearing Sediments on the Blake Ridge. J. Geophys. Res. 104 (817), 17781–17795. doi:10.1029/1999jb900127
Hsu, S.-K., Chiang, C.-W., Evans, R. L., Chen, C.-S., Chiu, S.-D., Ma, Y.-F., et al. (2014). Marine Controlled Source Electromagnetic Method Used for the Gas Hydrate Investigation in the Offshore Area of SW Taiwan. J. Asian Earth Sci. 92, 224–232. doi:10.1016/j.jseaes.2013.12.001
Kumar, J., and Madhusudhan, B. N. (2012). Dynamic Properties of Sand from Dry to Fully Saturated States. Géotechnique 62 (1), 45–54. doi:10.1680/geot.10.p.042
Kvenvolden, K. A. (1993). Gas Hydrates-Geological Perspective and Global Change. Rev. Geophys. 31 (2), 173–187. doi:10.1029/93rg00268
Lee, M. W., and Collett, T. S. (2006). “Gas Hydrate and Free Gas Saturations Estimated from Velocity Logs on Hydrate Ridge, Offshore Oregon, U.S. A, ” in Proceedings of the Ocean Drilling Program, 199 Scientific Results(College Station, TX: Ocean Drilling Program), 1–25. doi:10.2973/odp.proc.sr.204.103.2006
Lee, M. W., and Collett, T. S. (2008). Integrated Analysis of Well Logs and Seismic Data to Estimate Gas Hydrate Concentrations at Keathley Canyon, Gulf of Mexico. Mar. Petroleum Geol. 25 (9), 924–931. doi:10.1016/j.marpetgeo.2007.09.002
Lee, M. W. (2004). Elastic Velocities of Partially Gas-Saturated Unconsolidated Sediments. Mar. Petroleum Geol. 21, 641–650. doi:10.1016/j.marpetgeo.2003.12.004
Leurer, K. C. (1997). Attenuation in Fine‐grained Marine Sediments: Extension of the Biot‐Stoll Model by the "effective Grain Model" (EGM). Geophysics 62 (5), 1465–1479. doi:10.1190/1.1444250
Leurer, K. C., and Brown, C. (2008). Acoustics of Marine Sediment under Compaction: Binary Grain-Size Model and Viscoelastic Extension of Biot's Theory. J. Acoust. Soc. Am. 123 (4), 1941–1951. doi:10.1121/1.2871839
Marín-Moreno, H., Sahoo, S. K., and Best, A. I. (2017). Theoretical Modeling Insights into Elastic Wave Attenuation Mechanisms in Marine Sediments with Pore-Filling Methane Hydrate. J. Geophys. Res. Solid Earth 122, 1835–1847. doi:10.1002/2016JB013577
Milkov, A. V., Dickens, G. R., Claypool, G. E., Lee, Y. J., Borowski, W. S., Torres, M. E., et al. (2004). Co-existence of Gas Hydrate, Free Gas, and Brine within the Regional Gas Hydrate Stability Zone at Hydrate Ridge (Oregon Margin): Evidence from Prolonged Degassing of a Pressurized Core. Earth Planet. Sci. Lett. 222 (3–4), 829–843. doi:10.1016/s0012-821x(04)00212-2
Paganoni, M., Cartwright, J. A., Foschi, M., Shipp, R. C., and Van Rensbergen, P. (2016). Structure II Gas Hydrates Found below the Bottom-Simulating Reflector. Geophys. Res. Lett. 43, 5696–5706. doi:10.1002/2016GL069452
Priest, J. A., Rees, E. V., and Clayton, C. R. I. (2009). Influence of Gas Hydrate Morphology on the Seismic Velocities of Sands. J. Geophys. Res. 114 (B11205), B11205. doi:10.1029/2009jb006284
Sahoo, S. K., Madhusudhan, B. N., Marín‐Moreno, H., North, L. J., Ahmed, S., Falcon‐Suarez, I. H., et al. (2018b). Laboratory Insights into the Effect of Sediment‐Hosted Methane Hydrate Morphology on Elastic Wave Velocity from Time‐Lapse 4‐D Synchrotron X‐Ray Computed Tomography. Geochem. Geophys. Geosyst. 19, 4502–4521. doi:10.1029/2018gc007710
Sahoo, S. K., Marín‐Moreno, H., North, L. J., Falcon‐Suarez, I., Madhusudhan, B. N., Best, A. I., et al. (2018a). Presence and Consequences of Coexisting Methane Gas with Hydrate under Two Phase Water‐Hydrate Stability Conditions. J. Geophys. Res. Solid Earth 123, 3377–3390. doi:10.1029/2018jb015598
Schicks, J. M., Naumann, R., Erzinger, J., Hester, K. C., Koh, C. A., and Sloan, E. D. (2006). Phase Transitions in Mixed Gas Hydrates: Experimental Observations versus Calculated Data. J. Phys. Chem. B 110 (23), 11468468474–74. doi:10.1021/jp0612580
Schnurle, P., Liu, C.-S., Hsiuan, T.-H., and Wang, T.-K. (2004). Characteristics of Gas Hydrate and Free Gas Offshore Southwestern Taiwan from a Combined MCS/OBS Data Analysis. Mar. Geophys. Res. 25 (1–2), 157–180. doi:10.1007/s11001-005-0740-6
Schwalenberg, K., Haeckel, M., Poort, J., and Jegen, M. (2010). Evaluation of Gas Hydrate Deposits in an Active Seep Area Using Marine Controlled Source Electromagnetics: Results from Opouawe Bank, Hikurangi Margin, New Zealand. Mar. Geol. 272 (1–4), 79–88. doi:10.1016/j.margeo.2009.07.006
Sills, G. C., Wheeler, S. J., Thomas, S. D., and Gardner, T. N. (1991). Behaviour of Offshore Soils Containing Gas Bubbles. Géotechnique 41 (2), 227–241. doi:10.1680/geot.1991.41.2.227
Smith, A. G., Han, E., Petersen, J., Olsen, N. A. F., Giese, C., Athmann, M., et al. (2020). RootPainter: Deep Learning Segmentation of Biological Images with Corrective Annotation. [Preprint]. doi:10.1101/2020.04.16.044461
Spangenberg, E., Priegnitz, M., Heeschen, K., and Schicks, J. M. (2015). Are Laboratory-Formed Hydrate-Bearing Systems Analogous to Those in Nature? J. Chem. Eng. Data 60, 258–268. doi:10.1021/je5005609
Suess, E., Torres, M. E., Bohrmann, G., Collier, R. W., Rickert, D., Goldfinger, C., et al. (2001). “Sea Floor Methane Hydrates at Hydrate Ridge, Cascadia Margin,” in Natural Gas Hydrates—Occurrence, Distribution and Detection (Washington, DC: American Geophysical Union), 87–98. doi:10.1029/GM124p0087
Vafaei, M. T., Kvamme, B., Chejara, A., and Jemai, K. (2014). A New Reservoir Simulator for Studying Hydrate Dynamics in Reservoir. Int. J. Greenh. Gas Control 23, 12–21. doi:10.1016/j.ijggc.2014.02.001
Wadeson, N., and Basham, M. (2016). Savu: A Python-Based, MPI Framework for Simultaneous Processing of Multiple, N-Dimensional, Large Tomography Datasets. arXiv:1610.08015 [Preprint].
Waite, W. F., Santamarina, J. C., Cortes, D. D., Dugan, B., Espinoza, D. N., Germaine, J., et al. (2009). Physical Properties of Hydrate-Bearing Sediments. Rev. Geophys. 47, RG4003. doi:10.1029/2008RG000279
Weitemeyer, K. A., Constable, S. C., Key, K. W., and Behrens, J. P. (2006). First Results from a Marine Controlled-Source Electromagnetic Survey to Detect Gas Hydrates Offshore Oregon. Geophys. Res. Lett. 33, L03304. doi:10.1029/2005gl024896
Yang, L., Falenty, A., Chaouachi, M., Haberthür, D., and Kuhs, W. F. (2016). Synchrotron X-Ray Computed Microtomography Study on Gas Hydrate Decomposition in a Sedimentary Matrix. Geochem. Geophys. Geosyst. 17, 3717–3732. doi:10.1002/2016gc006521
Keywords: gas bubble, gas hydrate, wave velocity, synchrotron X-ray imaging, rock physics model
Citation: Madhusudhan BN, Sahoo SK, Alvarez-Borges F, Ahmed S, North LJ and Best AI (2022) Gas Bubble Dynamics During Methane Hydrate Formation and its Influence on Geophysical Properties of Sediment Using High-Resolution Synchrotron Imaging and Rock Physics Modeling. Front. Earth Sci. 10:877641. doi: 10.3389/feart.2022.877641
Received: 18 February 2022; Accepted: 19 April 2022;
Published: 08 June 2022.
Edited by:
Beatriz Quintal, University of Lausanne, SwitzerlandReviewed by:
Yanhui Dong, Institute of Geology and Geophysics (CAS), ChinaHemin Yuan, China University of Geosciences, China
Copyright © 2022 Madhusudhan, Sahoo, Alvarez-Borges, Ahmed, North and Best. This is an open-access article distributed under the terms of the Creative Commons Attribution License (CC BY). The use, distribution or reproduction in other forums is permitted, provided the original author(s) and the copyright owner(s) are credited and that the original publication in this journal is cited, in accordance with accepted academic practice. No use, distribution or reproduction is permitted which does not comply with these terms.
*Correspondence: S. K. Sahoo, cy5zYWhvb0Bub2MuYWMudWs=
†ORCID: B. N. Madhusudhan, orcid.org/0000-0002-2570-5934; F. Alvarez-Borges, orcid.org/0000-0002-6940-9918; S. K. Sahoo, orcid.org/0000-0001-9644-8878
 B. N. Madhusudhan
 S. K. Sahoo
 F. Alvarez-Borges
 S. Ahmed
 L. J. North2
 A. I. Best
