 Xinglin Lei
- Geological Survey of Japan, AIST, Ibaraki, Japan
In a recent paper [“Groundwater anomaly related to CCS-CO2 injection and the 2018 Hokkaido Eastern Iburi earthquake in Japan” by Sano et al. (Front. Earth Sci., 2020, 8)], the authors claimed that CO2-enriched fluid may have initially migrated through permeable channels, blocking the fluid flow from the source region, increasing pore pressure in the focal region and triggering a natural earthquake where the brittle crust was already critically stressed. The proposed model is very interesting, but the authors have not shown any quantitative evaluation supporting their conclusion. Here, through geomechanics model analysis, even under extreme conditions, which overestimate the impact of the injection, the impact of the CO2 injection on the Iburi earthquake fault, whether the deep section or shallow part of the fault, is much lower than that caused by Earth tides. In addition, no convincing mechanism exists that would allow fluid channels to heal within a short period of time and block the natural fluid flow along the fault. Therefore, the occurrence of earthquakes was not related to CO2 injection. Geological storage of CO2 is expected to become an effective option for global warming countermeasures, and the assessment of its environmental impact must be carefully conducted.
Introduction
As one effective option for mitigating global warming, the geological storage of carbon dioxide (CO2) appears promising. Injecting a large amount of CO2 fluid into an underground aquifer will inevitably cause certain formation deformation and increase fluid pressure. There is therefore a risk of accelerating the activation of pre-existing faults nearby and inducing/triggering earthquakes. In several industrial applications that require the injection of fluids into the Earth’s crust, including disposal of wastewater, development of unconventional oil and gas resources, enhanced geothermal development, and well salt production, injection-induced seismicity, including destructive earthquakes with a sizable magnitude (M > 5), has been observed and has attracted widespread attention (e.g., Ellsworth et al., 2019; Atkinson et al., 2020; Lei et al., 2020). At the same time, it also poses challenges for effective operation. At present, some demonstration projects of CO2 geological storage have been carried out around the world, but there are no reports of important induced earthquakes related to these projects.
The carbon capture and storage (CCS) demonstration project in Tomakomai, Hokkaido, Japan, is a medium-scale CO2 offshore storage and has injected approximately 300,000 tons of CO2 into a porous sandstone aquifer at a depth of approx. 1,000 m from April 2016 to November 2019. During this period, on September 5, 2018, at 18:08 (UTC), a JMA (the Japan Meteorological Agency) magnitude 6.7 earthquake occurred in the eastern Iburi region in Hokkaido. The focal depth of the earthquake is 37 km, and the epicenter is approx. 20 km east from the injection location (Figure 1). Joint inversion of strong motion and geodetic data shows that a large slip occurred at a depth of approx. 22 km, which is shallower than the hypocenter (initial rupture) depth. This indicates that the main seismogenic fault is an east-dipping high-angle reverse fault, which is consistent with the Ishikari-Teichi-Toen fault zone (ITTFZ) (Kobayashi et al., 2019). Based on detailed 3D injection simulation, the predicted pressure buildup at the end of the injection is limited within a few kilometers from the injection well (Kano et al., 2014). By considering that the stress disturbance caused by CO2 injection cannot reach the ITTFZ, it is generally believed that the earthquake is not directly or indirectly related to CO2 injection. However, recently, a previous study (Sano et al., 2020) determined isotopes of commercially available mineral water produced from a depth of approx. 100 m in a well located 13 km from the injection site, showing dissolved components of injected CO2. Furthermore, the steady flow of deep celestial fluid along the ITTFZ is speculated to be blocked, which increased the fluid pressure in the deep part of the fault and triggered the earthquake. The model proposed in the paper is very interesting, but making such an assumption without any geomechanical analysis may not be valid.
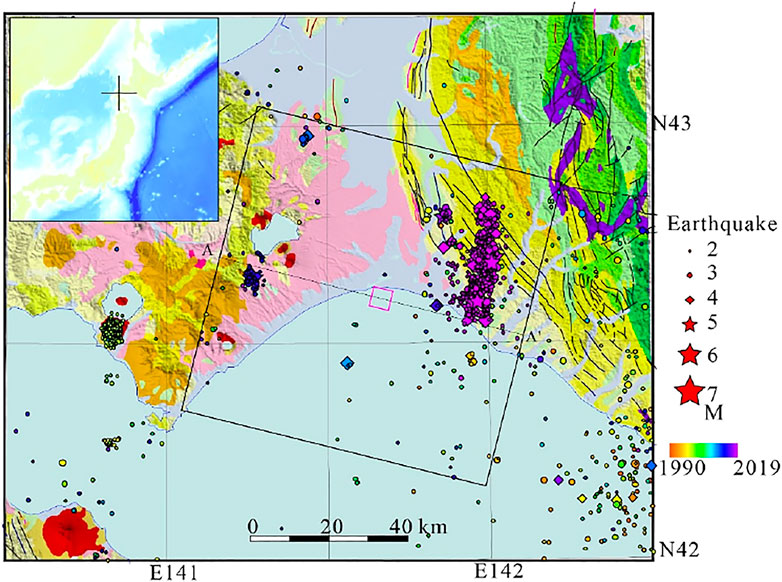
FIGURE 1. Map view of the Tomakomai carbon capture and storage (CCS)-CO2 injection site and earthquake epicenters observed from 1990 through 2019 (from the Japan Meteorological Agency (JMA) earthquake catalog) overlaid on geological map (from (Japan, 1995)). The pink square indicates the injection site. Line A-A′ masks the profile in Figure 2.
The purpose of the present brief study is to investigate the validity of the above assumption. First, the theoretical solution of a simple two-dimensional radial flow model is used to analyze the decay of fluid pressure with distance. Then, a simplified three-dimensional (3D) and coupled thermal-hydraulic-mechanical (THM) model is constructed to quantitatively analyze the influence range and degree of actual CO2 injection under some extreme conditions.
Analysis Based on Geomechanics
Geological Environment of the Tomakomai Carbon Capture and Storage-Injection Site
Figure 2 shows a simplified 3D geological model of the Tomakomai CCS-CO2 injection site and distribution of earthquakes from the JMA catalog. The geological model is modified from the summary of time report of the Tomakomai CCS large-scale demonstration test 300,000 tons injection (METI, NEDO, and JCCS, 2020) METI, NEDO, and JCCS. There are two potential reservoirs, Moebetsu formation and Takinoue formation, for CO2 storage. The Moebetsu formation is located at a depth of approx. 870 to 1,200 m. The upper part of the formation, which is dominated by silt/mudstone, acts as a cap layer. The lower part of the formation (below 1,070 m), dominated by sandstone, is a potential CO2 reservoir. Another potential reservoir is the Takinoue formation at a depth of approx. 2,400 to 3,000 m, which is a volcanic formation composed of Neogene lava and tuff. Although the reservoir pressure is hydrostatic in the Moebetsu formation, the Takinoue formation is characterized by heterogeneously distributed overpressure zones. The temperature gradient is 3.7–4.4 °C/100 m (Kano et al., 2014).
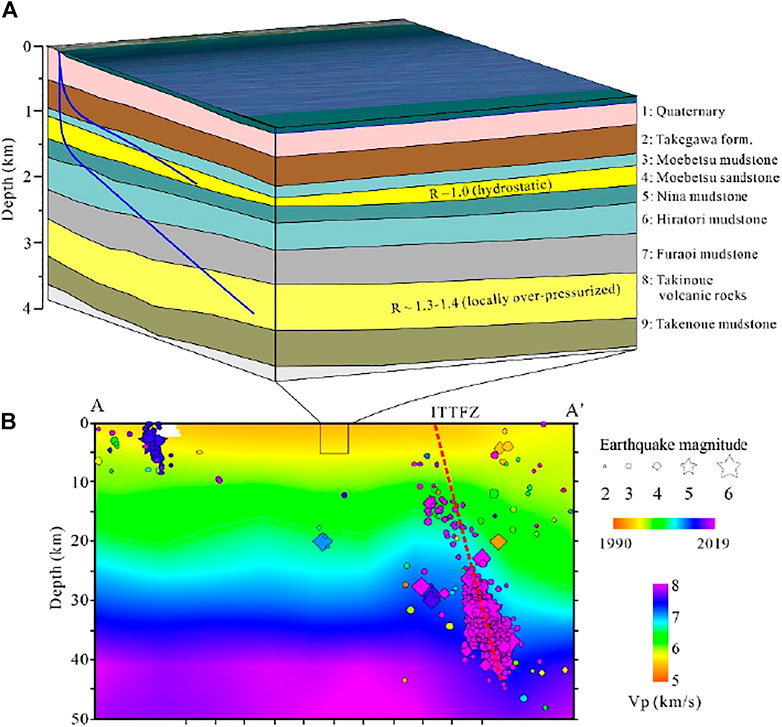
FIGURE 2. (A) A simplified 3D geological model of the Tomakomai CCS-CO2 injection site (modified from (METI, NEDO, and JCCS, 2020)). (B) Vertical section showing the P velocity (from (Matsubara et al., 2017)) and the earthquake (from JMA catalog) distribution. Ishikari-Teichi-Toen fault zone (ITTFZ).
The injection was started in April 2016 and ended in Oct. 2019, achieving a cumulative injection of 300,012 tons in the Moebetsu reservoir. The maximum injection rate was approx. 18,000 tons/month, and the maximum pressure increase was 12.6 MPa. Only 98 tons was injected into the Takinoue reservoir by two short tests (METI, NEDO, and JCCS, 2020). Thus, we only focus on the injection in the Moebetsu formation in this study.
Two-Dimensional Radial Flowing Model
As shown in Figure 2, the Moebetsu sandstone aquifer in the CCS site is quite stable and relatively flat over a few tens of kilometers. Thus, it is valuable to make a rough estimate of some key parameters using simple models for which theoretical solutions are available. To this end, a two-dimensional (2D) radial flowing model of an infinite and isotropic horizontal layer was tested. Under the assumption that Darcy’s law holds, the theoretical solution of the pore pressure change is given as (Barker, 1988):
where Γ represents the Gamma function, t (s) is the time since the start of injection, r (m) is the distance from the injection well, Q (m3/s) is the pumping/injection rate, H (m) and k (m2) are the thickness and permeability of the layer, D (m2/s) is the hydraulic diffusivity, η (Pa⋅s) is the dynamic viscosity of water, ϕ is the porosity, Sa (Pa−1) is the unconstrained specific storage coefficient, and βfl (Pa−1) and βpv (Pa−1) are the compressibility of the fluid and pores, respectively. This kind of model has been successfully applied to represent fluid pressure and strain observed during pumping tests in soft sedimentary formations (Lei et al., 2019).
The thickness of the Moebetsu formation surrounding the injection well is greater than 100 m, and the permeability and porosity are 50 mD and 0.15, respectively (Kano et al., 2014). We assume that H = 100 m, ϕ = 0.15, and k from 1 to 100 mD. In order to perform an overestimation, the injection rate of water is assumed to be Q = 0.0143 m3/s, approx. 270,000 tons/year, which is greater than the actual mean injection rate of CO2 (less than 100,000 tons/year). For the case of K = 10 mD, the predicated pressure buildup surrounding the injection well falls in the range from 22 to 25 MPa after one to 10 years of injection, which is greater than the actual maximum injection pressure (12.6 MPa). Even so, the fluid pressure front (pressure increased by 0.01 MPa) is far from the ITTFZ, even at the end point of the 10-years injection (Figure 3A). As shown in Figure 3B, the pressure front increases with increasing K. Even for the worst case of K = 100 mD, the front did not reach the fault at 780 days after injection started.

FIGURE 3. (A) Increase in fluid pressure as a function of distance from the injection well as estimated from two-dimensional radial flowing model. (B) Pressure fronts after 780 days of continuous water injection.
Three-Dimensional Thermal-Hydraulic-Mechanical-Coupled Simulation
The coupled THM simulation was used to predict injection-induced changes in rock properties, formation deformation, stress redistribution, and fracture/fault stability. In the present study, Tough2 and Flac3D were selected for the coupled THM simulation. Tough2 is a multiphase reservoir simulation program developed by the U.S. Lawrence Berkeley National Laboratory (LBNL). Flac3D is commercially available software for stress analysis (Itasca, 2000). As a promising combination, the “Tough-Flac3D″ approach with couplers and post-processing tools has proven useful in the analysis of deformation accompanied with fluid flow within reservoirs of hard and soft rocks (Itasca, 2000; Todesco et al., 2004; Rutqvist et al., 2008; Rutqvist et al., 2015; Sorai et al., 2015; Lei et al., 2017).
In the coupled simulation, permeability is revised within every time step by built-in functions. Following previous works, permeability has been expressed as a function of volumetric strain (εv) (Chin et al., 2000; Cappa and Rutqvist, 2011) as.
Where
A numerical model covering an area of 80 km × 80 km centered at the Tomakomai CCS injection site was constructed. The ITTFZ is taken as the thin fault zone. Since the upper limitation of temperature of Tough2 is 300°C, we only focus on the uppermost 6 km (Figure 4). The model is divided into grids by steps so that the volumes of the fault and injection well are split into small parts while the surrounding matrix becomes coarser as the distance from the fault increases. The total number of grids and elements are 18,954 and 16,796, respectively. The hydraulic and mechanic properties for all nine formations and the fault zone are listed in Table 1. The hydraulic properties are similar to that used in previous studies (e.g., Kano et al., 2014). The upscaled mechanical properties are based on laboratory tests on core samples from the site at 10 MPa confining pressure. The most sensitive parameters are the permeability of porosity of the Moebetsu formation, which were firstly determined based on the permeability profile estimated from injection tests using salt water and logging data (METI, NEDO, and JCCS, 2020) and then optimized by tuning simulation. Aided by the 2D radial flow analysis results, the determination of the optimal parameters required only a few tuning steps. At the same time, we also performed calculations for different permeability (10, 20, 50, 100 mD) and porosity (0.1, 0.15) to examine the influence of the uncertainty of these sensitive parameters on the results. Due to the lack of monitoring data on rock mechanical responses, in-depth studies on the uncertainty of mechanical parameters cannot be carried out. The only water injection pressure data can be well fitted by modifying the reservoir hydraulic parameters (METI, NEDO, and JCCS, 2020).
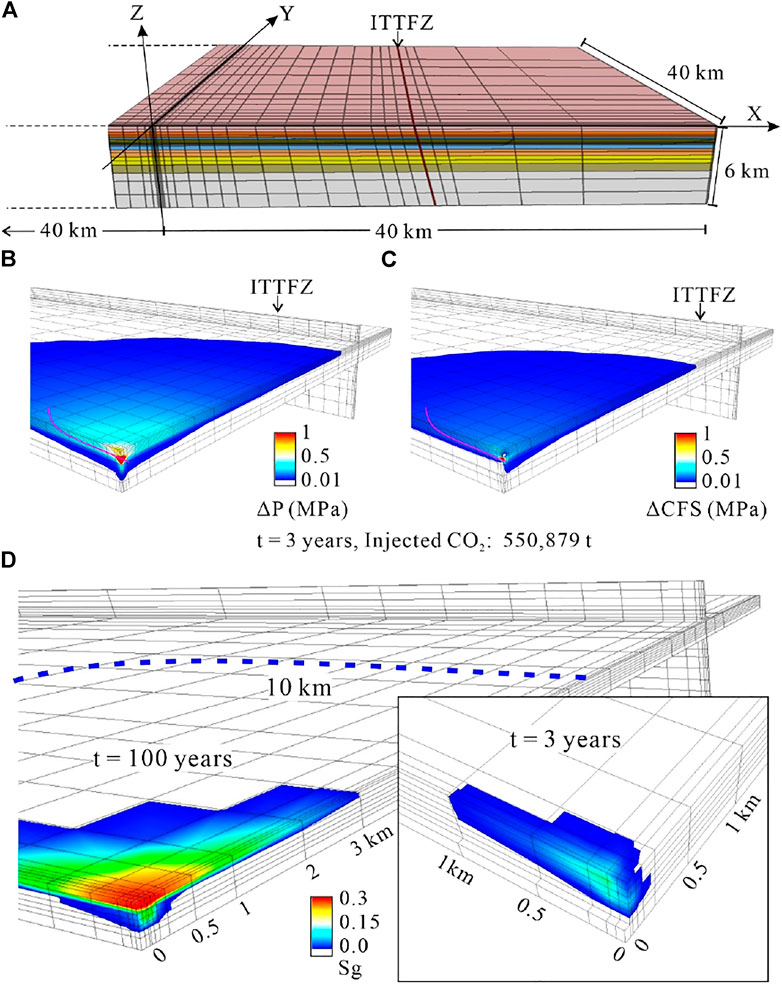
FIGURE 4. Three-dimensional numerical model (A), pressure/CFS increase after injection for three years (B,C), and distribution of CO2 saturation after injection for three and 100 years (D). Permeability of 50 mD and porosity of 0.15 were assumed for the injection layer.
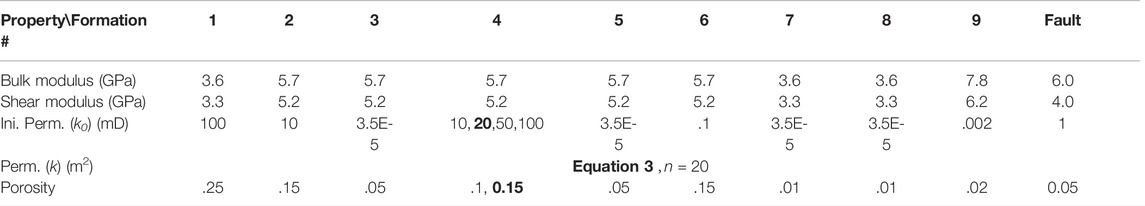
TABLE 1. Mechanical properties.
First, simulation was carried out without any injection in order to obtain a hydraulic and thermal steady state. The top layer (air) has a constant pressure (0.1 MPa) and temperature (10°C), and the temperature gradient is assumed to be 4°C/100 m. Roller boundary conditions were imposed on the four sides and bottom of the model. The fluid pressure at the four sides was assumed to be hydrostatic and was kept constant during injection simulation. Both the flow rate and heat flux were fixed at the lower boundary. The in-site stress values are installed in all zones, and also applied as loads acting on the far-field boundaries. The vertical stress σV was calculated from assumed density values. Because the main rock of the model is soft rock, the maximum and minimum horizontal stress values were assumed as σH = 1.3 σV, and σh = 1.2 σV, respectively. Since the main purpose of the present study is to assess the impact of water injection activities on faults, the background tectonic stress itself is not important. During the coupled simulation, the permeability increases with increasing volumetric strain. The peak well head pressure during injection is 12.6 MPa (METI, NEDO, and JCCS, 2020) and decreases rapidly with increasing distance from the injection zone. Thus, we only consider the elastic behaviors.
In addition to the injection of CO2 in the Moebetsu formation, a water source was added at the bottom of the fault to simulate natural flow along the ITTFZ. First, fluid flow along the fault zone was carried out at an injection rate of 10,000 tons/year for 1,000 years to reach a relatively stable state of fluid flow and heat flux. The CO2 injection was then started at an injection rate of ∼183,600 tons/year for 100 years. This is the base model (Model-1). For comparison, a simulation was also carried out without CO2 (Model-2) to verify whether CO2 injection alters deep fluid flow along the fault.
The simulation results show that after three years of injection, by which point more than 550,000 tons of supercritical CO2 were injected into to the Moebetsu formation, the injected CO2 is distributed within a few hundred meters around the injection well (Figure 4D), which is slightly larger than that revealed by the 3D seismic exploration implemented in 2019 (METI, NEDO, and JCCS, 2020). This result is expected since larger injection rate was assumed in the simulation. The pressure buildup is still beyond the fault for both models (Figures 4B,C). As compared with Model-1, the pressure front of Model-2 is farther from the fault zone due to the background flow from deep in the fault. The change of the Coulomb Failure Stress (CFS) acting on the fault planes, which have the same strike, dip, and rake with the seismogenic fault of the 2018 Hokkaido Eastern Iburi earthquake, is governed by fluid pressure. Although there is a redistribution of flow velocity at the intersection of the fault and the reservoir, the resulted fluid pressure (P(A) in Figure 5) by Model-1 of different permeability and porosity for the Moebetsu formation is exactly the same as Model-1, consistently show that CO2 injection has no effect on fluid pressure at the deep part of the fault event after 100 consecutive years of injection (Figure 5).
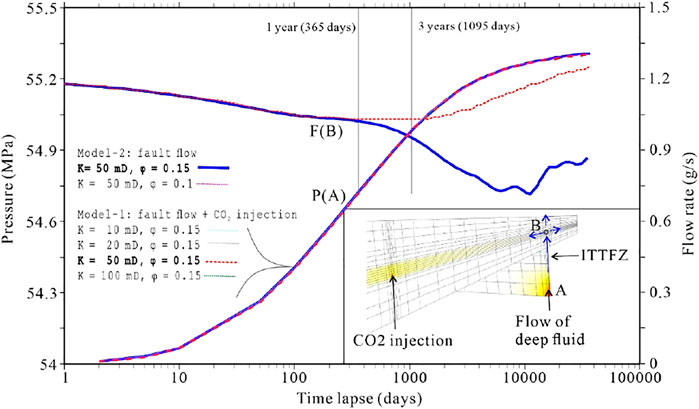
FIGURE 5. Pressure and flow rate at key points. A: Injection point within the fault at a depth of 6 km. B: Intersection of the fault and the Moebetsu injection layer. The results of different permeability and porosity for the Moebetsu formation consistently show that CO2 injection has no effect on fluid pressure at the deep part of the fault event after 100 consecutive years of injection.
Discussion and Conclusion
The results of the present study show that, even under extreme conditions, when CO2 is injected at a rate of ∼180,000 tons/year (actually less than 100,000 tons/year) for 10 consecutive years (actually less than three years), the 0.01-MPa front of the fluid pressure increment is far from the hypocenter of the Iburi Earthquake. After three years injection, the injected CO2 is distributed within a few hundred meters around the injection well, which is slightly larger than that revealed by the 3D seismic exploration implemented in 2019 (METI, NEDO, and JCCS, 2020) after injection 207,208.9t CO2. If the injected CO2, including dissolved CO2, could rapidly migrate beyond 10 km as claimed in Sano et al. (2020), 3D seismic exploration would either see nothing or show anomalies on a large area, but this is not the case. Detailed discussion on geochemical issues is interesting but beyond the scope of this study. In the absence of wide-area groundwater flow, the distribution of gaseous and dissolved CO2 is also limited within a small zone of only a few kilometers at most. Even if there is a wide area of groundwater flow, the distribution range of CO2 has expanded, compared with the stable fluid pressure before water injection, the range where the fluid pressure has increased still does not change significantly. The changes in fluid pressure and pore-elastic effects at the intersection of the ITTFZ and the Moebetsu layer 20 km away are much smaller than the changes caused by daily tidal action, not to mention the 37-km depth of the fault, where the 2018 Hokkaido Eastern Iburi Earthquake initiated. For reference, tidal stress amplitude thresholds required to trigger earthquakes, for static and dynamic triggering, have been estimated to range from 0.01 to 0.03 MPa (pore pressure: 0.015–0.05 MPa) (King et al., 1994; Cochran et al., 2004). Therefore, the implementation of the Tomakomai CO2 geological storage demonstration project is unlikely to be the triggering factor of the earthquake.
In our simulation, the dissolution of injected CO2 into the groundwater of the aquifer was counted but other chemical processes, such as mineralization were ignored. In general, minerals, such as silica in the deep source hydrothermal fluid, precipitated to the pressure drop caused by earthquake to heal the fault reduce the permeability of the fault (Saishu et al., 2017). However, no convincing mechanism exists that would allow fluid channels to be healed within a short period of time and block the natural fluid flow along the fault during CO2 injection, which increases the fluid pressure.
As mentioned above, the geological sequestration of CO2 is important in mitigating the global warming trend. Demonstration projects of various scales are for the development of technology and the verification of the safety and effectiveness of the corresponding technology. With regard to risk-related injection-induced fault reactivation and earthquakes, both oversized and undersized assessments must be avoided.
The model proposed by Sano et al., (2020) is worth investigating for commercial applications of large-scale and long-term CO2 storage. Thermally, hydraulically, mechanically, and chemically coupled geomechanics modeling will be a key technology.
Data Availability Statement
The original contributions presented in the study are included in the article/Supplementary Material, further inquiries can be directed to the corresponding author.
Author Contributions
The author confirms being the sole contributor of this work and has approved it for publication.
Conflict of Interest
The author declares that the research was conducted in the absence of any commercial or financial relationships that could be construed as a potential conflict of interest.
Publisher’s Note
All claims expressed in this article are solely those of the authors and do not necessarily represent those of their affiliated organizations, or those of the publisher, the editors and the reviewers. Any product that may be evaluated in this article, or claim that may be made by its manufacturer, is not guaranteed or endorsed by the publisher.
Acknowledgments
The author would like to thank two reviewers for their helpful comments during the review process.
References
Alam, A. K. M. B., Niioka, M., Fujii, Y., Fukuda, D., and Kodama, J.-i. (2014). Effects of Confining Pressure on the Permeability of Three Rock Types under Compression. Int. J. Rock Mech. Min. Sci. 65, 49–61. doi:10.1016/j.ijrmms.2013.11.006
Atkinson, G. M., Eaton, D. W., and Igonin, N. (2020). Developments in Understanding Seismicity Triggered by Hydraulic Fracturing. Nat. Rev. Earth Environ. 1, 264–277. doi:10.1038/s43017-020-0049-7
Barker, J. A. (1988). A Generalized Radial Flow Model for Hydraulic Tests in Fractured Rock. Water Resour. Res. 24 (10), 1796–1804. doi:10.1029/wr024i010p01796
Cappa, F., and Rutqvist, J. (2011). Modeling of Coupled Deformation and Permeability Evolution during Fault Reactivation Induced by Deep Underground Injection of CO2. Int. J. Greenh. Gas Control 5 (2), 336–346. doi:10.1016/j.ijggc.2010.08.005
Chin, L. Y., Raghavan, R., and Thomas, L. K. (2000). Fully Coupled Geomechanics and Fluid-Flow Analysis of Wells with Stress-dependent Permeability. Spe J. 5 (01), 32–45. doi:10.2118/58968-pa
Cochran, E. S., Vidale, J. E., and Tanaka, S. (2004). Earth Tides can Trigger Shallow Thrust Fault Earthquakes. Science 306, 1164–1166. doi:10.1126/science.1103961
Ellsworth, W. L., Giardini, D., Townend, J., Ge, S., and Shimamoto, T. (2019). Triggering of the Pohang, Korea, Earthquake (Mw 5.5) by Enhanced Geothermal System Stimulation. Seismol. Res. Lett. 90 1844–1858. doi:10.1785/0220190102
Japan, G. S. o. (1995). 1/1,000,000 Japanese Geological Map CD-ROM Version Digital Geological Map G-1.
Kano, Y., Funatsu, T., Nakao, S., Kusunose, K., Ishido, T., Lei, X., et al. (2014). Analysis of Changes in Stress State and Fault Stability Related to Planned CO2 Injection at the Tomakomai Offshore Site. Energy Procedia 63, 2870–2878. doi:10.1016/j.egypro.2014.11.310
King, G. C., Stein, R. S., and Lin, J. (1994). Static Stress Changes and the Triggering of Earthquakes. Bull. Seismol. Soc. Am. 84, 935–953. doi:10.1186/s40623-019-1041-7
Kobayashi, H., Koketsu, K., and Miyake, H. (2019). Rupture Process of the 2018 Hokkaido Eastern Iburi Earthquake Derived from Strong Motion and Geodetic Data. Earth, Planets Space 71 (1), 1–9. doi:10.1186/s40623-019-1041-7
Lei, X., Huang, D., Su, J., Jiang, G., Wang, X., Wang, H., et al. (2017). Fault Reactivation and Earthquakes with Magnitudes of up to Mw4.7 Induced by Shale-Gas Hydraulic Fracturing in Sichuan Basin, China. Sci. Rep. 7 (1), 79717971. doi:10.1038/s41598-017-08557-y
Lei, X., Su, J., and Wang, Z. (2020). Growing Seismicity in the Sichuan Basin and its Association with Industrial Activities. Sci. China Earth Sci. 63 (11), 1633–1660. doi:10.1007/s11430-020-9646-x
Lei, X., Xue, Z., and Hashimoto, T. (2019). Fiber Optic Sensing for Geomechanical Monitoring: (2)- Distributed Strain Measurements at a Pumping Test and Geomechanical Modeling of Deformation of Reservoir Rocks. Appl. Sci. 9 (3), 417. doi:10.3390/app9030417
Matsubara, M., Sato, H., Uehira, K., Mochizuki, M., and Kanazawa, T. (2017). Three-Dimensional Seismic Velocity Structure beneath Japanese Islands and Surroundings Based on NIED Seismic Networks Using Both Inland and Offshore Events. J. Disaster Res. 12 (5), 844–857. doi:10.20965/jdr.2017.p0844
METI, NEDO, and JCCS (2020). Summary of Time Report of the Tomakomai CCS Large-Scale Demonstration Test 300,000 Tons Injection. Available at: https://www.meti.go.jp/press/2020/05/20200515002/20200515002.html.
Ohtake, M. (1974). Seismic Activity Induced by Water Injection at Matsushiro, Japan. J. Phys. Earth. 22, 163–176. doi:10.20965/jdr.2017.p0844
Rutqvist, J., Birkholzer, J. T., and Tsang, C.-F. (2008). Coupled Reservoir-Geomechanical Analysis of the Potential for Tensile and Shear Failure Associated with CO2 Injection in Multilayered Reservoir-Caprock Systems. Int. J. Rock Mech. Min. Sci. 45 (2), 132–143. doi:10.1016/j.ijrmms.2007.04.006
Rutqvist, J., Rinaldi, A. P., Cappa, F., and Moridis, G. J. (2015). Modeling of Fault Activation and Seismicity by Injection Directly into a Fault Zone Associated with Hydraulic Fracturing of Shale-Gas Reservoirs. J. Petroleum Sci. Eng. 127, 377–386. doi:10.1016/j.petrol.2015.01.019
Saishu, H., Okamoto, A., and Otsubo, M. (2017). Silica Precipitation Potentially Controls Earthquake Recurrence in Seismogenic Zones. Sci. Rep. 7 (1), 13337. doi:10.1038/s41598-017-13597-5
Sano, Y., Kagoshima, T., Takahata, N., Shirai, K., Park, J.-O., Snyder, G. T., et al. (2020). Groundwater Anomaly Related to CCS-CO2 Injection and the 2018 Hokkaido Eastern Iburi Earthquake in Japan. Front. Earth Sci. 8. doi:10.3389/feart.2020.611010
Sorai, M., Lei, X., Nishi, Y., Ishido, T., and Nakao, S. (2015). CO2 Geological Storage. New York: Springer.
Keywords: hokkaido earthquake, geological CO2 storage, geomechanics, coupled thermal-hydraulic-mechanical simulation, earthquake triggering
Citation: Lei X (2022) Was the 2018 Hokkaido Eastern Iburi Earthquake in Japan Related to Carbon Capture and Storage (CCS)-CO2 Injection? Insights From Geomechanical Analysis. Front. Earth Sci. 10:873645. doi: 10.3389/feart.2022.873645
Received: 11 February 2022; Accepted: 04 May 2022;
Published: 30 May 2022.
Edited by:
Longjun Dong, Central South University, ChinaReviewed by:
Mikhail Rodkin, Institute of Earthquake Prediction Theory and Mathematical Geophysics (RAS), RussiaXueyi Shang, Chongqing University, China
Copyright © 2022 Lei. This is an open-access article distributed under the terms of the Creative Commons Attribution License (CC BY). The use, distribution or reproduction in other forums is permitted, provided the original author(s) and the copyright owner(s) are credited and that the original publication in this journal is cited, in accordance with accepted academic practice. No use, distribution or reproduction is permitted which does not comply with these terms.
*Correspondence: Xinglin Lei, eGluZ2xpbi1sZWlAYWlzdC5nby5qcA==