- 1Department of Geology, Faculty of Science, Assiut University, Asyut, Egypt
- 2Department of Geology and Geophysics, College of Science, King Saud University, Riyadh, Saudi Arabia
- 3Department of Water Management, Faculty of Civil Engineering and Geoscience, Delft University of Technology, Delft, Netherlands
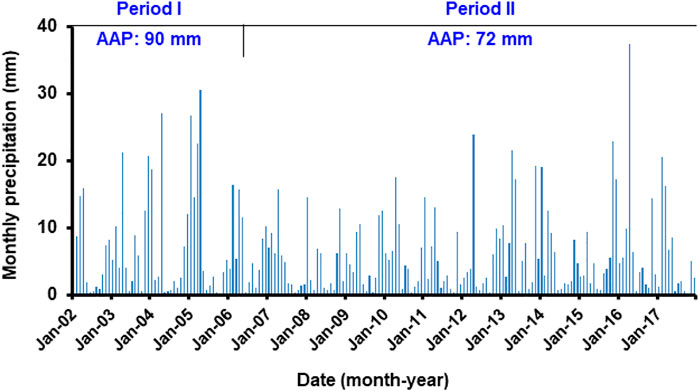
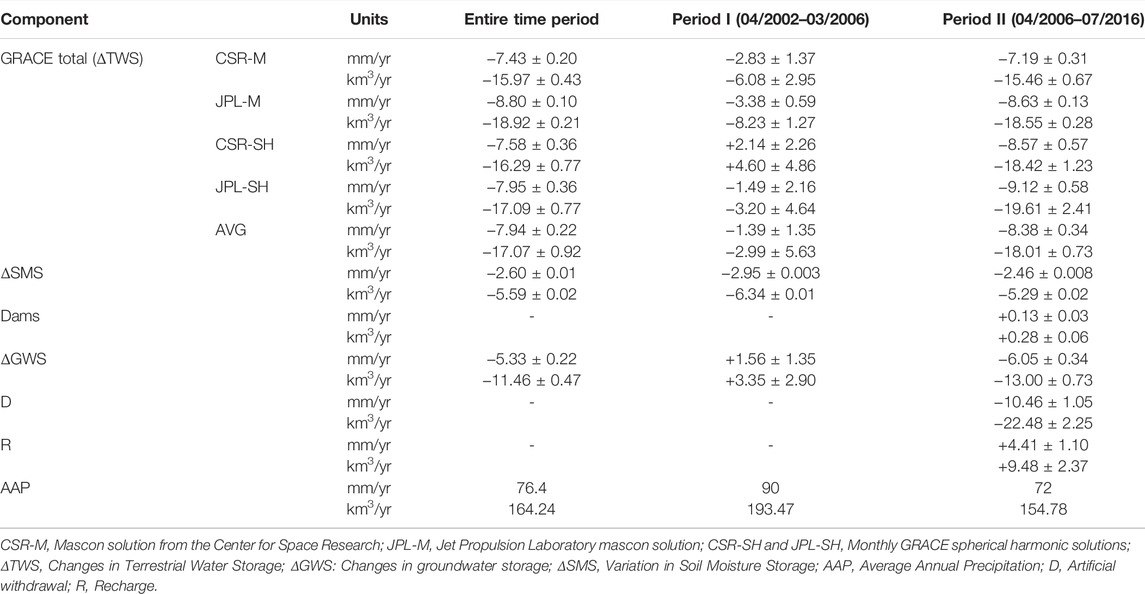
In the Middle East, water shortage is becoming more and more serious due to the development of agriculture and industry and the increase in population. Saudi Arabia is one of the most water-consuming countries in the Middle East, and urgent measures are needed. Therefore, we integrated data from Gravity Recovery and Climate Experiment (GRACE), and other relevant data to estimate changes in groundwater storage in Saudi Arabia. The findings are as follows: 1) Average annual precipitation (AAP) was calculated to be 76.4, 90, and 72 mm for the entire period, Period I (April 2002 to March 2006) and Period II (April 2006 to July 2016), respectively. 2) The average TWS variation was estimated to be −7.94 ± 0.22, −1.39 ± 1.35, and −8.38 ± 0.34 mm/yr for the entire period, Period I and Period II, respectively. 3) The average groundwater storage was estimated to be +1.56 ± 1.35 mm/yr during Period I. 4) The higher average groundwater depletion rate was calculated to be −6.05 ± 0.34 mm/yr during Period II. 5) Both soil texture and surface streams in the study area promote lateral flow and carry surface water to the Arabian Gulf and the Red Sea. 6) During Period II, average annual recharge rates were estimated to be +9.48 ± 2.37 and +4.20 ± 0.15 km3 for Saudi Arabia and the Saq aquifer, respectively. 7) This integrated approach is an informative and cost-effective technique to assess the variability of groundwater resources in large areas more efficiently.
Introduction
Water sustainability is a critical issue globally, given its importance for humans and ecosystems (United Nations, 2013; Bernauer and Böhmelt, 2020). Water sustainability is affected by anthropogenic water use and climatic conditions (United Nations, 2014; Wada et al., 2010). Globally, irrigation accounts for about 70% of water extraction and 90% of water consumption, with heavy groundwater withdrawal in arid regions (Siebert et al., 2010; Gerten et al., 2020).
Due to hot and arid climatic conditions, the water shortage has become a severe problem in the Arab region. Therefore, recognizing the impacts of climate change, population growth, economic development, and land management is a key strategy for achieving water security in this region (Trondalen, 2009). In addition, desertification is affecting the Middle East region, particularly Iraq, Syria, Jordan, and Iran.
Several methods have been applied to evaluate the hydrological behavior of aquifers using in situ observation techniques, such as modeling and chemical methods (de Vries and Simmers, 2002; Milewski et al., 2009; Scanlon et al., 2012). However, it is difficult to estimate the spatial and temporal variations of groundwater storage on a large scale using a relatively small number of scattered point measurements in these conventional methods. Moreover, the results of these methods are often questionable because they require significant efforts and resources to obtain. To solve these problems, several studies have been conducted to analyze and integrate the outputs of the Gravity Recovery and Climate Experiment (GRACE) and compare them with many climate models and in situ data (Wahr et al., 1998; Rodell and Famiglietti, 2001; Wahr et al., 2004; Syed et al., 2008; Longuevergne et al., 2010).
Many studies have been conducted to estimate the hydrological components and settings of large basins and transboundary aquifers in recent years. For example, Yeh et al. (1998), Yeh et al. (2006), and Rodell et al. (2007) applied GRACE, Global Land Data Assimilation System (GLDAS) data, and in situ observations to partition the water budget of the Mississippi River basin and obtained reasonable results. Wang et al. (2014) compared monthly total water storage variations obtained from GRACE with those estimated from water budget equations for 16 Canadian basins. In addition, some studies have combined GRACE and climate data with other relevant datasets to estimate changes in groundwater storage and evaluate rates of recharge, discharge, and depletion in aquifer systems in the Arab region (Mohamed et al., 2014; Mohamed et al., 2015; Ahmed and Abdelmohsen, 2018; Mohamed, 2019; Mohamed, 2020a; Mohamed, 2020b; Mohamed, 2020c; Mohamed, 2020d; Mohamed et al., 2021; Mohamed and Gonçalvès, 2021; Taha et al., 2021). On a continental scale, other global gravity field datasets from the Earth Gravitational model have been used to investigate the crustal structures (Mohamed and Al Deep, 2021). However, on a smaller scale, airborne and ground-based geophysical data have been used for groundwater studies, subsurface geology (Meneisy and Al Deep, 2020; Al Deep et al., 2021; Mohamed and Ella, 2021), magma chamber geometry (Mohamed et al., 2022), as well as for land subsidence due to groundwater over-pumping (Othman, 2019; Othman and Abotalib, 2019).
The GRACE satellites provide vertically integrated terrestrial water storage (ΔTWS) changes from regional to global scale. These TWS values are expressed in terms of groundwater storage (ΔGWS), surface water storage (ΔSWS), soil moisture storage (ΔSMS), and snow water equivalent (ΔSWE). However, GRACE cannot distinguish between the contributions from these components, due to the low horizontal resolution of GRACE data and the absence of its vertical resolution (Ahmed et al., 2016; Mohamed et al., 2017). To overcome this weakness, outputs of land surface models were integrated with GRACE data to enhance the horizontal resolution of the data, and to isolate individual components from the GRACE-derived ΔTWS estimates.
Fallatah et al. (2017) calculated the Saq aquifer’s depletion rates and found the governing factors that influence these depletions. However, Fallatah et al. (2019) went farther and calculated the modern recharge to the Saq aquifer, rather than only the depletion rates.
It is worth noting that the current work differs from those previous studies, where our current study aims to 1) provide the best estimate of the groundwater storage variability in the Saudi Arabia region and locally for the Saq aquifer using the spherical harmonics (SH) and mass concentration (mascon) GRACE-derived ΔTWS solutions and other climate datasets; and 2) quantify the modern recharge to the Saudi Arabia region and to the Saq aquifer. This aquifer is one of the most important aquifers in Saudi Arabia’s northern region. Findings were evidenced by results of land subsidence and water quality degradation. Conducting this study for this arid environment is important for agricultural activities, irrigation, and domestic use.
Geological and Hydrogeological Setting
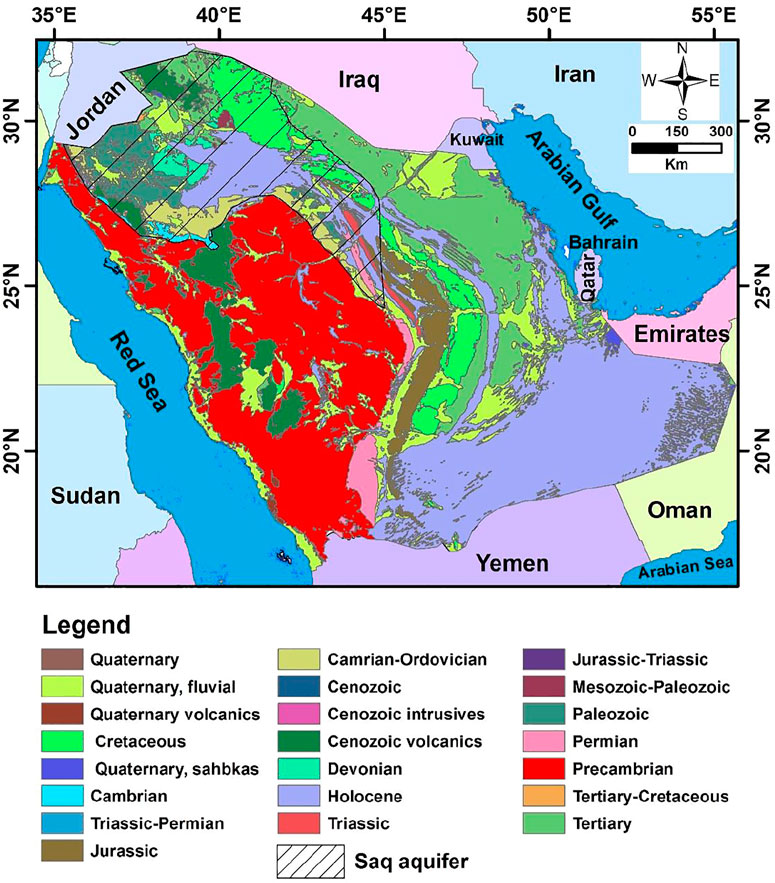
According to Tariki, (1947), Saudi Arabia is divided into two geological zones. The western zone is represented by Precambrian crystalline igneous and metamorphic rocks (Figure 1), sloping southeast, east, and northeast. The eastern zone consists of sedimentary rocks that dip eastward and overlay crystalline basement rocks (Figure 1). These sedimentary rocks are composed of Paleozoic, Mesozoic, Tertiary, and Recent deposits. The sedimentary basin can be divided into the Nejd and Hassa regions. In the eastern part of the Nejd region, sedimentary rocks of early Paleozoic to early Eocene are distributed, with alternating clastic and calcareous facies. Outcrop rocks in the Hassa region are represented by Tertiary and younger sequences, including lower to middle Eocene and Miocene to Pliocene. Most of the Eocene rocks are calcareous. The Miocene and Pliocene are formed by continental deposits, with some exceptions of intercalating marine strata.
The Arab world is one of the driest places on the planet. Due to a lack of surface water; the region relies heavily on groundwater supplies, and excessive water stress in the region is met with variable degrees of aquifer depletion and mining. As a result, numerous groundwater supplies are in the risk of depletion (Khater, 2010).
Climate change is considered as one of the most urgent environmental issues facing humanity. Environmental changes are expected from accelerated global climate change, which may affect groundwater sustainability. Several important initiatives are underway in Arabic countries to introduce integrated water resource management to address water scarcity (Khater, 2010). In the Arab region, groundwater is being consumed in large quantities due to the expansion of cultivation, urbanization, and industrialization. Climate change will likely impact the dynamics of groundwater availability and sustainability in the Arab world.
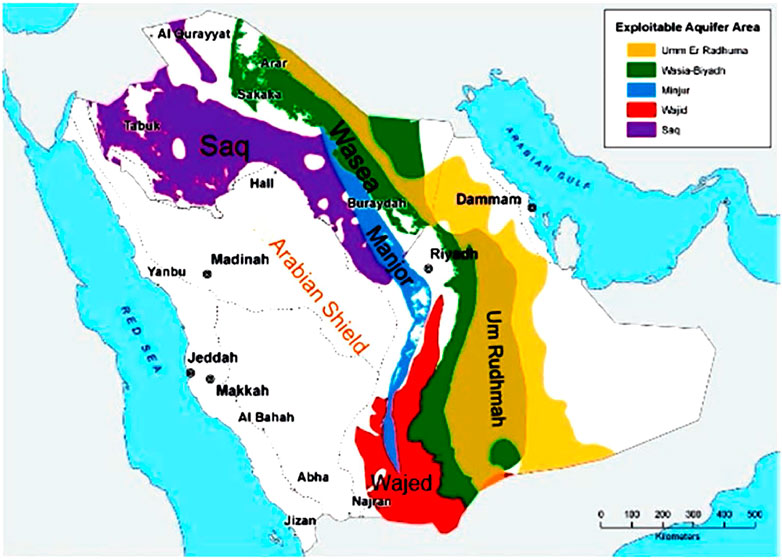
Saudi Arabia has two sources of groundwater: non-renewable groundwater comes from deep fossil aquifers, and renewable groundwater comes from shallow aquifers. These two sources account for 40% of Saudi Arabia’s water supply. The deep sandstone aquifer is of sedimentary origin and stores fossil water (DeNicola et al., 2015). Renewable groundwater is found in shallow and deep layers in alluvial valleys. However, the shallow aquifers are depleted due to high water extraction compared to recharge. Fossil groundwater is stored in six major sedimentary paleo-aquifers located in the eastern and central parts of the country (Figure 2). It is confined in sand and limestone formations of a thickness of about 300 m. One of these, the Saq aquifer (Figure 1), extends more than 1,200 km northward in the eastern part of the country (FAO, 2008).
Data and Methodology
The GRACE satellite is a joint US–German mission launched in 2002 and consists of twin satellites that measure spatial and temporal changes in the Earth’s gravitational field (Tapley et al., 2004). Changes in the Earth’s gravity field are mainly due to changes in water content.
Data from GRACE are processed at three different centers: The Jet Propulsion Laboratory (JPL), the Center for Space Research at the University of Texas at Austin (CSR-UTA), and German Research Centre for Geosciences (GFZ). These centers provide the monthly GRACE solutions using the RL05 spherical harmonic (SH) data (Tapley et al., 2004) as follows: 1) Removing the atmosphere and ocean signals. 2) The C20 from GRACE has a large uncertainty (Cheng et al., 2011), probably due to tidal and other aliasing, so it is replaced by the C20 obtained from satellite laser ranging. In addition, the first-order calculated coefficients (Swenson et al., 2008) are added. 3) Corrections for glacial isostatic adjustments (Geruo et al., 2013). 4) Minimization of correlation errors using a de-striping filter. 5) Minimization of random errors using a 300-km Gaussian filter.
We rescaled the GRACE-derived ΔTWS time series to minimize the effects of smoothing and truncation (Long et al., 2015) using a scale factor of 1.26 averaged from the NCAR-CLM4.0 model (Landerer and Swenson, 2012). As a result, the bi-monthly GRACE (CSR-SH and JPL-SH) solutions show relatively similar results, with minor differences being within the error range of GRACE. However, due to the significant noise reduction in the signals (Sakumura et al., 2014), the mean of the two rescaled solutions were used in the calculations.
The second GRACE source is the mascon solutions (release 06, version 1; CSR-M and JPL-M). These solutions provide high spatial resolution and minimum error because they capture all signals within the noise levels of GRACE. There is no need for spectral de-striping or smoothing filtering for these solutions. Moreover, these solutions do not require any scaling factor (Luthcke et al., 2013; Save et al., 2016; Wiese et al., 2016).
We used the monthly spherical harmonic (CSR-SH and JPL-SH) and mascon (CSR-M and JPL-M) GRACE solutions for the study area throughout the period. Next, we calculated the secular trend of the ΔTWS data by simultaneously fitting a trend term and a seasonal term to each TWS time series. Finally, the errors associated with the calculated trend values were estimated.
Monthly trends of non-groundwater components, such as soil moisture storage and surface water storage dam capacity data, are necessary to separate the ΔGWS variations in the study area. Therefore, these components must be removed from the GRACE-derived TWS variations. Due to the lack of data from the gauge stations in the study area, we used the land surface model (e.g., CLM) of GLDAS (Rodell et al., 2004), which can be downloaded from the Goddard Earth Sciences Data and Information Services Center (GES DISC). The CLM model of the land surface provides both monthly SMS and SWE data. The average of the monthly ΔSMS data of the LSM was used.
This study used annual data of surface water reservoirs of dams constructed in Saudi Arabia. These reservoirs may affect the water budget calculated from the GRACE signals and the ΔGWS values in the target area. Therefore, the SWS trend was calculated and removed from the ΔTWS trend.
In order to estimate changes in ΔGWS in the study area, it is necessary to remove the non-groundwater contribution from the changes in ΔTWS. The average of the non-groundwater outputs from the GLDAS CLM model was used, and Eq. 1 was applied (e.g., Rodell et al., 2009; Mohamed et al., 2017).
where ΔSMS, ΔSWS, and ΔSWE are variations in soil moisture, surface water, and snow water equivalent, respectively. ΔSWE is negligible.
Because climatic variability is thought to be one of the primary drivers of changes in ΔGWS, and continuous ground-based rainfall data are not available in the study area, monthly rainfall data from the Tropical Rainfall Measuring Mission (TRMM; http://disc.sci.gsfc.nasa.gov/) were employed (Kummerow, 1998; Huffman et al., 2007; Huffman et al., 2010). First, the rainfall data (April 2002 to July 2016) were processed to create total monthly rainfall images. Second, a monthly rainfall time series was generated by averaging the rainfall rates of all the grid points lying within the study area. Third, the average annual precipitation (AAP) (Figure 3) of the study area was calculated. Finally, the TRMM data were used to study the effect of rainfall on the changes in ΔGWS during the study period in Saudi Arabia.
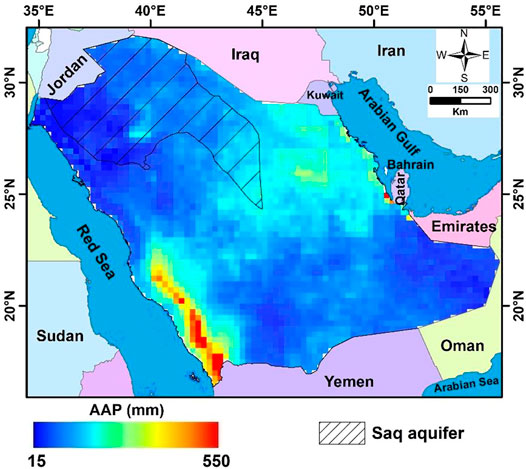
FIGURE 3. Average annual precipitation (mm) obtained from Tropical Rainfall Measuring Mission (TRMM) data collected across the study area from April 2002 to July 2016.
Results and Discussion
Analysis of Rainfall Data
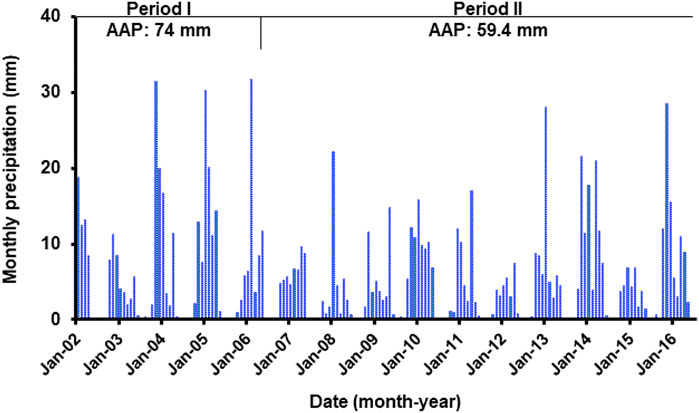
Figures 4, 5 depict the temporal fluctuations of the observed mean monthly rainfall over Saudi Arabia and the Saq aquifer, respectively. In the Middle East, two climatic periods have been defined based on the drought that occurred in 2007 (Mohamed, 2020b). As a result, we used the AAP to determine the two climatic periods that have dominated Saudi Arabia: Period I was from April 2002 to March 2006, and the AAP rate was as high as 90 mm/yr (Figure 4). Period II was from April 2006 to July 2016, after the onset of drought, and the AAP rate was as low as 72 mm/yr (Figure 4). In Saudi Arabia, the AAP rate was 76.4 mm/yr during the entire period (Table 1). In the southwestern mountainous highlands, the AAP rate was as high as 550 mm/yr (Figure 3). The Saq aquifer receives a minimum annual precipitation rate of 63.3 mm throughout the entire period (Table 2). Period I has a slightly higher precipitation rate of 74.0 mm/yr, whereas period II has a slightly lower rate of 59.4 mm/yr (Figure 5). Figure 6 shows the temporal variation of the SMS time series estimated from GLDAS in Saudi Arabia that ranged between −2.95 ± 0.003 mm/yr for Period I and −2.46 ± 0.008 mm/yr for Period II (Table 1). Soil moisture of the Saq aquifer varied from −3.14 ± 0.01 mm/yr estimated for Period I to −2.10 ± 0.02 mm/yr estimated for Period II (Table 2).
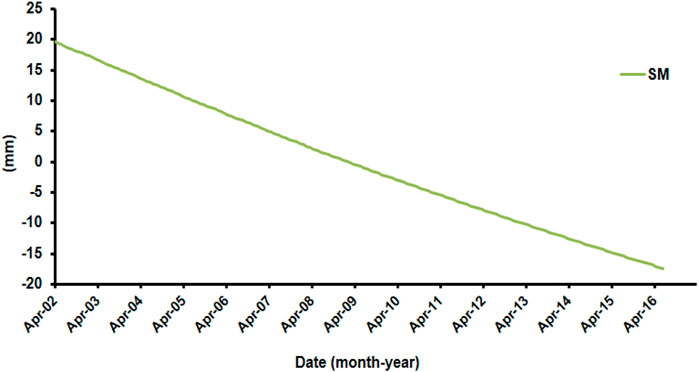
FIGURE 6. GLDAS-derived soil moisture (ΔSMS) across the whole study area throughout the investigated period.
Temporal Variations in ΔTWS
The secular trends of GRACE-derived TWS were calculated from the monthly SH (CSR-SH and JPL-SH) and mascon (CSR-M and JPL-M) solutions in Saudi Arabia. Their spatial distributions and average values are shown in Figures 7, 8 during the entire period. The figures show that Saudi Arabia had a general negative GRACE-derived TWS trend during the entire period (April 2002 to July 2016). The southern part of Saudi Arabia shows a positive TWS rate (+4.4 mm/year; Figure 7A), while the northern part shows a high TWS depletion rate (−18.1 mm/year; Figure 8B). A closer look at Figures 7A,B shows that the trend images extracted from the CSR-SH and JPL-SH solutions are similar. The images are also identical in spatial distribution but with small differences in magnitude. These values indicate that the trends of TWS vary from −12.9 and −15.7 to +4.4 and +3.2 from the CRS-SH and JPL-SH solutions, respectively throughout the entire period over the entire study area.
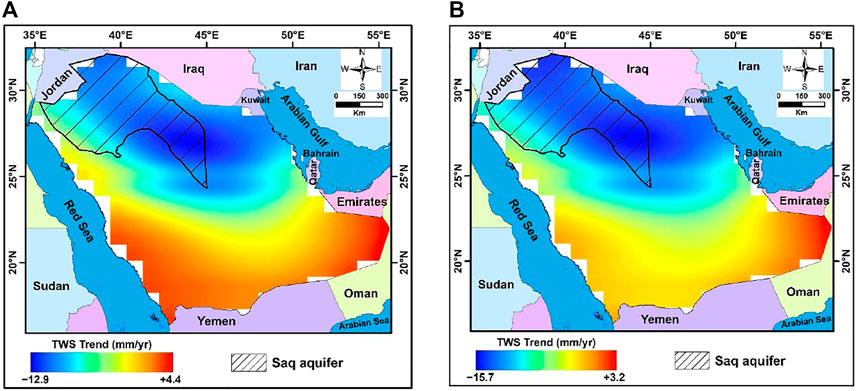
FIGURE 7. Secular Color-coded GRACE-derived ΔTWS trend map throughout the investigated period from averaging of the monthly CSR spherical harmonic solution (A), and JPL spherical harmonic solution (B) over the Saudi Arabia. Also showing the location of the Saq aquifer.
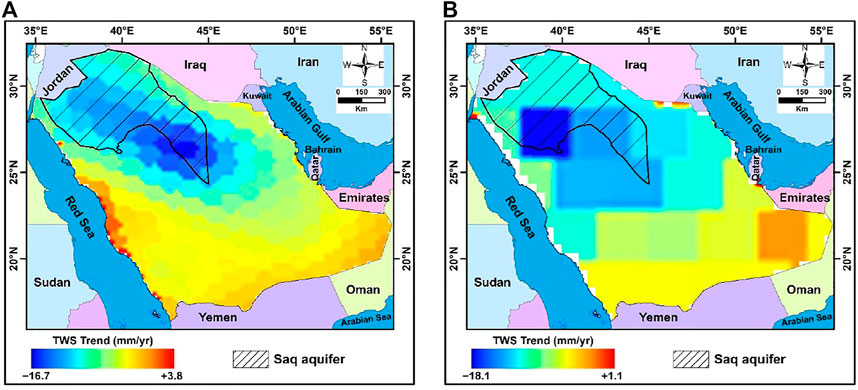
FIGURE 8. Secular Color-coded GRACE-derived ΔTWS trend map throughout the entire period from averaging of the CRS mascon solution (A), and JPL mascon solution (B) over the Saudi Arabia. Also showing the location of the Saq aquifer.
Figures 8A,B shows the secular trends of GRACE-estimated TWS from the mascon solutions. Their spatial distributions show a similar pattern to those estimated from the monthly spherical harmonic solutions in the study area. The results show that the TWS trends remain positive in the southeast. However, the northeastern area shows negative TWS trends. In the northern and central parts of Saudi Arabia, the TWS trend show highly negative values. The CSR-M and JPL-M solutions show quite different spatial distributions. However, their magnitudes are somewhat similar. The TWS trends of JPL-M and CRS-M range from −18.1 and −16.7 to +1.1 and +3.8 mm/yr, respectively, throughout the entire period (Figure 8).
The secular trends in TWS derived from GRACE (Figure 8) demonstrate that the Saq aquifer is experiencing a significant negative TWS trend for the entire period. Using JPL-SH and CRS-SH, the TWS trend shows values ranging from −13.7 and −12.9 mm/yr to −7.75 and −7.35 mm/yr, respectively (Figures 7A,B). The aquifer depletion appears to be localized over its southern part. Figures 8A,B reveals that over the Saq aquifer, TWS depletion values range from −16.8 and −18.1 to −7.8 and −9.0 mm/yr, using CRS-M and JPL-M, respectively.
Figure 9 shows the temporal variation of the TWS time series and secular trends in Saudi Arabia from different solutions (CSR-M, JPL-M, CSR-SH, and JPL-SH). The average values of monthly SH and mascon solutions are shown in Figure 10. Figures 9, 10 show that these solutions and their averages are in good agreement in the study area. In addition, a good correlation was achieved between the different data and their averages in the study area, varying between 0.92 and 0.96 (Figure 11).
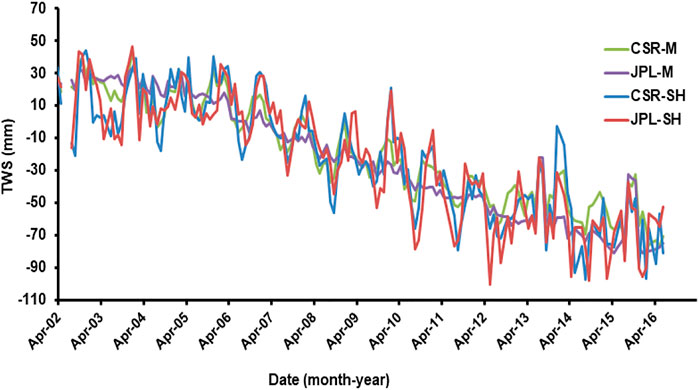
FIGURE 9. Time series for the terrestrial water storage obtained from various GRACE sources over the Saudi Arabia.
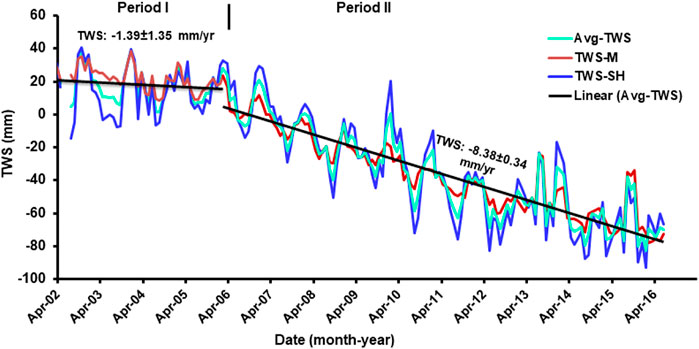
FIGURE 10. Time series for terrestrial water storage from averaging of the monthly GRACE spherical harmonic solutions (TWS-SH) and mascon solutions (TWS-M) and their averaging (Avg-TWS) across the Saudi Arabia.
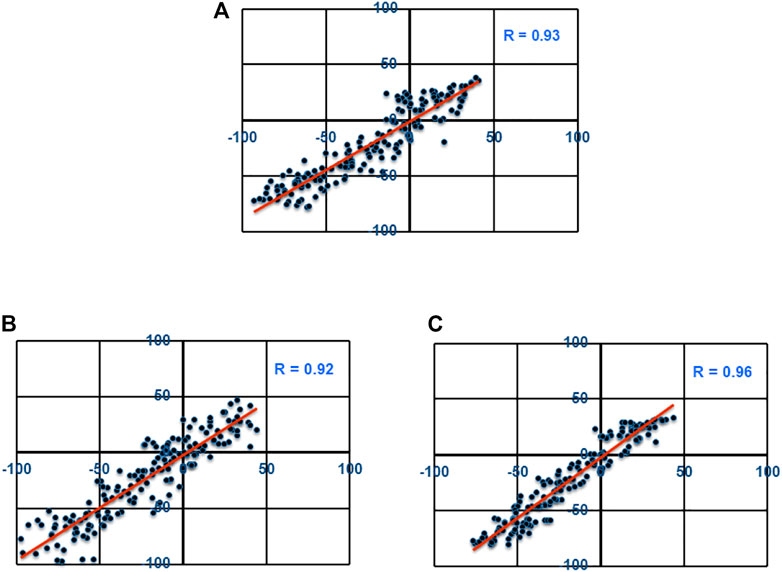
FIGURE 11. Correlation coefficients (R) between ΔTWS data from averaging of the monthly GRACE spherical harmonic solutions and averaging of the mascon solutions (A), monthly CSR spherical harmonic solution and monthly JPL spherical harmonic solution (B), CSR and JPL mascon solutions (C) over the Saudi Arabia throughout the investigated period.
The time series of ΔTWS (Figure 10) for the entire period, showing two distinct trends with different slope values, based on a linear regression analysis of the average of all TWS solutions. The first trend that characterizes Period I shows slightly negative signals and is calculated to be −1.39 ± 1.35 mm/yr (Figure 10; Table 1). In contrast, the second trend that characterizes Period II shows highly negative signals and is calculated to be −8.38 ± 0.34 mm/yr (Figure 10; Table 1). The entire period shows negative signals estimated to be −7.94 ± 0.22 mm/yr (Table 1). A closer inspection at Figure 12 reveals that over the Saq aquifer, the TWS has a lower negative value of −1.97 ± 0.67 mm/yr during Period I and a higher negative value of −12.25 ± 0.39 mm/yr during Period II. The entire period shows negative signals estimated to be −11.36 ± 0.26 mm/yr (Table 2).
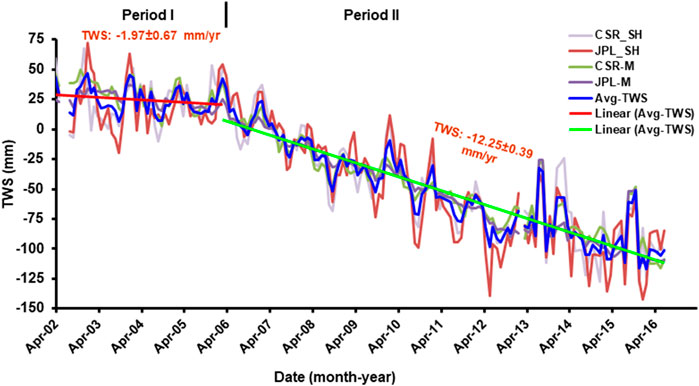
FIGURE 12. Time series for terrestrial water storage variation from various GRACE sources over the Saq aquifer and their averaging (Avg-TWS).
Temporal Variations in ΔGWS
The non-groundwater components, represented by ΔSMS, were subtracted from the ΔTWS trend value to estimate ΔGWS (Table 1; Figure 13). The variation in groundwater storage in Saudi Arabia shows values ranging from −0.43 ± 0.59 to +5.09 ± 2.26 mm/yr, with an average value of +1.56 ± 1.35 mm/yr for Period I. The GRACE-estimated GWS values for the Saq aquifer vary from −1.97 ± 1.33 to +4.76 ± 2.4 mm/yr, with an average value of +1.17 ± 0.67 mm/yr throughout period I (Table 2; Figure 14). However, the depletion in groundwater storage show higher rates ranging from −6.66 ± 0.58 to −4.72 ± 0.31 mm/yr, with an average value of −5.92 ± 0.34 mm/yr for Period II over the entire study area. The temporal variations in surface water reservoirs, represented by the constructed dams, are estimated to be +0.13 ± 0.03 mm/yr (Table 1) for Period II. We also subtracted this trend from the GRACE-derived TWS trend. As a result, the depletion rate of the aquifer is estimated to be −6.05 ± 0.34 mm/yr for Period II (Table 1). This higher depletion is caused by a large amount of groundwater extraction for anthropogenic activity and a decrease in rainfall throughout the study area after the start of the 2007 drought. This is also supported by the GRACE-calculated GWS over the Saq aquifer, which reveals a larger depletion rate during Period II, estimated at −10.16 ± 0.39 mm/yr (Table 2; Figure 14).
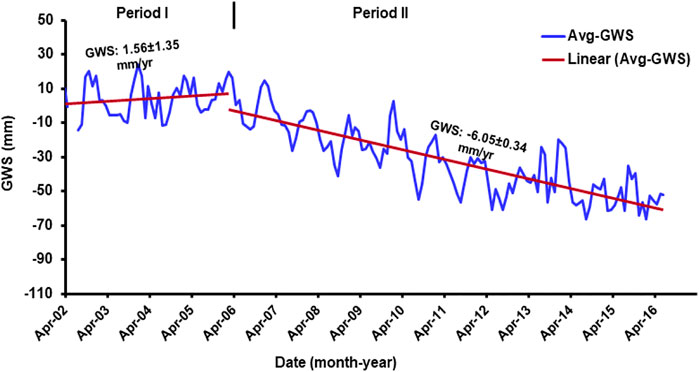
FIGURE 13. Time series for the averaging groundwater storage variations from the monthly spherical harmonic and Mascon solutions over the whole study area.
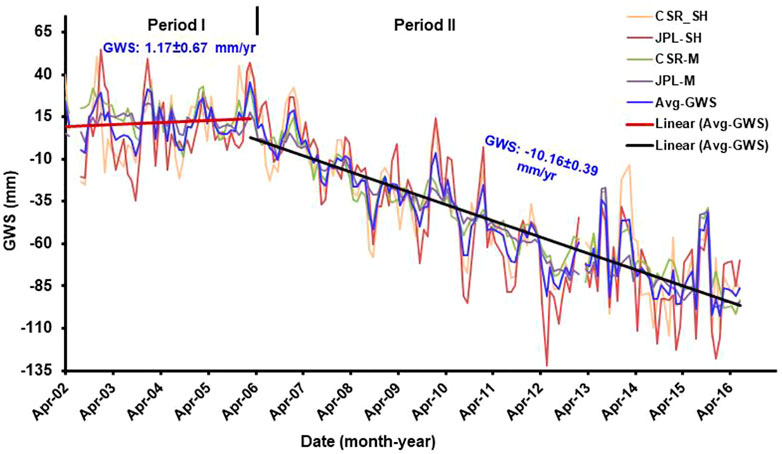
FIGURE 14. Time series for groundwater storage variation estimated from the different GRACE sources over the Saq aquifer and their averaging (Avg-GWS).
Surface Water Flow
Figure 15 shows an elevation map of Saudi Arabia created from ETOPO1 Global Relief Model. It can be seen that there is a difference in altitude from less than 100 m in a zone extending parallel to the Arabian Gulf and near the Emirates to more than 2,500 m in the southern part of the mountainous area near the Red Sea. More than half of Saudi Arabia is occupied by the Arabian–Nubian Shield, stretching parallel to the Red Sea coastal area. This area has highlands ranging from 500 to 2,900 m with dissected wadis, faults, and fissures. The mountainous highlands of southwestern Saudi Arabia receive substantial precipitation (Figure 3), which flows into the Arabian Gulf to the east. These streams may recharge the fractured basal aquifers in the southwest and the unconsolidated sands of Rub’ al Khali near the Saudi–Omani and the Saudi–UAE borders. This is evident from the positive GRACE signals in southern Saudi Arabia. However, small areas can be cultivated in the narrow valleys of the fractured basement. Moreover, the sandy soil of Rub’ al Khali cannot be cultivated because the terrain is covered with sand sheets and dunes up to 250 m high, interspersed by plains of gypsum and gravel. The reddish-orange color of the sand is due to the presence of feldspar.
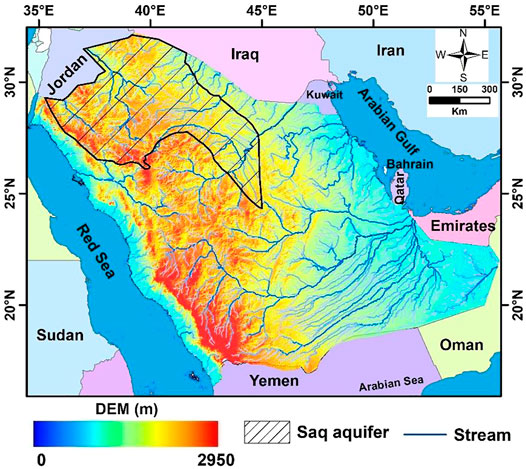
FIGURE 15. A map of the ground surface elevation based on a Digital Elevation Model (DEM) of the entire study area. The Saq aquifer’s distribution and the area’s stream networks are also shown.
Sediment Thickness
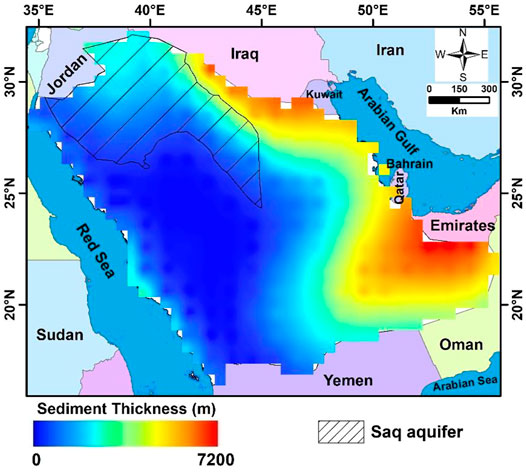
We extracted sediment thickness data from NOAA National Geophysical Data Center (Divins, 2003) and created a sediment thickness map for Saudi Arabia (Figure 16). It can be seen that the sediment thickness varies from 0 m in the Red Sea Hills to about 300 m in wadis that dissected those hills. Groundwater aquifers are present in the northern, eastern, and southeastern parts of the study area. The thickness of sediments in northern and eastern Saudi Arabia varies from about 1,000 m near the Red Sea Hills to more than 4,000 m downstream of the eastern border and more than 6,000 m in the eastern part of Rub’ al Khali. In this region, the aquifers are quite thick and are subject to intense exploitation due to low precipitation and subsequent poor recharge. According to the soil map of the Arabian Peninsula developed by De Pauw (2002), the shallow stony soils overlying the western mountainous highlands may be suitable for lateral flow rather than vertical recharge of deep aquifers.
Recharge Rate
The recharge mechanism is highly dependent on topography and soil composition (Wehbe et al., 2018). Most of the Arabian Peninsula is covered with thin and poorly developed soils, rich in gypsum, lime, and salts. These soils indicate that the area is dominantly arid, and most of the area is covered with sand dunes. Moreover, annual precipitation is less than 100 mm/yr (Figure 3) throughout Saudi Arabia, except for some parts of the Red Sea highlands. These indicate that Saudi Arabia receives little recharge over the entire area, except for a few areas with higher precipitation rates of good conditions.
Over-exploitation and agricultural development are primarily controlling the GWS variation during the study period in the Saq aquifer, assuming that the aquifer receives a low rate of precipitation. The groundwater in the Saq aquifer flows eastward following the slope from the low-sediment thickness area near the Red Sea Hills (Figure 16) to the higher-sediment thickness area near the Arabian Gulf. Natural discharge in the Arabian Gulf could occur in inland sabkhas close to the Gulf (Sultan et al., 2008). The unconfined zone in the recharge domains near to the Red Sea hilly area was thought to provide modern recharge to the Saq aquifer.
Eq. 2 was used to calculate the average recharge rate (Rn)
The average groundwater extraction rate (8.00 km3/yr; –21.39 mm/yr: Abunayyan, 2008) for each period was added to its GWS trend to compute the annual recharge value for the Saq aquifer (using Eq. 2). The natural discharge rate was considered to be insignificant.
During the investigated period, the recharge rate for the Saq aquifer was estimated to be +4.65 ± 0.10 km3/yr (+12.44 ± 0.27 mm/yr). During periods I and II, the Saq aquifer appears to be receiving modern recharge rates of +8.44 ± 0.65 km3/yr (+22.56 ± 0.67 mm/yr) and +4.20 ± 0.15 km3/yr (+11.23 ± 0.39 mm/yr), respectively (Table 2).
These recharge rates were computed using the aquifer average discharge rate of 8.00 km3/yr (Abunayyan, 2008). Our findings are consistent with those calculated for the Saq aquifer by Fallatah et al. (2019), who showed that the Saq aquifer received a modern recharge rate of +11.85 ± 0.22 mm/yr (+5.21 ± 0.10 km3/yr) using GRACE data during the period of April 2002 to December 2016.
The observed TWS depletion across the whole study area and the Saq aquifer is mostly due to increased anthropogenic activities and groundwater extraction that cannot be compensated for by groundwater flow and/or recharge rate.
Saudi Arabia is the world’s largest country without running surface water and has one of the world’s highest water use rates. Providing additional supplies of potable water for the Kingdom’s growing population and economy has long been a national priority for the desert kingdom. The total estimated volume of the average annual recharge rate for the country was obtained by adding the available groundwater withdrawal rate for Period II, averaged for the years of 2007–2017 (– 22.48 ± 2.25 km3/yr; −10.46 ± 1.05 mm/yr; FAO, 2022) to the to the GRACE-derived ΔGWS rate using Eq. 2. For the groundwater withdrawal values, a ten percent error estimate was used. The average annual recharge was estimated to be +4.41 ± 1.10 mm/yr (+9.48 ± 2.37 km3/yr) for the Saudi Arabia (Table 1). However, the country is experiencing severe water shortages, according to the scarcity index (Smakhtin, et al., 2004), and the majority of the country’s areas have been intensively exploited to over-exploited groundwater. The majority of this recharge rate happens in inaccessible areas like the unconsolidated sands of the Rub’ al Khali in southern Saudi Arabia and narrow wadies in the basement rocks that cover most of eastern Saudi Arabia. Saudi Arabia should build more water desalination plants and more dams for water collection in the wadies to meet rising demand due to the country’s growing population. Moreover, the country should increase water transfer efficiency and reduce waste. Furthermore, more wastewater treatment plants should be built to produce grey water, which can be utilized to irrigate crops and be reused in industrial processes.
Uncertainty Estimates
The uncertainty of the monthly variation of ΔGWS and its trend is calculated using Eq. 3 according to independent error sources. Finally, we applied a Student’s t-test to analyze the calculated trend data of ΔGWS.
where (σGWS), (σTWS), and (σSMS) represent the errors associated with GWS, TWS, and SMS, respectively. The error in ΔGWS was estimated from the errors associated with TWS and SMS using Eq. 3.
Consequences of Heavy Groundwater Extraction
Several locally reported data were addressed in this section to demonstrate the effects of excessive groundwater pumping.
Land Subsidence
The Saq sandstone aquifer is widely exposed in central and northern Saudi Arabia (Figure 1). The aquifer has a large subsurface extension with an area of about 31 × 104 km2 and a thickness of 250–700 m (UN-ESCWA and BGR, 2013). The main Saq aquifer accounts for 65% of the production, especially in central Saudi Arabia. In central and northern Saudi Arabia, groundwater levels are declining due to increased anthropogenic activities and massive extraction of groundwater. As a result, fractured cavities are formed underground, which are considered to have a serious impact on the stability of the ground, such as the occurrence of sinkholes and associated cracks and land subsidence. Othman and Abotalib, (2019) found that intense extraction of fossil groundwater causes land subsidence, collapse features, and ground fracturing in central Saudi Arabia. However, the massive extraction of groundwater cannot be balanced by the small amount of recharge in the mountainous highlands.
Degradation of Water Quality
The concentration of different types of salts in the water determines the water’s quality. Excessive groundwater extraction from an aquifer can lead to water quality degradation. As a result, it may be incompatible with a wide range of applications. The average groundwater level in six piezometric wells in the Saq aquifer decreased from 597 to 526 m above mean sea level between 2002 and 2013. (Al-Naeem, 2014). The total groundwater salinity of the aquifer is impaired in the unconfined zone due to excessive extraction, which causes more mineralized water from lower depths to rise to the surface (Al-Naeem, 2014). Over-irrigation and runoff losses from irrigated regions cause saline drainage water to percolate deeply, resulting in water quality degradation. The significant positive correlation (R2 = 0.914–0.998) between borehole depth and water salinity in both the confined and unconfined zones of the Saq aquifer demonstrates that groundwater quality deteriorates with depth because salinity is higher at deeper depths than at shallower depths (Al-Naeem, 2014).
Conclusion
During the study period (April 2002 to July 2016), two different climatic periods were recognized based on the analysis of the rainfall in Saudi Arabia: Period I (April 2002 to March 2006) with a higher average annual precipitation (AAP) of 90 mm/yr and Period II (April 2006 to July 2016) with a lower AAP of 72 mm/yr. The integrated outputs showed that Saudi Arabia was subjected to groundwater depletion after the drought and heavy groundwater extraction starting in 2007. The ΔGWS rate was calculated to be +1.56 ± 1.35 mm/yr for Period I, while higher ΔGWS depletion rate was estimated to be −6.05 ± 0.34 mm/yr for Period II over the Saudi Arabia, with an overall depletion rate of −5.33 ± 0.22 mm/yr during the entire period. The average annual recharge for the Saudi Arabia was estimated to be +9.48 ± 2.37 km3 (+4.41 ± 1.10 mm/yr) during Period II. The Saq aquifer was presumably recharged at a rate of +4.65 ± 0.10 km3 (+12.44 ± 0.27 mm/yr) during the entire investigated period (April 2002-July 2016), using an annual groundwater extraction rate of 8 km3 from the aquifer as a constant. However, it does not appear that water abstraction in the aquifer is balanced by groundwater flow and recharge from the highlands. Moreover, the Saq aquifer received only 63.3 mm/yr of rainfall over the entire period. In arid areas, the combined GRACE and GLDAS datasets provide a more precise assessment of water mass fluctuations.
Data Availability Statement
The raw data supporting the conclusions of this article will be made available by the authors, without undue reservation.
Author Contributions
All authors listed have made a substantial, direct, and intellectual contribution to the work and approved it for publication.
Conflict of Interest
The authors declare that the research was conducted in the absence of any commercial or financial relationships that could be construed as a potential conflict of interest.
Publisher’s Note
All claims expressed in this article are solely those of the authors and do not necessarily represent those of their affiliated organizations, or those of the publisher, the editors and the reviewers. Any product that may be evaluated in this article, or claim that may be made by its manufacturer, is not guaranteed or endorsed by the publisher.
Acknowledgments
Deep thanks and gratitude to the Researchers Supporting Project number (RSP-2021/351), King Saud University, Riyadh, Saudi Arabia for funding this research article.
References
A, G., Wahr, J., and Zhong, S. (2013). Computations of the Viscoelastic Response of a 3-D Compressible Earth to Surface Loading: an Application to Glacial Isostatic Adjustment in Antarctica and Canada. Geophys. J. Int. 192 (2), 557–572. doi:10.1093/gji/ggs030
Abunayyan, B. R. G. M. (2008). Investigations for Updating the Groundwater Mathematical Model(s) of the Saq Overlying Aquifers Ministry of Water and Electricity 1. Riyadh, Saudi Arabia: Abunayyan Trading Corporation. BRGM Geosciences for a sustainable Earth.
Ahmed, M., and Abdelmohsen, K. (2018). Quantifying Modern Recharge and Depletion Rates of the Nubian Aquifer in Egypt. Surv. Geophys. 39, 729–751. doi:10.1007/s10712-018-9465-3
Ahmed, M., Sultan, M., Yan, E., and Wahr, J. (2016). Assessing and Improving Land Surface Model Outputs over Africa Using GRACE, Field, and Remote Sensing Data. Surv. Geophys. 37 (3), 529–556. doi:10.1007/s10712-016-9360-8
Al Deep, M., Araffa, S. A. S., Mansour, S. A., Taha, A. I., Mohamed, A., and Othman, A. (2021). Geophysics and Remote Sensing Applications for Groundwater Exploration in Fractured Basement: A Case Study from Abha Area, Saudi Arabia. J. Afr. Earth Sci. 184 (1), 104368. doi:10.1016/j.jafrearsci.2021.104368
Al-Naeem, A. A. (2014). Effect of Excess Pumping on Groundwater Salinity and Water Level in Hail Region of Saudi Arabia. Research Journal of Environmental Toxicology 8, 124–135.
Bernauer, T., and Böhmelt, T. (2020). International Conflict and Cooperation over Freshwater Resources. Nat. Sustain. 3, 350–356. doi:10.1038/s41893-020-0479-8
Cheng, M., Ries, J. C., and Tapley, B. D. (2011). Variations of the Earth's Figure axis from Satellite Laser Ranging and GRACE. J. Geophys. Res. 116, B01409. doi:10.1029/2010JB000850
De Pauw, E. (2002). An Agroecological Exploration of the Arabian Peninsula. Beirut: International Center for Agricultural Research in the Dry Areas.
de Vries, J. J., and Simmers, I. (2002). Groundwater Recharge: an Overview of Processes and Challenges. Hydrogeology J. 10, 5–17. doi:10.1007/s10040-001-0171-7
DeNicola, E., Aburizaiza, O. S., Siddique, A., Siddique, A., Khwaja, H., and Carpenter, D. O. (2015). Climate Change and Water Scarcity: the Case of Saudi Arabia. Ann. Glob. Health 81 (3), 342–353. doi:10.1016/j.aogh.2015.08.005
Divins, D. (2003). Total Sediment Thickness of the World’s Oceans and Marginal Seas. Boulder, CO: NOAA National Geophysical Data Center.
Fallatah, O. A., Ahmed, M., Cardace, D., Boving, T., and Akanda, A. S. (2019). Assessment of Modern Recharge to Arid Region Aquifers Using an Integrated Geophysical, Geochemical, and Remote Sensing Approach. J. Hydrol. 569, 600–611. doi:10.1016/j.jhydrol.2018.09.061
Fallatah, O. A., Ahmed, M., Save, H., and Akanda, A. S. (2017). Quantifying Temporal Variations in Water Resources of a Vulnerable Middle Eastern Transboundary Aquifer System. Hydrol. Process. 2017, 1–11. doi:10.1002/hyp.11285
FAO (2008). AQUASTAT Country Profile – Saudi Arabia. Rome, Italy: Food and Agriculture Organization of the United Nations.
Gerten, D., Heck, V., Jägermeyr, J., Bodirsky, B. L., Fetzer, I., Jalava, M., et al. (2020). Feeding Ten Billion People Is Possible within Four Terrestrial Planetary Boundaries. Nat. Sustain. 3 (3), 200–208. doi:10.1038/s41893-019-0465-1
Huffman, G. J., Adler, R. F., Bolvin, D. T., and Nelkin, E. J. (2010). “The TRMM Multi-Satellite Precipitation Analysis (TMPA),” in Chapter 1 in Satellite Applications for Surface Hydrology. Editors F. Hossain, and M. Gebremichael (Springer-Verlag), 3–22. doi:10.1007/978-90-481-2915-7_1
Huffman, G. J., Bolvin, D. T., Nelkin, E. J., Wolff, D. B., Adler, R. F., Gu, G., et al. (2007). The TRMM Multisatellite Precipitation Analysis (TMPA): Quasi-Global, Multiyear, Combined-Sensor Precipitation Estimates at fine Scales. J. Hydrometeorology 8, 38–55. doi:10.1175/jhm560.1
Khater, A. R. (2010). Regional Technical Report on the Impacts of Climate Change on Groundwater in the Arab Region. Regional Bureau for Science and Technology. in Arab States. Technical Document Published by UNESCO Cairo Office.
Kummerow, C. (1998). Beamfilling Errors in Passive Microwave Rainfall Retrievals. J. Appl. Meteorol. 37, 356–370. doi:10.1175/1520-0450(1998)037<0356:beipmr>2.0.co;2
Landerer, F. W., and Swenson, S. C. (2012). Accuracy of Scaled GRACE Terrestrial Water Storage Estimates. Water Resour. Res. 48 (4). doi:10.1029/2011WR011453.W04531
Long, D., Longuevergne, L., and Scanlon, B. R. (2015). Global Analysis of Approaches for Deriving Total Water Storage Changes from GRACE Satellites. Water Resour. Res. 51, 2574–2594. doi:10.1002/2014wr016853
Longuevergne, L., Scanlon, B. R., and Wilson, C. R. (2010). GRACE Hydrological Estimates for Small Basins: Evaluating Processing Approaches on the High Plains Aquifer, USA. Water Resour. Res. 46, W11517. doi:10.1029/2009WR008564
Luthcke, S. B., Sabaka, T. J., Loomis, B. D., Arendt, A. A., McCarthy, J. J., and Camp, J. (2013). Antarctica, Greenland and Gulf of Alaska Land-Ice Evolution from an Iterated GRACE Global Mascon Solution. J. Glaciol. 59, 613–631. doi:10.3189/2013JoG12J147
Meneisy, A. M., and Al Deep, M. (2021). Investigation of Groundwater Potential Using Magnetic and Satellite Image Data at Wadi El Amal, Aswan, Egypt. Egypt. J. Remote Sensing Space Sci. 24, 293–309. doi:10.1016/j.ejrs.2020.06.006
Milewski, A., Sultan, M., Yan, E., Becker, R., Abdeldayem, A., Soliman, F., et al. (2009). A Remote Sensing Solution for Estimating Runoff and Recharge in Arid Environments. J. Hydrol. 373, 1–14. doi:10.1016/j.jhydrol.2009.04.002
Mohamed, A. (2020d). Time-lapse Gravity Monitoring of Groundwater of the Sinai Peninsula. Int. J. Earth Sci. Geophys. 6 (2). doi:10.35840/2631-5033/1840
Mohamed, A., Al Deep, M., Abdelrahman, K., and Abdelrady, A. (2022). Geometry of the Magma Chamber and Curie Point Depth Beneath Hawaii Island: Inferences From Magnetic and Gravity data.. Frontiers in Earth Science, section Solid Earth Geophysics 10, 847984 doi:10.3389/feart.2022.847984
Mohamed, A., and Al Deep, M. (2021). Depth to the Bottom of the Magnetic Layer, Crustal Thickness, and Heat Flow in Africa: Inferences from Gravity and Magnetic Data. J. Afr. Earth Sci. 179, 104204. doi:10.1016/j.jafrearsci.2021.104204
Mohamed, A., and Ella, E. M. A. E. (2021). Magnetic Applications to Subsurface and Groundwater Investigations: a Case Study from Wadi El Assiuti, Egypt. Ijg 12, 77–101. doi:10.4236/ijg.2021.122006
Mohamed, A., and Gonçalvès, J. (2021). Hydro-geophysical Monitoring of the North Western Sahara Aquifer System's Groundwater Resources Using Gravity Data. J. Afr. Earth Sci. 178, 104188. doi:10.1016/j.jafrearsci.2021.104188
Mohamed, A. (2020b). Gravity Applications in Estimating the Mass Variations in the Middle East: a Case Study from Iran. Arab J. Geosci. 13, 364. doi:10.1007/s12517-020-05317-7
Mohamed, A. (2020c). Gravity Applications to Groundwater Storage Variations of the Nile Delta Aquifer. J. Appl. Geophys. 182, 104177. doi:10.1016/j.jappgeo.2020.104177
Mohamed, A. (2020a). Gravity Based Estimates of Modern Recharge of the Sudanese Area. J. Afr. Earth Sci. 163, 103740. doi:10.1016/j.jafrearsci.2019.103740
Mohamed, A. (2019). Hydro-geophysical Study of the Groundwater Storage Variations over the Libyan Area and its Connection to the Dakhla basin in Egypt. J. Afr. Earth Sci. 157, 103508. doi:10.1016/j.jafrearsci.2019.05.016
Mohamed, A., Ragaa Eldeen, E., and Abdelmalik, K. (2021). Gravity Based Assessment of Spatio-Temporal Mass Variations of the Groundwater Resources in the Eastern Desert, Egypt. Arab. J. Geosci. 14, 500. doi:10.1007/s12517-021-06885-y
Mohamed, A., Sultan, M., Ahmed, M., Yan, E., and Ahmed, E. (2017). Aquifer Recharge, Depletion, and Connectivity: Inferences from GRACE, Land Surface Models, and Geochemical and Geophysical Data. Geol. Soc. America Bull. 129, 534–546. doi:10.1130/B31460.1
Mohamed, A., Sultan, M., Ahmed, M., and Yan, E. (2014). Quantifying Modern Recharge to the Nubian Sandstone Aquifer System: Inferences from GRACE and Land Surface Models. San Francisco, CA: American Geophysical Union.
Mohamed, A., Sultan, M., Yan, E., Ahmed, M., Sturchio, N., and Ahmed, E. (2015). Towards a Better Understanding of the Hydrologic Setting of the Nubian Sandstone Aquifer System: Inferences from Groundwater Flow Models, Cl-36 Ages, and GRACE Data. San Francisco, CA: American Geophysical Union.
Othman, A., and Abotalib, A. Z. (2019). Land Subsidence Triggered by Groundwater Withdrawal under Hyper-Arid Conditions: Case Study from Central Saudi Arabia. Environ. Earth Sci. 78 (7), 243. doi:10.1007/s12665-019-8254-8
Othman, A. (2019). “Measuring and Monitoring Land Subsidence and Earth Fissures in Al- Qassim Region, Saudi Arabia: Inferences from InSAR,” in Advances in Remote Sensing and Geo Informatics Applications. CAJG 2018. Advances in Science, Technology & Innovation (IEREK Interdisciplinary Series for Sustainable Development). Editors H. El-Askary, S. Lee, E. Heggy, and B. Pradhan (Cham: Springer). doi:10.1007/978-3-030-01440-7_66
Rodell, M., Chen, J., Kato, H., Famiglietti, J. S., Nigro, J., and Wilson, C. R. (2007). Estimating Groundwater Storage Changes in the Mississippi River basin (USA) Using GRACE. Hydrogeol. J. 15, 159–166. doi:10.1007/s10040-006-0103-7
Rodell, M., Chen, J., Kato, H., Famiglietti, J. S., Nigro, J., and Wilson, C. R. (2007). Estimating Groundwater Storage Changes in the Mississippi River basin (USA) Using GRACE. Hydrogeol J. 15 (1), 159–166. doi:10.1007/s10040-006-0103-7
Rodell, M., and Famiglietti, J. S. (2001). An Analysis of Terrestrial Water Storage Variations in Illinois with Implications for the Gravity Recovery and Climate Experiment (GRACE). Water Resour. Res. 37, 1327–1339. doi:10.1029/2000wr900306
Rodell, M., Houser, P. R., Jambor, U., Gottschalck, J., Mitchell, K., Meng, C.-J., et al. (2004). The Global Land Data Assimilation System. Bull. Amer. Meteorol. Soc. 85, 381–394. doi:10.1175/BAMS-85-3-381
Sakumura, C., Bettadpur, S., and Bruinsma, S. (2014). Ensemble Prediction and Intercomparison Analysis of GRACE Time-Variable Gravity Field Models. Geophys. Res. Lett. 41, 1389–1397. doi:10.1002/2013GL058632
Save, H., Bettadpur, S., and Tapley, B. D. (2016). High-resolution CSR GRACE RL05 Mascons. J. Geophys. Res. Solid Earth 121, 7547–7569. doi:10.1002/2016JB013007
Scanlon, B. R., Longuevergne, L., and Long, D. (2012). Ground Referencing GRACE Satellite Estimates of Groundwater Storage Changes in the California Central Valley, USA. Water Resour. Res. 48, 1–9. doi:10.1029/2011WR011312
Siebert, S., Burke, J., Faures, J. M., Frenken, K., Hoogeveen, J., Döll, P., et al. (2010). Groundwater Use for Irrigation - a Global Inventory. Hydrol. Earth Syst. Sci. 14, 1863–1880. doi:10.5194/hess-14-1863-2010
Smakhtin, V., Revenga, C., and Döll, P. (2004). A Pilot Global Assessment of Environmental Water Requirements and Scarcity. Water Int. 29, 307–317. doi:10.1080/02508060408691785
Sultan, M., Sturchio, N., Al Sefry, S., Milewski, A., Becker, R., Nasr, I., et al. (2008). Geochemical, Isotopic, and Remote Sensing Constraints on the Origin and Evolution of the Rub Al Khali Aquifer System, Arabian Peninsula. J. Hydrol. 356, 70–83. doi:10.1016/j.jhydrol.2008.04.001
Swenson, S., Chambers, D., and Wahr, J. (2008). Estimating Geocenter Variations from a Combination of GRACE and Ocean Model Output. J. Geophys. Res. 113, B08410. doi:10.1029/2007jb005338
Syed, T. H., Famiglietti, J. S., Rodell, M., Chen, J., and Wilson, C. R. (2008). Analysis of Terrestrial Water Storage Changes from GRACE and GLDAS. Water Resour. Res. 44, W02433. doi:10.1029/2006WR005779
Taha, A. I., Al Deep, M., and Mohamed, A. (2021). Investigation of Groundwater Occurrence Using Gravity and Electrical Resistivity Methods: a Case Study from Wadi Sar, Hijaz Mountains, Saudi Arabia. Arab. J. Geosci. 14, 334. doi:10.1007/s12517-021-06628-z
Tapley, B. D., Bettadpur, S., Watkins, M., and Reigber, C. (2004). The Gravity Recovery and Climate experiment: Mission Overview and Early Results. Geophys. Res. Lett. 31. doi:10.1029/2004GL019920
Tariki, A. H. (1947). Geology of Saudi Arabia, MSc Thesis. Austin, Texas: University of Texas at Austin.
Trondalen, (2009). “Climate Changes, Water Security and Possible Remedies for the Middle East. From Potential Conflict to Co-operation Potential,” in The United Nations World Water Development Report 3, Water in a Changing World. The United Nations Educational, Scientific and Cultural Organization, 7: University of Texas at Austin.
UN-ESCWABGR (2013). United Nations economic and social commission for western Asia; Bundesanstaltfu¨ r Geowissenschaften und Rohstoffe. Beirut, Lebanon: Inventory of Shared Water Resources in Western Asia.
Wada, Y., Van Beek, L. P. H., Van Kempen, C. M., Reckman, J. W. T. M., Vasak, S., and Bierkens, M. F. P. (2010). Global Depletion of Groundwater Resources. Geophys. Res. Lett. 37 (20). doi:10.1029/2010gl044571
Wahr, J., Molenaar, M., and Bryan, F. (1998). Time Variability of the Earth’s Gravity Field: Hydrological and Oceanic Effects and Their Possible Detection Using GRACE. J. Geophys. Res. 103, 30. doi:10.1029/98jb02844
Wahr, J., Swenson, S., Zlotnicki, V., and Velicogna, I. (2004). Time-Variable Gravity From GRACE: First Results. Geophys. Res. Lett. doi:10.1029/2004GL019779
Wang, S., Huang, J., Li, J., Rivera, A., McKenney, D. W., and Sheffield, J. (2014). Assessment of Water Budget for Sixteen Large Drainage Basins in Canada. J. Hydrol. 512, 1–15. doi:10.1016/j.jhydrol.2014.02.058
Wehbe, Y., Temimi, M., Ghebreyesus, D. T., Milewski, A., Norouzi, H., and Ibrahim, E. (2018). Consistency of Precipitation Products over the Arabian Peninsula and Interactions with Soil Moisture and Water Storage. Hydrological Sci. J. 63 (3), 408–425. doi:10.1080/02626667.2018.1431647
Wiese, D. N., Landerer, F. W., and Watkins, M. M. (2016). Quantifying and Reducing Leakage Errors in the JPL RL05M GRACE Mascon Solution. Water Resour. Res. 52, 7490–7502. doi:10.1002/2016WR019344
Yeh, P. J.-F., Irizarry, M., and Eltahir, E. A. B. (1998). Hydroclimatology of Illinois: A comparison of Monthly Evaporation Estimates Based on Atmospheric Water Balance With Estimates Based on Soil Water Balances. J. Geophys. Res. 103 (D16), 19823–19837.
Keywords: Saudi Arabia, Saq aquifer, time-variable gravity, rainfall, groundwater, depletion, recharge
Citation: Mohamed A, Abdelrahman K and Abdelrady A (2022) Application of Time-Variable Gravity to Groundwater Storage Fluctuations in Saudi Arabia. Front. Earth Sci. 10:873352. doi: 10.3389/feart.2022.873352
Received: 10 February 2022; Accepted: 04 March 2022;
Published: 07 April 2022.
Edited by:
Ahmed M. Eldosouky, Suez University, EgyptReviewed by:
Omid Memarian Sorkhabi, University of Isfahan, IranEbong D. Ebong, University of Calabar, Nigeria
Mohammed Hassoup, Sohag University, Egypt
Salem Barbary, Nuclear Materials Authority, Egypt
Copyright © 2022 Mohamed, Abdelrahman and Abdelrady. This is an open-access article distributed under the terms of the Creative Commons Attribution License (CC BY). The use, distribution or reproduction in other forums is permitted, provided the original author(s) and the copyright owner(s) are credited and that the original publication in this journal is cited, in accordance with accepted academic practice. No use, distribution or reproduction is permitted which does not comply with these terms.
*Correspondence: Ahmed Mohamed, YWhtZWRtb2hhbWVkQGF1bi5lZHUuZWc=
 Ahmed Mohamed
 Kamal Abdelrahman
 Ahmed Abdelrady