 Jian Li
 Shichang Li
 Yu Zhang3*
 Zhangjun Dai
94% of researchers rate our articles as excellent or good
Learn more about the work of our research integrity team to safeguard the quality of each article we publish.
Find out more
ORIGINAL RESEARCH article
Front. Earth Sci., 25 July 2022
Sec. Geohazards and Georisks
Volume 10 - 2022 | https://doi.org/10.3389/feart.2022.872040
This article is part of the Research TopicGeological Disasters in Deep Engineering Mechanism, Warning and Risk mitigationView all 39 articles
In view of strict deformation control standards, it is important to calculate the shallow tunnel deformation caused by the unloading of overburdened soil for analyzing tunnel structure safety. Due to the obvious nonlinear characteristics and the significantly smaller rebound deformation of soil under unloading conditions, previous numerical calculation methods need to be improved and adapted to the soil deformation characteristics under unloading. Based on the above background, cyclic loading and unloading tests were carried out to study the deformation characteristics of soil under different loading levels, stress history, and unloading levels. Secondly, a unified modulus calculation model was established, especially for the unloading modulus, which considers the unloading stress history and current unloading stress level, and can provide the value of soil modulus in different states. The relationship between the unloading rebound modulus Esc and the rebound modulus Ec0 used in the numerical simulation was studied. Finally, a set of numerical calculation and analysis methods for shallow tunnel deformation caused by overlying soil excavation based on its rebounding characteristics is proposed. The rationality of the method is verified by two examples, and is applied to a practical project.
With the development of urbanization, there are increasing instances of cross-geotechnical engineering. As this new engineering is close to the existing engineering, it is necessary to carry out calculations and analyses of the influence of new engineering on the existing engineering (Zhang et al., 2018a; Zhang et al., 2018b; Jiang et al., 2020). Civil structure constructions adjacent to subway tunnels are the most common cross-geotechnical engineering in the city (Chang et al., 2001; Sharma et al., 2001; Hu et al., 2003; Chen and Zhang, 2004; Wang and Yu, 2004). As subway tunnels undertake a large number of urban public transport functions, urban management needs to ensure the safe operation of these tunnels. For the problem of shallow tunnel deformation caused by adjacent engineering, many scholars have carried out relevant research and solved academic problems to a certain extent. At present, the calculation of shallow tunnel deformation caused by adjacent engineering can be divided into two categories: one is theoretical calculation methods (Wang et al., 2006; Devriendt et al., 2010; Liu et al., 2010; Huang et al., 2013; Shi and Ng, 2015; Liang et al., 2017); the other is numerical calculations (Chen and Li, 2005; Zhang et al., 2013a; Zhang et al., 2013b; Zh ang et al., 2015; Liang et al., 2017; Qiu et al., 2021). These two kinds of methods have characteristics and advantages.
The characteristics of the theoretical calculation method are to treat the tunnel as a discretized beam structure. By assuming that the discrete elements meet certain mechanical balance conditions, the mechanical balance equations of the tunnel are established, and the deformation of the tunnel is calculated by solving the balance equations. The advantage of the theoretical method is that it is easy for engineers to calculate the deformation of the tunnel in real engineering when the calculation formula and solution method are derived. The advantage of numerical calculation is that the complete stress-strain relationship and interaction between the adjacent engineering can be considered with the establishment of a complete numerical model, which can provide reliable and comprehensive results for analysis. Although the theoretical calculation method is convenient for engineering applications, it is not adequate for analyzing the interaction between the adjacent engineering and the subway tunnels, and a numerical calculation method could completely overcome the limitations of the theoretical calculation method.
The numerical calculation method is a mainstream way of shallow tunnel deformation calculation and analysis, but the application of the numerical calculation method in shallow tunnel deformation calculation still needs to be improved. The reason for this is that, for special shallow buried tunnels, the safety control standards for deformation are strict. China’s relevant regulations (Urban and rural areas of the People’s Republic of China, 2011; Urban and rural areas of the People’s Republic of China, 2013) stipulate that the deformation of subway tunnels should not exceed 5 mm and the ellipticity should not exceed 5%. Facing such strict control standards, the most important question of how to improve the accuracy and reliability of the calculation results for the numerical calculation method remains.
According to previous research experience and results, the calculated tunnel deformation due to soil unloading is usually larger than the actual situation under conventional calculation modes. The main reasons are as follows: 1) the unloading deformation of the soil itself is a nonlinear process, and the rebound modulus is several times the compression modulus, and its correlation varies greatly with different soil properties. 2) The actual unloading deformation of each layer is related to its stress history, unloading stress level, and unloading stress path. It can not be analyzed according to the mechanical parameters of the complete unloading state (conventional laboratory test). It is also necessary to carry out a large amount of demonstration work to realize the millimeter-level deformation calculation because of the discreteness, variability, and the complexity of physical and mechanical characteristics of the soil.
According to the analysis above, it is known that the soil nonlinear deformation is mainly affected by the variety of the mechanical parameters under different stress states, especially the change of the deformation modulus and it must be considered during the whole calculation process. On this basis, the deformation characteristics of the soil under repeated loading and unloading conditions are studied at first. And then a deformation calculation and analysis method for the shallow buried tunnel is proposed, which can reflect the actual state of the engineering. The rationality of the proposed method is validated through several examples. Finally, the method is applied to real engineering to illustrate its applicability and guidance for engineering.
For numerical calculation, the parameters must be reasonable to get the rational calculation results. The rebounding parameter of soil determines the rationality of shallow tunnel deformation calculation. We discuss the compression-rebound characteristics of soil under different load levels and get the value of the rebounding modulus of soil under rebound conditions at first. Then, we substitute the test value into the numerical calculation model to reasonably calculate the deformation of the shallow buried tunnel.
The particle size distribution of the typical soil is shown in Figure 1. The basic physical parameters of the typical soil are respectively: 1) fill: water content 28.4%, liquid limit 35.6% and plastic limit 21.4%; 2) mucky silty clay: water content 31.7%%, liquid limit 34.7% and plastic limit 21.3%; 3) silty clay: water content 29.9%, liquid limit 37.3% and plastic limit 21.5%; 4) clay: water content 27%, liquid limit 38.8% and plastic limit 22.3%. Note that the water content listed above was obtained by the field investigation, which is the natural moisture content of the original soil. For different types of soil, the natural water content is different and is not the saturated water content. Indeed, the water content influences the deformation of soil. According to the general law, with the increase of water content, the deformation resisting ability of soil decreases.
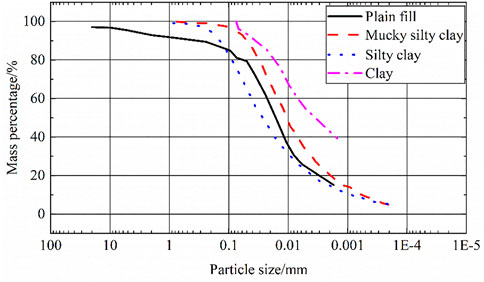
FIGURE 1. Cumulative curve of soil particle size grading.
The compression-rebound test of soil is carried out with a standard consolidation instrument (as shown in Figure 1). The size of the soil sample is φ61.8 mm in diameter and 20 mm in height. The test condition is to limit the deformation of soil laterally, and then apply the vertical load on the top of the sample. After the vertical load is loaded to a certain stress level, it is unloaded in stages. Each loading or unloading step needs to wait until the soil sample is stabilized in deformation, and the height of the soil sample is recorded to calculate the change of pore ratio and compression or rebound modulus of the soil sample. Specific test conditions are shown in Table 1.

TABLE 1. Soil compression-rebound test conditions.
Both elastic deformation and plastic deformation will occur during the compression process, and the deformation curve of soil appeared to have hysteretic characteristics during the rebound and re-compression process. This feature needs to be taken into account in the calculation to make it more realistic. Figure 2 shows typical compression-rebound test curves of different soils.
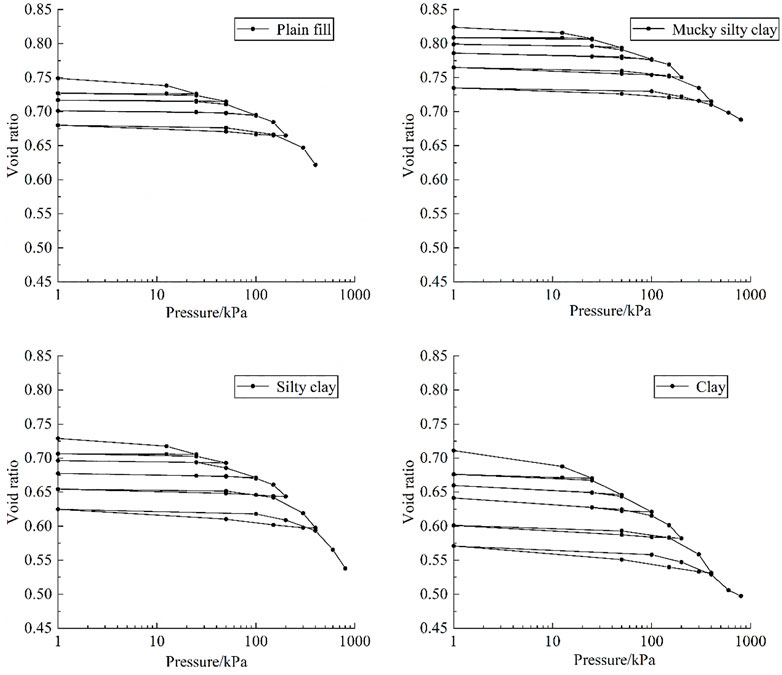
FIGURE 2. Compression-rebound test curve of typical soil.
As can be seen from Figure 2, no matter whether it is soft soil or hard soil, the soil pore ratio could not return to the initial pore ratio when unloading under different overlaying loads, which indicates that both elastic deformation and plastic deformation occurred in the soil during compression, and the plastic deformation is relatively large.
It can also be seen that in the process of soil rebound, the load-pore ratio curve of soil is not a straight line (the rebound curve appears to be a straight line under the condition of low load unloading, it is a curve, but the bending is not obvious, which will be reflected in the fitting model later). This indicates that during the process of soil rebound, the stress-strain relationship of soil is elastic-plastic, and the deformation modulus of soil changes can not be used by the unified elastic modulus.
In addition, the hysteretic characteristics of soil rebound-recompression deformation are different under high pressure and low pressure. When soil is unloaded and reloaded under a low compression load (less than 100 kPa), the load-pore ratio curve of soil overlaps and there are no hysteretic characteristics. When the soil is unloaded and reloaded under a high compression load, the load-pore ratio curve shows obvious hysteretic characteristics. At the initial stage of unloading under a high compression load, the load-pore ratio curve of soil is relatively smooth and the rebound deformation is small, which indicates that the rebound modulus is large at the initial stage of unloading. When unloading to a certain extent, the load-pore ratio curve begins to bend and the rebound deformation occurs rapidly. The hysteresis characteristics of soil under high compression load are consistent with the existing results (Li and Teng, 2018; Wang et al., 2020), but that under low compression load is rarely reported. What should be emphasized is that the excavation on the ground will usually cause the deformation of the shallow soil layer. Therefore, the unloading rebound characteristics of soil under low compression load are more significant for shallowly buried tunnel engineering.
For numerical calculation, the most commonly used and most convenient constitutive model is the Mole Coulomb model. The parameters used in the mole Coulomb model are elastic modulus E0, Poisson’s ratio ν, cohesion c, and friction Angle φ, among which, the impact of the elastic modulus on deformation is the largest. But for engineering investigation, the compression test is used to determine the modulus of soil mass. To avoid confusion, here we use Es and Esc to represent the compression modulus and rebound modulus determined by the compression-rebound test and use E0 and Ec0 to represent the elastic modulus and rebound modulus before and after the excavation construction in the numerical simulation. The problem of shallow buried tunnel deformation caused by soil excavation does not involve soil re-compression, therefore, the estimation of soil re-compression modulus is not included in this research.
The compression curve of soil is shown in Figure 3(1) , and the rebound curve of soil is shown in Figure 3(2). In terms of morphology, the compression curve and the rebound curve have similar morphology, so they can be fitted by one equation. After a comprehensive comparison, we choose the power function of three parameters as the fitting function of Es and Esc. The specific equation is as follows:
Where: a,b,c are model parameters; e is porosity ratio; p is the current pressure value/kPa.
1) Comparison of test data and formula fitting data in the soil compression test
2) Comparison of test data and formula fitting data in soil rebound test
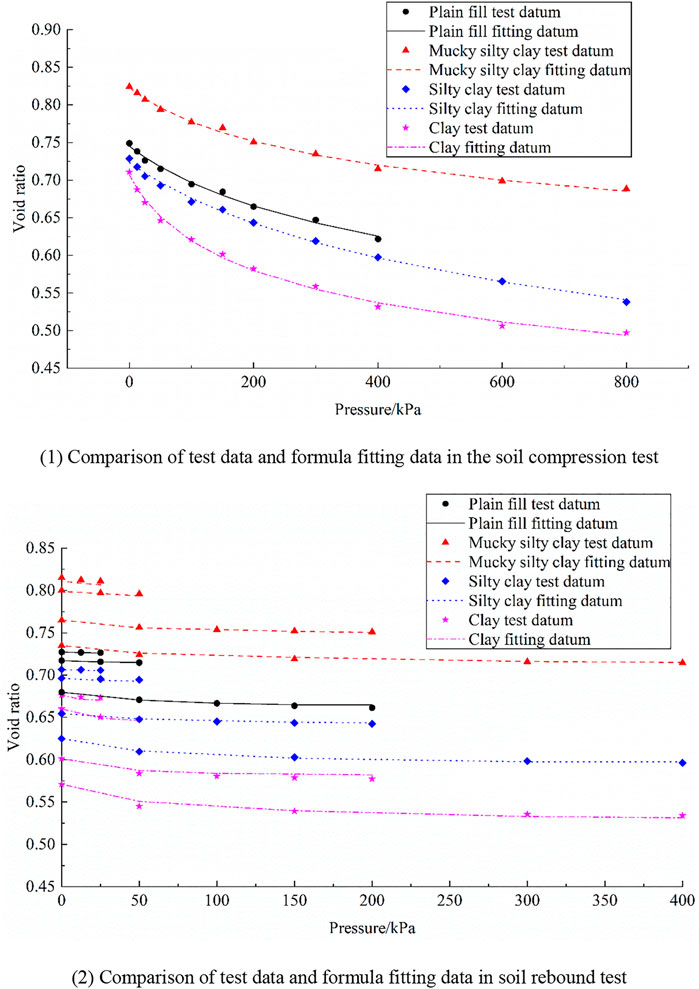
FIGURE 3. Comparison of test data and formula fitting data in soil compression-rebound test.
As shown in Figure 3, the fitting effect of the soil compression curve and rebound curve is good, and the fitting model can accurately reflect the compression and rebound characteristics of different soils. For the convenience of application, the fitting parameters of the compression curve are listed in Table 2. For rebound conditions, there are different fitting parameters for the rebound curve under different pressure values. The function relationship between the three fitting parameters and the pressure values can be further established to facilitate the application of numerical calculation in the later period. The fitting functions of different soil rebound parameters are also listed in Table 2 below.
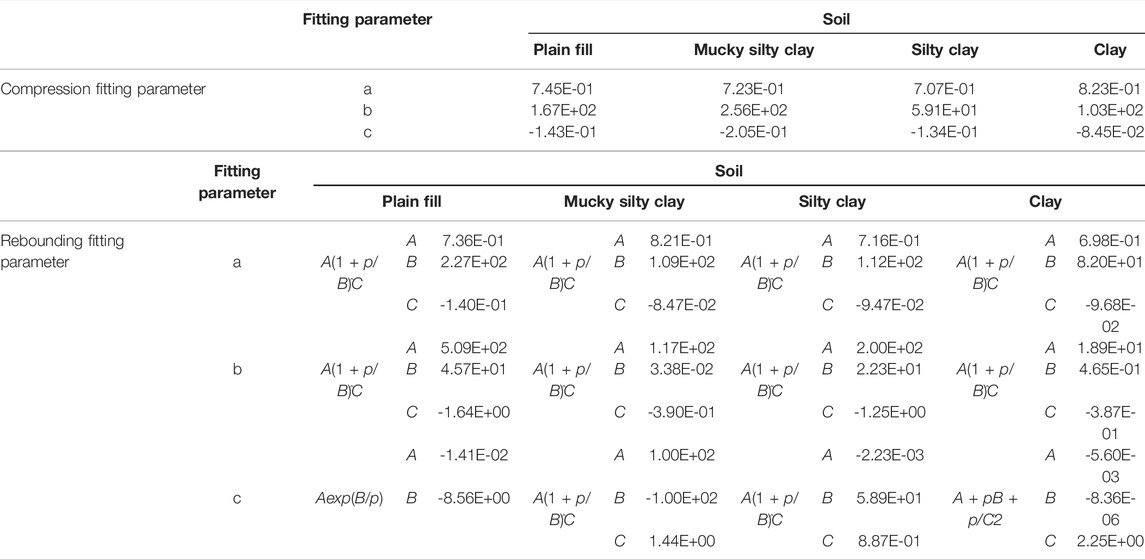
TABLE 2. Fitting parameters of the compression and rebound curve.
For excavation construction, the soil should be unloaded at different load levels, so the rebound modulus Esc of soil should be calculated according to the excavation depth and the unloading level. It is worth noting that the above model and calculation parameters are used to calculate the current pore ratio of soil, which need to be converted to modulus if the modulus is wanted.
Some scholars have discussed the relationship between soil compression modulus Es and elastic modulus E0 under compression, and the conclusion is that there is a certain proportional relationship between Es and E0 (Jia et al., 2008; Yu, 2014). However, there is no literature report on the relationship between Esc and Ec0, used in numerical calculation. Therefore, it is necessary to determine the relationship between them to provide reliable parameters for the subsequent calculation of shallow buried tunnel deformation.
Figure 4(1) shows the comparison between the numerical simulation and the test conditions of different soil compression-rebound tests. It can be seen that the conditions of the compression rebound test and the numerical simulation are the same: the numerical model has a diameter of 6.18 cm and a height of 2 cm, the horizontal deformation is constrained around the soil sample, displacement is completely constrained at the bottom of the soil sample, and only axial load is applied or reduced at the upper part of the numerical model. The loading step is also the same as the real test which is that after the consolidation under a certain load level is completed, the next load will be added to the surface of the model.
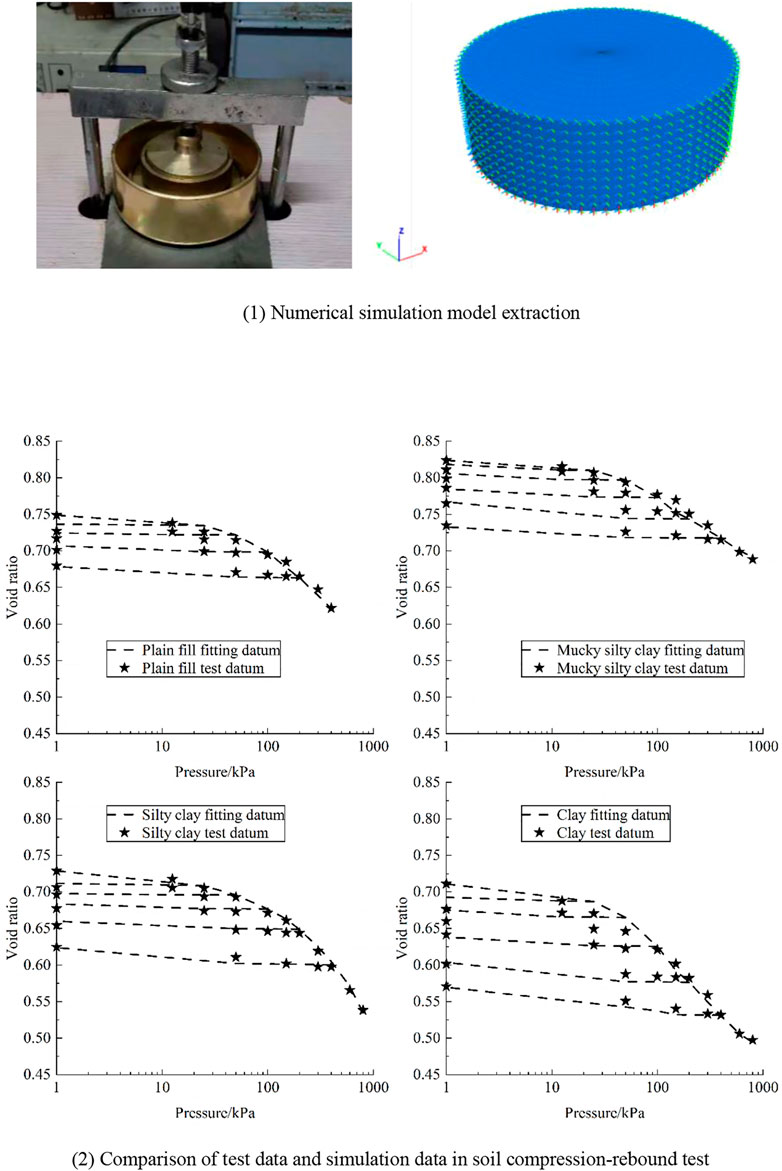
FIGURE 4. Numerical simulation model extraction and comparison of test data and simulation data.
Figure 4(2) shows the datum comparison of the compression-rebound test and the numerical simulation of different soil samples under different rebound conditions. Here, the rebound modulus Esc obtained by the compression-rebound test is constantly adjusted, and the multiple relationships between Ec0 used in numerical simulation and Esc obtained by the test are determined, that is, Ec0 = 4.0Esc. It can be seen from the figure that the soil rebound curve obtained by numerical simulation is in good agreement with the test curve, which can well reflect the deformation of soil under the rebound conditions. Therefore, in the subsequent deformation calculation of shallow buried tunnel, Ec0 will be set whose value is 4 times Esc according to the different compression state and unloading level.
According to the results of the soil compression rebound test, the Es or Esc of soil has the following characteristics:
1) Whether in compression or rebound state, the compression moduus Es or the rebound modulus Esc of soil varies with the overlaying pressure. This means that in the numerical calculation, the modulus of soil should be adjusted according to the overlaying pressure.
2) Especially for the rebound state, the rebound modulus Esc is not only related to the initial unloading pressure but also related to the unloading state, that is, different initial unloading pressure and different soil rebound modulus. Under the same initial unloading pressure, the rebound modulus of soil is different with different unloading levels.
Therefore, for small deformation of shallow buried tunnel deformation calculation, the value of Ec0 rebound modulus of soil under the rebound condition is critical, which should be reasonably determined to make the results more in line with engineering practices and more convincing.
Based on the above research results, this method proposed for shallow tunnel deformation can be summarized in the following steps:
1) Initial ground stress calculation: according to the basic physical and mechanical parameters of soil, estimate the dead weight load of different soil layers in advance, transform the compression modulus Es into E0, which is assigned to the soil model along with the parameters of Poisson’s ratio ν, cohesion c, and internal friction Angle φ, and then calculate to balance.
2) Calculation of shallow buried tunnel construction: simulate tunnel excavation and calculation, monitor the change of soil pressure in real time, dynamically adjust the elastic modulus of soil E0, calculate to the model balance, and record the pressure information of soil.
3) Calculation of shallow tunnel deformation: simulation soil excavation upon the shallow tunnel, determine the initial unloading pressure according to the pressure information of soil elements, monitor the pressure variation of the soil elements in time and dynamically, calculate the rebound modulus Esc according to the initial unloading pressure and current pressure, and transfer it into Ec0, then continually adjust the Ec0 during the calculation process to make tunnel deformation results more reasonable.
In order to more clearly show the calculation method and process of shallow buried tunnel calculations proposed in this paper, the specific process is given in the form of a flow chart in Figure 5.
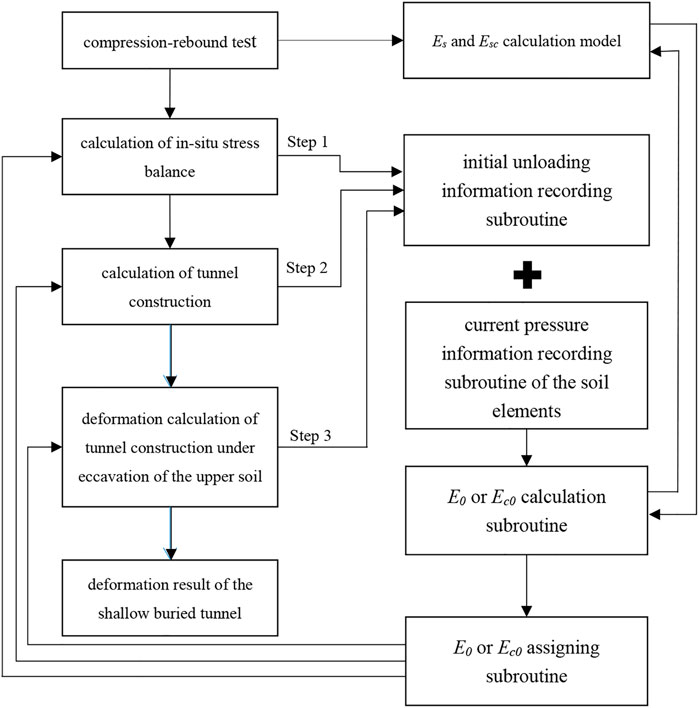
FIGURE 5. Calculation process of the proposed method.
A previous study by Wang et al. (2006) reported on the influence of the Shanghai Daning Commercial Center foundation excavation on its nearby metro tunnel. Another study (Liang et al., 2017) reported a simplified analytical method to evaluate the effects of the excavation of the tunnel. In this literature, the deformation datum by the analytical calculation and in-site measuring are compared. This datum is used as the base datum to verify the calculated metro tunnel deformation obtained by the method proposed in this paper.
The layout of the foundation pit and its position in relation to the metro tunnel are shown in Figure 6. The length and width of the foundation pit are 240 m × 230 m, and the distance between the supported pile and the tunnel is only 5.4 m. In the adjacent area, there are four layers of soil, which respectively are:
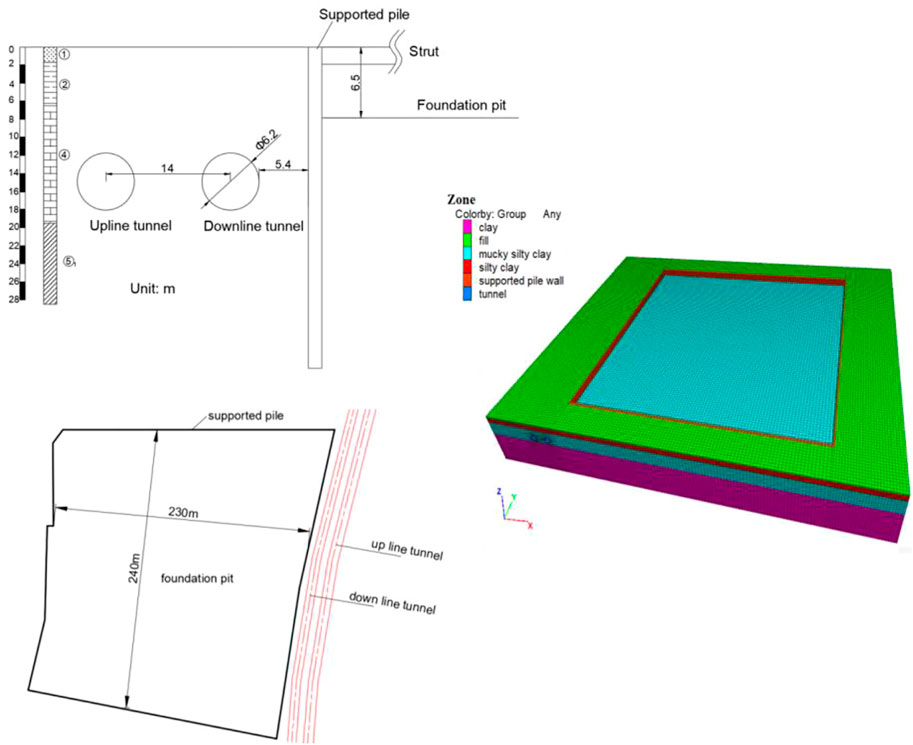
FIGURE 6. The numerical model according to the project layout in Case I.
The basic parameters of the soil and supported structure are the same as that used in other literature (Wang et al., 2006), which are
As the downline tunnel is closer to the foundation pit than the upline tunnel, the deformation of this tunnel is considered and contrasted to verify the rationality of the method proposed in this paper. The calculated deformation datum obtained from wider literature (Wang et al., 2006; Liang et al., 2017) and the proposed method are compared with the measured results. As shown in Figure 7, although the calculated datum obtained by the three methods all reflect the deformation of the metro tunnel, the datum calculated by the method in this paper is closer to the measured datum and better reflects the tunnel deformation trend.
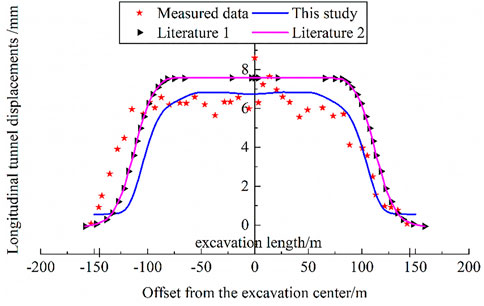
FIGURE 7. Results comparison between this method and two studies in CaseⅠ.
To better verify the rationality of the proposed method, another project case is introduced below. In this case, the Bund Underground Passage in Shanghai was constructed on the metro tunnel. The layout of the underground passage and its position in relation to the metro tunnel is shown below in Figure 8(1).
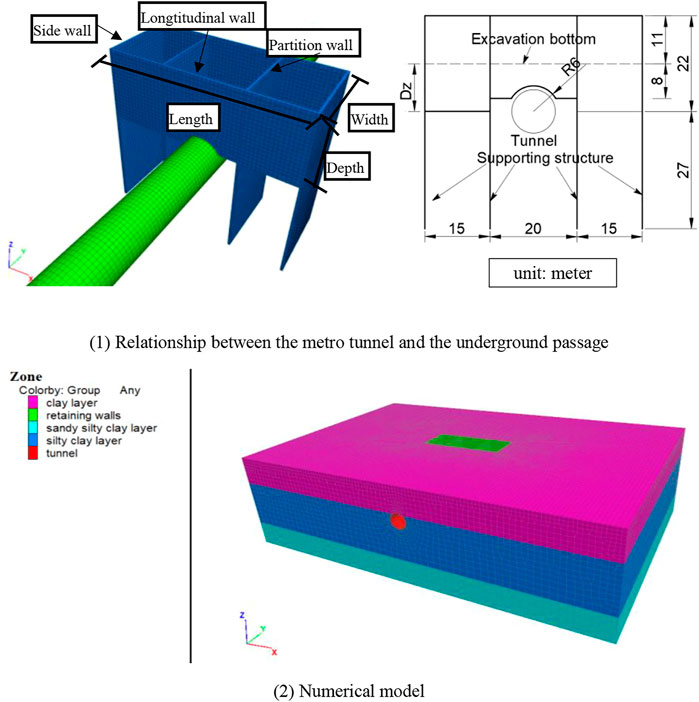
FIGURE 8. Numerical model of the intersection engineering of CaseⅡ.
The underground passage was constructed using the open-cut method. The foundation pit was supported by several retaining walls, as shown in Figure 8. In this case, four conditions with different Dz (Plan I: Dz = 11 m; Plan II: Dz = 16.5; Plan III: Dz = 22 m; Plan IV: Dz = 27.5) were calculated, and the results are compared with those in the literature (Huang et al., 2013).
The numerical model is shown in Figure 8(2). The engineering geological condition is that there are three soil layers: 1. Clay layer; 2. Silty clay layer; 3. Sandy silty clay layer. The mechanical parameters of the soil are the same as that used in the literature (Huang et al., 2013)which are ①clay: Poisson ratio 0.32, cohesion 8 kPa, friction 23°; ②silty clay: Poisson ratio 0.31, cohesion 13 kPa, friction 27°; ③sandy silty clay: Poisson ratio 0.3, cohesion 3 kPa, friction 30°. As with Case I, in this case, the resilience parameters are also referred to in the test results in this paper.
Figure 9 compares the results of this study and the wider literature (Huang et al., 2013). It can be seen that the tunnel deformation results calculated by the two methods can all reflect the law that with the increase of the burial depth of the tunnel, the deformation of the tunnel decreases, and the maximum deformations obtained by the two methods are almost the same. However, from the axial deformation variation law, the results of the two methods have certain differences. This could be caused by setting the different parameters of the supported structure. According to experience, we believe that under the supported structure with enough strength, the influence range should be limited in the cutting construction area. Because the supporting structure can effectively block the deformation surrounding the foundation pit wall. This understanding is also confirmed by Case I, in which the deformed range of the metro tunnel is consistent with that of the cutting construction (see Figure 8).
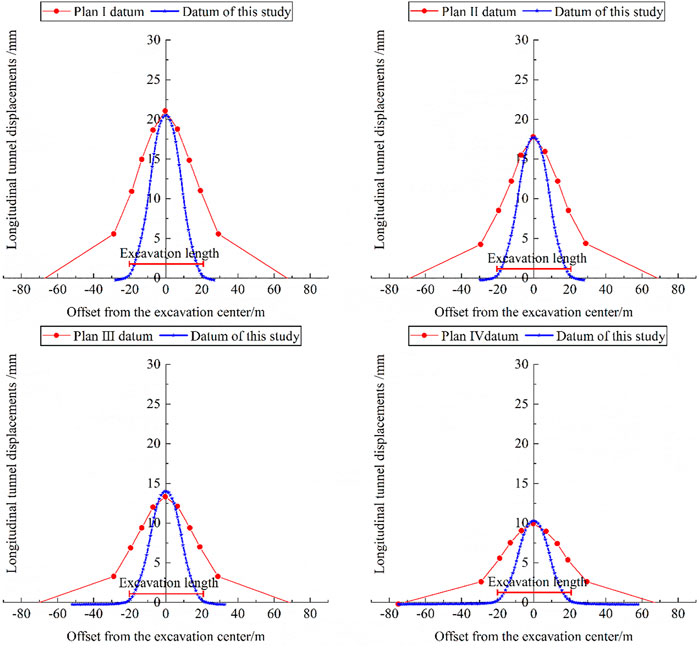
FIGURE 9. Results comparison between this method and studies in CaseⅡ.
Before the project construction, the influence on the nearby existing engineering structure must be first assessed. Here an application of the influence of soil unloading on Wuhan metro line four using the proposed method in this paper is introduced. The deformation law of the metro tunnel caused by soil unloading on the ground surface is calculated. The deformation of the tunnel is used to judge whether the deformation standards specified in the relevant codes are exceeded. Then the calculated tunnel deformation is compared with the in-site measured results. The proposed method is therefore validated and checked.
A real estate project was constructed above the Wuhan metro line 4, and before its construction, an influence assessment was done to ensure the engineering can be conducted.
The range of the soil unloading and its position in relation to the Wuhan metro line four is shown in Figure 10(1). As seen in the figure, the unloading soil lay directly on the metro tunnel. The whole unloading area is divided into two parts: 1) part I: the north of the red line and 2) part II: the south of the red line. The elevation of part I after soil unloading is 23.5 m, the unloading thickness is 8–12 m and the tunnel buried depth is 10.9–13.8 m. The elevation of part II after soil unloading is 22 m, the unloading thickness is 4.2–7.8 m and the tunnel buried depth is 13.8–19.6 m. Based on engineering experience, the influence of unloading construction in part I should be greater than that in part II due to the larger buried depth of the tunnel and unloading thickness. Therefore, the tunnel deformation calculation in part I was under heavy consideration in the assessment.
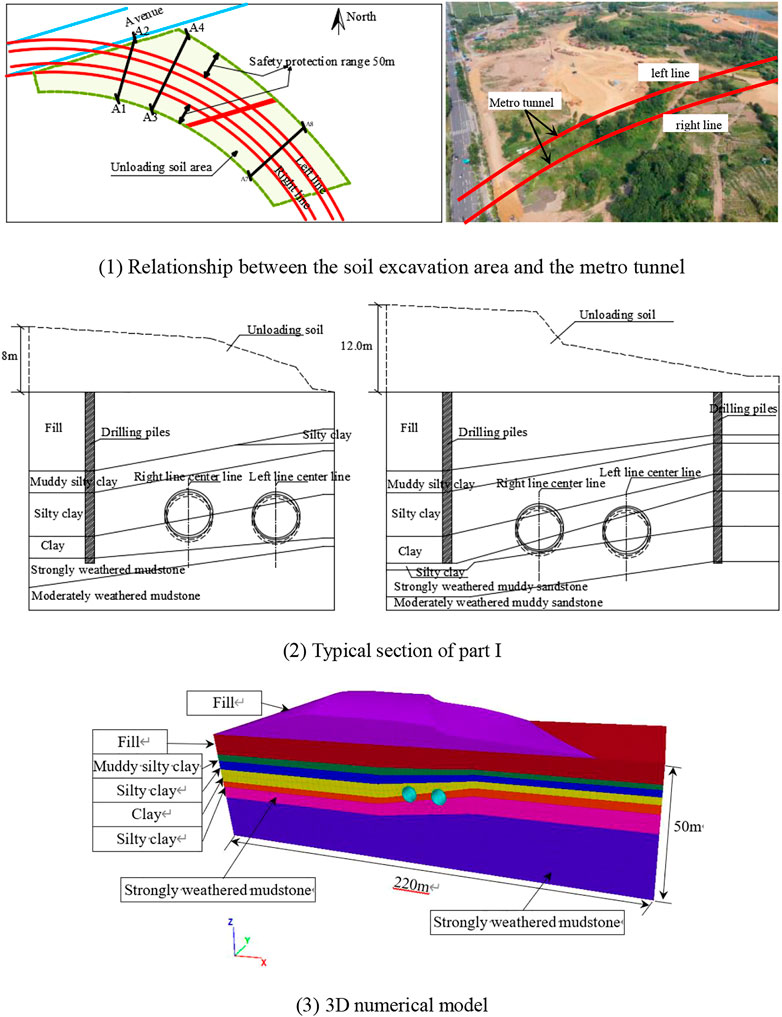
FIGURE 10. Numerical modeling process.
For establishing the numerical model, we selected two typical sections of part I, which can be seen in Figure 10(2). The distance between the two sections is about 50 m and the 3D numerical model is obtained by extrusion operation from sections A1A2 to A3A4. The 3D numerical model can be seen in Figure 10(3). The length and height of the model are respectively 220 m and 50 m. The diameter of the metro tunnel is 5.5 m and the thickness of the concrete supporting structure is 0.35 m.
The engineering geological condition is also shown in Figure 10(3). It can be seen that the soil layers under the unloading soil are respectively 1) fill; 2) clay; 3) silty clay; 4) clay; 5) highly weathered mud sandstone; and 6) medium weathered mud sandstone.
The initial parameters of the model are listed in Table 3 and the parameter adjustment in the calculation process is achieved by the method in Section 2.3. What needs illustration is that the initial parameters are necessary before the calculation and along with the calculation, the parameters would be periodically and continually adjusted according to the indoor test results.
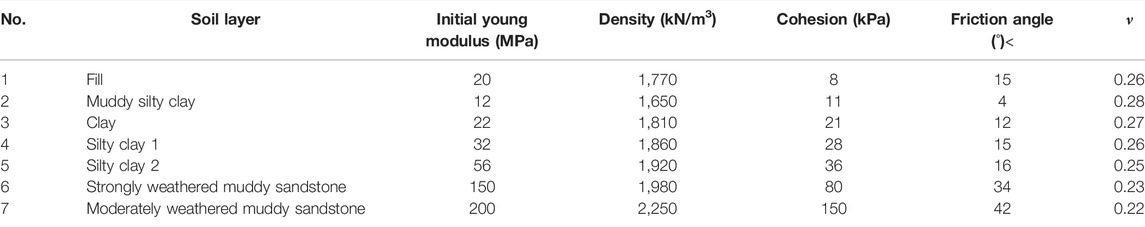
TABLE 3. Calculation parameters.
As mentioned in Section 3, the whole calculation procedure is divided into three stages: I. initial stress balance stage; II. tunnel construction stage; and III soil unloading on the ground stage. In stage I, the whole model consists of soil, while in stage II, the tunnel construction is simulated. In this stage, the deformation of the tunnel is resisted by the concrete supporting structure. Finally, in stage III, all the deformation in stage II is eliminated, and the deformation caused by soil unloading is studied.
Figure 11(1) is the heaving deformation contours after the ground soil unloading. Figure 11(2) shows the heaving deformation of the soil and Figure 11(3) shows the heaving deformation of the tunnel.
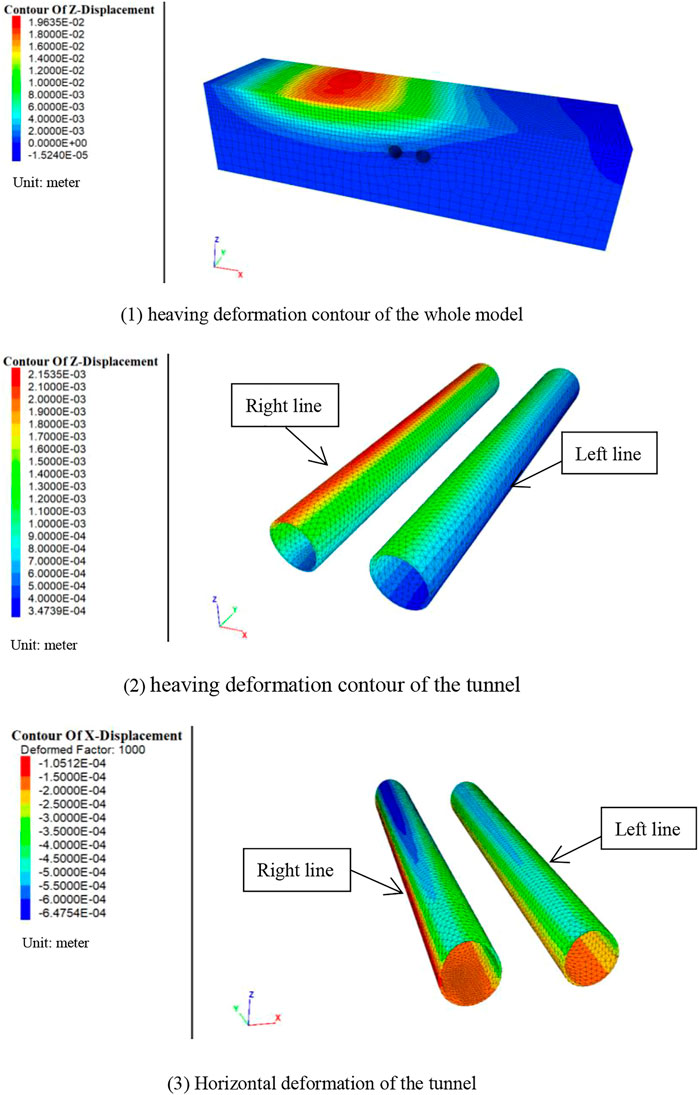
FIGURE 11. Deformation contour of the two metro tunnels (heaving and horizontal deformation).
From the figures, we can see that due to the large area of soil unloading construction, the ground surface has a large heaving deformation. The biggest heaving deformation occurs at the position with the biggest soil unloading thickness, whose value is about 19.6 mm.
After the soil was unloaded, along with the rebounding deformation of the surrounding soil, heaving deformation also occurs on the metro tunnel. But because of the greater stiffness of the tunnel supporting liner, the heaving deformation is smaller than that of the soil.
According to the position relationship, the metro tunnel is located in the down right of the unloading soil, therefore, the deformation is upward to the upper left direction. In addition, the right line is closer to the unloading soil, so its deformation is bigger than that of the left line. From the value of the tunnel heaving deformation, the maximum heaving deformation on the right line is about 2.1 mm and that of the left line is about 1.7 mm. The maximum horizontal deformation of the two lines are 0.65 mm and 0.50 mm, respectively.
Figure 12 shows the deformed shape of the metro tunnel structure in the typical section. It is known that after the cutting soil was unloaded, the tunnel structure shape was changed from a circle to an approximate ellipse. After deformation, the upper curvature of the tunnel structure was small and the curvature of the lower part was large. This phenomenon further shows that the deformation at the crown of the tunnel was greater than that of the bottom.
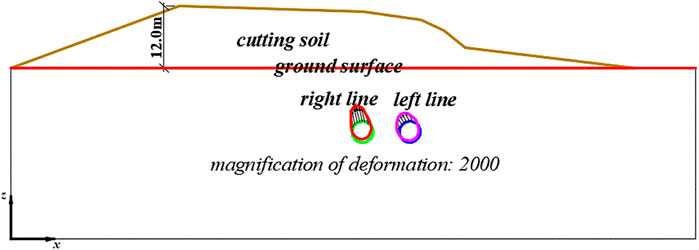
FIGURE 12. The shape of the deformed metro tunnel structure after unloading the cutting soil (the deformation is magnified 2000 times).
From the deformation direction at the crown of the tunnel, its direction pointed to the thickest part of the unloaded soil, therefore, the long axis of the elliptical shape of the deformed tunnel rotated to left. Due to the different horizontal distance between the left and right tunnels to the thickest part of the unloaded soil, the rotating angle of the long axis of the ellipse of the left tunnel was smaller than that of the right tunnel.
Figure 13 gives the maximum deformation of the tunnel under different unloading thicknesses. For the maximum heaving deformation, the value increased along with the increase of the unloaded soil thickness, whose relationship belonged to a straight line. This showed that the heaving deformation of the tunnel was directly related to the thickness of the unloaded soil. On the other hand, as for the maximum horizontal deformation, when the unloaded thickness was smaller than 8 m, the deformation value increased linearly with the increase in unloaded thickness. However, when the unloaded thickness was bigger than 8 m, the influence of the unloaded thickness on horizontal deformation weakened quickly.

FIGURE 13. The maximum deformation of the tunnel under different unloaded thickness.
To verify the calculation results, the contrast between the measured datum and the simulation result is shown in the following section. In the in situ deformation measure, the absolute deformation on the tunnel crown and bottom was conducted. The deformation of the whole tunnel in the soil unloading range was measured during the construction, and the simulation section was in the measuring range. The interval length between the measuring section was about 5.5 m.
1) Heaving deformation on the tunnel CRown
Figures 14(1)a,(2)a show the contrast of the heaving deformation on the tunnel crown between the calculation result and the in site measured datum.
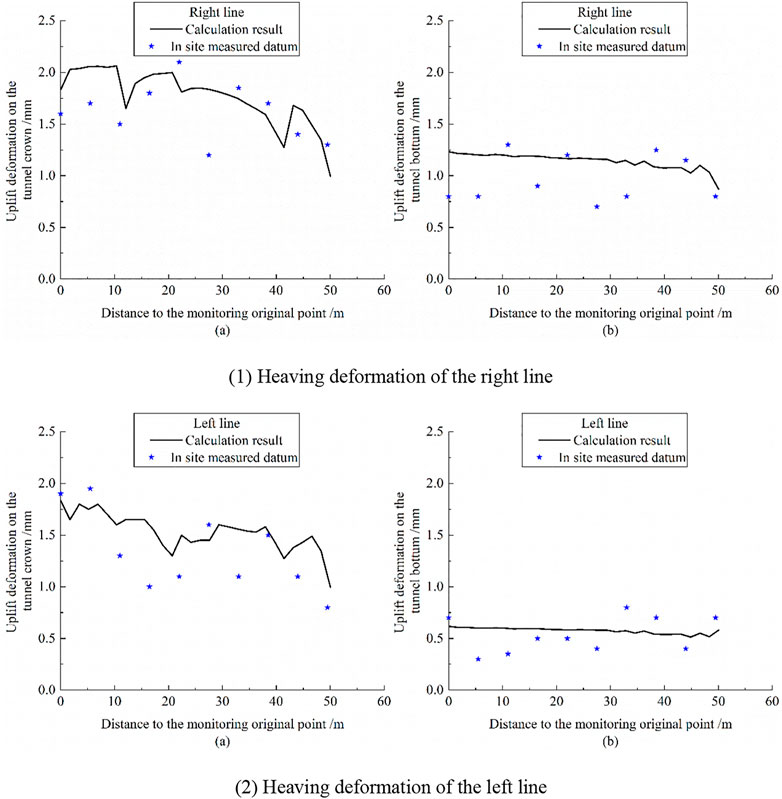
FIGURE 14. Heaving deformation contrast on the tunnel between the calculation result and the in site measured datum.
From the figures, it can be seen that after the soil excavation construction, deformation occurs on the tunnel crown, which is in agreement with the in situ measured data. The resulting agreement can be reflected in three aspects. First, on one hand, given the heaving deformation of the tunnel crown, the calculated maximum deformation is 2.1 mm and the measured maximum deformation is 2.2 mm, which indicates that they are consistent. Secondly, on the other hand, from the perspective of longitudinal tunnel deformation, due to the different thickness of the unloading soil, the heaving deformation values of the tunnel crown at different positions should be different, and the numerical simulation results accord with the distribution trend of the measured deformation of the tunnel. Finally, because the right line of the subway tunnel is closer to the maximum thickness of the unloading soil, the value of the heaving deformation of the right line tunnel should be larger than that of the left line tunnel, and the numerical simulation results are consistent with the measured data.
2) Heaving deformation on the tunnel bottom
Figures 14(1)b,(2)b show the contrast of the heaving deformation on the tunnel bottom between the calculation result and the in site measured datum.
From the Figures, it can be seen that:
1) Due to the soil unloading construction on the ground, the rebound deformation of the foundation soil caused the heaving deformation of the subway tunnel. Due to the relatively deep depth at the bottom of the tunnel and the large rigidity of the tunnel lining structure, the heaving deformation at the bottom of the tunnel was significantly smaller than that at the top of the tunnel.
2) According to the value of the heaving deformation at the bottom of the tunnel, the deformation on the right line is larger than that on the left because the tunnel on the right line is closer to the position of the deepest soil unloading. This shows consistency between the numerical simulation results and measured data. The maximum deformation at the bottom of the right line tunnel is about 1.3 mm, and the measured data is about 1.4 mm.
3) The numerical simulation results are consistent with the measured data of the heaving deformation at the bottom of the tunnel, which reflects the heaving deformation trend at different longitudinal positions of the tunnel. However, influenced by the buried depth, structural stiffness and so on, the heaving deformation at the bottom of the tunnel is small, so the deformation difference is not obvious.
3) Convergence deformation of the tunnel in the vertical direction
Figure 15 shows the vertical clearance convergence deformation of the subway tunnel in the longitudinal direction. The positive and negative values of vertical clearance convergence deformation of the tunnel are defined as: the positive value of deformation represents the stretching of the tunnel section, and the negative value represents the contraction of the tunnel section.
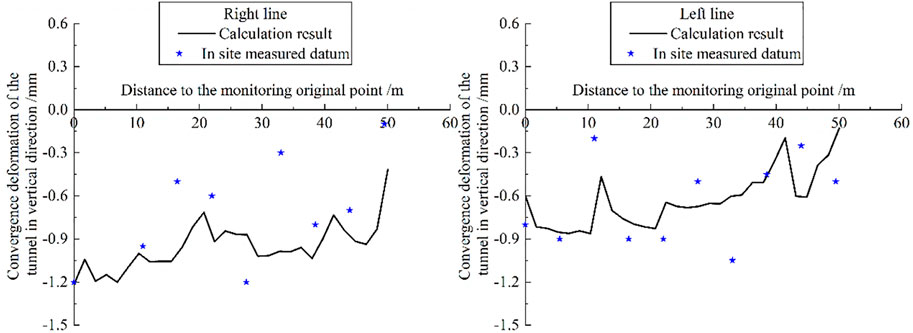
FIGURE 15. Vertical clearance convergence deformation contrast between the calculation result and the in site measured data.
These figures indicate that:
1) Due to the soil unloading construction on the ground, the heaving deformation occurs on the soil and the tunnel. Although there is heaving deformation at the tip and bottom of the tunnel, the heaving deformation on the crown of the tunnel is larger than that the bottom. Therefore, the vertical section of the tunnel is stretched and its shape tends to become elliptical.
2) After the tunnel deformation, the elliptic long axis points to the position with the largest unloading thickness, indicating that the greater the unloading thickness is, the greater the surface rebound deformation is, and causing the tunnel upward arched deformation to this position.
3) The numerical simulation results are consistent with the measured datum, reflecting the distribution law of vertical clearance convergence deformation of the tunnel. The calculated deformation magnitude is also consistent with the measured data. The maximum vertical clearance convergence deformation of the tunnel on the right side is about 0.9 mm, and the measured data is about 1.05 mm.
According to the ‘Technical code for safety protection of urban rail transit structures (CJJ/t202-2013’ of China, the metro tunnel deformation must be limited to 5 mm and the ellipticity ratio (calculated by the formula (2)) of the tunnel must be limited within 5‰.
Where, Dmax and Dmin are respectively the maximum and minimum diameters of the deformed tunnel and Ddesign is the designed diameter of the tunnel.
Figure 16 shows the ellipticity ratio of the two metro tunnels of the soil unloading construction. It can be seen that the ellipticity ratio of the two metro lines is all smaller than the mandatory standard. The maximum ellipticity ratios of the two tunnels are respectively 1.6‰ and 1.42‰. From the deformation aspect, the values of the horizontal and vertical deformation of the two tunnels are all within the demand of the code. Therefore, although the soil unloading construction would have a certain influence on the metro tunnels, the tunnels are still in accordance with the relevant regulations, meaning the tunnels can be deemed safe.
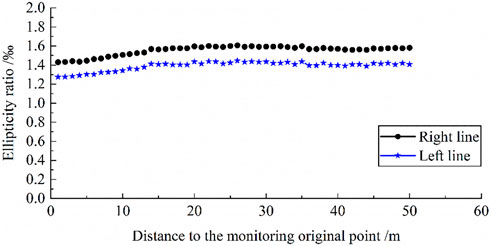
FIGURE 16. The ellipticity ratio of the tunnel in the longitudinal direction.
This paper summarized the research status of tunnel deformation caused by overlaying soil excavation, the deformation characteristics of soil under rebound conditions were first studied and the rebound deformation law and calculation model were obtained. Then, the transferring relationship of the Esc and Ec0 were researched through numerical inversion. Finally, based on the summary of the defamation law under the rebound condition, a set of numerical simulation calculations and analysis methods considering different stress histories and stress levels was presented. The main conclusions are as follows:
1) The soil rebound curve under unloading conditions shows nonlinear characteristics, especially under high pressure conditions, the nonlinear characteristics are more obvious. Therefore, the variation of the used rebound modulus according to the different stress states should be considered.
2) The hysteretic characteristics of the rebound curve of soil under high pressure and low pressure are different. When the soil is unloaded and reloaded under a low compression load (less than 100 kPa), the load-pore ratio curve of the soil overlaps. There are no hysteretic characteristics. When the soil is unloaded and reloaded under a high compression load, the load-pore ratio curve shows obvious hysteretic characteristics. It also further shows that the modulus parameters of soil are different under different stress states, and should be taken into consideration when evaluating the modulus.
3) Based on our experimental study, the deformation calculation and analysis method for shallow buried tunnels considering different stress history and stress states were put forward. In the calculation process, this proposed method can monitor the stress state and unloading stress history of different soil elements in real-time, and dynamically adjust the modulus parameters of soil according to this information and the results of indoor tests. The deformation law of shallow buried tunnels characterized by small deformation can be obtained, which makes the calculation results more in line with the engineering practice and provides a reliable reference for engineering construction.
4) The engineering example verification and engineering application results show that the deformation calculation method for the shallow buried tunnel considering different stress history and stress states proposed in this paper can better obtain the small deformation characteristics of the shallow buried tunnel under unloading conditions, which is in good agreement with the actual monitoring results and verifies the rationality of the method proposed in this paper.
The original contributions presented in the study are included in the article/Supplementary Material, further inquiries can be directed to the corresponding authors.
JL: Methodology, Calculation, Writing and Revising; SC: Data analysis; FY: Data analysis; ZD: Modelling; SL: Parameter validation; YZ: Modelling; CL: Language Reviewing and Editing.
This research was funded by the National Natural Science Foundation of China (No. 42172308) and the Youth Innovation Promotion Association CAS (No. 2022331).
Author YZ is employed by Sichuan Water Develeopment Group CO.,LTD.
The remaining authors declare that the research was conducted in the absence of any commercial or financial relationships that could be construed as a potential conflict of interest.
All claims expressed in this article are solely those of the authors and do not necessarily represent those of their affiliated organizations, or those of the publisher, the editors and the reviewers. Any product that may be evaluated in this article, or claim that may be made by its manufacturer, is not guaranteed or endorsed by the publisher.
Chang, C. T., Sun, C. W., Duann, S. W., and Hwang, R. N. (2001). Response of a Taipei rapid transit system (TRTS) tunnel to adjacent excavation. Tunn. Undergr. Space Technol. 16 (3), 151–158. doi:10.1016/s0886-7798(01)00049-9
Chen, Y., and Li, Y. S. (2005). Calculation of tunnel heavingdue to unloading of pit excavation. Chin. J. Undergr. space Eng. 1 (1), 91–94. (in chinese).
Chen, Y., and Zhang, D. M. (2004). Analysis of monitoring data on tunnel heavingdue to unloading of foundation pit excavation. Undergr. Space 24 (5), 748–751. (in Chinese).
Devriendt, M., Doughty, L., Morrison, P., and Pillai, A. (2010). Displacement of tunnels from a basement excavation in London. Proc. Institution Civ. Eng. - Geotechnical Eng. 163 (3), 131–145. doi:10.1680/geng.2010.163.3.131
Hu, Z. F., Yue, Z. Q., Zhou, J., and Tham, L. G. (2003). Design and construction of a deep excavation in soft soils adjacent to the Shanghai Metro tunnels. Can. Geotech. J. 40 (5), 933–948. doi:10.1139/t03-041
Huang, X., Schweiger, H. F., and Huang, H. W. (2013). Influence of deep excavations on nearby existing tunnels. Int. J. Geomech. 13 (2), 170–180. doi:10.1061/(asce)gm.1943-5622.0000188
Jia, D., Shi, F., and Zheng, G. (2008). Elastic modulus of soil used in numerical simulation of deep foundation pits. Chin. J. Geotechnical Eng. 30 (s1), 154–158. (in chinese).
Jiang, N., Zhu, B., He, X., Zhou, C., Luo, X., and Wu, T. (2020). Safety assessment of buried pressurized gas pipelines subject to blasting vibrations induced by metro foundation pit excavation. Tunn. Undergr. Space Technol. 102, 103448. doi:10.1016/j.tust.2020.103448
Li, J. M., and Teng, Y. J. (2018). Regularity and calculation method of rebound deformation and recompression deformation of soil based on bearing test. Roc Soil Mech. 39 (s1), 113–121. (in chinese).
Liang, R. Z., Xia, T. D., Huang, M. S., and Lin, C. (2017). Simplified analytical method for evaluating the effects of adjacent excavation on shield tunnel considering the shearing effect. Comput. Geotechnics 81, 167–187. doi:10.1016/j.compgeo.2016.08.017
Liu, H. L., Li, P., and Liu, J. (2010). Numerical investigation of underlying tunnel heave during a new tunnel construction. Tunn. Undergr. Space Technol. 26 (2), 276–283. doi:10.1016/j.tust.2010.10.002
Qiu, J. T., Jiang, J., and Zhou, X. J. (2021). Analytical solution for evaluating deformation response of existing metro tunnel due to excavation of adjacent foundation pit. English edition. Journal of Central South University, 25.
Sharma, J. S., Hefny, A. M., Zhao, J., and Chan, C. (2001). Effect of large excavation on deformation of adjacent MRT tunnels. Tunn. Undergr. Space Technol. 16 (2), 93–98. doi:10.1016/s0886-7798(01)00033-5
Shi, J., and Ng, C. W. W. (2015). Three-dimensional numerical parametric study of the influence of basement excavation on existing tunnel. Comput. Geotechnics 63, 146–158. doi:10.1016/j.compgeo.2014.09.002
Urban and rural areas of the People's Republic of China (2011). Code for risk management of urban rail transit underground engineering construction. GB50652-2011)(in chinese).
Urban and rural areas of the People's Republic of China (2013). Technical code for protetion structures of urban rail transit. CJJ/T202-2013)(in chinese).
Wang, R. L., and Yu, B. (2004). Protecting of the metro tunnel during construction of Dongfang Rd underpass. Undergr. Eng. Tunnels 4, 33–39. (in Chinese).
Wang, S. G., Li, Q. R., and Li, J. M. (2020). Discussion on some issures of resilient deformation calculation. China Civ. Eng. J. 53 (8), 108–115. (in chinese).
Wang, W. D., Shen, J., and Weng, Q. P. (2006). Analysis and countermeasures of influence of excavation on adjacent tunnels. Chin. J. Geotechnical Eng. 28 (S1), 1340–1345.
Yu, L. P. (2014). Analysis of soil’s elastic modulus values based on FLAC3D simulation. J. Water Resour. Archit. Eng. 12 (2), 162–166. (in chinese).
Zhang, Z., Zhang, M., and Zhao, Q. (2015). A simplified analysis for deformation behavior of buried pipelines considering disturbance effects of underground excavation in soft clays. Arab. J. Geosci. 8 (10), 7771–7785. doi:10.1007/s12517-014-1773-4
Zhang, J. F., Chen, J. J., Wang, J. H., and Zhu, Y. F. (2013). Prediction of tunnel displacement induced by adjacent excavation in soft soil. Tunn. Undergr. Space Technol. 36, 24–33. doi:10.1016/j.tust.2013.01.011
Zhang, J., Xie, R., and Zhang, H. (2018). Mechanical response analysis of the buried pipeline due to adjacent foundation pit excavation. Tunn. Undergr. Space Technol. 78, 135–145. doi:10.1016/j.tust.2018.04.026
Zhang, X. M., Yang, J. S., Zhang, Y. X., and Gao, Y. (2018). Cause investigation of damages in existing building adjacent to foundation pit in construction. Eng. Fail. Anal. 83, 117–124. doi:10.1016/j.engfailanal.2017.09.016
Keywords: soil rebounding characteristics, soil unloaded construction, shallow buried tunnel, numerical simulation method, deformation calculation
Citation: Li J, Li S, Zhang Y, Chen S, Yu F, Dai Z and Li C (2022) Numerical Method for the Deformation Calculation of the Shallow Buried Tunnel Caused by the Excavation of Overlying Soil Based on Soil Rebounding Characteristics. Front. Earth Sci. 10:872040. doi: 10.3389/feart.2022.872040
Received: 09 February 2022; Accepted: 30 May 2022;
Published: 25 July 2022.
Edited by:
Shibing Huang, Wuhan University of Science and Technology, ChinaReviewed by:
Fei Wang, Tarleton State University, United StatesCopyright © 2022 Li, Li, Zhang, Chen, Yu, Dai and Li. This is an open-access article distributed under the terms of the Creative Commons Attribution License (CC BY). The use, distribution or reproduction in other forums is permitted, provided the original author(s) and the copyright owner(s) are credited and that the original publication in this journal is cited, in accordance with accepted academic practice. No use, distribution or reproduction is permitted which does not comply with these terms.
*Correspondence: Yu Zhang, am9yZGFuemh5QDE2My5jb20=
Disclaimer: All claims expressed in this article are solely those of the authors and do not necessarily represent those of their affiliated organizations, or those of the publisher, the editors and the reviewers. Any product that may be evaluated in this article or claim that may be made by its manufacturer is not guaranteed or endorsed by the publisher.
Research integrity at Frontiers
Learn more about the work of our research integrity team to safeguard the quality of each article we publish.