- 1State Key Laboratory of Desert and Oasis Ecology, Xinjiang Institute of Ecology and Geography, Chinese Academy of Sciences, Urumqi, China
- 2Xinjiang Key Laboratory of Mineral Resources and Digital Geology, Xinjiang Institute of Ecology and Geography, Chinese Academy of Sciences, Urumqi, China
- 3Xinjiang Research Centre for Mineral Resources, Chinese Academy of Sciences, Urumqi, China
- 4University of Chinese Academy of Sciences, Beijing, China
Airborne hyperspectral remote sensing data provide rapid, non-destructive, and near laboratory quality reflectance spectra for mineral mapping and lithological discrimination, thereby ushering an innovative era of remote sensing. In this study, NEO HySpex cameras, which comprise 504 spectral channels in the spectral ranges of 0.4–1.0 μm and 1.0–2.5 μm, were mounted on a delta wing XT-912 aircraft. The designed flexibility and modular nature of the HySpex aircraft hyperspectral imaging system made it relatively easy to test, transport, install, and remove the system multiple times before the acquisition flights. According to the design fight plan, including the route distance, length, height, and flight speed, we acquired high spectral and spatial resolutions airborne hyperspectral images of Yudai porphyry Cu (Au, Mo) mineralization in Kalatag District, Eastern Tianshan terrane, Northwest China. By comparing the features of the HySpex hyperspectral data and standard spectra data from the United States Geological Survey database, endmember pixels of spectral signatures for most alteration mineral assemblages (goethite, hematite, jarosite, kaolinite, calcite, epidote, and chlorite) were extracted. After a HySpex data processing workflow, the distribution of alteration mineral assemblages (iron oxide/hydroxide, clay, and propylitic alterations) was mapped using the random forest (RF) algorithm. The experiments demonstrated that the workflow for processing data and RF algorithm is feasible and active, and show a good performance in classification accuracy. The overall classification accuracy and Kappa classification of alteration mineral identification were 73.08 and 65.73%, respectively. The main alteration mineral assemblages were primarily distributed around pits and grooves, consistent with field-measured data. Our results confirm that HySpex airborne hyperspectral data have potential application in basic geology survey and mineral exploration, which provide a viable alternative for mineral mapping and identifying lithological units at a high spatial resolution for large areas and inaccessible terrains.
1 Introduction
Hyperspectral imaging is a highly relevant topic in remote sensing research owing to the characteristics of high spectral resolution, strong wavelength continuity and large amount of spectral information (Grove et al., 1992; Clark et al., 2003; van der Meer et al., 2012; Guha, 2020). Each pixel in a hyperspectral image has its continuous spectrum, the technique has wide geological applications, including the identification and classification of mineralogical alteration assemblages and correlation of geological units (Gomez et al., 2018; Xie B. et al., 2022; Xie B. S. et al., 2022). For decades, hyperspectral imaging has been widely used in geological prospecting, such as porphyry-type copper deposits (Batchelor et al., 2016; Dalm et al., 2017), hydrothermal gold deposits (Osterloo et al., 2012), sulphide deposits (Iyakwari et al., 2016), ore deposits (Murphy and Monteiro, 2013; Metelka et al., 2015), uranium Ore deposits (Reath and Ramsey, 2013), and rare earth deposits (Riaza et al., 2001). The most popular hyperspectral sensors for mineral exploration from spaceborne and airborne platforms are summarized in Table 1.
Airborne hyperspectral imagers have a major role in geological exploration and mineralogy owing to the advantages of spatial resolution and performance capabilities in a cloudy atmosphere, compared with the images of spaceborne airborne platforms. Airborne hyperspectral sensors, such as AVIRIS, HyMAP, CASI/SASI and HySpex open new possibilities for the detection and mapping of mineral deposits (Rowan et al., 2000; Rowan et al., 2004; Jing et al., 2014). Compared with the airborne sensor parameters in Table 1, HySpex provides high-performance parameters such as spectral range (0.4–2.5 μm), sampling interval of 2.8 nm/5.45 nm, 504 spectral channels, a flexible spatial resolution, and light weight (10.2 kg) to be mounted on the aircraft platform and ground platform.
In 1995, the hyperspectral sensor of HySpex is a “pushbroom” scanner produced by NEO (Norsk Elektro Optikk, Oslo, Norway). The camera scans an object and collects a hyperspectral image or “cube” with two spatial dimensions and one spectral dimension. In recent years, numerous studies have identified the detection capabilities of HySpex sensors for various applications (Baissa et al., 2011; Steffens and Buddenbaum, 2013; Mathieu et al., 2017). For example, Cristóbal et al. (2021) demonstrated the viability of HySpex airborne hyperspectral wetland mapping in the high latitudes of Alaska. Baissa et al. (2011) identified and mapped hand specimens of Jurassic carbonate facies via a HySpex SWIR-320 m hyperspectral sensor in the Agadir Basin. Buckley et al. (2013) analyzed and mapped geological outcrops by merging LiDAR and HySpex imaging data. Using a HySpex sensor in a laboratory with a spectral range from 0.4 to 0.99 μm, Steffens and Buddenbaum (2013) developed a fast and effective imaging method that enables the spatially accurate classification of diagnostic horizons as well as the mapping of different contents of mineral elements. Ali et al. (2017) developed a rapid and efficient method to determine hyperspectral specific leaf area by leaf and canopy spectral measurements using HySpex airborne imagery.
HySpex imagery is useful when detecting target objects in hundreds of narrow bands that are only a few nanometers wide from the visible and near-infrared (VNIR) to the short-wave infrared region (SWIR). The HySpex airborne hyperspectral sensors are more effective in the advanced stage of exploration where there is a need to focus on small ground objects with spectral data at high spectral and spatial resolutions (Paoletti et al., 2019; Guha, 2020). Furthermore, the designed flexibility and modular nature of the HySpex aircraft system made it relatively easy to test, transport, install, and remove the system multiple times before the acquisition flights. Besides, the flexible setup also reduced cost by not committing aircraft use solely to data acquisition. In contrast, compared with conventional mineral mapping based on geological fieldwork spectral surveys, HySpex hyperspectral sensors can provide and collect easily accessible mineral information over a large spatial area and are effective in mapping spectrally conspicuous host rocks of mineral deposits, residual enrichment deposits, and surface mineralogical proxies occupying a larger spatial domain (Guha, 2020). HySpex imaging can provide airborne hyperspectral data that satisfy the high spatial and spectral resolution requirements of many geoscience remote sensing applications, offering a near laboratory quality spectrum and representing a fundamental development in the field of hyperspectral remote sensing. However, airborne hyperspectral imaging using HySpex has not been used as commonly as ground- and laboratory-based imaging and has rarely been applied for mineral mapping and discrimination of lithologic units.
Using hyperspectral images on our own HySpex airborne flight, we extracted and identified alteration mineral assemblages of the Yudai porphyry Cu (Au, Mo) mineralization (Kalatag District, northwest China). The main objectives of this study were to 1) acquire HySpex airborne hyperspectral images of the Yudai Porphyry Cu (Au, Mo) mineralization, 2) determine a workflow for processing HySpex images, and 3) identify alteration minerals using a random forest (RF) algorithm and a comprehensive field survey.
2 Study Area
The Eastern Tianshan in Xinjiang, northwest China, is a vital component of the Central Asian Orogenic Belt as well as the Altaids. The Kalatag district is located on the southern margin of the Turpan–Hami Basin and hosts the Yudai, Hongshi, Hongshan, South Meiling, and Meiling deposits. The Yudai Cu (Mo, Au) deposit is a newly discovered porphyry Cu deposit in the northwest part of Kalatag (Figure 1); this is a key area of early Palaeozoic rocks in the Eastern Tianshan (Chen et al., 2017). The deposit is a typical porphyry Cu deposit and occupies an area of nearly 30 km2. Alteration and mineralization have formed distinct zones around the quartz diorite porphyry, with disseminated, vein, or veinlet Cu (Mo, Au) mineralization types mainly related to potassic alteration such as biotite, magnetite, and quartz (Sun et al., 2017).
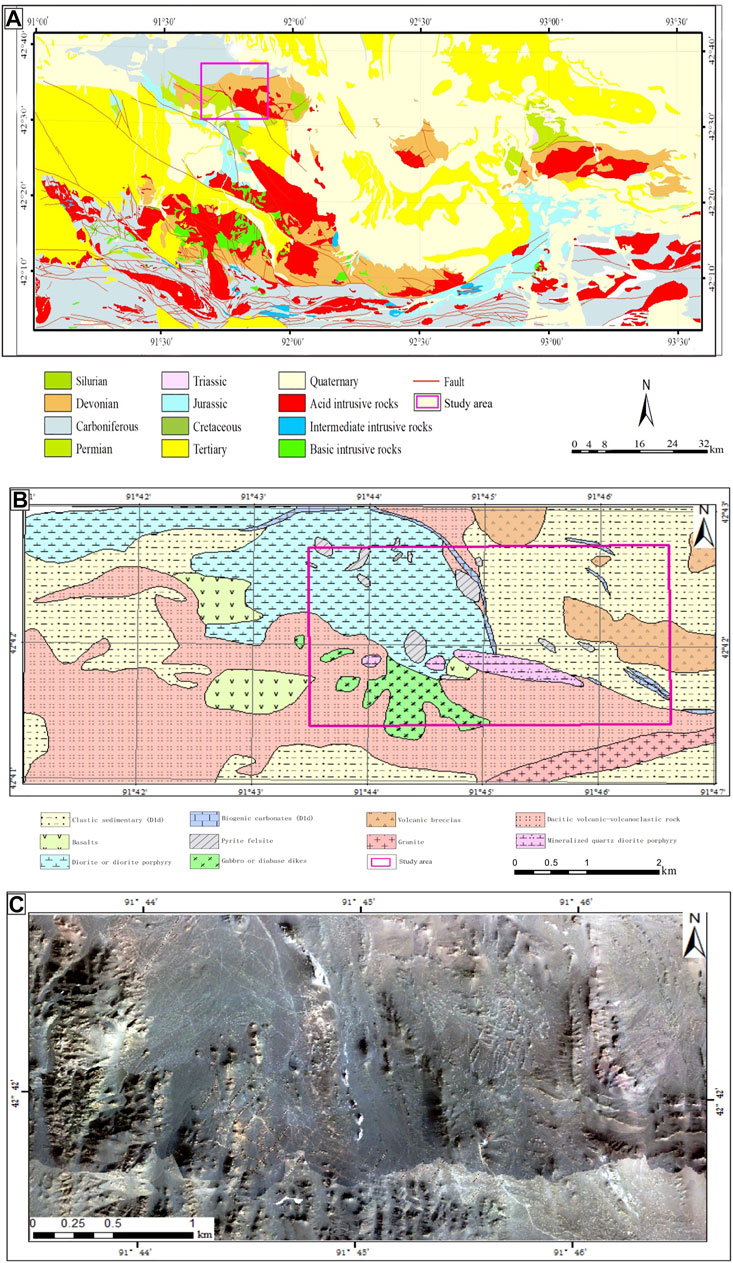
FIGURE 1. Schematic diagram of study area (A) Overview map of Kalatag district; (B) generalized geological map of Yudai; (C) hyperspectral images from the HySpex airborne flight.
The Xinjiang Karatag Jade Zone mining area is an arid area with large amounts of evaporation and no vegetation cover on the surface, making it suitable for the use of remote sensing data for large-area mineral resources exploration work. Therefore, airborne hyperspectral remote sensing provides a viable and reliable alternative for a wide range of mineral mapping in this area.
3 HySpex Airborne Hyperspectral Imaging System
HySpex hyperspectral sensors were mounted on a delta wing XT-912 aircraft platform, a light vehicle with good gliding performance, low cost, simple structure, ability to fold, and ease of transport and storage. The assembly instrument, an airborne flight tool for HySpex data, included HySpex sensors, a computer assembly, an inertial navigation set, and a battery pack and was mounted on the delta wing XT-912 aircraft (Figure 2).
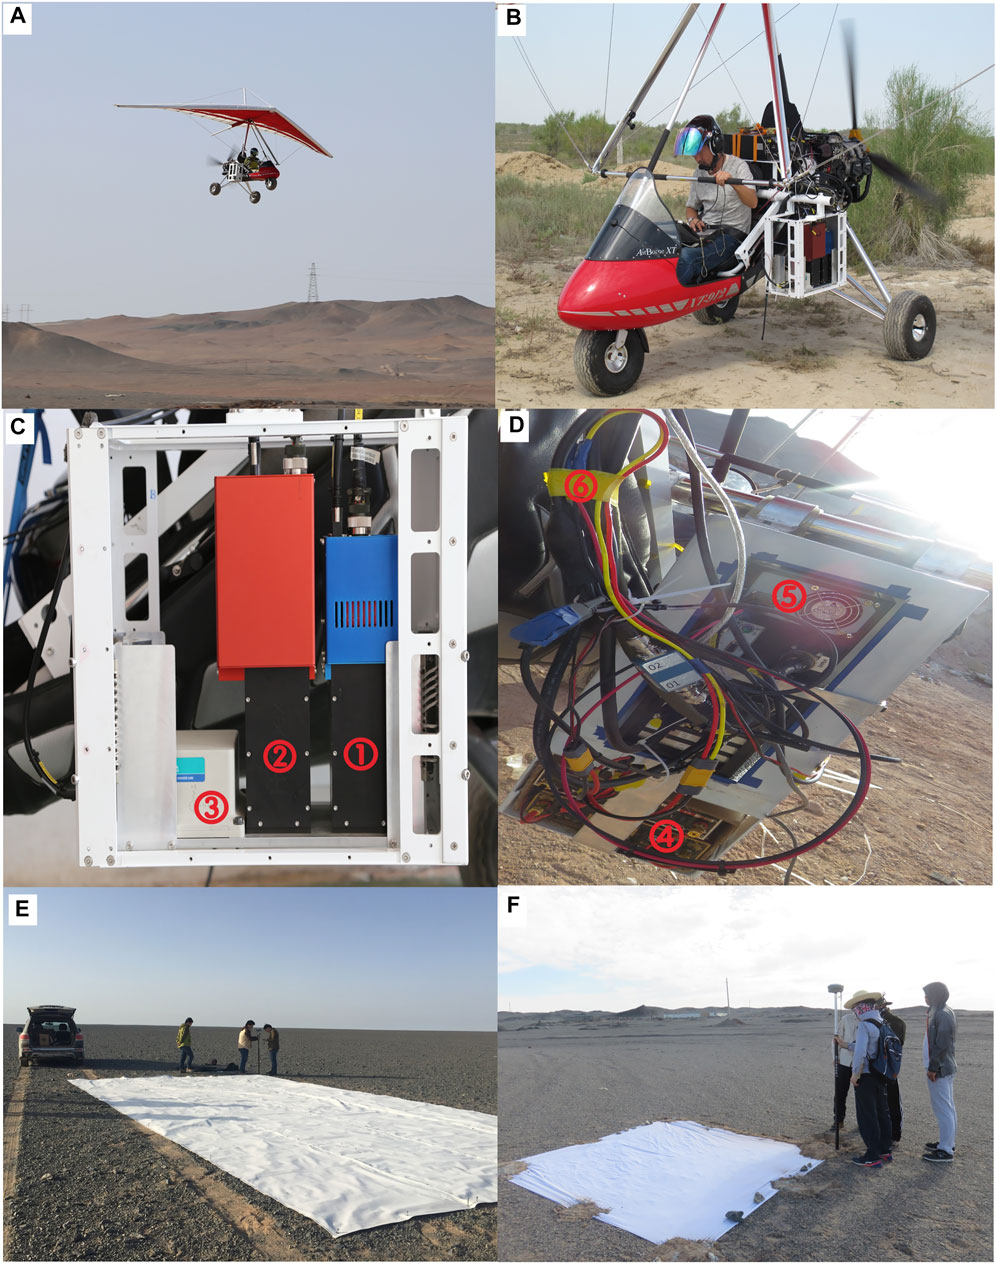
FIGURE 2. Photographs of the HySpex system for airborne acquisition. (A) Delta wing XT-912 aircraft, (B) HySpex sensors in aircraft, (C) HySpex sensors assembly, (D) main computer assembly, (E) 4 m × 4 m white reference panel, and (F) a geographical reference correction point. Details of HySpex sensors and computer assembly: ① HySpex VNIR sensor (Sensor 1), ② HySpex SWIR sensor (Sensor 2), ③ inertial navigation set, ④ battery pack, ⑤ main computer case, ⑥ air-to-ground communication equipment and cables.
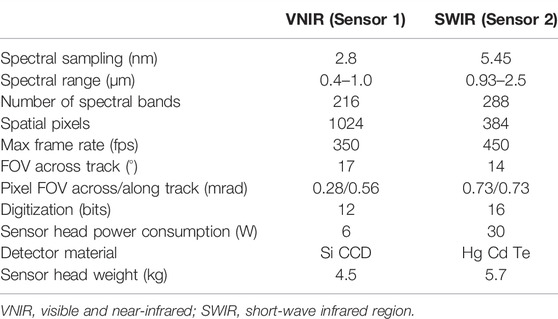
The take-off and landing ground sliding range of the delta wing XT-912 aircraft is between 50 and 150 m, the flight altitude range is 50–4,000 m, and the flight speed range is 45–110 km/h. According to the study area terrain, detection target, and spatial resolution, the flight height of the HySpex airborne is 500–3,000 m. The airborne hyperspectral sensor of HySpex consists of Sensor 1 and Sensor 2 imaging spectrometers, which have spectral ranges of 0.4–1.0 and 0.93–2.5 μm, respectively. It also consists of 504 spectral channels with spectral sampling resolutions of 2.8 and 5.45 nm for Sensor 1 and Sensor 2, respectively. The sensors of VNIR and SWIR are pushbroom scanners that use an angular recording image width of 15 m. The field of view (FOV) can be doubled to 30° by a field expander lens. Table 2 lists the spectrometer parameters of the HySpex sensors of VNIR and SWIR.
The HySpex instrument is equipped with an inertial navigation system that applies a correction of geometric errors and georeferencing. The inertial navigation system can record the posture data of the aircraft (i.e., the sensor) in real-time to provide data support for the geometric coarse correction of the image data in the later stage. Data are transmitted and read through antennas between the hyperspectral sensor and the inertial navigation system. The antenna of the inertial navigation system should be aligned to the sky and the control antenna to the ground.
Ground-based field tasks were synchronously carried out during flight operations. A 4 m × 4 m white reference panel of identified reflectivity (∼80%) was placed on the ground in the test area. Several geographical reference correction points were also placed on the ground and measured by real-time kinematic navigation.
4 HySpex Data Processing Workflow
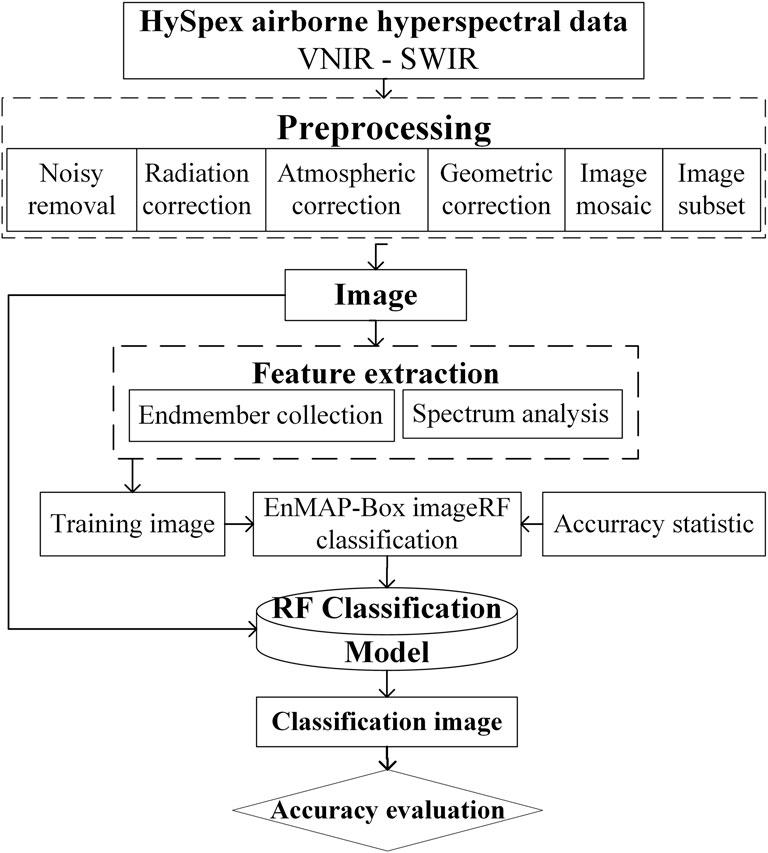
Figure 3 shows a workflow of HySpex data processing, including data acquisition, data preprocessing, RF methods, and accuracy evaluation. The afore mentioned stages are presented in more detail below.
4.1 Flight Planning and Data Acquisition
Before the flight experiments, the route distance, length, height, and flight speed were determined to ensure that repetition, a low signal-to-noise ratio, and a spatial resolution of high spectral imaging data were achieved. The relationship between route spacing, flight height, and image repetition rate is as follows:
where D represents the route spacing, A represents the instantaneous FOV angle of the spectrometer sensor, W represents the scan width of a route, H represents the flight height, and x represents the image repetition rate.
Flight experiments were conducted from October 9 to 11, 2017 between 09:00 and 12:15 local time in the area of Yudai. The weather conditions were as follows: sunny, cloudless, 15°C—25°C, and wind speed < 4 levels. To ensure that data splicing did not produce voids and affect the quality of the data, the repetition rate of the image data was set to approximately 40%. The instantaneous FOV angle of the HySpex two sensors was 32°. When the delta wing XT-912 aircraft was flown over the test site at an average altitude of 1 km above sea level, the average ground spatial resolutions were 1 and 1.2 m for the VNIR and SWIR images, respectively. Each route length was designed to be 5 km, and each route had a scan width of 286.7 m. Depending on the flight height and repetition rate, the route distance was approximately 400 m. Figure 4 shows the route designed for flight planning, which included the designed route of the flight location and flight endurance (Figure 4A), the flight tracks obtained using HySpex AIR software (Figure 4B), and a photo taken in-flight (Figure 4C).

FIGURE 4. Route design for flight planning. (A) Designed route of the flight location and flight endurance, (B) flight tracks of HySpex AIR software, and (C) a photo taken in-flight.
For this study, we selected a small area as the method training site. In the training site, we collected 26 hand specimens of alteration minerals, and each sample was ground and mounted on a glass holder for thin section preparation. We analyzed the thin sections using photomicrographs to determine the alteration and mineral composition of each specimen. The HySpex image processing used the professional remote sensing software ENVI 5.3 (Environment for Visualizing Images 5.3).
4.2 Hyperspectral Images Preprocessing
The obtained HySpex hyperspectral raw data were the original digital number (DN) value data without any physical significance; the data were without coordinate systems but had very strong geometric distortions and atmospheric effects. For the most recent HySpex SWIR instrument, the so called “keystone” effect (related to spatial mistration for different bands within a pixel) and the spectral smile effect (the spectral curvature effect is a spectral distortion) are considered during the data correction process to remove spectral and spatial misregistrations (Koloniatis et al., 2020). Data preprocessing forms the basis of alteration mineral mapping analysis, and mainly consists of radiation calibration, geometric correction, atmospheric correction, and bad band removal. First, the original DN value was converted to a radiation brightness value to obtain the attitude data of the flight platform synchronized with the images using HySpex RAD and HySpex NAV software, which was brought by the instrument manufacturer of NEO A/S. Second, atmospheric correction of the HySpex image data was performed by the atmospheric correction ATCOR4 software (ReSe Applications LLC, Swiss). Third, geometric correction, including coarse corrections and precision corrections, was carried out. PARGE (PARametric Geocoding, ReSe Applications LLC, Swiss)1, HySpex’s airborne post-processing software, was used for orthorectification and georeferencing with a standard digital elevation model. PARGE used an empirical view angle correction method available in the software to remove the view angle effects. Approximately 10 geographical reference correction points within the study area were used for precision geometric correction. The resulting geometric accuracy was > 0.50 m. Furthermore, a certified reflectance standard white reference panel of known reflectivity was recorded with each image and used as reference material to convert the obtained spectral data into reflectance data. To further analyze the HySpex spectral data, image registration, noise removal, mosaic, and mask were used by ENVI.
The efficacy of the geometric and atmospheric corrections was assessed by comparing the spectra extracted from the original and preprocessed image from the same location (Figure 5).
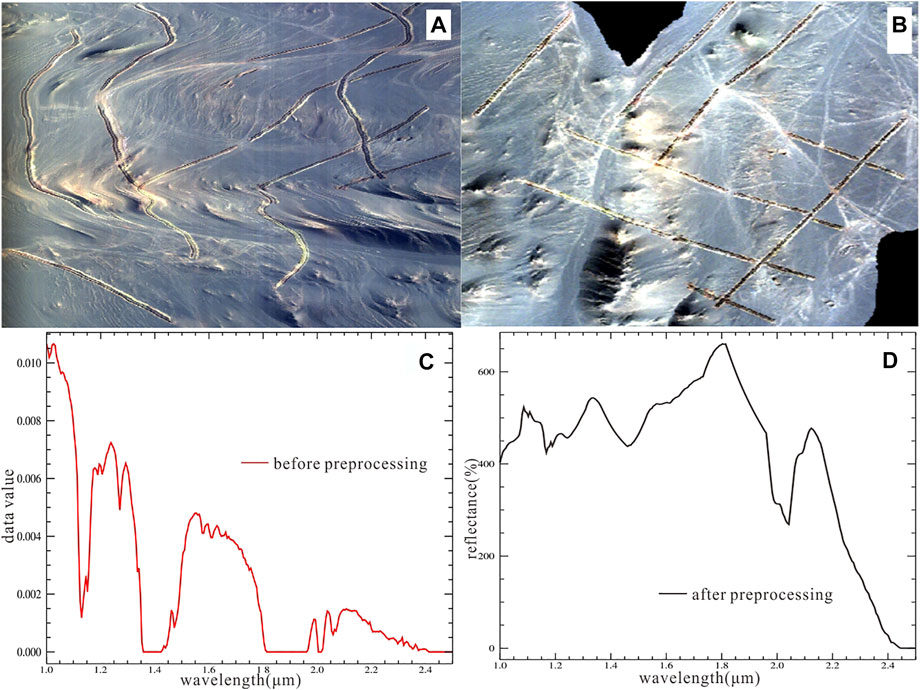
FIGURE 5. Geometric correction, atmospheric correction, and bad band removal (A) before geometric correction preprocessing, (B) after geometric correction preprocessing, (C) before atmospheric correction and bad band removal preprocessing, and (D) after atmospheric correction and bad band removal preprocessing.
4.3 Random Forest Algorithm
RF is an ensemble learning method for data classification, regression, and other tasks based on classification and regression trees (Breiman, 2001). The RF algorithm performs well with fewer training sample sets, less computation time, and more accuracy through its out-of-bag error estimation than other methods (Demarchi et al., 2014). Moreover, it offers a cross-validation-like accuracy measure through its out-of-bag error estimation and indicates variable importance through the loss in accuracy when feature values are randomly permuted (Breiman, 2001; Waske et al., 2012). Hence, when remotely sensed spectra represent mixtures of a variety of materials, RF is a highly robust discrimination method and can improve overall prediction accuracy.
In this study, RF was run using the ImageRF toolbox of the EnMAP-Box v2.2.1 software. ImageRF is an Interactive Data Language-based tool for RF classification and regression analysis of remote sensing imagery. A four-step image analysis workflow consisting of model parameterization and application is shown in Figure 4. First, the RF classification (RFC) model was made by a reference dataset for training and internal validation. Second, the RFC model was used to perform image classification. Third, the accuracy of the model was estimated by comparing it with an independent validation. Finally, the model was applied to the target image data.
4.4 Endmember Spectra Collection and Spectrum Analysis
The collection and analysis of endmember spectra are the first stages of classification because they are used as references for subsequent processing and directly affect the mapping results. Each endmember spectrum is the average of 10 typical endmember spectra obtained by manual selection from images collected with the VNIR and SWIR sensors. We analyzed the spectral absorption positions and overall spectral shapes based on expert knowledge to select possible alteration mineral endmembers. In addition, the spectra extracted from the HySpex image were compared with existing reference library standard spectra from the United States Geological Survey (USGS) spectral library (Kokaly et al., 2017). The extracted spectral information was evaluated by interactive visual inspection and ENVI 5.3. To complement this analysis, continuum removal was used to find differences between varying spectra (Clark and Roush, 1984). Continuum removal is generally normalized in the range of spectral reflectance (0–1) to enhance the absorption features and intensity of characteristic peaks.
In this study, images acquired by the VNIR and SWIR sensors were used to map different alteration minerals. Alteration minerals of metal ores (e.g., Fe, Cu, and Mn) can be mapped using the VNIR image of Sensor 1 (0.4–1.0 μm), and the OH-group and carbonate minerals can be identified using the SWIR image of Sensor 2 (0.93–2.5 μm) (Sabins, 1999; Clark et al., 2003; Kruse, 2012). Wavelengths outside the atmospheric windows of ∼1.45 and ∼1.91 μm of SWIR were eliminated from further consideration because atmospheric water vapor causes strong disturbances in these regions (Vane and Goetz, 1988; Magendran, 2014).
According to geological map and field references, endmember extraction yielded average spectral features for most alteration minerals in the study area, such as hematite, goethite, jarosite, calcite, epidote, kaolinite, and chlorite (Figure 7). The standard spectra, which were used for comparison with the endmember spectra, were obtained from the USGS spectral library. The common major absorption areas are highlighted by color blocks corresponding to the chemical components’ letters and arrows.
5 Results
5.1 Alteration Mineral Mapping
5.1.1 Iron Oxide Minerals
In the visible light bands, the endmember 1 spectrum displays a significant absorption feature at 0.51 μm, weak absorption valleys near 0.74 and 0.78 μm, and a distinct band centered at 0.91 μm (Figure 7A).
A previous study on visible light spectra of minerals and rocks found that crystal field effects are the most common electronic processes and are associated with transition elements such as ferrous (Fe2+) and ferric (Fe3+) iron (Hunt, 1971). Minerals containing Fe2+ have a wide absorption range centered near 1.0–1.1 μm with a longwave slope that can extend to ∼1.8 μm. For example, Fe3+ minerals in jarosite have crystal field absorptions near 0.51 μm (Hunt and Ashley, 1979). The position of the ∼0.91 μm absorption in hematite shifts to longer wavelengths in goethite samples, and this can be detected by hyperspectral imaging sensors.
The ferric iron minerals goethite (ɑ-FeOOH) and hematite (α-Fe2O3) have distinct spectral curves in the region of 0.35–0.90 μm owing to absorption induced by crystal field transitions near 0.46, 0.65, and 0.85–0.95 μm (Murphy and Monteiro, 2013). The general chemical formula of jarosite is AB3(SO4)2(OH)6, in which A represents K+ and B represents Fe3+ for typical jarosite. The groups of jarosite minerals are important indicators of aqueous, acidic, and oxidizing formation conditions (Singh et al., 2016).
The spectra assigned to goethite and hematite show strong absorption at 0.52 μm with matching bands at 0.42 μm (Figure 7C). In addition, the spectra of goethite and jarosite display a broad absorption feature at 0.91 μm with matching band-189 of HySpex VNIR. The absorption of spectra between 0.91 and 0.93 μm (bands 187–96) can, therefore, be assigned to hematite (Figure 7C). The wavelength position of the primary Fe3+ absorption band (∼ 0.92 μm) and the shapes of the absorption edge and shoulder near 0.48 and 0.55 μm, respectively, are most consistent with hematite, goethite, jarosite, or their combinations (Figure 7C). However, features of the endmember 1 spectrum show slight deviations and are relatively weaker than the standard spectrum. There are two possible reasons for this behavior: first, a mixing of the spectra of hematite, goethite, and jarosite may have occurred, which also mixes the spectra of primary rock-forming minerals and secondary weathering minerals (Metelka et al., 2015); second, there may be potential masking by pyrophyllite and chlorite owing to Fe–OH and OH stretching and bending (Hosseinjani Zadeh et al., 2014).
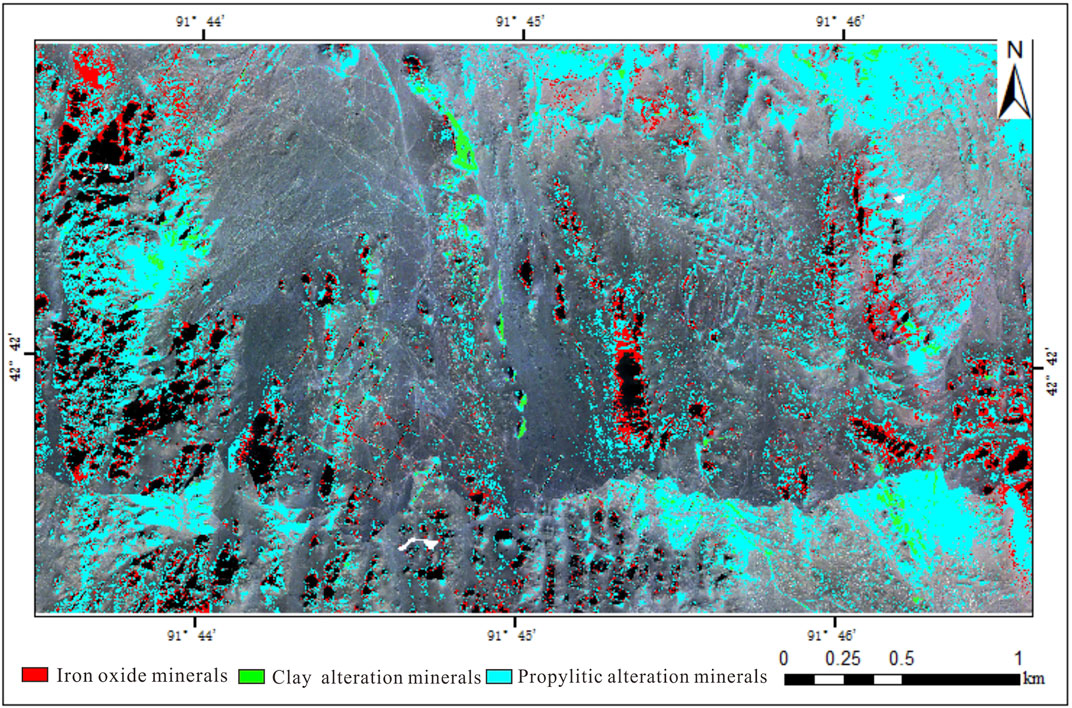
The iron oxide minerals (red-colored pixels in Figure 7) such as hematite, goethite, and jarosite occur in a mostly longitudinal distribution and coincide with mine pits and grooves in the Yudai area, reflecting the secondary alteration of iron-rich minerals. Under oxygen-rich conditions, oxidation is the main iron mineral alteration, and secondary weathering minerals dominate the reflectance spectra (Singh et al., 2016). Iron absorptions associated with both primary rock-forming minerals and secondary weathering minerals (hematite and goethite) were detected in most samples (Metelka et al., 2015).
5.1.2 Clay Alteration Minerals
The spectral profile of endmember 2 has absorption bands centered at 1.43, 1.91, 2.18, and 2.21 µm (Figure 7D), corresponding to H2O, OH, Al-OH, and Mg-OH vibrations, respectively. In the 2.0–2.5 µm region (Figure 7E), the endmember 2 spectrum shows characteristic absorption at 2.21 μm and minor changes in the intensity of reflectance near 2.16 μm, which is an easily identifiable bimodal feature. This strong absorption with discrete absorption features at 2.21 μm is characteristic of Al-OH minerals (Hosseinjani Zadeh et al., 2014). Kaolinite predictably exhibited the strongest water overtones at 1.43 µm, in addition to water combination bands at 1.90 µM, with strong OH combination bands from 2.1 to 2.4 µm (Figures 7E,F). Most importantly, Al-OH clays (kaolin-group minerals) have diagnostic absorption features between 2.18 and 2.21 μm as a result of a combination of Al-OH bending and OH stretching vibrations (Clark et al., 2003). In our data, spectra with diagnostic absorption features at 2.16 μm (band of 440) and 2.21 μm (band of 449) attributable to Al-OH vibration are indicators of kaolinite (Figure 7E).
Kaolinite, smectite, and illite are mainly the result of clay alteration; this hydrothermal alteration of wall rock that contains the alteration minerals of kaolinite alteration (light-green-colored pixels in Figure 7) is concentrated near pits and grooves.
5.1.3 Propylitic Alteration Minerals
The reflectance change from the 2.0–2.5 μm region is lower, and the endmember three spectrum tends to be similar to that of calcite, epidote, and chlorite (Figure 7I). The SWIR spectrum displays a weak absorption valley close to 2.26 μm and a distinct band centered near 2.35 μm. In addition, Fe-OH molecules lead to absorption bands at 2.44 μm (Murphy and Monteiro, 2013). Figures 6H,I show the reflectance spectra of chlorite, calcite, and epidote between 2.0 and 2.5 μm in the near-infrared that. The diagnostic infrared absorption feature of calcite (CaCO3) is focused at 2.34 μm, as is those of epidote [Ca2(Fe3+, Al)3(SiO4)3(OH)] and chlorite [(Mg, Fe2+)5 Al (Si3Al) O10(OH)8] (Dalton et al., 2004). Even though we found a small shoulder near 2.34 μm in the main absorption valley, there is no corresponding absorption feature in the spectrum of calcite. Calcite shows a weak and small absorption valley near 2.15 μm, that is, not detected for other minerals (Dalton et al., 2004). The secondary absorption feature (∼2.26 μm) of the chlorite spectrum would have changed and obscured the tendency and strength of the primary absorption feature (∼2.34 μm; Figures 7H, 5I). The spectral signature of epidote has nearly the same features as that of chlorite. The spectral relationships help with the identification of these minerals using remote sensing data. The spectrum of endmember 3, which was assigned to calcite, epidote, and chlorite, shows broad and strong absorption at 2.35 μm, matching band 475 (Figure 7I). In addition, the spectra with absorptions at 2.26 μm (band 459) can be assigned to epidote and chlorite.
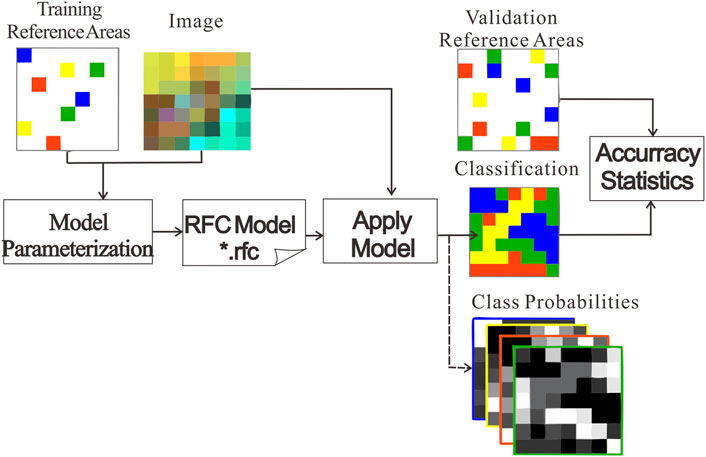
FIGURE 6. Workflow of parameterization, application, and assessment of the random forest classification (RFC) model in the ImageRF toolbox of EnMAP-Box v2.2.1.
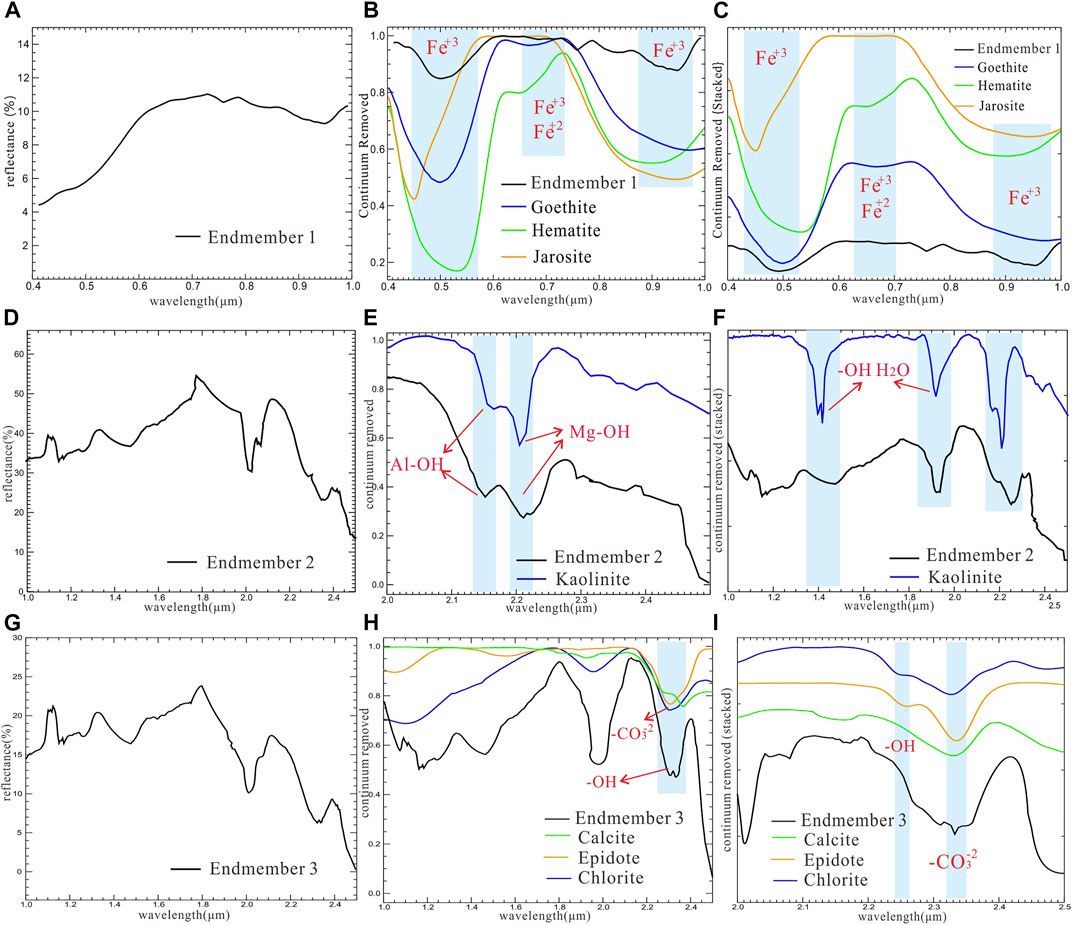
FIGURE 7. Endmember spectra. (A), (B), and (C) Endmember 1/iron oxide minerals; (D), (E), and (F) endmember 2/clay alteration; and (G), (H), and (I) endmember 3/propylitic alteration; (A), (D), and (G) reflectance of the endmember spectra; (B), (E), and (H) continuum removal spectra of endmembers and standard spectra; (C), (F), and (I) continuum removal spectra (stacked) of endmembers and standard spectra.
Propylitic alteration is the chemical alteration of rock, that is, rich in biotite or amphibole owing to iron- and magnesium-bearing hydrothermal fluids. Pixels indicating propylitic alteration (light-blue-colored pixels in Figure 8) are the most common class of pixels on the map of Yudai, demonstrating the dominance of propylitic alteration over porphyry copper bodies. Chlorite, calcite, and epidote can be identified through the method; however, the three endmember minerals create discrepancies in areas where they are combined and have different particle sizes.
5.2 Accuracy Evaluation
The accuracy of our mineral identification was evaluated via the mineralogical analysis of samples collected during fieldwork (Figure 9). We used the common classification comparison method, overall accuracy, and Kappa classification accuracy. The classification accuracy of iron oxide minerals, clay alteration minerals and propylitic alteration minerals was 82.60, 62.16, and 70.59%, respectively. The overall classification accuracy and Kappa classification were 73.08 and 65.73%, respectively. The experiments demonstrate that the workflow for processing data and using RF algorithm is feasible and active, and show a good performance in classification accuracy.
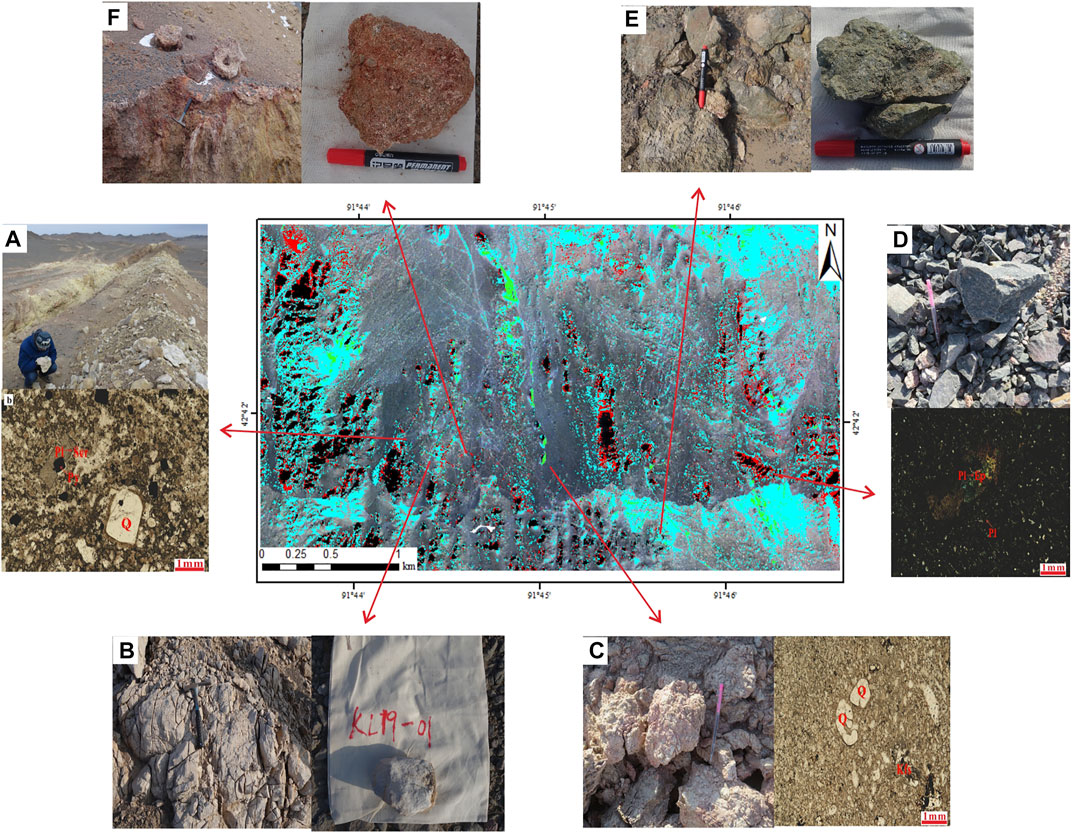
FIGURE 9. Accuracy evaluation map, hand specimen photographs, and thin section photomicrographs at 10-fold magnification. (A) Iron oxide minerals, (B) clay alteration minerals, (C) clay alteration minerals, (D) propylitic alteration minerals, (E) propylitic alteration minerals, and (F) iron oxide minerals. Qtz, quartz; Pl, plagioclase; Ser, sericite; Py, pyrite; Ep, epidote.
The mineralogy of each HySpex image pixel identified using the proposed method generally matched our field observations (Foody, 2002). There was excellent consistency in the alteration minerals observed through visual inspection (Figure 9). The main alteration mineral assemblages were primarily distributed around pits and grooves. However, minor differences were noticed, most of which were owing to co-occurrences of alteration minerals in the study area. Furthermore, the poor effect of classification includes some other environmental reasons, such as shadows of mountains, valleys, and rock walls; the footprint of wheels in the study area; and white holes caused by sun’s violent reflection.
6 Discussion
6.1 HySpex Airborne Hyperspectral Image Data Acquisition
In this study, a HySpex aircraft system including HySpex sensors, computer assembly, inertial navigation set, and battery pack was successfully mounted on an aircraft platform. Using this system, we designed a route and performed flight test acquisition, geometric correction, and atmospheric correction based on the collected hyper spectroscopic image to provide basic data for corrosion information extraction. The final remote sensing data were obtained through radiation correction, bad band removal, spectral reconstruction, cutting, and splicing.
With recent fundamental developments in remote sensing, sensor design, processing rate, computer power, and speed, this technology has wide-ranging applications including mineral identification with high-quality spatial resolution. Recent research has focused on HySpex data from laboratory and field-based research. Most studies have shown how spectra can be interpreted and processed to produce mineralogical information using an array of HySpex data, such as mine faces, diamond cores, and drill chips (Kurz et al., 2008, 2009; Buckley et al., 2013; Qiu et al., 2017). However, compared with ground-based data, airborne acquisition of HySpex hyperspectral data has several advantages in terms of convenience and efficiency of data collection over large areas. In addition, the images include data on the geological context and textures of a rock unit and can detect faults and fractures as well as evaluate the degree of veining or dissemination of minerals (Qiu et al., 2017).
Specifically, using HySpex airborne hyperspectral data in large mining areas offers three distinct advantages. First, HySpex airborne hyperspectral data connect both spectral and spatial imaging methods, creating the illustration of objects in 504 contiguous and narrow spectral bands, with spectral resolutions of 2.8 and 5.45 nm, respectively. Second, SWIR sensors (0.93–2.5 μm) are used in combination with sensors operating in the VNIR (0.4–1.0 μm) range, allowing the user to separate and identify different alteration mineral assemblages (Dalponte et al., 2013). Third, a very high spatial resolution can be obtained using aerial platforms, which supports mapping at different scales. The spatial resolution is based on the performance parameter of the sensor, the flying altitude, and weather conditions during acquisition. With a delta wing XT-912 aircraft, spatial resolutions of 1 and 1.2 m were achieved for the VNIR and SWIR images, respectively, enabling the accurate identification and mapping of alteration minerals.
6.2 RF Algorithm
The RF algorithm refers to decision tree modeling of each bootstrap sample using bootstrap resampling methods by taking multiple samples from the original sample. When image classification is performed using the RF method, the final category of each image element is determined by the joint voting after each decision tree. Therefore, the RF classifier has a high-dimensional processing capability and can solve problems that occur as a result of high spectra (e.g., few training samples and class imbalance). To differentiate the ensemble predictors, not all available features are used to determine the optimum split point in a node. Instead, only a predetermined number of randomly selected features are used to avoid overfitting the model.
In this study, the identification of corrosion mineral information differed from the conventional classification; it is difficult to identify and extract the target information from the algorithm in the absence of prior knowledge. Moreover, the alternation mineral information has its own characteristics; therefore, extracting information from complex ground object spectra, making the property judgment, and then extracting the training samples were all required. For the applicability of the RF algorithm in imaging for the identification of high spectral erosion mineral information, combining the RF algorithm with the spectral feature matching technique was the proposed method. During the experiment, the training samples overcame the difficulty of extracting corrosion mineral information, and the training model of RF was constructed to apply the RF algorithm to hyperspectral corrosion mineral information identification.
6.3 Identification and Mapping Alteration Minerals
The main absorption features of rocks in VNIR are affected by the presence of various iron minerals, in addition to mixtures of ferric oxides, ferric hydroxides, and other minerals (Ramanaidou et al., 2007; Salles et al., 2017). Ferric oxides are recognized by their various spectral properties; for example, an absorption edge at 0.52 μm, an absorption band or shoulder at 0.74 μm, and a strong absorption band between 0.86 and 0.98 μm (endmember 1). The SWIR region (0.1–2.5 μm) is key to identifying carbonates and hydrous minerals (Clark, 1999; Guo et al., 2017) that are often products of hydrothermal alteration. Spectral features at 1.0–2.5, 2.2–2.5, and 1.9 μm are attributable to O–H vibrations, hydroxyl groups, and the water content of the rocks, respectively (Velasco et al., 2005; Milton et al., 2009). All spectra exhibit several typical absorption bands, including bound water resulting in absorption bands generally at 1.4 and 1.9 μm, and structural water absorption bands at 1.4, 2.2, 2.3, and 2.4 μm. The geometries of sites occupied by water affect the shapes, intensities, and widths of the 1.4 and 1.9 μm bands (Clark et al., 2003; Dalton et al., 2004). We did not consider features located around 1.45 and 1.91 μm as features in these regions are attributable to atmospheric water vapor (Vane and Goetz, 1988).
This study provides an example of the airborne acquisition and utilization of HySpex hyperspectral data for mineral mapping and the identification of lithologic units. By overcoming problems regarding safety, flight technology, field wind impact, and image processing, the preliminary results indicate that hyperspectral images of HySpex provide excellent and effective data for separating alteration mineral assemblages in the Yudai porphyry mineralization. The spectral curve characteristics of Cu mineralization show that the strong iron oxide/hydroxide characteristic absorption at 0.51 μm and the weak absorption valleys near 0.74 and 0.78 μm are caused by goethite and hematite; the absorption bands centered at 2.18 and 2.21 µm are caused by Al-OH and Mg-OH vibrations; and the weak absorption valley close to 2.26 μm and a distinct band centered near 2.35 μm may be the reflectance spectra of propylitic alteration minerals. According to the type and distribution characteristics of alteration mineral assemblages by hyperspectral remote sensing and geological characteristics of the study area, the hyperspectral remote sensing prospecting model of the alteration mineral assemblages of the Yudai copper deposit was determined as iron oxide/hydroxide, clay, and propylitic alteration.
Notably, high classification accuracy with a low time-cost for identification of alteration mineral assemblages in the mine pits and grooves was obtained. However, the reflectance spectra did not provide the complete identification and mapping of the surface mineralogy. In the field investigation, physical characteristics of minerals and rocks revealed that there is a stain of iron oxide/hydroxide, clay, and propylitic alteration minerals on the rocks and the surface of the mine pits, whereas the grooves are colored yellow but change to red with increasing depth. These changes occur mainly because of hydrothermally altered minerals but can also be generated through redox potentials at the time of weathering, and even during secondary weathering (Tripathi et al., 2020). This limitation is most likely related to the spectral resolution of diagnostic absorption features of the field reflectance spectra, the spectral resolution of the image, the spatial extent of the ground target, the spatial resolution of the image, noise in the image, and the accuracy of image preprocessing (Kodikara et al., 2012). Moreover, geologic surfaces are always partly shielded with non-geologic materials or composed of mixtures of minerals with different grain sizes and varying grades of compaction and weathering. The remote spectral measurements and the limit on the number of pixels that can be classified and mapped were greatly influenced by these factors.
By comparing the spectra of rock and ore samples from hyperspectral images with standard spectra from the USGS database and the open integrated rock spectral library, the principle spectral absorption characteristics of the altered rock units were comprehensively understood, laying a theoretical foundation for mapping alteration products (Xie B. et al., 2022). The total shape of some reference spectra differed from the extracted spectra, most likely because the reference spectra are based on pure materials, which are unusual in natural environments. In addition, residual atmospheric absorption features, grain size variation, rock/desert varnish of rock surfaces, and calibration errors of laboratory spectrometers and/or hyperspectral instruments may have contributed to these differences. Therefore, image spectra, instead of library reference spectra, should be used as reference spectra in the RF algorithm.
The applicability of the algorithm was verified experimentally and provides a technical reference for subsequent work. However, this study has some limitations. For classification, the problem of mixed image decomposition may affect high spectral images. Information identification in this study was based on image endmembers, which directly affected the classification accuracy and caused the results to show discrete points and discontinuities in graph spots. Meanwhile, some environmental factors, such as shadows, ground trajectory, and violent reflection also affect the classification accuracy. Consequently, subsequent studies should focus on extending our analyses over a wider range of spatial scales, including field and laboratory scales, using hyperspectral data with high spatial and spectral resolutions. HySpex sensors can also be used in the field and laboratory to acquire ground spectra of altered minerals, considering weathered surfaces, grain size variation, and other natural variations. To increase our understanding of the differences in spectra between mixtures of minerals and pure minerals, spectral tests of such minerals and mineral assemblages are required, both at field and laboratory scales. In the meantime, we will expand our analyses to better understand the connection between spectral features and mineral alteration in addition to the mineral structure.
7 Conclusion
This study investigated the practicability of using HySpex airborne hyperspectral imaging for the detection and mapping of alteration zones in the Yudai porphyry mineralization area of Kalatag district, northwest China. The results show that HySpex airborne hyperspectral data can be used to detect alteration zones. The main conclusions are summarized follows:
1) The study presents an effective sequence for analyzing HySpex airborne hyperspectral data for lithological discrimination and mineral mapping. The analytical sequence consists of geometric correction, atmospheric correction, bad band removal, spectral reconstruction, the selection of a classification method (RF algorithm), spectrum analysis, and alteration mineral mapping.
2) Using alteration mineral spectra, expert knowledge, and an RF algorithm, the distribution of alteration minerals was mapped. Endmember pixel extraction yields average spectral signatures for most alteration mineral assemblages (goethite, hematite, jarosite, kaolinite, calcite, epidote, and chlorite). As remotely sensed spectra generally represent mixtures of materials, the RF method performs well.
3) Alteration mineral assemblages of iron oxide/hydroxide, clay, and propylitic alteration were found, and their distributions generally coincide with field observations. Although endmember minerals can be identified using this proposed scheme, discrepancies arise in areas where minerals occur as complex mixtures. The shape of the spectral curve of endmembers can change based on several factors, such as the replacement of iron by aluminum, particle size variations causing trans-opaque spectral effects in different wavelengths of the spectrum, and particle shape.
HySpex sensors mounted on a delta wing XT-912 aircraft have the advantage of producing integrated images and spectra. The high spatial resolution produces images at a large scale, and the high spectral resolution can facilitate the accurate identification of alteration minerals. Hence, this study demonstrates that airborne hyperspectral imaging can be widely applied to basic geological research and mineral exploration.
Data Availability Statement
The raw data supporting the conclusions of this article will be made available by the authors, without undue reservation.
Author Contributions
WSS was responsible for most of the experimental analysis and paper writing; ZKF and ZJ was responsible for sampling and experimental processing; WSS and WJL was responsible for the experimental design and the paper revision.
Funding
This work was funded by the Chinese Academy of Sciences, “Western Young Scholars” Fund (grant number 2021-XBQNXZ-011), the Key Project of Natural Science Foundation of China - Xinjiang Joint Fund (grant number U1803241),the Key Project of the Autonomous Region Innovation Environment Construction Project “Talent Project - Tianshan Youth Project” (grant number 2019Q033), the Chinese Academy of Sciences, “Light of West China” Fund (grant number 2017-XBQNXZ-B-019), and Xinjiang Science and Technology Major Project (grant number 2021A03001-3).
Conflict of Interest
The authors declare that the research was conducted in the absence of any commercial or financial relationships that could be construed as a potential conflict of interest.
Publisher’s Note
All claims expressed in this article are solely those of the authors and do not necessarily represent those of their affiliated organizations, or those of the publisher, the editors and the reviewers. Any product that may be evaluated in this article, or claim that may be made by its manufacturer, is not guaranteed or endorsed by the publisher.
Acknowledgments
The authors would like to thank the Xinjiang Laboratory of Mineral Resources and Digital Geology, CAS, Urumqi 830011, China, for their contribution in the collection of information for this study.
References
Ali, A. M., Darvishzadeh, R., Skidmore, A. K., and van Duren, I. (2017). Specific Leaf Area Estimation from Leaf and Canopy Reflectance through Optimization and Validation of Vegetation Indices. Agric. For. Meteorology 236, 162–174. doi:10.1016/j.agrformet.2017.01.015
Baissa, R., Labbassi, K., Launeau, P., Gaudin, A., and Ouajhain, B. (2011). Using Hyspex Swir-320m Hyperspectral Data for the Identification and Mapping of Minerals in Hand Specimens of Carbonate Rocks from the Ankloute Formation (Agadir Basin, Western Morocco). J. Afr. Earth Sci. 61, 1–9. doi:10.1016/j.jafrearsci.2011.04.003
Batchelor, A. R., Ferrari-John, R. S., Katrib, J., Udoudo, O., Jones, D. A., Dodds, C., et al. (2016). Pilot Scale Microwave Sorting of Porphyry Copper Ores: Part 1 - Laboratory Investigations. Miner. Eng. 98, 303–327. doi:10.1016/j.mineng.2016.07.007
Buckley, S. J., Kurz, T. H., Howell, J. A., and Schneider, D. (2013). Terrestrial Lidar and Hyperspectral Data Fusion Products for Geological Outcrop Analysis. Comput. Geosciences 54, 249–258. doi:10.1016/j.cageo.2013.01.018
Chen, L., Wang, J.-B., Bagas, L., Wu, X.-B., Zou, H.-Y., Zhang, H.-Q., et al. (2017). Significance of Adakites in Petrogenesis of Early Silurian Magmatism at the Yudai Copper Deposit in the Kalatag District, NW China. Ore Geol. Rev. 91, 780–794. doi:10.1016/j.oregeorev.2017.08.022
Clark, R. N., and Roush, T. L. (1984). Reflectance Spectroscopy: Quantitative Analysis Techniques for Remote Sensing Applications. J. Geophys. Res. 89, 6329–6340. doi:10.1029/jb089ib07p06329
Clark, R. N. (1999). “Spectroscopy of Rocks and Minerals, and Principles of Spectroscopy,” in Remote Sensing for the Earth Sciences: Manual of Remote Sensing (New York: John Wiley & Sons), 3–58.
Clark, R. N., Swayze, G. A., Livo, K. E., Kokaly, R. F., Sutley, S. J., Dalton, J. B., et al. (2003). Imaging Spectroscopy: Earth and Planetary Remote Sensing with the Usgs Tetracorder and Expert Systems. J.-Geophys.-Res. 108, 5131. doi:10.1029/2002je001847
Cristóbal, J., Graham, P., Prakash, A., Buchhorn, M., Gens, R., Guldager, N., et al. (2021). Airborne Hyperspectral Data Acquisition and Processing in the Arctic: A Pilot Study Using the Hyspex Imaging Spectrometer for Wetland Mapping. Remote Sens. 13, 1178.
Dalm, M., Buxton, M. W. N., and van Ruitenbeek, F. J. A. (2017). Discriminating Ore and Waste in a Porphyry Copper Deposit Using Short-Wavelength Infrared (SWIR) Hyperspectral Imagery. Miner. Eng. 105, 10–18. doi:10.1016/j.mineng.2016.12.013
Dalponte, M., Orka, H. O., Gobakken, T., Gianelle, D., and Naesset, E. (2013). Tree Species Classification in Boreal Forests with Hyperspectral Data. IEEE Trans. Geosci. Remote Sens. 51, 2632–2645. doi:10.1109/tgrs.2012.2216272
Dalton, J. B., Bove, D. J., Mladinich, C. S., and Rockwell, B. W. (2004). Identification of Spectrally Similar Materials Using the USGS Tetracorder Algorithm: the Calcite-Epidote-Chlorite Problem. Remote Sens. Environ. 89, 455–466. doi:10.1016/j.rse.2003.11.011
Demarchi, L., Canters, F., Cariou, C., Licciardi, G., and Chan, J. C.-W. (2014). Assessing the Performance of Two Unsupervised Dimensionality Reduction Techniques on Hyperspectral APEX Data for High Resolution Urban Land-Cover Mapping. ISPRS J. Photogrammetry Remote Sens. 87, 166–179. doi:10.1016/j.isprsjprs.2013.10.012
Eckardt, A., Horack, J., Lehmann, F., Krutz, D., Drescher, J., Whorton, M., et al. (2015). “Desis (DLR Earth Sensing Imaging Spectrometer for the ISS-MUSES Platform),” in 2015 IEEE International Geoscience and Remote Sensing Symposium, 1457–1459. doi:10.1109/igarss.2015.7326053
Foody, G. M. (2002). Status of Land Cover Classification Accuracy Assessment. Remote Sens. Environ. 80, 185–201. doi:10.1016/s0034-4257(01)00295-4
Gomez, C., Adeline, K., Bacha, S., Driessen, B., Gorretta, N., Lagacherie, P., et al. (2018). Sensitivity of Clay Content Prediction to Spectral Configuration of VNIR/SWIR Imaging Data, from Multispectral to Hyperspectral Scenarios. Remote Sens. Environ. 204, 18–30. doi:10.1016/j.rse.2017.10.047
Grove, C. I., Hook, S. J., and Paylor Ii, E. D. (1992). Compilation of Laboratory Reflectance Spectra of 160 minerals, 0.4 to 25 Micrometers. Washington, DC: Jet Propulsion Laboratory, National Astronautics and Space Administration.
Guha, A. (2020). “Mineral Exploration Using Hyperspectral Data,” in Hyperspectral Remote Sensing. Editors P. C. Pandey, P. K. Srivastava, H. Balzter, B. Bhattacharya, and G. P. Petropoulos (Elsevier), 15, 293–318. doi:10.1016/b978-0-08-102894-0.00012-7
Guo, N., Thomas, C., Tang, J., Tong, Q., Guo, N., Cudahy, T., et al. (2019). Mapping White Mica Alteration Associated with the Jiama Porphyry-Skarn Cu Deposit, Central Tibet Using Field Swir Spectrometry. Ore Geol. Rev. 108, 147–157. doi:10.1016/j.oregeorev.2017.07.027
Hosseinjani Zadeh, M., Tangestani, M. H., Roldan, F. V., and Yusta, I. (2014). Sub-Pixel Mineral Mapping of a Porphyry Copper Belt Using EO-1 Hyperion Data. Adv. Space Res. 53, 440–451. doi:10.1016/j.asr.2013.11.029
Hunt, G. R., and Ashley, R. P. (1979). Spectra of Altered Rocks in the Visible and Near Infrared. Econ. Geol. 74, 1613–1629. doi:10.2113/gsecongeo.74.7.1613
Hunt, G. R. (1971). Visible and Near-Infrared Spectra of Minerals and Rocks: II Carbonates. Mod. Geol. 2, 23–30.
Iyakwari, S., Glass, H. J., Rollinson, G. K., and Kowalczuk, P. B. (2016). Application of Near Infrared Sensors to Preconcentration of Hydrothermally-Formed Copper Ore. Miner. Eng. 85, 148–167. doi:10.1016/j.mineng.2015.10.020
Jing, C., Bokun, Y., Runsheng, W., Feng, T., Yingjun, Z., Dechang, L., et al. (2014). Regional-scale Mineral Mapping Using ASTER VNIR/SWIR Data and Validation of Reflectance and Mineral Map Products Using Airborne Hyperspectral CASI/SASI Data. Int. J. Appl. Earth Observation Geoinformation 33, 127–141. doi:10.1016/j.jag.2014.04.014
Kodikara, G. R. L., Woldai, T., van Ruitenbeek, F. J. A., Kuria, Z., van der Meer, F., Shepherd, K. D., et al. (2012). Hyperspectral Remote Sensing of Evaporate Minerals and Associated Sediments in Lake Magadi Area, kenya. Int. J. Appl. Earth Observation Geoinformation 14, 22–32. doi:10.1016/j.jag.2011.08.009
Kokaly, R. F., Clark, R. N., Swayze, G. A., Livo, K. E., and Hoefen, T. M. (2017). USGS Spectral Library Version 7. U.S. Geological Survey, Reston, Virginia
Koloniatis, K., Andronis, V., and Karathanassi, V. (2020). “Spectral Smile Correction for Airborne Imaging Spectrometers,” in Hyperspectral Remote Sensing. Editors P. C. Pandey, P. K. Srivastava, H. Balzter, B. Bhattacharya, and G. P. Petropoulos (Elsevier), 2, 23–44. doi:10.1016/b978-0-08-102894-0.00003-6
Kruse, F. A. (2012). Mapping Surface Mineralogy Using Imaging Spectrometry. Geomorphology 137, 41–56. doi:10.1016/j.geomorph.2010.09.032
Kurz, T. H., Buckle, S. J., Howell, J. A., and Schneider, D. (2009). Close Range Hyperspectral and Lidar Data Integration for Geological Outcrop Analysis. The Workshop on Hyperspectral Image & Signal Processing: Evolution in. Remote Sens. 1–4.
Kurz, T. H., Buckley, S. J., Howell, J. A., and Schneider, D. (2008). Geological Outcrop Modelling and Interpretation Using Ground Based Hyperspectral and Laser Scanning Data Fusion, 37.
Magendran, T. (2014). Statistical and Neural Network Analysis of Hyperspectral Radiometric Data to Characterise Hematite of Singbhum Iron Ore Belt. (SPIE India).
Mathieu, M., Roy, R., Launeau, P., Cathelineau, M., and Quirt, D. (2017). Alteration Mapping on Drill Cores Using a Hyspex Swir-320m Hyperspectral Camera: Application to the Exploration of an Unconformity-Related Uranium Deposit (Saskatchewan, Canada). J. Geochem. Explor. 172, 71–88. doi:10.1016/j.gexplo.2016.09.008
Metelka, V., Baratoux, L., Jessell, M. W., and Naba, S. (2015). Visible and Infrared Properties of Unaltered to Weathered Rocks from Precambrian Granite-Greenstone Terrains of the West African Craton. J. Afr. Earth Sci. 112, 570–585. doi:10.1016/j.jafrearsci.2015.10.003
Milton, E. J., Schaepman, M. E., Anderson, K., Kneubühler, M., and Fox, N. (2009). Progress in Field Spectroscopy. Remote Sens. Environ. 113, S92–S109. doi:10.1016/j.rse.2007.08.001
Murphy, R. J., and Monteiro, S. T. (2013). Mapping the Distribution of Ferric Iron Minerals on a Vertical Mine Face Using Derivative Analysis of Hyperspectral Imagery (430-970nm). ISPRS J. Photogrammetry Remote Sens. 75, 29–39. doi:10.1016/j.isprsjprs.2012.09.014
Osterloo, M. M., Hamilton, V. E., and Anderson, F. S. (2012). A Laboratory Study of the Effects of Roughness on the Thermal Infrared Spectra of Rock Surfaces. Icarus 220, 404–426. doi:10.1016/j.icarus.2012.04.020
Paoletti, M. E., Haut, J. M., Plaza, J., and Plaza, A. (2019). Deep Learning Classifiers for Hyperspectral Imaging: A Review. ISPRS J. Photogrammetry Remote Sens. 158, 279–317. doi:10.1016/j.isprsjprs.2019.09.006
Qiu, J.-T., Zhang, C., Yu, Z.-F., Xu, Q.-J., Wu, D., Li, W.-W., et al. (2017). Subsetting Hyperspectral Core Imaging Data Using a Graphic-Identification-Based IDL Program. Comput. Geosciences 106, 68–76. doi:10.1016/j.cageo.2017.05.009
Ramanaidou, E., Wells, M. A., Belton, D., Verral, D., and Ryan, C. (2007). Mineralogical and Microchemical Methods for the Characterization of High-Grade BIF Derived Iron Ore. Econ. Geol. 15, 129–156.
Reath, K. A., and Ramsey, M. S. (2013). Exploration of Geothermal Systems Using Hyperspectral Thermal Infrared Remote Sensing. J. Volcanol. Geotherm. Res. 265, 27–38. doi:10.1016/j.jvolgeores.2013.08.007
Riaza, A., Strobl, P., Beisl, U., Hausold, A., and Müller, A. (2001). Spectral Mapping of Rock Weathering Degrees on Granite Using Hyperspectral DAIS 7915 Spectrometer Data. Int. J. Appl. Earth Observation Geoinformation 3, 345–354. doi:10.1016/s0303-2434(01)85042-x
Rickard, L. J., Basedow, R. W., Zalewski, E. F., Silverglate, P. R., and Lander, L. M. (1993). HYDICE: An Airborne System for Hyperspectral Imaging. International Society for Optical Engineering, Imaging Spectrometry of the Terrestrial Environment, Orlando, FL, United States.
Rogge, D., Rivard, B., Segl, K., Grant, B., and Feng, J. (2014). Mapping of NiCu-PGE Ore Hosting Ultramafic Rocks Using Airborne and Simulated EnMAP Hyperspectral Imagery, Nunavik, Canada. Remote Sens. Environ. 152, 302–317. doi:10.1016/j.rse.2014.06.024
Rowan, L. C., Crowley, J. K., Schmidt, R. G., Ager, C. M., and Mars, J. C. (2000). Mapping Hydrothermally Altered Rocks by Analyzing Hyperspectral Image (AVIRIS) Data of Forested Areas in the Southeastern United States. J. Geochem. Explor. 68, 145–166. doi:10.1016/s0375-6742(99)00081-3
Rowan, L. C., Simpson, C. J., and Mars, J. C. (2004). Hyperspectral Analysis of the Ultramafic Complex and Adjacent Lithologies at Mordor, NT, Australia. Remote Sens. Environ. 91, 419–431. doi:10.1016/j.rse.2004.04.007
Sabins, F. F. (1999). Remote Sensing for Mineral Exploration. Ore Geol. Rev. 14, 157–183. doi:10.1016/s0169-1368(99)00007-4
Salimi, A., Ziaii, M., Amiri, A., Hosseinjani Zadeh, M., Karimpouli, S., and Moradkhani, M. (2018). Using a Feature Subset Selection Method and Support Vector Machine to Address Curse of Dimensionality and Redundancy in Hyperion Hyperspectral Data Classification. Egypt. J. Remote Sens. Space Sci. 21, 27–36. doi:10.1016/j.ejrs.2017.02.003
Salles, R. d. R., de Souza Filho, C. R., Cudahy, T., Vicente, L. E., and Monteiro, L. V. S. (2017). Hyperspectral Remote Sensing Applied to Uranium Exploration: A Case Study at the Mary Kathleen Metamorphic-Hydrothermal U-REE Deposit, NW, Queensland, Australia. J. Geochem. Explor. 179, 36–50. doi:10.1016/j.gexplo.2016.07.002
Singh, M., Rajesh, V. J., Sajinkumar, K. S., Sajeev, K., and Kumar, S. N. (2016). Spectral and Chemical Characterization of Jarosite in a Palaeolacustrine Depositional Environment in Warkalli Formation in Kerala, South India and its Implications. Spectrochimica Acta Part A Mol. Biomol. Spectrosc. 168, 86–97. doi:10.1016/j.saa.2016.05.035
Steffens, M., and Buddenbaum, H. (2013). Laboratory Imaging Spectroscopy of a Stagnic Luvisol Profile - High Resolution Soil Characterisation, Classification and Mapping of Elemental Concentrations. Geoderma 195-196, 122–132. doi:10.1016/j.geoderma.2012.11.011
Sun, Y., Wang, J., Li, Y., Wang, Y., Yu, M., Long, L., et al. (2017). Recognition of Late Ordovician Yudai Porphyry Cu (Au, Mo) Mineralization in the Kalatag District, Eastern Tianshan Terrane, NW China: Constraints from Geology, Geochronology, and Petrology. Ore Geol. Rev. 100, 220–236. doi:10.1016/j.oregeorev.2017.07.011
Sun, Z., Chang, N.-B., Opp, C., and Hennig, T. (2011). Evaluation of Ecological Restoration through Vegetation Patterns in the Lower Tarim River, china with MODIS NDVI Data. Ecol. Inf. 6, 156–163. doi:10.1016/j.ecoinf.2010.10.002
Tan, K., Ma, W., Chen, L., Wang, H., Du, Q., Du, P., et al. (2021). Estimating the Distribution Trend of Soil Heavy Metals in Mining Area from HyMap Airborne Hyperspectral Imagery Based on Ensemble Learning. J. Hazard. Mater. 401, 123288. doi:10.1016/j.jhazmat.2020.123288
Tripathi, M. K., Govil, H., and Chattoraj, S. L. (2020). Identification of Hydrothermal Altered/weathered and Clay Minerals through Airborne AVIRIS-NG Hyperspectral Data in Jahajpur, India. Heliyon 6, e03487. doi:10.1016/j.heliyon.2020.e03487
van der Meer, F. D., van der Werff, H. M. A., van Ruitenbeek, F. J. A., Hecker, C. A., Bakker, W. H., Noomen, M. F., et al. (2012). Multi- and Hyperspectral Geologic Remote Sensing: A Review. Int. J. Appl. Earth Observation Geoinformation 14, 112–128. doi:10.1016/j.jag.2011.08.002
Vane, G., and Goetz, A. F. H. (1988). Terrestrial Imaging Spectroscopy. Remote Sens. Environ. 24, 1–29. doi:10.1016/0034-4257(88)90003-x
Vangi, E., D’Amico, G., Francini, S., Giannetti, F., Lasserre, B., Marchetti, M., et al. (2021). The New Hyperspectral Satellite PRISMA: Imagery for Forest Types Discrimination. Sensors 21, 1182. doi:10.3390/s21041182
Velasco, F., Alvaro, A., Suarez, S., Herrero, J.-M., and Yusta, I. (2005). Mapping Fe-Bearing Hydrated Sulphate Minerals with Short Wave Infrared (SWIR) Spectral Analysis at San Miguel Mine Environment, Iberian Pyrite Belt (SW Spain). J. Geochem. Explor. 87, 45–72. doi:10.1016/j.gexplo.2005.07.002
Waske, B., van der Linden, S., Oldenburg, C., Jakimow, B., Rabe, A., and Hostert, P. (2012). imageRF - A User-Oriented Implementation for Remote Sensing Image Analysis with Random Forests. Environ. Model. Softw. 35, 192–193. doi:10.1016/j.envsoft.2012.01.014
Xie, B. S., Zhou, S. Y., Wu, L. X., Mao, W. F., and Wang, W. (2022b). RockSL: An Integrated Rock Spectral Library for Better Global Shared Services. Big Earth Data, 1–21. doi:10.1080/20964471.2021.2017111
Keywords: airborne hyperspectral imaging, HySpex sensor, alteration mineral, random forest algorithm, image classification
Citation: Wang S, Zhou K, Wang J and Zhao J (2022) Identifying and Mapping Alteration Minerals Using HySpex Airborne Hyperspectral Data and Random Forest Algorithm. Front. Earth Sci. 10:871529. doi: 10.3389/feart.2022.871529
Received: 08 February 2022; Accepted: 12 May 2022;
Published: 08 June 2022.
Edited by:
Hongbo Su, Florida Atlantic University, United StatesCopyright © 2022 Wang, Zhou, Wang and Zhao. This is an open-access article distributed under the terms of the Creative Commons Attribution License (CC BY). The use, distribution or reproduction in other forums is permitted, provided the original author(s) and the copyright owner(s) are credited and that the original publication in this journal is cited, in accordance with accepted academic practice. No use, distribution or reproduction is permitted which does not comply with these terms.
*Correspondence: Shanshan Wang, d2FuZ3NoYW5zaGFuQG1zLnhqYi5hYy5jbg==; Jinlin Wang, d2FuZ2ppbmxpbkBtcy54amIuYWMuY24=
 Shanshan Wang
 Kefa Zhou1,2,3
