 Hannah Vickers
 Eirik Malnes1
95% of researchers rate our articles as excellent or good
Learn more about the work of our research integrity team to safeguard the quality of each article we publish.
Find out more
ORIGINAL RESEARCH article
Front. Earth Sci. , 14 July 2022
Sec. Cryospheric Sciences
Volume 10 - 2022 | https://doi.org/10.3389/feart.2022.868945
This article is part of the Research Topic Pan-Arctic Snow Research View all 8 articles
Snow cover characteristics are highly sensitive to variations in temperature and precipitation. In Svalbard, these parameters are undergoing significant change in response to a rapidly warming climate and its associated positive feedback processes. The occurrence of wintertime rain-on-snow (ROS) events are expected to increase in frequency and intensity across the Arctic as a result of climate change. ROS events can dramatically alter snow cover characteristics, by saturating the snowpack and enhancing surface runoff as well as causing widespread formation of ground ice, which can negatively impact many ecosystems as well as infrastructure. Knowledge of the spatial and temporal variations in ROS occurrence across Svalbard, both past and present is needed to understand which areas are most vulnerable to ROS impacts and how this may change in the future. Until now comparatively few studies have exploited remote sensing methods to detect and monitor ROS occurrence and even these have been limited to relatively coarse spatial resolutions. This work has utilized C-band Synthetic Aperture Radar (SAR) observations to produce a 17-year dataset (2004–2020) of wet snow cover observations for Svalbard, from which a method for detecting and mapping both spring melt onset and ROS frequency has been developed. The mean spatial variations in melt onset and ROS occurrence reflect the geographical gradients in temperature and precipitation across the archipelago and are largely in agreement with current knowledge. The timing of ROS onset as detected using the SAR observations coincide well with in-situ measurements of rainfall, however in some cases the duration of a ROS event cannot be reliably estimated using SAR observations of wet snow, in particular after phase transitions from rain to snow. Linear trends derived from the limited time series of observations suggests that ROS frequency is increasing over most of the archipelago, but significant and large increases are confined to the south and west coast of the archipelago. However, low elevation areas in the central parts of the archipelago also exhibit a significant and decreasing trend in ROS occurrence over the time period studied.
The Svalbard archipelago is situated in the High Arctic and has been experiencing rapid and dramatic warming as a result of climate change during the last few decades. During the last century, the mean annual temperature at Svalbard Airport has increased roughly three times as much as the global average temperature (Førland et al., 2011). Projections of future warming across the archipelago using regional climate model (RCM) simulations indicate that increases of 3–4°C and 6–8°C in the mean annual temperature can be expected for the west coast and northeastern regions respectively by 2,100 (Førland et al., 2011; Hanssen-Bauer et al., 2018). Owing to its location at high latitudes, the archipelago is heavily glaciated with glaciers alone accounting for 57% of the total land area (Nuth et al., 2013). Snow cover is an important component of the climate system, since its high albedo allows it to reflect up to 95% of incoming solar radiation (Cohen and Rind, 1991). It is also an important insulator and in the cold climates of high latitude regions, provides protection from frost damage to underlying soil and vegetation. As a result of ongoing warming, the spatiotemporal characteristics of seasonal snow cover on Svalbard have undergone significant changes in the past two decades, with large parts of the archipelago exhibiting trends of earlier spring snowmelt and disappearance (e.g., Van Pelt et al., 2016a; Vickers et al., 2020). Earlier loss of snow cover results in a reduction in surface albedo and hence greater absorption of incoming solar radiation. This in turn produces greater surface warming (Matsumura et al., 2014), leading to further snowmelt and surface runoff. This positive feedback is one of several factors contributing to the Arctic amplification (Serreze et al., 2009) which is the enhanced warming experienced in the Arctic regions compared to lower latitudes.
Wintertime warming in Svalbard has also been more pronounced (Førland et al., 2011; Isaksen et al., 2016) compared with other seasons, as has the occurrence of extreme mild weather events during winter. An increase in frequency of rain-on-snow (ROS) events across the Arctic has been reported (Vikhamar-Schuler et al., 2016; Bintanja and Andry, 2017; Peeters et al., 2019) and linked to precipitation increases resulting from sea ice loss and enhanced local surface evaporation (Bintanja and Selten, 2014; Forbes et al., 2016). Moreover, a threefold increase in frequency of winter warming events in the Svalbard region is expected by 2,100 (Vikhamar-Schuler et al., 2016). In Svalbard these events have been found to occur predominantly with atmospheric circulation types associated with a southwesterly geostrophic wind or as a result of the passage of low-pressure systems (Wickström et al., 2020). The ROS phenomenon has wide-ranging negative impacts, for example rapid snowmelt during mid-winter, which not only poses a hazard in the form of flooding through increased surface runoff, but also increases the risk of snow avalanches due to destabilization of the snowpack. In central Svalbard, the plateau mountain topography makes cornice fall avalanches the dominant avalanche type (Eckerstorfer and Christiansen, 2011), and which can also be triggered by rapid increases in air temperature such as those associated with mild weather events (Vogel et al., 2010; Eckerstorfer and Christiansen, 2011). A warmer and wetter climate will increase the risk of snow avalanches, especially wet snow avalanche types (Hanssen-Bauer et al., 2018; Abermann et al., 2019). On the other hand, both wet slab and slush avalanches on Svalbard have been shown to be linked to the passage of slow-passing low pressure systems and hence, the occurrence of such events will likely control the frequency of wet avalanche cycles in Svalbard in the future (Eckerstorfer and Christiansen et al., 2012). Furthermore, winter ROS events increase ground surface temperatures in permafrost areas and repeated events may lead to permafrost degradation (Westermann et al., 2011; Hansen et al., 2014), which presents a risk to the stability of buildings and infrastructure in the inhabited areas in Svalbard. ROS events not only impact areas covered by seasonal snow cover, but also the vast glaciated areas that cover a large proportion of the archipelago. Recent studies utilizing both snowpack model simulations (van Pelt et al., 2016a) as well as in-situ observations (Łupikasza et al., 2019) indicate that ROS events can in fact contribute positively to the wintertime mass balance of glaciers through refreezing of percolated water in the snowpack. However, the net gain is reduced through indirect effects of refreezing, which include for example firn heating and densification and reduced albedo of ice layers that form (van Pelt et al., 2016b). From an ecological perspective, ROS events during wintertime are also detrimental to the well-being of both plants and wild reindeer in Svalbard, since melting of the snowpack and exposure of plants to subsequent cold weather can lead to frost damage and thus lower growing season productivity (Bokhorst et al., 2012; Bjerke et al., 2014) as well as causing difficult grazing conditions due to formation of ice crusts which encapsulate lichen cover in the base of the snowpack, locking away the main food source for reindeer during winter (Hansen et al., 2011; Hansen et al., 2014) and can be responsible for high reindeer mortality episodes (Forbes et al., 2016). Recent studies have demonstrated the present adaptation responses of these reindeer, whereby migration to coastal regions during difficult winters provides seaweed as an alternative source of food (Hansen et al., 2019).
Due to the potential increase in frequency of natural hazards as well as effects on marine and land-based ecosystems in Svalbard, snowmelt and wet snow cover are important parameters to monitor. Impacts can be managed through improved prediction of, and response to these hazards, which require knowledge of the spatiotemporal characteristics of snowmelt in Svalbard. Large-scale wet snow mapping can be studied by utilizing model simulations of snow cover to extract parameters such as liquid water content (LWC) and snow water equivalent (SWE) at high resolution (Essery et al., 2013), which are important variables for studying snowmelt dynamics (Marin et al., 2020). Earlier studies that harness remote sensing techniques have utilized passive microwave sensors for the detection of ROS events in Canada (Grenfell and Putkonen, 2008; Dolant et al., 2016; Langlois et al., 2017), late winter melt events in Alaska (Semmens et al., 2013; Wilson et al., 2013) and for studying snowmelt patterns over glaciated areas of Svalbard (Rotschky et al., 2011). ROS events over northern Eurasia have also been mapped using Ku-band scatterometer data (Bartsch et al., 2010) by employing a detection approach relying on the surface refreeze signature in backscatter data, though at a rather coarse resolution of 12.5 km. On the other hand, Synthetic Aperture Radar (SAR) which is also sensitive to liquid water content of snow, can provide an alternative, observational means of mapping and monitoring wet snow cover at much higher spatial resolution and over large spatial areas (Nagler and Rott, 2000). Since 2014, the ESA-operated Sentinel-1 C-band SAR satellites have enhanced capabilities for using remote sensing for large-scale monitoring of the land surface at high spatial (tens of meters) and temporal resolution, of which wet snow cover is one of several applications. Efforts have been made to exploit the Sentinel-1 database for wet and dry snow mapping in mountainous regions (Snapir et al., 2019; Tsai et al., 2019; Varade et al., 2019; Lievens et al., 2022), improving wet snow mapping algorithms (Nagler et al., 2016). Studying snowmelt evolution over alpine regions (Marin et al., 2020) as well as retrieving snow depth estimates (Lievens et al., 2019). However, there is relatively little documentation of the use of SAR for monitoring winter and spring snowmelt events in Svalbard, where the most rapid and significant changes in snowmelt dynamics are taking place due to climate change.
The goals of this study are therefore twofold. First, we aim to build on current work by extending wet snow mapping applications to the Svalbard archipelago where in-situ measurements of snow are scarce. Secondly, we will investigate the use of wet snow maps for quantifying and monitoring spring snowmelt and ROS activity during the winter months, which will hereafter be referred to as winter ROS (hereafter, WROS). We do not focus on ROS events that occur during the summer after spring snowmelt, since the snow surface is already wet and additional moisture due to rain cannot be detected by SAR. Of relevance is to conduct a multi-sensor study by utilizing three C-band SAR sensors covering the most recent two decades, to produce wet snow maps from which the onset of, and trends in spring snowmelt can be deduced. Hence, we endeavor to study the geographical patterns and/or changes in frequency and spatial extent of these events over the last two decades. This knowledge will be highly useful for example in validation of climate model predictions as well as indicating potential areas of the archipelago that may be increasingly vulnerable to WROS hazards and their impacts on hydrological and ecological systems.
The Svalbard archipelago stretches over latitudes between 74 and 81°N and longitudes ranging from 10 to 35°E. Spitsbergen is the largest of the nine islands that comprise the archipelago. The archipelago covers a total area of 61,000 km2 of which 57% is glaciated (Nuth et al., 2013) and the remaining land area is covered by either barren rock or vegetation. Both midnight Sun and polar night conditions are present for large parts of the year. In the administrative center Longyearbyen, polar night conditions are present from 26 October until 15 February, while midnight Sun is experienced from 20 April to 23 August. On the west side of the archipelago, warm salty water from the Atlantic Ocean is transported northwards by the West Spitsbergen Current (Walczowski and Piechura, 2011) and produces a climate that is milder compared with that experienced at similar latitudes elsewhere. Meteorological data recorded at Svalbard Airport (www.seklima.met.no) close to Longyearbyen, show that the mean annual temperature in the period of study ranges from a minimum of −6.1°C (2003) to a maximum of 0°C (2016), while annual precipitation ranges from a minimum of 142.1 mm (2005) up to 310 mm (2016). Figure 1 shows an overview of the Svalbard archipelago, with the locations of three sites (Hornsund, Longyearbyen, and Ny Ålesund) where in-situ meteorological data have been utilized in the study.
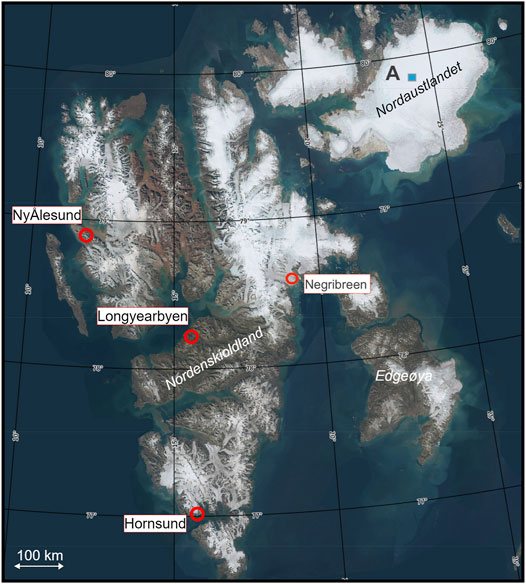
FIGURE 1. The Svalbard archipelago, with the locations of Hornsund, Longyearbyen, and Ny Ålesund indicated. Meteorological data measured at these sites have been used in this study. In addition, we have presented backscatter data from a small area (A) on Austfonna (79.86°N, 24.39°E). This figure has been obtained courtesy of the Norwegian Polar Institute. Retrieved from https://toposvalbard.npolar.no on 18 January 2022.
The Advanced Synthetic Aperture Radar (ASAR) sensor on board the Envisat satellite provided SAR images from 2002 to 2012. We have used ASAR wide swath mode (WSM) data which has a nominal pixel spacing of 75 m and provides scenes in both VV (vertically transmitted, vertically received) and HH (horizontally transmitted, horizontally received) polarization. Scenes are acquired in both ascending (ASC) and descending (DES) geometries. The Norwegian RADARSAT-2 (RS2) agreement allowed data coverage over Svalbard from 2012 to 2016 using the RS2 ScanSAR Narrow A (SCNA) mode with 25 m nominal pixel spacing. This mode was delivered as single polarization HH scenes in DES geometry, but the temporal coverage was sparse after 2015. The Sentinel-1 (S1) constellation is a SAR imaging mission and comprises two polar-orbiting satellites; Sentinel-1A, which was launched in April 2014 and Sentinel-1B, which was launched in April 2016. In this study we make use of the Extra-Wide (EW) swath mode which has a swath width of 400 km and is typically employed for sea ice applications, polar zones and some maritime areas. The repeat time for identical image geometry is currently 6 days for each satellite. Since the satellites have a polar orbit, high-latitude areas such as Svalbard can be observed more frequently as multiple viewing geometries overlap. This study uses the S1 EW ground-range detected (GRD) product with a nominal pixel spacing of 40 m and data from HH polarization, acquired in predominantly DES geometries.
Data products from all sensors have been geocoded, terrain corrected and calibrated using nominal techniques implemented in NORCE’s in-house SAR processing system GDAR (Larsen et al., 2006) to a fixed grid with 100 m pixel spacing and stored as radiometrically calibrated backscatter. We use a DEM from the Norwegian Polar Institute (20 m spatial resolution) for terrain correction. This is a reasonable compromise between the different sensors and reduces the amount of speckle noise. Figure 2 illustrates the distribution of SAR scenes available per month of the study period. During the ASAR period several months suffered low availability of scenes, i.e., fewer than one per day on average from 2003–2005, while from 2009 to 2012, the number of available ASAR scenes often exceeded 80–90 per month, as is the case for the Sentinel-1 dataset from approximately 2018 onwards. For the RS2 and S1 sensors, images were mostly acquired from descending orbits, corresponding to morning passes (varying from 05.08 to 07.45 UTC depending on track number). During the snow-covered season outside of the polar night period, morning temperatures are often lower than during the afternoon due to the diurnal variation of the air temperature, which subsequently impacts the condition of the snowpack. The lower morning temperatures will likely cause a bias towards lower liquid water content in the snow compared with afternoon observations and may therefore lead to less wet snow being detected. A breakdown of the number of SAR images per sensor, separated by geometry and polarization is shown in Table 1 several years had poorer coverage (Supplementary Figure S1), such as 2004, 2014, 2015, and 2016 with typically 200 or fewer days per year coverage across the archipelago. In contrast, years with a high frequency of coverage corresponding to 500 or more days are 2011, 2018, 2019, and 2020. It can also be seen that in some years the northern part of the archipelago is less well covered by SAR images than further south, which is typically true for the Sentinel period (2014 onwards).
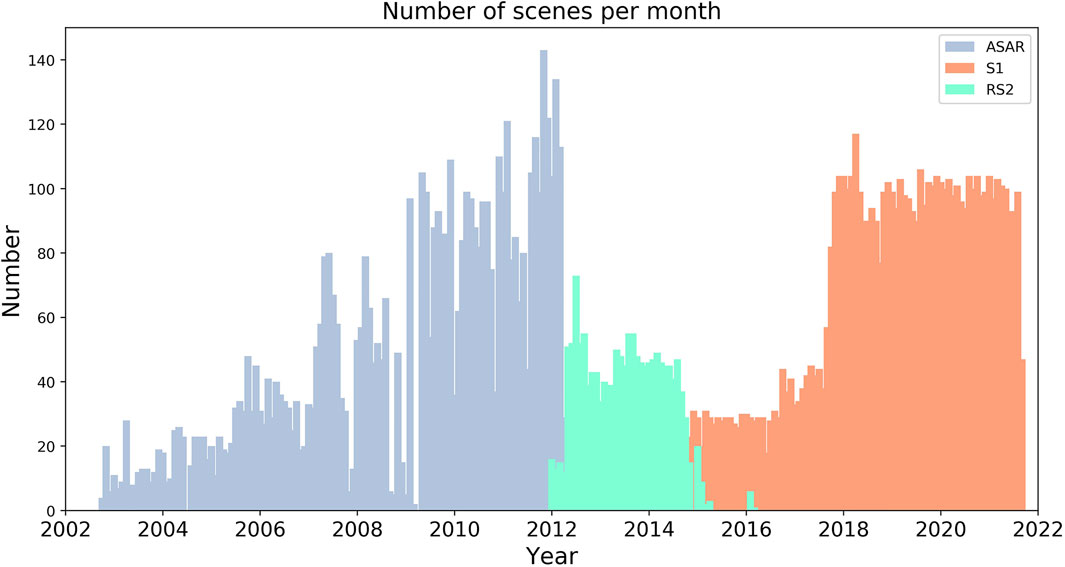
FIGURE 2. Number of scenes available per month for each sensor.
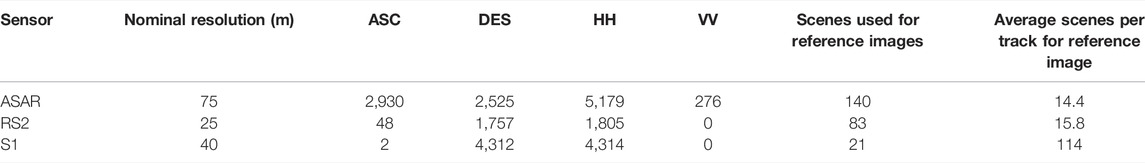
TABLE 1. Number of scenes per sensor, geometry [ascending (“ASC”)/descending (“DES”)] and polarization (HH/VV). Number of tracks used for reference data calculations and average number of scenes per referece per track is also indicated.
The method for wet snow mapping implemented in this work is based on a thresholding approach developed by Nagler and Rott (2000). We apply the same approach for Envisat ASAR data which has single polarization. In this approach, wet snow is detected when the backscatter change Δσ in a pixel with backscatter coefficient
where the weighting
The reference values for each polarization (
Glaciers in Svalbard exhibit a variable backscatter signal from year to year, where the steady state backscatter is to a large degree controlled by the amount of firn below the new snow. This variability has also been noted by Rotschky et al. (2011). In the time series from 2004–2020 the radar backscatter change Δσ (relative to the reference value) from glaciers during winter months is relatively stable, but the mean winter value of Δσ displays large variability from year to year, varying by as much as 3–4 dB within the time period of study, ranging from a maximum of ∼ 2 dB for 2017/2018 and minimum value of approximately −1 dB for 2007/2008. The large bias from year to year thus demands an adaptive threshold used for wet snow detection. The nominal wet snow detection method is therefore not applicable for surface areas covered by glaciers. We have therefore adjusted the wet snow detection method for glaciers in Svalbard which first involves subtracting the bias, or the mean winter backscatter change
For the purpose of the glacier adjustments a value of
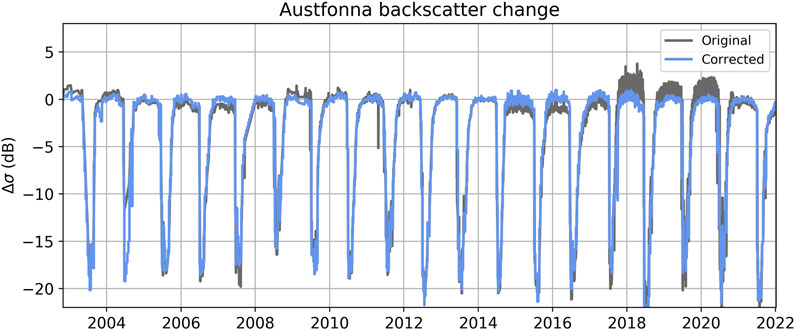
FIGURE 3. Time series of relative radar backscatter for HH-polarization (dark grey) a for a 1 × 1 km area (79.86 N, 24.39 E) on Austfonna. The blue line represents the corrected relative signal, where the winter mean (November 1–April 30) has been subtracted from the relative backscatter signal in order to be able to perform threshold detections for wet snow.
The MODIS Snow Cover Fraction (SCF) time series presented by Vickers et al. (2020) is utilized in this work to distinguish dry snow from bare soil (SCF = 0%) for pixels where no wet snow is detected. The MODIS SCF dataset is a daily time series that corrects for missing data due to for example cloud cover, by using interpolation methods. For a thorough description of the methods used to produce the dataset, the reader is referred to Vickers et al. (2020). Due to the difference in pixel spacing between the MODIS SCF time series (500 m) and SAR images (100 m), the MODIS SCF product was oversampled to 100 m pixel spacing to match the resolution of the SAR data and a threshold of 50% is applied to the SCF to differentiate between full snow cover and bare soil in the final classified product.
A daily wet snow map is produced by combining individual wet snow maps from each imaging geometry per day (typically 1–3 geometries). To generate a daily wet snow map, we start with the temporally interpolated snow cover fraction map based on MODIS to partition snow covered (assumed initially as dry snow) and snow-free pixels. We use all available wet snow maps for the respective day and overwrite the snow status for each detected wet snow pixel with the wet snow flag. In the case where images from both morning and evening passes are acquired on the same day, we use the morning estimate of wet snow status (DES geometry) in order to provide a time series that is as homogeneous as possible across the different sensors.
We also produce a time series of multi-temporal interpolated wet snow maps. The algorithm uses the wet snow classification from the previous day when we lack coverage in parts of the study area. In this way we obtain a complete wet snow time series. We also account for days with missing coverage by producing an age map which yields the number of days since the last observation. The final product contains five categories whose codes indicate the land or snow type and are defined as; water, radar shadow/clouds, bare soil, dry snow and wet snow, where a mask for water bodies (sea, lakes, and rivers) was created using a vegetation map for Svalbard vegetation (Johansen et al., 2012). Figure 4 illustrates the Sentinel-1 SAR backscatter data from track 081 on 11 June 2019 (Figure 4A) together with the final wet snow map, illustrating the different pixel classes (Figure 4B).
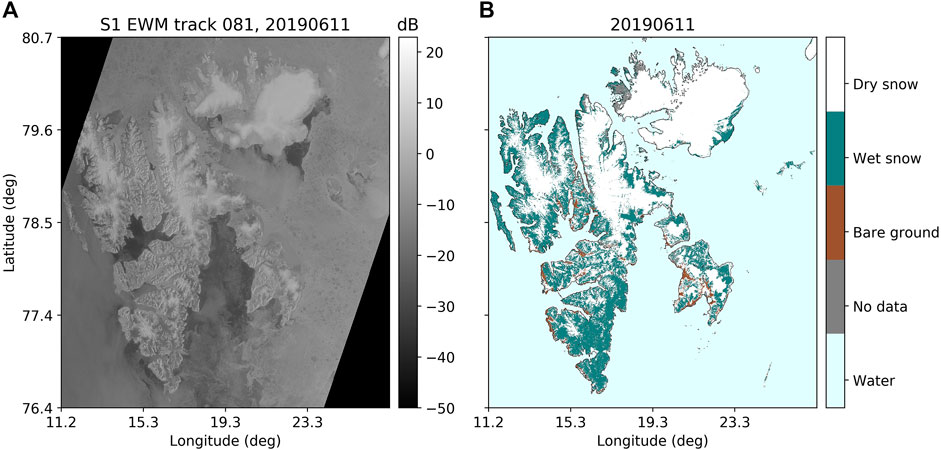
FIGURE 4. (A) Sentinel-1 SAR backscatter data from track 081 on 11 June 2019 and (B) the classified wet snow map for 11 June 2019 where dark blue areas indicate wet snow and white areas correspond to dry snow. Brown areas indicate bare ground.
The wet snow maps derived from the three SAR sensors, as described in Section 2.5, were post-processed to map and study variations in timing of spring snowmelt. For the estimation of sprint melt onset, we have followed a similar approach to that outlined by Rotschky et al. (2011) whereby the backscatter coefficient must remain below the wet snow threshold for at least 10 days in order to define the event as spring snowmelt. For our dataset, a grid cell must therefore have been classified as wet snow for ten consecutive days. This eliminates the risk of detecting short-lived events such as the WROS events, which were studied separately and described in Section 3.2. For the detection of spring melt onset, the part of the year was restricted to an earliest incidence 1 April and latest occurrence on 1 August. The timing of melt onset was mapped for each year of data, from which the average timing of melt onset was deduced as well as anomalies in the timing of melt onset with respect to this average. The anomalies have been defined as the difference between melt onset calculated for a given year and the mean melt onset at that pixel.
The SAR wet snow products have been utilized to detect and study patterns in frequency and distribution of WROS events. These events were detected by finding all transitions from dry to wet snow that occurred during the winter months, which was defined to be 1 November–30 April. This is also consistent with the period chosen to produce reference backscatter values in the wet snow mapping, during which the snow condition is assumed to be dry. Transitions that were proceeded by wet snow classification lasting for 15 consecutive days or more were excluded from the WROS event count, since it was assumed that prolonged periods of wet snow were attributed to spring snowmelt rather than short-lived WROS events. This could occur due to 1 month of overlap between the period where spring melt onset was detected (1 April–1 August) and the WROS period. Moreover, we choose to detect WROS within a fixed time frame instead of defining the end of winter using melt onset dates, since we wish to identify trends in WROS over the time series. WROS counts were mapped for each year of data in the time series by applying this method. A final adjustment to WROS detected over marine-terminating glaciers was made due to glaciers that had receded by the end of the time series compared with the original vegetation map used for detecting glacier pixels, since this produced false detections of ROS over the parts of the marine-terminating glaciers that are no longer present. These pixels were identified by using a glacier inventory for Svalbard produced using Sentinel-2 imagery from summer 2020 (Lith et al., 2021) together with a dataset of glacier fronts for 2020 for marine-terminating glaciers (Moholdt et al., 2021) and the original glacier mask derived from the vegetation map for Svalbard (Johansen et al., 2012). Glacier pixels that were present in the original glacier mask but not in the 2020 glacier inventory, and in addition contained the marine-terminating glacier front outlines, were reset to water in the final WROS maps. Finally, the mean number of ROS events per pixel was calculated for the corrected WROS maps and linear regression was applied to the time series of WROS counts to estimate the decadal rate of change in WROS for the time period studied.
Different criteria applied to temperature and precipitation data have been used to define WROS events in Svalbard using meteorological data, but in this study, we follow the definition of Wickström et al. (2020) whereby WROS are detected as days when the mean daily temperature is above 0°C and the total daily precipitation exceeds 1 mm. For the purpose of WROS event comparisons between SAR and in-situ measurements, time series of meteorological data recorded at Ny Ålesund (78.92°N, 11.91°E), Longyearbyen (78.13°N, 15.38°E) and Hornsund (76.97°N, 15.78°E), were downloaded from www.seklima.met.no. These stations were chosen since they located across the northern (western), central and southern parts of the archipelago respectively and will therefore provide a latitudinal spread in observations. Moreover, these stations have satisfactory temporal coverage for the parameters required for detection of WROS events for the period being studied. In addition to requiring mean air temperature >0°C and precipitation > 1 mm, we apply these criteria to only days where snow depth (SD) > 2 cm such that precipitation falls as rain on an existing snowpack. Consecutive days with precipitation fulfilling the criteria are assumed to belong to the same WROS event. These WROS events detected using meteorological data are used to validate WROS events detected using the SAR wet snow maps. Figure 5 provides an overview of the datasets, data products and parameters that have been extracted to illustrate the workflow of this study.
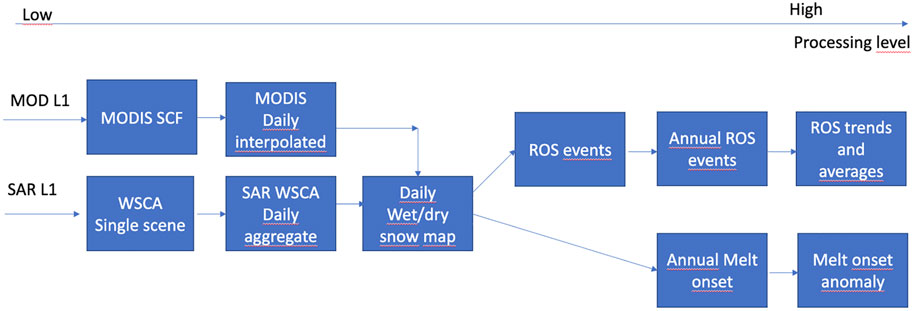
FIGURE 5. Overview of processing levels from level 1 (L1) satellite data from providers to trends. MODIS SCF is the MODIS snow cover fraction dataset (Vickers et al., 2020) and WSCA refers to the wet snow-covered area produced from the thresholded SAR images.
For comparisons of the SAR-detected WROS events with the WROS events detected using the in-situ measurements, time series of the wet snow fraction are calculated in a 10 × 10 km box (100 × 100 pixels) centered on the pixel containing the selected meteorological data sites (Ny Ålesund, Longyearbyen, and Hornsund). The calculation of the wet snow fraction represented the fraction of land pixels in the box classified as wet snow. Furthermore, only pixels corresponding to altitudes below 100 m.a.s.l were considered to accurately represent the conditions at the elevation where the observational data were obtained.
An analysis of the accuracy of the SAR approach for detecting WROS was carried out to determine the rate at which winter ROS events were correctly detected compared with the in-situ ROS detections. A correct WROS detection, or true positive rate (TP) was counted when the SAR wet snow fraction around each of the three stations exceeded 15%. For Longyearbyen where typical wet snow fractions rarely exceeded 15% for the entire time series, a threshold of 2% was used to define a correctly detected ROS event. Also calculated were the false positive (FP) rate (SAR detected ROS which was not detected in the in-situ data), false negative (FN) rate (SAR did not detect ROS, but ROS was detected in-situ), true negative (TN) rate (SAR correctly detected a non-ROS day) and the overall accuracy, which is given by the expression,
Metrics were calculated for each winter season beginning from 2013/2014, when all meteorological parameters at the three stations were available, corresponding to a total of 7 years of data, which were used to compute a mean accuracy.
The average date of melt onset, calculated according to the method outlined in Section 2.6 is presented in Figure 6. There is a clear geographical gradient in timing of onset, with the earliest dates (DOY 130 or earlier) found along the coast in the southwest part of the archipelago and the latest dates for onset of spring snowmelt (DOY 160–180) occurring toward the northeast part of the archipelago. In addition to the geographical gradient, there is also an obvious elevation dependence, with seasonal snow in the low-lying valley areas melting earlier than in the mountainous and glaciated areas. The mean date of onset for spring snowmelt varied from DOY 125 to 154 for land-only areas with seasonal snow, while for glaciers the average timing of onset varied between DOY 148 and 167 over the 17-year period. The melt onset anomalies are shown in Supplementary Figure S2. Years 2008, 2009, 2014, 2015, and 2019 were characterized by later snowmelt of typically 5–15 days later over the whole archipelago compared with the average date, and some areas displaying melt onset which was 20 days or more later (darker blue). Vickers et al. (2020) showed that the timing of snow disappearance over northeast Svalbard during these years was also later than average and were correlated with variations in sea ice concentration. In contrast, the onset of spring snowmelt in 2006 was distinctly earlier by 20 days or more, especially across the southern, eastern and western edges of the archipelago, except for some areas in the northeast, including the glaciated inner part of Nordaustlandet which showed 5–10 days later onset compared to the 17-year average. It can also be seen that melt onset occurred some 10–15 days earlier than average in the typically colder northeastern part of the archipelago in years 2013 and 2020, while the milder southern and western parts experienced around average timing for melt onset.
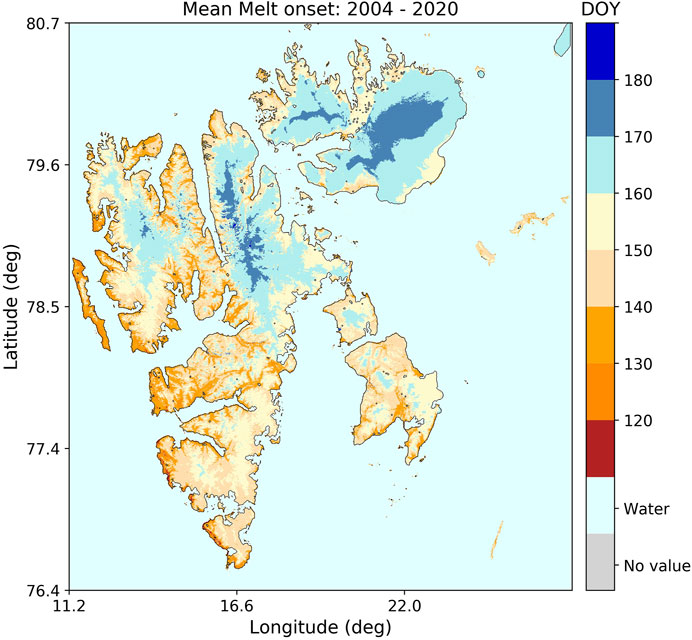
FIGURE 6. Map of mean melt onset date for the Svalbard archipelago, for the period 2004–2020. The dates have been categorized into discrete intervals such that the lower and upper colors represent melt onset occurring on DOY <120 or >180 respectively.
Yearly maps of WROS frequency are shown in Supplementary Figure S3 for each winter of the dataset, where WROS are counted from November of the preceding year to the end of April of the current year. The upper limit of the color scale represents pixels where a WROS count of 5 or more events per year was detected.
There is variation from year to year in the number of WROS events detected, but the general pattern of WROS activity indicates that WROS events occur more frequently in the western and southern part of the archipelago (e.g., 2010, 2012, 2015, 2017, and 2019), though with some years displaying more WROS activity in Nordenskiöld Land in the central part of Svalbard and on parts of Edgeøya (e.g., 2005, 2009, and 2014). During years with most WROS activity, the number of detected events in the areas with greatest number of WROS events exceed more than 5 per winter season. Figure 7A illustrates the mean WROS counts mapped for the Svalbard archipelago, illustrating the general geographical distribution of WROS activity described earlier with the highest frequency of WROS events per winter occurring in the western and southern parts of the archipelago, as well as on Edgeøya. It is also clear that on large parts of Nordaustlandet in the northeast end of the archipelago, very few WROS events were detected during the period studied, with only a few years (2011, 2017, and 2019) exhibiting 1—2 events, mostly confined to the coastal parts of the area. On average the WROS count for this area is therefore 0 for the period studied. On the other hand, even though there were not detected any WROS events over a large area of glaciers in Svalbard, there were however some glaciated areas where a mean WROS count of 1 was obtained from the analysis and these were mainly confined to glaciers in the southern and central part of the archipelago.
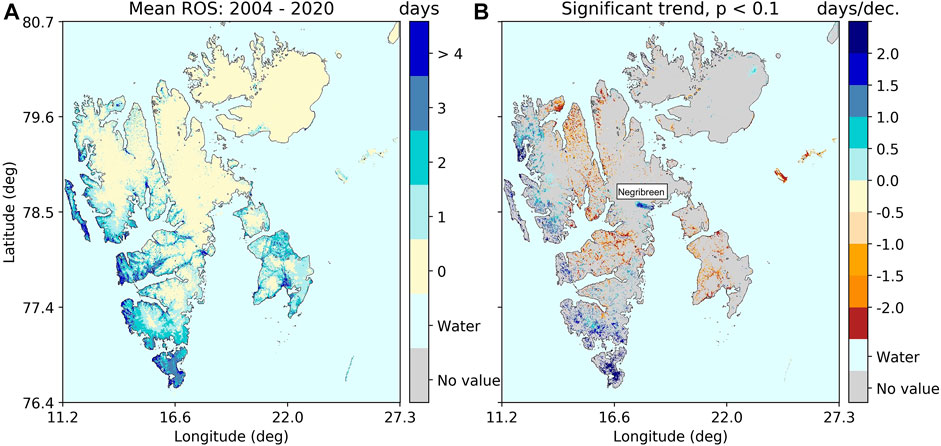
FIGURE 7. (A) Map of the mean number of wintertime ROS events (1 November–April 30) detected in the period November 1–April 30 for the winter seasons 2004–2020. (B)The linear trend in ROS frequency shown for only grid cells where the trend was statistically significant (p < 0.1).
The linear trend in ROS frequency is computed as the change in number of ROS events per decade and grid cells where the trend was significant (p < 0.1) are shown in Figure 7B. Non-significant trends are displayed in grey. Figure 7B shows that ROS frequency increased over large parts of the archipelago during the 17-year period studied. The largest increases can be observed to have taken place in the southernmost parts of Svalbard, as well as along the western coast in the central and northern parts of the archipelago. These areas, where the largest increases are occurring, also correspond to significant trends, and the increase is typically greater than 1.5 events per decade. In contrast, in the northeast of the archipelago the change is limited to an increase or decrease of up to 0.5 events per decade. In the central part of Svalbard over Nordenskiöld Land and on the west of Edgeøya where there is on average 1 ROS event per winter (Figure 7A), ROS frequency exhibits a significant and decreasing trend. This is especially true for the low elevation areas such as valley bottoms. It can therefore be deduced that ROS frequency has increased most in the areas where the mean ROS count is largest. Conversely, the regions in the northeast of the archipelago exhibiting lowest ROS frequency also had the smallest decadal change over the period studied. It should be re-emphasized though that the length of the time series is relatively short for inferring climate-related trends, and as such the results presented here should be interpreted with care.
We note that there is also an apparent significant and positive trend over a glacier on the east coast of Spitsbergen, which corresponds to the Negribreen glacier that has been actively surging since 2016 (Haga et al., 2020). Surging glaciers expose much higher surface roughness than normal glaciers due to formation and movement of crevasses. In addition, the glacier front will retreat following collapse, and both these factors produce a dynamic backscatter signature in the SAR data. It is therefore expected that wet snow detections will be unreliable over these glaciers since the classifications are based on a change detection, and the nature of backscatter will produce transient crossings of the change threshold and hence anomalous wet snow detection.
Figure 8 illustrates the time series of wet snow fraction at the meteorological station sites at Hornsund, Longyearbyen, and Ny Ålesund for the 2016/2017 winter season. The wet snow fraction denotes the percentage of land pixels in the 10 × 10 km area at altitudes below 100 m.a.s.l that were classified as wet snow. Also shown in this figure are time series of the total daily precipitation and snow depth, where precipitation measurements are only shown for days where the mean temperature was greater than 0°C and total daily precipitation exceeded 1 mm, indicating that the criteria for meteorological ROS events was fulfilled. The southernmost station Hornsund, experienced more events with increased wet snow fraction throughout the season when compared with the number of wet snow fraction increases at Longyearbyen and Ny Ålesund. Fewest events were observed with both the SAR and in-situ observations at Longyearbyen, while at Ny Ålesund there were two occurrences where the wet snow fraction was high (>50%). Common to all three sites is the WROS event that began in the start of February 2017 and lasted several days. At Hornsund this WROS event produced increases in wet snow fraction of up to approximately 80%, which persisted for over a week. Total daily precipitation measured at Hornsund during this event did not exceed 10 mm. It may also be noted that during the period where wet snow fraction was declining, the measured snow depth increased very rapidly from between 10–15 cm to over 40 cm, which suggests that the precipitation transitioned from rain to snow. However, since we only show precipitation which fell when the mean daily temperature was >0°C, the days with snowfall are not shown. In contrast the same WROS event at Longyearbyen did not produce such large increases in wet snow fraction, barely reaching 5% of the land area. A corresponding reduction in snow depth from approximately 25 cm before the event to 10 cm after, can be seen in the center panel of Figure 8. The highest wet snow fraction was observed at Ny Ålesund, where the wet snow fraction reached over 90% for several consecutive days. The total daily precipitation recorded at Ny Ålesund reached in excess of 24 mm on the third day of rain, far exceeding the amounts recorded further south at Longyearbyen and Hornsund. Similar to Hornsund, an increase in snow depth was observed concurrently with a decline in wet snow fraction, indicating a transition from rain to snow. This is also confirmed by mean daily temperatures far below 0°C in the days following the end of the rain event (not shown).
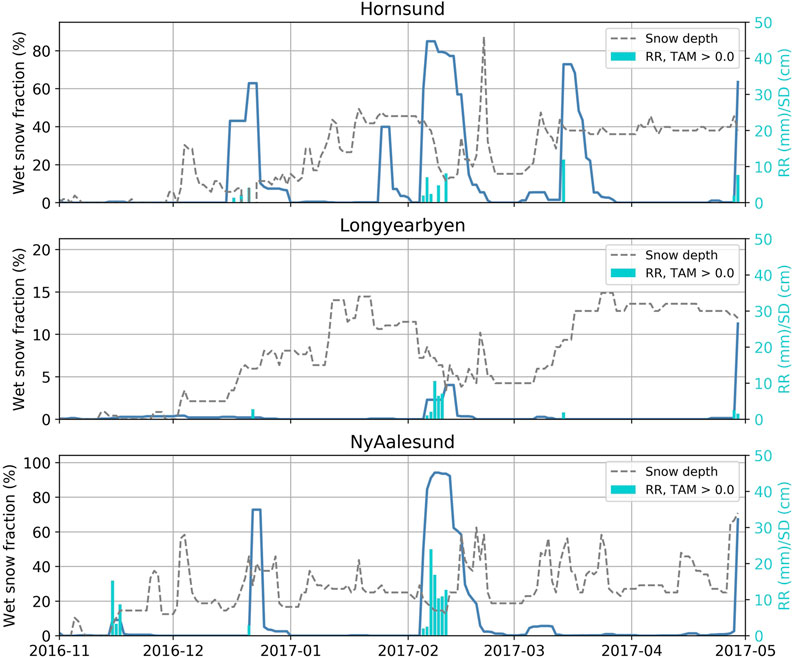
FIGURE 8. ROS events detected at Ny Hornsund, Longyearbyen, and Ny Ålesund for the 2016/2017 winter comparing meteorologically detected ROS events and SAR wet snow fraction. Precipitation is shown by the light blue bars for days fulfilling ROS criteria [mean temperature (“TAM”) > 0°C, total daily precipitation (“RR”) > 1 mm and snow depth SD > 2 cm]. Wet snow fraction for land pixels <100 m. a.s.l in a 10 km × 10 km box around the three sites is shown as a time series by the dark blue curves.
Figure 9 shows the wet snow maps for the 10 × 10 km area centered on Ny Ålesund, covering the period from before the onset of the WROS event until after the event had finished. The in-situ observations show that mean air temperature exceeded 0°C and precipitation was recorded from 5th February and lasted for 7 days. Wet snow is also observed in this area in the (Sentinel-1) SAR data from 5 February 2017, though not all land pixels have transitioned from dry to wet snow on this first day of the event. The sequence of wet snow maps shows the increasing area of land covered by wet snow as time progresses, with most wet snow cover visible in the wet snow map produced for 10 February 2017, following 2 days with heavy rain. The transition from wet snow back to dry snow commences from the southern end of the case study area and eventually inwards from the coastline until the large majority of pixels are no longer classified as wet snow, by 20 February 2017. The observations in Figure 9 therefore shows that the presence of wet snow is still being detected in the SAR dataset for at least 1 week after precipitation (as rain) has ceased, even though the in-situ measurements of mean daily temperature show that very cold temperatures were registered between 12th–20th February, with mean air temperature ranging from a maximum of −8.8°C to a minimum of −20.4°C. Since this also coincides with the in-situ observations of increased snow depth, the data suggests that new snow is likely being deposited over the underlying saturated, wet snowpack. However, C-band SAR effectively penetrates dry snow and hence the backscatter is still dominated by the attenuated signal due to the underlying wet snow, which may not have frozen immediately due to the insulating properties of the dry snow. In this case, wet snow maps may not be entirely reliable as a tool for estimating the duration of a WROS event, even though timing of onset coincides well with the arrival of rain in in-situ data.
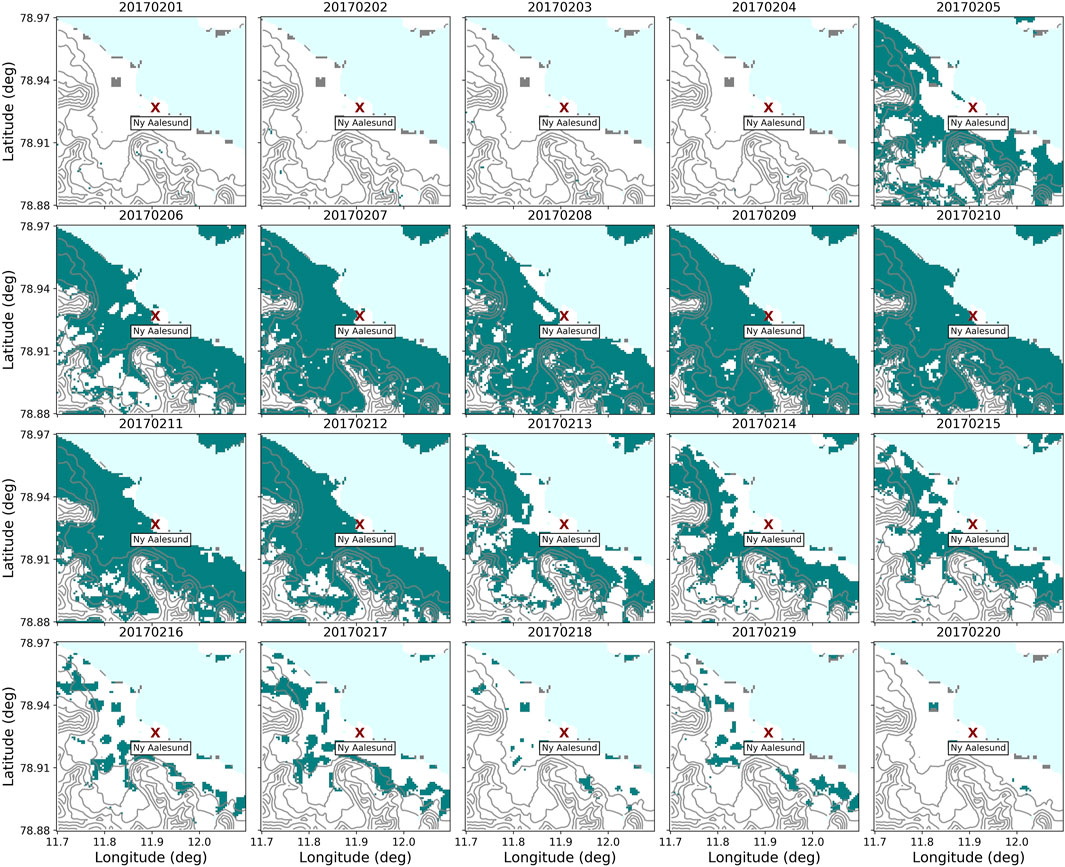
FIGURE 9. Wet snow maps for a 10 km area centered on Ny Ålesund between 1–20 February 2017 during which a ROS event was registered in the meteorological data. Elevation data provided by a DEM are shown by the contour lines shown at 100 m height intervals. White/uncoloured areas indicate dry snow cover, while teal-coloured pixels represent wet snow and grey pixels represent unclassified data. The wet snow maps show the temporal changes in spatial extent of wet snow during and after the ROS event, indicating that areas of wet snow can persist even after the precipitation has stopped.
Accuracy metrics were calculated to determine the performance of the SAR detections at each of the three meteorological stations, as outlined in section 2.8. The mean value of each metric for 7 years of in-situ data is displayed in Table 2. Generally, the true positive rate was not particularly high, averaging around 50% at both Longyearbyen and Ny Ålesund. For Hornsund the mean true positive rate was slightly higher (61.3%). However, since the false positive rate at Hornsund was also slightly higher, the overall accuracy of the SAR approach for detecting wintertime ROS was in fact slightly greater at both Longyearbyen and Ny Ålesund. In all cases though, the accuracy is >80%. It should be emphasised however, that in this simple approach to estimating the accuracy is affected by both the size of the area chosen to compute the wet snow fraction (10 km × 10 km) as well as the threshold chosen to define a SAR ROS day (15%). Applying a lower threshold would increase both the true and false positive rate, while a higher threshold would produce the opposite effect.
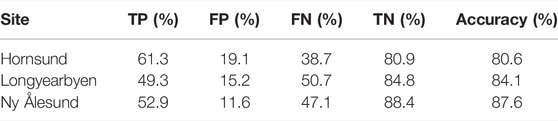
TABLE 2. Accuracy metrics used to evaluate the SAR ROS detections at Hornsund, Longyearbyen and Ny Ålesund for 7 winter seasons, beginning 2013/2014. Metrics evaluated are the true positive (TP) rate, false positive (FP) rate, false negative (FN) rate and true negative (TN) rate, each of which are used to calculate the overall detection accuracy based on Eq. 3.
This work has utilized a 17-year long SAR time series to produce a wet snow cover dataset for Svalbard, during which the conventional approach for detecting wet snow using SAR sensors has been modified for glaciers in order to address the need for a dynamic wet snow threshold for wintertime conditions. Using this wet snow dataset two aspects of snowmelt have been derived. Spring melt onset and winter ROS events have been mapped by utilizing transitions in the pixel classifications in the wet snow maps and in both cases, the average patterns as well as year to year variations and linear trends have been extracted from the results. In this section we discuss the results presented in section 3 and their relevance to current knowledge.
Rotschky et al. (2011) presented QuikSCAT scatterometer data from 2000–2008 to map summer melt onset and total melt days using an empirical thresholding method. Melt onset was detected when the backscatter coefficient dropped below a (dynamic) threshold determined by the average winter mean backscatter coefficient. This is essentially the same approach taken in this work for detecting wet snow, however the SAR dataset allows for melt onset at much higher resolution, and over both land and glaciated areas. Like our study, their requirement for detecting summer melt onset (SMO) was that the backscatter coefficient must lie below this threshold or 10 or more consecutive days. Their results, shown for only glaciated regions across the Svalbard archipelago revealed a consistent southwest-northeast asymmetry in timing of SMO for each year of data shown. This was linked to climatic gradients which were reflective of sea ice influence. That is to say, earliest SMO was observed in the southern and westernmost regions, with a mean onset at DOY 148 and latest onset observed over Nordaustlandet where the mean onset was DOY 163, equating to an offset of approximately 2 weeks between earliest and latest onset. These geographical patterns in timing of SMO have also been earlier presented by Sharp and Wang (2009) using a 5-year dataset. We observe a similar geographical asymmetry in timing of spring snowmelt in the SAR-based results of this study, which is observed across regions covered by both seasonal snow and glaciers. Similar mean dates of melt onset were obtained for Nordaustlandet (DOY 160–170) while the mean date of melt onset for southern Svalbard found in this study was typically 10 days earlier compared with the same region of the Rotschky et al. (2011) study. This however could be explained by the longer period of data which were used to average the date of melt onset, especially if the latter period covered by this study includes years with melt onset that were earlier than those of the Rotschky et al. (2011) study period. Moreover, the effective resolution of the Rotschky et al. (2011) dataset was 4 km, compared to the 100 m pixel size of the SAR-based wet snow maps. It is therefore not unlikely that the 4 km dataset would contain mixed pixels in some areas where the topography changes greatly over short distances, leading to backscatter contributions from higher elevation areas where snowmelt usually occurs later. Moreover, while we have used daily wet snow maps for the detection of melt onset, SAR images have not been obtained on a regular daily basis, which reduces the accuracy of the SAR estimates of melt onset due to temporal uncertainty in wet snow detection. In addition, we have shown that the acquisition frequency of SAR images has also varied from year to year, as well as spatially with some regions being covered more frequently than others. This means that there is both a temporal uncertainty in melt onset detection not only varies from year to year but also across the archipelago. The QuikSCAT dataset on the other hand does not suffer from this uncertainty due to its daily acquisitions.
The unusually early melt onset observed over large parts of the archipelago in 2006, together with widespread winter ROS occurrence, has been highlighted in earlier studies as being an exceptional winter. Vikhamar-Schuler et al. (2016) found that the winter of 2006 occurred most often in their list of top five extreme winters, which was based on five different climate indices indicative of winter warming frequency and intensity. This winter was also reported to have coincided with below-average sea ice extent together with large areas of open water, which were suspected to have further amplified the winter warming. On the other hand, our results revealed that melt onset over the central part of Austfonna, an ice cap on Nordaustlandet, was typically 5–10 days later in 2006 compared with the 17-year average for 2004–2020. This contrasts with the very early onset observed across the rest of the archipelago but is nevertheless consistent with earlier results presented in the study of Rotschky et al. (2011). To investigate this anomaly further, the daily mean temperature and wet snow fraction detected using the SAR wet snow maps for the meteorological station sites Hornsund, Longyearbyen, and Ny Ålesund were analyzed for the 2005/2006 winter. We found that there were two primary periods when the daily mean temperature increased to above zero at all three sites and there were concurrent increases in the wet snow fraction (Supplementary Figure S4). The first occurrence began around 22 April and lasted until approximately 6 May, with daily mean temperatures reaching up to 6°C, after which it dropped to below zero again until 23 May. However, it was only during the second period that the daily mean temperature remained above freezing for the remainder of the summer. Since the first occurrence of warm temperatures and wet snow presence lasted more than 10 days it is therefore highly likely that our algorithm flagged the start of this first wet snow increase as spring melt onset, even though both the daily mean temperature and wet snow fraction both decreased for more than 2 weeks following this period. All three sites are located close to sea level, while the highest point on Austfonna is 783 m. a.s.l. We therefore speculate that air temperatures over the inner part of Austfonna did not rise high enough to cause snowmelt during this first period, where lower elevation areas experienced above-freezing temperatures and wet snow. Alternatively, there may have been positive air temperatures over Austfonna during the first melt period, but the period with wet snow in this region may have lasted less than 10 days, thereby not qualifying as melt onset according to the criteria we have applied. Had the start of the second period with above-freezing temperatures in 2006 been detected as the date of spring melt onset across the entire archipelago, then there would likely have been negative melt onset anomalies over a greater portion of the archipelago (Supplementary Figure S2), rather than being confined to only Austfonna.
The mean WROS occurrence (Figure 7A) indicate a geographical variation which is not dissimilar to that for the timing of melt onset, with WROS “hotspots” being concentrated predominantly along the west coast and in the southern part of the archipelago. This is in line with the geographical distribution of ROS events reported in earlier studies that have utilized both snow model datasets (Van Pelt et al., 2016a) and numerical weather prediction (NWP) models (Wickström et al., 2020). However, a great deal of variability is observed from year to year, with some years exhibiting more ROS activity in the central and eastern parts of the archipelago compared with the southern and western parts. The highly glaciated northern and northeastern parts of Svalbard consistently displayed fewest occurrences of ROS events throughout the study period, which are reflective of the colder and drier climate in this region. We have attempted to identify changes in ROS occurrence over the course of the time period studied by calculating the linear trend. While a 17-year time series is relatively short to draw certain conclusions about climate-related trends from, our results suggest that ROS occurrence has been increasing in both the southern and northern parts of Svalbard, with greatest increases in the northwest and southern regions. On the other hand, we find a decreasing trend in ROS occurrence on Nordenskiöld Land, especially in low-lying valley areas. We also find that the trends are significant in these areas where there are large increasing or decreasing trends. Analysis of temperature and precipitation trends in Svalbard using downscaled regional climate model (RCM) output by Van Pelt et al. (2016b) show that while there are positive trends in temperature across the entire archipelago for the period 1961–2012 with strongest warming in the north, total precipitation has been decreasing across the central and southern parts of the archipelago. Their model output also showed that at the same time, both maximum and minimum snow depths have been exhibiting a decreasing trend and the timing of snow disappearance has been becoming earlier across Nordenskiöld Land. These results may in part explain the apparent decreasing trend in winter ROS occurrence for low elevation areas on Nordenskiöld Land.
The ROS trends were also found to be high over Negribreen (Figure 7B) on the east coast of Spitsbergen. Negribreen has been actively surging since 2016 (Haga et al., 2020). We have observed large fluctuations in the SAR backscatter data over a part of Negribreen from early 2015 lasting until at least early 2017 (results not shown). These fluctuations are likely due to surface height changes and formation of crevasses as the glacier surges and retreats due to collapse at the sea-facing front. As such the fluctuations cause the backscatter to cross the wet snow threshold frequently, producing an anomalously high number of days detected as ROS events due to the frequent transitions between dry and wet snow classification. The apparent trends and ROS count over surging glaciers are therefore likely to be artefacts of surging process and should be treated with caution.
Increased ROS occurrence over northwest Eurasia has been associated with the positive phase of the Arctic Oscillation (AO)/North Atlantic Oscillation (NAO) due to increased rainfall under these conditions (Cohen et al., 2015). However, the authors find a lack of robust trend in ROS frequency for the period of observations (1979–2014), which was attributed to competing consequences of warming whereby rainfall is increasing but snow cover is decreasing. On the other hand, extreme winter warming events studied by Rinke et al. (2017) are reported to be increasing at Ny Ålesund during early winter (November/December), positively correlated with the AO/NAO, as well as with lower-than-average sea ice concentration during these months. However, the authors also noted that the winter trend for the most recent period (2000–2015), which is largely covered by the SAR dataset, was also much smaller than during 1979–1999. The link between low sea ice concentrations and increased warming and precipitation on land areas in proximity to sea ice has been noted elsewhere (Forbes et al., 2016), while Wickström et al. (2020) argue that ROS events over Svalbard are driven mainly by the advection of warm air from the south and are therefore not sensitive to sea ice extent. However, the same authors do acknowledge that sea ice presence does control seasonal variations in temperature and precipitation, especially in the north and east of the archipelago. The future development of winter ROS occurrence will therefore likely be determined by existing warming climate trends as well as its effect on ongoing sea ice loss with its related feedback processes and changes in atmospheric circulation.
The approach used in this study to identify ROS events relies on detecting a transition from dry to wet snow, i.e., when the backscatter value of a pixel relative to its reference value, drops below a certain threshold. Through comparisons with meteorological data at Hornsund, Longyearbyen, and Ny Ålesund, it was found that wet snow can still be detected in the surrounding area for several days after temperatures have returned to well below zero, as indicated by the meteorological data. This has been previously observed and suggested to occur due to the isolation properties of dry snow preventing immediate refreezing of remaining moisture in the snowpack from a ROS event (Winsvold et al., 2018). Moreover, the SAR signal at C-band may pass through dry snow but will be strongly attenuated at the dry-wet snow interface, leading to detection of wet snow even though the surface is dry. When a wet snowpack is followed by very cold temperatures it might be expected that an ice layer would form and that this could also be a source of low backscatter detected as wet snow. However, earlier studies show that ice crusts tend to produce increased backscatter (e.g., Langley et al., 2008) rather than lowering it. This limitation therefore makes the SAR approach less reliable for estimating the true duration of a ROS event, even though it was found that qualitatively, the detection of wet snow coincided well with the onset of a ROS event as inferred from in situ observations. We found the mean accuracy for the SAR method to be >80% for all three stations where in-situ data were used for validating WROS days detected by SAR, however the true positive rate was not particularly high (50–60%). Moreover, the metrics used provide an estimate of the accuracy for the total number of ROS days detected using SAR, which is likely to be overestimated in some cases due to liquid water remaining in the snowpack following a ROS event, as discussed above. Hence it is expected that several false positives would arise from these situations, leading to lower accuracy scores. The intensity, or duration of ROS events is important to quantify, as current knowledge suggests that ROS events are not only becoming more frequent, but also more intense and lasting longer (Rinke et al., 2017; Sobota et al., 2020). Future efforts should therefore concentrate on further development of the SAR-based method for detection of WROS, as the current results indicate that SAR has potential as a powerful tool for long term monitoring of WROS activity. Special focus should be given to improving the detection of the end of a ROS event in order to reliably obtain estimates of ROS duration as well as addressing the method by which data gaps are handled to reduce temporal uncertainty in the wet snow detections. In addition, a more comprehensive evaluation of the SAR ROS detection accuracy should be made by considering the rate of true and false positive detections using data from as many meteorological stations as possible, as well as identifying the conditions producing false detections. Utilizing output from RCM data to detect ROS events and make quantitative comparisons would also serve to verify the accuracy of the SAR method.
This work has focused on the application of SAR wet snow mapping to study snowmelt events in Svalbard, covering a 17-year time period from 2004–2020. Specifically, we have utilized SAR wet snow detection to map spring melt onset and the occurrence of wintertime rain-on-snow (WROS) events.
We find a general asymmetry in timing of spring melt onset across the archipelago, with earliest dates of onset taking place in the south and west of Svalbard and latest melt onset in the north and east. This spatial variation is consistent with earlier studies of melt onset carried out using a shorter time period of remote sensing observations and reflects the general differences in climate across the archipelago. Consequently, a similar geographical pattern in WROS occurrence has also been obtained, with highest frequency of WROS events in the south and west of Svalbard and fewest in the northeast. It is also in these areas that we find a significant and increasing trend in WROS events, with a change that is typically >1.5 events per decade. However, in the central part of the archipelago, over Nordenskiöld Land, and over the western parts of Edgeøya we find a significant and decreasing trend in WROS frequency, which we suggest may be linked to trends in precipitation and snow depth, as evidenced by earlier modelling studies.
Comparisons between the wet snow maps and ground based meteorological data indicate that the detected transitions from dry to wet snow coincide well with the timing of precipitation falling as rain. The approach is therefore reliable for detecting the onset of a WROS event, but further efforts are needed to improve estimations of the duration, or intensity of a WROS event, since the liquid water content of the snowpack may remain elevated after a WROS has ended, leading to the detection of wet snow even in the absence of precipitation. Furthermore, we suggest the use of additional data sources such as regional climate models to carry out a large-scale evaluation of the accuracy of the approach in order to refine and improve the method as a tool for long term monitoring of snowmelt events in Svalbard.
The datasets presented in this study can be found in online repositories. The names of the repository/repositories and accession number(s) can be found below: https://www.sios-svalbard.org/metadata_search.
HV performed data analysis and produced figures. EM developed the algorithms for producing the wet snow dataset. HV, EM, and ME all contributed to writing of the manuscript.
This work was supported by the Research Council of Norway under the project Svalbard Integrated Arctic Earth Observing System—Infrastructure development of the Norwegian node (SIOS-InfraNor Project No. 269927).
The authors declare that the research was conducted in the absence of any commercial or financial relationships that could be construed as a potential conflict of interest.
The handling editor declared a past co-authorship with one of the authors EM.
All claims expressed in this article are solely those of the authors and do not necessarily represent those of their affiliated organizations, or those of the publisher, the editors and the reviewers. Any product that may be evaluated in this article, or claim that may be made by its manufacturer, is not guaranteed or endorsed by the publisher.
Envisat ASAR: Data were provided by the European Space Agency 2002–2012. RADARSAT-2: Data provided by NCS/KSAT under the Norwegian-Canadian RADARSAT-2 agreement 2012–16. Copernicus Sentinel-1: Data 2014–2021, processed by ESA. Meteorological data were provided by the Norwegian Meteorological Institute. The digital elevation Model (DEM) was provided by the Norwegian Polar Institute.
The Supplementary Material for this article can be found online at: https://www.frontiersin.org/articles/10.3389/feart.2022.868945/full#supplementary-material
Supplementary Figure S1 | Number of days with data coverage per pixel for the study period, 2004–2021.
Supplementary Figure S2 | Time series of melt onset anomalies mapped for the Svalbard archipelago in the period 2004–2020. The melt anomalies are calculated from the difference between the melt onset per pixel for individual years and the mean date of melt onset (Figure 7).
Supplementary Figure S3 | Time series of wintertime ROS events mapped for the Svalbard archipelago in the period from 2004–2020.
Supplementary Figure S4 | Temperature and wet snow fraction for the 2005/2006 spring season to highlight two melt periods during May–June.
Abermann, J., Eckerstorfer, M., Malnes, E., and Hansen, B. U. (2019). A Large Wet Snow Avalanche Cycle in West Greenland Quantified Using Remote Sensing and In Situ Observations. Nat. Hazards 97, 517–534. doi:10.1007/s11069-019-03655-8
Bartsch, A., Kumpula, T., Forbes, B. C., and Stammler, F. (2010). Detection of Snow Surface Thawing and Refreezing in the Eurasian Arctic with QuikSCAT: Implications for Reindeer Herding. Ecol. Appl. 20, 2346–2358. doi:10.1890/09-1927.1
Bintanja, R., and Andry, O. (2017). Towards a Rain-Dominated Arctic. Nat. Clim. Change 7, 263–267. doi:10.1038/nclimate3240
Bintanja, R., and Selten, F. M. (2014). Future Increases in Arctic Precipitation Linked to Local Evaporation and Sea-Ice Retreat. Nature 509, 479–482. doi:10.1038/nature13259
Bjerke, J. W., Rune Karlsen, S., Arild Høgda, K., Malnes, E., Jepsen, J. U., Lovibond, S., et al. (2014). Record-low Primary Productivity and High Plant Damage in the Nordic Arctic Region in 2012 Caused by Multiple Weather Events and Pest Outbreaks. Environ. Res. Lett. 9, 084006. doi:10.1088/1748-9326/9/8/084006
Bokhorst, S., Tømmervik, H., Callaghan, T. V., Phoenix, G. K., and Bjerke, J. W. (2012). Vegetation Recovery Following Extreme Winter Warming Events in the Sub-arctic Estimated Using NDVI from Remote Sensing and Handheld Passive Proximal Sensors. Environ. Exp. Bot. 81, 18–25. doi:10.1016/j.envexpbot.2012.02.011
Cohen, J., and Rind, D. (1991). The Effect of Snow Cover on the Climate. J. Clim. 4 (7), 689–706. doi:10.1175/1520-0442(1991)004<0689:teosco>2.0.co;2
Cohen, J., Ye, H., and Jones, J. (2015). Trends and Variability in Rain‐on‐snow Events. Geophys. Res. Lett. 42, 7115–7122. doi:10.1002/2015gl065320
Dolant, C., Langlois, A., Montpetit, B., Brucker, L., Roy, A., and Royer, A. (2016). Development of a Rain-On-Snow Detection Algorithm Using Passive Microwave Radiometry. Hydrol. Process. 30, 3184–3196. doi:10.1002/hyp.10828
Eckerstorfer, M., and Christiansen, H. H. (2012). Meteorology, Topography and Snowpack Conditions Causing Two Extreme Mid-Winter Slush and Wet Slab Avalanche Periods in High Arctic Maritime Svalbard. Permafr. Periglac. Process. 23, 15–25. doi:10.1002/ppp.734
Eckerstorfer, M., and Christiansen, H. H. (2011). Topographical and Meteorological Control on Snow Avalanching in the Longyearbyen Area, Central Svalbard 2006–2009. Geomorphology 134 (3–4), 186–196. doi:10.1016/j.geomorph.2011.07.001
Essery, R., Morin, S., Lejeune, Y., and B Ménard, C. (2013). A Comparison of 1701 Snow Models Using Observations from an Alpine Site. Adv. Water Resour. 55, 131–148. doi:10.1016/j.advwatres.2012.07.013
Forbes, B. C., Kumpula, T., Meschtyb, N., Laptander, R., Macias-Fauria, M., Zetterberg, P., et al. (2016). Sea Ice, Rain-On-Snow and Tundra Reindeer Nomadism in Arctic Russia. Biol. Lett. 12 (11), 20160466. doi:10.1098/rsbl.2016.0466
Førland, E. J., Benestad, R., Hanssen-Bauer, I., Haugen, J. E., and Skaugen, T. E. (20112011). Temperature and Precipitation Development at Svalbard 1900–2100. Adv. Meteorol., 14. doi:10.1155/2011/893790
Grenfell, T. C., and Putkonen, J. (2008). A Method for the Detection of the Severe Rain-On-Snow Event on Banks Island, October 2003, Using Passive Microwave Remote Sensing. Water Resour. Res. 44, W03425. doi:10.1029/2007WR005929
Haga, O. N., McNabb, R., Nuth, C., Altena, B., Schellenberger, T., and Kääb, A. (2020). From High Friction Zone to Frontal Collapse: Dynamics of an Ongoing Tidewater Glacier Surge, Negribreen, Svalbard. J. Glaciol. 66 (259), 742–754. doi:10.1017/jog.2020.43
Hansen, B. B., Aanes, R., Herfindal, I., Kohler, J., and Sæther, B.-E. (2011). Climate, Icing, and Wild Arctic Reindeer: Past Relationships and Future Prospects. Ecology 92, 1917–1923. doi:10.1890/11-0095.1
Hansen, B. B., Isaksen, K., Benestad, R. E., Kohler, J., Pedersen, Å. Ø., Loe, L. E., et al. (2014). Warmer and Wetter Winters: Characteristics and Implications of an Extreme Weather Event in the High Arctic. Environ. Res. Lett. 9, 114021. doi:10.1088/1748-9326/9/11/114021
Hansen, B. B., Lorentzen, J. R., Welker, J. M., Varpe, Ø., Aanes, R., Beumer, L. T., et al. (2019). Reindeer Turning Maritime: Ice-Locked Tundra Triggers Changes in Dietary Niche Utilization. Ecosphere 10 (4), e02672. doi:10.1002/ecs2.2672
Hanssen-Bauer, I., Førland, E. J., Hisdal, H., Mayer, S., Sandø, A. B., and Sorteberg, A. (2018). Climate in Svalbard 2100 - A Knowledge Base for Climate Adaptation, NCCS Report No. 1/2019. Oslo, Norway: Norwegian Meteorological Institute.
Isaksen, K., Nordli, Ø., Førland, E. J., Łupikasza, E., Eastwood, S., and Niedźwiedź, T. (2016). Recent Warming on Spitsbergen - Influence of Atmospheric Circulation and Sea Ice Cover. J. Geophys. Res. Atmos. 121, 11913–11931. doi:10.1002/2016jd025606
Johansen, B. E., Karlsen, S. R., and Tømmervik, H. (2012). Vegetation Mapping of Svalbard Utilising Landsat TM/ETM+ Data. Polar Rec. 48, 47–63. doi:10.1017/s0032247411000647
Langley, K., Hamran, S.-E., Hogda, K. A., Storvold, R., Brandt, O., Kohler, J., et al. (2008). From Glacier Facies to SAR Backscatter Zones via GPR. IEEE Trans. Geosci. Remote Sens. 46 (9), 2506–2516. doi:10.1109/TGRS.2008.918648
Langlois, A., Johnson, C.-A., Montpetit, B., Royer, A., Blukacz-Richards, E. A., Neave, E., et al. (2017). Detection of Rain-On-Snow (ROS) Events and Ice Layer Formation Using Passive Microwave Radiometry: A Context for Peary Caribou Habitat in the Canadian Arctic. Remote Sens. Environ. 189, 84–95. doi:10.1016/j.rse.2016.11.006
Larsen, Y., Engen, G., Lauknes, T. R., Malnes, E., and Høgda, K. A. (2006). “A Generic Differential Interferometric SAR Processing System, with Applications to Land Subsidence and Snow-Water Equivalent Retrieval,” in Fringe 2005 Workshop.610
Lievens, H., Brangers, I., Marshall, H.-P., Jonas, T., Olefs, M., and De Lannoy, G. (2022). Sentinel-1 Snow Depth Retrieval at Sub-kilometer Resolution over the European Alps. Cryosphere 16, 159–177. doi:10.5194/tc-16-159-2022
Lievens, H., Demuzere, M., Marshall, H.-P., Reichle, R. H., Brucker, L., Brangers, I., et al. (2019). Snow Depth Variability in the Northern Hemisphere Mountains Observed from Space. Nat. Commun. 10, 4629. doi:10.1038/s41467-019-12566-y
Lith, A., Moholdt, G., and Kohler, J. (2021). Svalbard Glacier Inventory Based on Sentinel-2 Imagery from Summer 2020 [Data Set]. Tromsø: Norwegian Polar Institute. doi:10.21334/npolar.2021.1b8631bf
Łupikasza, E. B., Ignatiuk, D., Grabiec, M., Cielecka-Nowak, K., Laska, M., Jania, J., et al. (2019). The Role of Winter Rain in the Glacial System on Svalbard. Water 11, 334. doi:10.3390/w11020334
Marin, C., Bertoldi, G., Premier, V., Callegari, M., Brida, C., Hürkamp, K., et al. (2020). Use of Sentinel-1 Radar Observations to Evaluate Snowmelt Dynamics in Alpine Regions. Cryosphere 14, 935–956. doi:10.5194/tc-14-935-2020.2020
Matsumura, S., Zhang, X., and Yamazaki, K. (2014). Summer Arctic Atmospheric Circulation Response to Spring Eurasian Snow Cover and its Possible Linkage to Accelerated Sea Ice Decrease. J. Clim. 27, 6551–6558. doi:10.1175/jcli-d-13-00549.1
Moholdt, G., Maton, J., Majerska, M., and Kohler, J. (2021). Annual Frontlines of Marine-Terminating Glaciers on Svalbard [Data Set]. Tromsø: Norwegian Polar Institute. doi:10.21334/npolar.2021.d60a919a
Nagler, T., and Rott, H. (2000). Retrieval of Wet Snow by Means of Multitemporal SAR Data. IEEE Trans. Geosci. Remote Sens. 38, 754–765. doi:10.1109/36.842004
Nagler, T., Rott, H., Ripper, E., Bippus, G., and Hetzenecker, M. (2016). Advancements for Snowmelt Monitoring by Means of Sentinel-1 SAR. Remote Sens. 8, 348. doi:10.3390/rs8040348
Nuth, C., Kohler, J., König, M., von Deschwanden, A., Hagen, J. O., Kääb, A., et al. (2013). Decadal Changes from a Multi-Temporal Glacier Inventory of Svalbard. Cryosphere 7, 1603–1621. doi:10.5194/tc-7-1603-2013
Peeters, B., Pedersen, A. O., Loe, L. E., Isaksen, K., Veiberg, V., Stien, A., et al. (2019). Spatiotemporal Patterns of Rain-On-Snow and Basal Ice in High Arctic Svalbard: Detection of a Climate-Cryosphere Regime Shift. Environ. Res. Lett. 14, 015002. doi:10.1088/1748-9326/aaefb3
Rinke, A., Maturilli, M., Graham, R. M., Matthes, H., Handorf, D., Cohen, L., et al. (2017). Extreme Cyclone Events in the Arctic: Wintertime Variability and Trends. Environ. Res. Lett. 12, 094006. doi:10.1088/1748-9326/aa7def
Rotschky, G., Vikhamar Schuler, T., Haarpaintner, J., Kohler, J., and Isaksson, E. (2011). Spatio-temporal Variability of Snowmelt across Svalbard during the Period 2000-08 Derived from QuikSCAT/SeaWinds Scatterometry. Polar Res. 30, 5963. doi:10.3402/polar.v30i0.5963
Semmens, K. A., Ramage, J., Bartsch, A., and Liston, G. E. (2013). Early Snowmelt Events: Detection, Distribution, and Significance in a Major Sub-arctic Watershed. Environ. Res. Lett. 8, 11. doi:10.1088/1748-9326/8/1/014020
Serreze, M. C., Barrett, A. P., Stroeve, J. C., Kindig, D. N., and Holland, M. M. (20092009). The Emergence of Surface-Based Arctic Amplification. Cryosphere 3, 11–19. doi:10.5194/tc-3-11-2009
Sharp, M., and Wang, L. (2009). A Five-Year Record of Summer Melt on Eurasian Arctic Ice Caps. J. Clim. 22, 133–145. doi:10.1175/2008jcli2425.1
Snapir, B., Momblanch, A., Jain, S. K., Waine, T. W., and Holman, I. P. (2019). A Method for Monthly Mapping of Wet and Dry Snow Using Sentinel-1 and MODIS: Application to a Himalayan River Basin. Int. J. Appl. Earth Observation Geoinformation 74, 222–230. doi:10.1016/j.jag.2018.09.011
Sobota, I., Weckwerth, P., and Grajewski, T. (2020). Rain-On-Snow (ROS) Events and Their Relations to Snowpack and Ice Layer Changes on Small Glaciers in Svalbard, the High Arctic. J. Hydrology 590, 125279. doi:10.1016/j.jhydrol.2020.125279
Tsai, Y.-L. S., Dietz, A., Oppelt, N., and Kuenzer, C. (2019). Wet and Dry Snow Detection Using Sentinel-1 SAR Data for Mountainous Areas with a Machine Learning Technique. Remote Sens. 11, 895. doi:10.3390/rs11080895
Van Pelt, W. J. J., Kohler, J., Liston, G. E., Hagen, J. O., Luks, B., Reijmer, C. H., et al. (2016a). Multidecadal Climate and Seasonal Snow Conditions in Svalbard. J. Geophys. Res. Earth Surf. 121, 2100–2117. doi:10.1002/2016jf003999
van Pelt, W. J. J., Pohjola, V. A., and Reijmer, C. H. (2016b). The Changing Impact of Snow Conditions and Refreezing on the Mass Balance of an Idealized Svalbard Glacier. Front. Earth Sci. 4, 102. doi:10.3389/feart.2016.00102
Varade, D., Dikshit, O., and Manickam, S. (2019). Dry/wet Snow Mapping Based on the Synergistic Use of Dual Polarimetric SAR and Multispectral Data. J. Mt. Sci. 16, 1435–1451. doi:10.1007/s11629-019-5373-3
Vickers, H., Karlsen, S. R., and Malnes, E. (2020). A 20-Year MODIS-Based Snow Cover Dataset for Svalbard and its Link to Phenological Timing and Sea Ice Variability. Remote Sens. 12, 1123. doi:10.3390/rs12071123
Vikhamar-Schuler, D., Isaksen, K., Haugen, J. E., Tømmervik, H., Luks, B., Schuler, T. V., et al. (2016). Changes in Winter Warming Events in the Nordic Arctic Region. J. Clim. 29 (17), 6223–6244. doi:10.1175/JCLI-D-15-0763.1
Vogel, S., Eckerstorfer, M., and Christiansen, H. H. (2010). “Cornice Dynamics above Nybyen in Svalbards High Arctic Landscape,” in Proc. International Snow Science Workshop (USA: Squaw Valley), 785–790.
Walczowski, W., and Piechura, J. (2011). Influence of the West Spitsbergen Current on the Local Climate. Int. J. Climatol. 31, 1088–1093. doi:10.1002/joc.2338
Westermann, S., Boike, J., Langer, M., Schuler, T. V., and Etzelmüller, B. (2011). Modeling the Impact of Wintertime Rain Events on the Thermal Regime of Permafrost. Cryosphere 5, 945–959. doi:10.5194/tc-5-945-2011
Wickström, S., Jonassen, M. O., Cassano, J. J., and Vihma, T. (2020). Present Temperature, Precipitation, and Rain‐on‐snow Climate in Svalbard. J. Geophys. Res. Atmos. 125, e2019JD032155. doi:10.1029/2019jd032155
Wilson, R. R., Bartsch, A., Joly, K., Reynolds, J. H., Orlando, A., and Loya, W. M. (2013). Frequency, Timing, Extent, and Size of Winter Thaw-Refreeze Events in Alaska 2001-2008 Detected by Remotely Sensed Microwave Backscatter Data. Polar Biol. 36, 419–426. doi:10.1007/s00300-012-1272-6
Keywords: SAR, snowmelt, snow cover, rain-on-snow events, climate change
Citation: Vickers H, Malnes E and Eckerstorfer M (2022) A Synthetic Aperture Radar Based Method for Long Term Monitoring of Seasonal Snowmelt and Wintertime Rain-On-Snow Events in Svalbard. Front. Earth Sci. 10:868945. doi: 10.3389/feart.2022.868945
Received: 03 February 2022; Accepted: 27 April 2022;
Published: 14 July 2022.
Edited by:
Roberto Salzano, CNR—Institute of Atmospheric Pollution Research (CNR-IIA), ItalyReviewed by:
Niklas Neckel, Alfred Wegener Institute Helmholtz Centre for Polar and Marine Research (AWI), GermanyCopyright © 2022 Vickers, Malnes and Eckerstorfer. This is an open-access article distributed under the terms of the Creative Commons Attribution License (CC BY). The use, distribution or reproduction in other forums is permitted, provided the original author(s) and the copyright owner(s) are credited and that the original publication in this journal is cited, in accordance with accepted academic practice. No use, distribution or reproduction is permitted which does not comply with these terms.
*Correspondence: Hannah Vickers, aGF2aUBub3JjZXJlc2VhcmNoLm5v
Disclaimer: All claims expressed in this article are solely those of the authors and do not necessarily represent those of their affiliated organizations, or those of the publisher, the editors and the reviewers. Any product that may be evaluated in this article or claim that may be made by its manufacturer is not guaranteed or endorsed by the publisher.
Research integrity at Frontiers
Learn more about the work of our research integrity team to safeguard the quality of each article we publish.