 Ryunosuke Kazahaya
 Matthew Varnam
 Ben Esse
 Mike Burton
 Hiroshi Shinohara
 Martha Ibarra4
- 1Geological Survey of Japan, National Institute of Advanced Industrial Science and Technology, Tsukuba, Japan
- 2Department of Earth and Environmental Sciences, The University of Manchester, Manchester, United Kingdom
- 3Lunar and Planetary Laboratory, University of Arizona, Tucson, AZ, United States
- 4Instituto Nicaragüense de Estudios Territoriales, Frente a Policlínica Oriental, Managua, Nicaragua
Multi-disciplinary volcanic gas observations, including FTIR, Multi-GAS, and Alkali filter pack, were made at Masaya Volcano, Nicaragua, in January 2018. During the observation period, a lava lake was present, and the majority of the volcanic gases were likely emitted directly from the lava without any hydrothermal alterations. It is expected that the volcanic gas composition reflects the conditions of the magma, exhibiting a high equilibrium temperature. The fractions of the major components showed good consistency with previous studies; however, we found the fraction of the combustible components (such as H2) were lower than expected. The RH [log(H2/H2O)] value was measured to be less than −6, compared to the equilibrium RH value calculated to be around −3 from the iron speciation. The equilibrium calculations suggest oxidation of the volcanic gases by high-temperature mixing with the air once they are emitted from the lava lake, lowering the H2 content of the plume. In contrast to H2, a small amount of CO, another combustible species, was detected and the derived CO2/CO ratio of ca. 1,000 is consistent with the equilibrium magmatic value. This indicates that CO is kinetically inert compared to H2. Our findings suggest that volcanic gases in the Masaya plume do not preserve information from when the gases were originally in equilibrium with the high-temperature surrounding magma.
Highlights
1) The plume from the lava lake at Masaya Volcano is depleted in H2 relative to the theoretical values from equilibrium calculations. However, CO is in good agreement.
2) Depletion in volcanic H2 indicates oxidization upon mixing of the plume with air.
3) The chemistry of the gas plumes emitted by basaltic lava lakes may not reflect the original high temperature equilibrium at which they were emitted.
Introduction
Hydrogen (H2) and carbon monoxide (CO) are minor components of high-temperature magmatic gases, but provide crucial clues on redox states and temperature of the magma (Giggenbach, 1987; Moussallam et al., 2012; Oppenheimer et al., 2012). Equilibrium concentrations of these gases decrease with decreasing temperature in the gas phase after degassing from the magma via the following redox reactions with T-dependent equilibrium constants, K1, K2, and K3. Further details are given in Section 4:
If the volcanic gas is cooled slowly enough to remain in equilibrium (and without adding oxidant-rich air, i.e., closed system cooling), H2 and CO will decrease as the equilibrium temperature is lowered. However, at lava lakes, the volcanic gases degas directly into cold ambient air, which is expected to quench the high-temperature equilibrium, preserving the concentrations of H2 and CO. As a volcano with a lava lake, some previous studies have confirmed this at Erebus volcano in Antarctica (Table 1 in Moussallam et al., 2012). However, other volcanoes with lava lakes have suggested the possibility of oxidization of volcanic H2, CO, and H2S in the air for high-temperature volcanic gas at Erta Ale in Ethiopia and Masaya Volcano in Nicaragua (deMoor et al., 2013). Moreover, at Kilauea in Hawaii, H2 burning has been reported (Cruikshank et al., 1973), supporting the idea that full quenching may not always occur, especially for H2, which is more rapidly oxidized than other combustible components such as CO (Roberts et al., 2019). It is therefore important to consider if equilibrium model assumptions apply to these hot near-source plumes or not.
Masaya Volcano in Nicaragua is an open vent, basaltic volcano that has four pit craters, with recent volcanic activity centralized within the Santiago crater (Figure 1). In late 2015, a lava lake appeared with a very high lava flow speed (Pering et al., 2019), providing opportunities for direct observations of the active convecting magma system. Aiuppa et al. (2018) provide a detailed dataset of the volcanic gas composition from the formation of the lava lake (2014–2017). However, combustible components such as H2 and CO have not been reported yet. In this study, we made multi-disciplinary volcanic gas measurements at Masaya Volcano to reveal the behaviors of the redox-sensitive components such as H2 and CO in the high-temperature plume emitted from the lava lake.
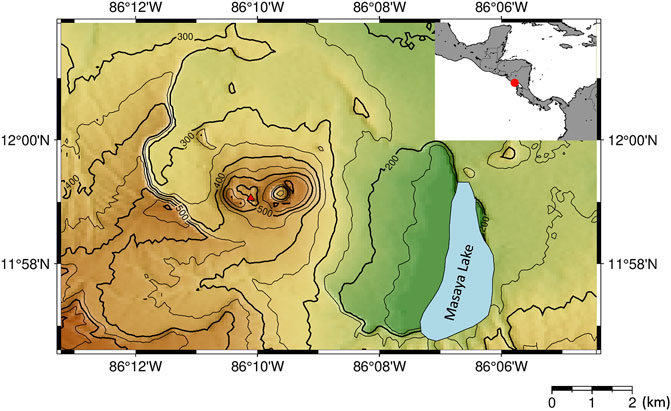
FIGURE 1. Map of Masaya Volcano. The red triangle represents the location of a lava lake. Inset shows the location of Masaya Volcano (red circle) within Nicaragua.
Observation and Analytical Methods
FTIR
Open-Path Fourier-transform infrared spectroscopy (OP-FTIR) measures infrared-active gas species such as H2O, CO2, SO2, H2S, HF, HCl, and CO (e.g., Oppenheimer et al., 1998). Our spectrometer was a MIDAC M4410 equipped with a ZnSe beam splitter and a Stirling pump-cooled MCT detector. We used a 10 millirad, 3" Φ Newtonian telescope. The measurements were made on 10, 13, and 15 January 2018 at the south crater rim using an incandescent lamp as a source of artificial infrared radiation such that the plume flowed between the light source and the detector. The path lengths between the lamp and spectrometer were 30 m on 10 January 2018 and 40 m on 13 and 15 January 2018. An OP-FTIR measurement using a lava lake as a light source was also attempted on 12 January 2018 at a distance of a few hundred meters.
For FTIR data, the gas column amounts were calculated using simulated spectra with a forward model using spectral line parameters from the HITRAN database (Rothman et al., 2008), and finding the best fit to the field data using an optimal estimation non-linear least-squares algorithm (Burton et al., 2000). We analyzed the column amounts of SO2 (2450–2550 cm−1), H2O (2100–2240 cm−1), CO2 (2100–2240 cm−1), HF (4050–4200 cm−1), and HCl (2690–2840 cm−1). Analyses of CO (2070–2130 cm−1) were also attempted using the data of the measurement on 12 January 2018.
Multi-GAS
Multi-GAS (Aiuppa et al., 2005; Shinohara, 2005) is a sensor-based instrument allowing us to have in situ measurements of gas species such as H2O, CO2, SO2, H2S, and H2. We conducted Multi-GAS measurements on the edge of the crater rim on 9, 11, 12, and 13 January 2018. The observation points were windward relative to the FTIR. The gas sensor system consists of a non-dispersive infrared CO2–H2O analyzer (LI-840, LI-COR, Inc., Lincoln, United States), SO2 and H2S electrochemical sensors (KTS-512 and KHS-5TA, respectively, Komyo Rikagaku K. K., Kawasaki, Japan), and a H2 semi-conductor sensor (GM12s, Sensor Tech K. K., Rittou, Japan). A SO2 scrubber was placed in front of the H2S sensor to reduce cross-sensitivity of the sensor (Shinohara et al., 2011). The results were recorded with a frequency of 1 Hz using a data logger (NR-1000, Keyence Co. Japan). Ambient air was pumped with a flux of 1 L/min from an inlet. The sensors were calibrated before (1 September 2017) and after (30 January 2018) the observations. The calibrations were made using gas canisters of CO2 (ca. 400 ppm), SO2 (ca. 50 ppm), H2S (ca. 10 ppm), and Ar (pure gas for the zero points of the sensors). H2O calibration was made using a dew point generator (LI610, LI-COR, INC., Lincoln, United States). The H2 sensor was calibrated for 0.5, 1, 2, 5, 10, and 20 ppm using a gas chamber; H2 pure gas was injected into the gas chamber using a syringe into a gas chamber to control the H2 concentration within the gas chamber.
Alkali Filter Pack
Alkali filter pack techniques (AF pack) (Shinohara and Witter, 2005; Shinohara et al., 2011) were applied to measure S, Cl, and F in the volcanic plume. The measurements were made on 9, 13, and 15 January 2018 on the edge of the crater rim alongside the Multi-GAS instrument. The filter pack includes a 0.2 μm particle filter followed by two filter holders each with two filters impregnated with 1N NaOH + 20% Glycerol. After field observations, the filters were rinsed with pure water and the solution from the filters was oxidized using hydrogen peroxide solution at GSJ, Japan. The pH was adjusted to near neutral using OnGuard-H (Thermo Fisher Scientific Inc.) before measuring the concentrations of F, Cl, and SO42- by ion-chromatography. The first and second holders with the alkaline filters were analyzed separately. Along with the AF pack measurements, the SO2 exposure level was monitored using a passive dosimeter tube (5D; Gastec Corporation) to ensure that the acid gases are not saturated on the filters.
Results
We made parallel observations using Multi-GAS, FTIR, and AF filter at Masaya Volcano, Nicaragua from 9 to 15 January 2018. Notice that all the gas concentrations and ratios presented here are by mole. Examples of the observation results of the Multi-GAS are shown in Figure 2. Detection limits of the measurements depend on the observation conditions. We used signals of SO2 as a volcanic plume indicator for Multi-GAS because ambient air contains very low concentrations of SO2, typically 0.1–70 ppb, compared to typical dilute plume concentrations of 1–2 ppm (Symonds et al., 1994). The gas ratios are derived using Ratiocalc software (Tamburello, 2015). The differences in the response times of IR-based, chemical, and semi-conductor sensors are corrected (Shinohara et al., 2011). For the correlation analysis, only data with the coefficient of determination (R2 value) of more than 0.6 are accepted. All data analyzed with data processing information including correlation results, determination coefficients, analytical errors, and the parameters of shift and numerical filters, can be found in Supplementary Material S1. Examples of the correlation analyses are shown in Figure 3.
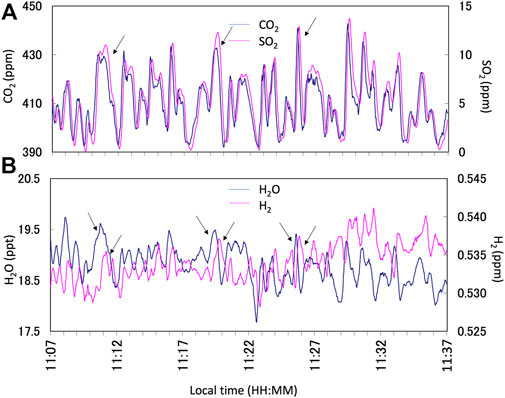
FIGURE 2. Example of the Multi-GAS observation results on 13 January 2018. (A) Time series of CO2 (blue line) and SO2 (pink line) concentrations in parts per millions (ppm). (B) Time series of H2O (blue line) and H2 (pink line) concentrations in parts per thousands (ppt) and ppm, respectively. The arrows indicate the corresponding plume signals for the analyses. Note that the response of the H2 signal is slow because the sensor is semi-conductor based. All data are filtered by a 15-s running average to reduce the instrumental noises. Notice that the correlation analyses were made using Ratiocalc independently.
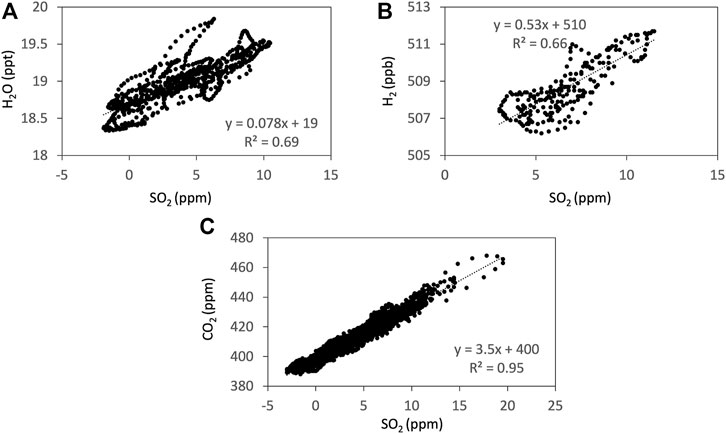
FIGURE 3. Examples of the correlations from the Ratiocalc analyses (Tamburello, 2015) of SO2 to H2O (A), H2 (B), and CO2 (C) measured using Mutli-GAS on 13 January 2018. The time series are filtered and shifted to take the sensor response into account using Ratiocalc. H2 concentration is shown in parts per billions (ppb) to avoid rounding errors during the Ratiocalc analyses.
In Multi-GAS measurements, the concentrations of H2S recorded are under the detection limit (Figure 4C). From the SO2 signals of ca. 10 ppm and the H2S signals of less than 0.01 ppm, we concluded that the SO2/H2S ratios are more than one thousand.
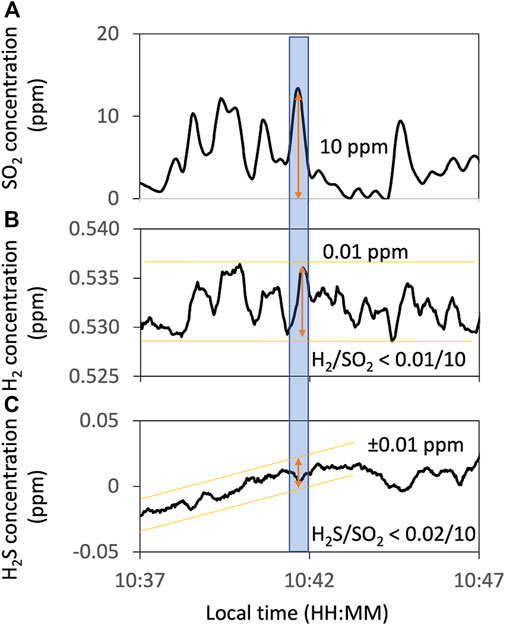
FIGURE 4. Example of the Multi-GAS observation of H2S concentration. Concentration timelines of SO2 (A) as an indicator of the volcanic plume and H2 (B) and H2S (C) measured using Multi-GAS on 13 January 2018. Orange lines and arrows show the range of variations of these timelines. The blue-filled area corresponds to the periods used to estimate the maximum H2/SO2 and H2S/SO2 ratios. All data are filtered by a 15-s running average to reduce instrumental noises.
The H2 signals are weak and noisy. We tried to extract the H2 signals based on the objective criteria as follows. Using the SO2 as an indicator of the plume, only the data where an H2 peak appears after an SO2 peak and the R2 value of more than 0.6 are accepted. The correlation analysis was made using Ratiocalc software (Tamburello, 2015). The H2/SO2 ratio was roughly estimated to be less than ca. 10−3 (Table 1). Because this value could be artifact, we also examined if the H2 is under the detection limit. From the SO2 signals of ca. 10 ppm and the H2 signals of less than 0.1 ppm (Figure 4B), the H2/SO2 ratio was estimated to be less than ca. 10−3. This estimation is consistent with the H2/SO2 ratio derived using Ratiocalc analysis. We concluded that the H2/SO2 ratio is less than this value. The H2/H2O ratio is estimated to be less than ca. 10−6 using the H2/SO2 and H2O/SO2 ratios (Table 1).
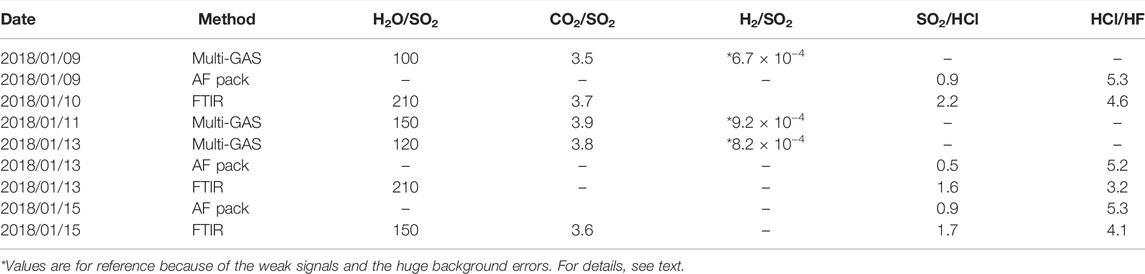
TABLE 1. Table to summarize the gas composition collected using Multi-GAS, AF pack, and FTIR. Details of all datasets can be found in Supplementary Material S1.
To confirm a low H2 concentration in the plume, Multi-GAS data acquired on 19 January 2009 using the same instruments as this study were also analyzed to estimate the H2 fraction in the volcanic plume (Supplementary Figure S1 in Supplementary Material S2). In 2009, the magma surface was within ca. 20 m of the crater floor (Martin et al., 2010). During these observations, the SO2 sensor was broken, so, from the signal peak heights in the time series we estimated the H2/H2O ratios directly. Estimated H2/H2O ratios of 4.9 × 10⁻⁶ were found with errors of ca. 60%, corresponding to the maximum estimation, consistent with our observation results (Supplementary Material S1).
Examples of the observation results of the FTIR are shown in Figure 5. We used HCl signals as a plume indicator for FTIR as ambient air is mostly HCl-free. The gas ratios are derived using Ratiocalc software and, as with the Multi-GAS analysis, only the data with R2 values of more than 0.6 are accepted. All data analyzed with errors can be found in the Supplementary Material S1. Examples of correlation analyses are shown in Figure 6. We attempted to retrieve the column amounts of CO from the FTIR measurements, but the signals were very low as the light path was only 30–40 m. On 12 January, we made the FTIR measurements using the lava lake as the light source with a longer light path of a few hundred meters to detect volcanic CO emission. The column amounts of CO were several thousand ppm × m (Figure 7); the CO2/CO ratio was calculated to be c.a. 1000 using Ratiocalc software. To confirm a low CO concentration, previous FTIR data obtained in 1998 (Burton et al., 2000) were re-analyzed. As shown by comparison to Burton et al. (2000), the composition of the main gas species such as H2O, CO2, and SO2 was stable. During that period, the FTIR measurements were made using incandescence from the magma pond at the crater bottom. The CO signal is very weak, with the CO2/CO ratio roughly estimated to be 6,000 but with low correlation of the R2 value of ca. 0.3 (Supplementary Figure S2 in Supplementary Material S2). We concluded that the CO2/CO ratio is as low as ca. 1,000 and more than several thousands in 2018 and 2009, respectively. This difference could be due to a change in the magmatic activity from 2009 to 2018, as discussed in Section 4. The CO2/CO ratio in Masaya Volcano is significantly larger than that of 13.33 at Erebus volcano in Antarctica (Table 1 in Moussallam et al., 2012) and those of 30–180 at Kīlauea in Hawaii (Supplementary Figure S2 in Oppenheimer et al., 2018), implying the differences in the oxidation state of the parental magmas.
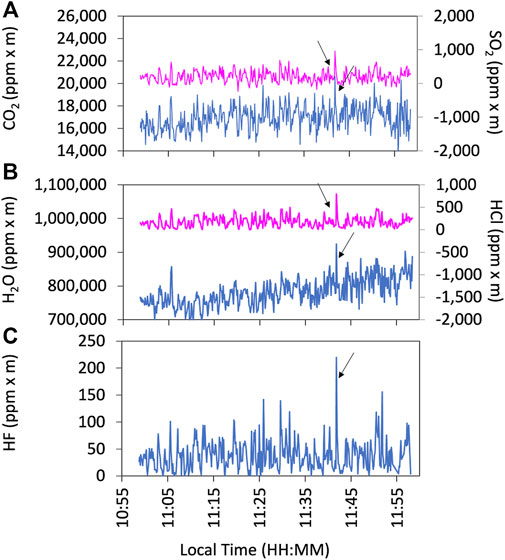
FIGURE 5. Example of the FTIR observation results on 13 January 2018. Time series of CO2 (blue line) and SO2 (pink line) (A), H2O (blue line) and HCl (pink line) (B), and HF (blue line) (C) in column amount (ppm x m). The arrows indicate the corresponding plume signals for the analyses. Because all species are measured based on IR, there are no variations in the response time.
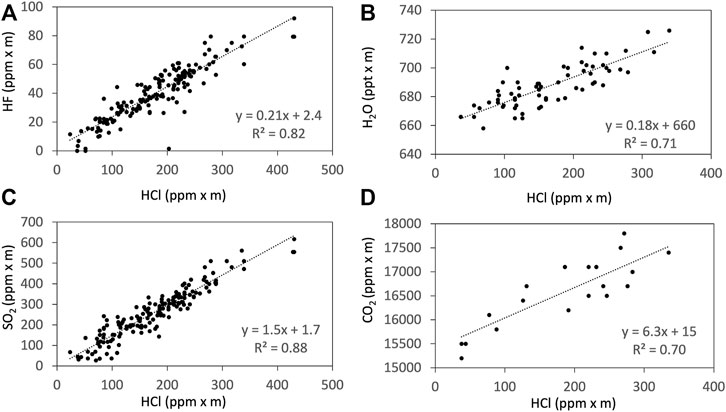
FIGURE 6. Examples of the correlations from the Ratiocalc analyses (Tamburello, 2015) of HCl to HF (A), H2O (B), SO2 (C), and CO2 (D) measured using FTIR on 15 January 2018. The H2O column amount is shown in ppt x m to avoid rounding errors during the Ratiocalc analyses.
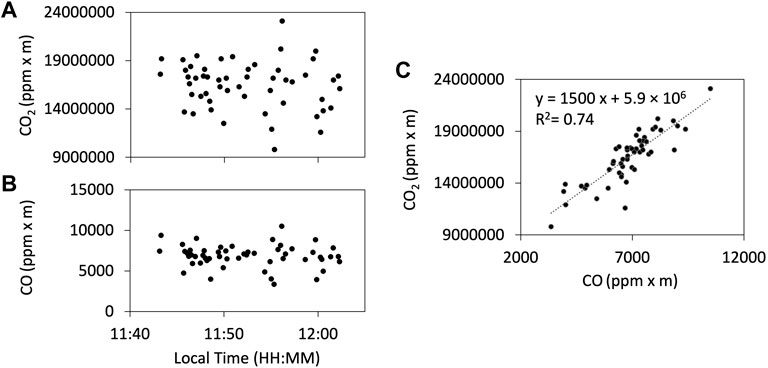
FIGURE 7. Results of the FTIR observation of CO using the lava lake as the light source on 12 January 2018. Column amount timelines of CO2 (A) and CO (B). (C) The correlation plot of the CO2 and CO column amounts. The CO2/CO ratio is estimated to be ca. 1,000.
The ratios of CO2/SO2 derived by FTIR and Multi-GAS are consistent (Table 1). The CO2/SO2 and H2O/SO2 ratios observed of ca. 4 (3.5–3.9) and ca. 150 (102–206) in this study are within the range of those reported by Aiuppa et al. (2018). The ratios of SO2/HCl and HCl/HF observed are also comparable to those reported by Martin et al. (2010). There are disagreements between the FTIR and AF packs, as the SO2/HCl ratios measured by the FTIR are higher (up to 4.4 times) than those of the AF packs; and the HCl/HF ratios from the FTIR are slightly lower (up to 1.7 times) than those of the AF packs. These trends are similar to the previous studies (Martin et al., 2010; Sawyer et al., 2011). The results imply that the collection of weakly acidic SO2 may be less efficient than that of strongly acidic HCl; the same argument could be applied for weakly acidic HF and strongly acidic HCl as argued by Sawyer et al. (2011).
Discussion
During the observation period at Masaya Volcano, a lava lake could be seen from the crater rim. The temperature of the lava lake is estimated to be 900–1200°C (Pering et al., 2019; INETER, 2021). The volcanic gases emitted are likely to be dominated by those degassed from the lava lake, that is, no secondary interactions with a hydrothermal system after degassing would be expected. Shallow (low-pressure) degassing is presumed (Aiuppa et al., 2018) as the CO2/SO2 ratios were as low as ca. 3 (Table 1). Before outgassing, the volcanic gases and magma are likely to be in equilibrium at the magmatic temperature of more than 900°C (Pering et al., 2019). After outgassing, the internal redox of the volcanic gases is thought to be quenched close to magmatic temperatures and an atmospheric pressure of 1 bar, as high-temperature volcanic gases (more than 800°C) reach equilibrium rapidly (Martin et al., 2006; Oppenheimer et al., 2018).
High H2 concentrations are observed in high temperature magmatic gases at other volcanoes (e.g., Giggenbach, 1987; Ohba et al., 1994; Giggenbach, 1996; Henley and Fischer, 2021). The value of log(H2/H2O) (hereafter described as RH) has been used as an indicator of the redox state in the gas phase (Giggenbach, 1987). The RH values of high-temperature magmatic gases are typically from −4 to −2 (Figure 3 in Henley and Fischer, 2021). We estimate a lower RH value at Masaya Volcano of ca. −6 using the ratios of H2/SO2 and H2O/SO2 in Table 1.
A theoretical RH value for volcanic gas can be calculated from the oxygen fugacity (fO2). The fO2 value of the magma is estimated to be of the order of magnitude of 10−9 at ca. 1,000°C (i.e., condition of the lava lake surface from Pering et al. (2019)) using the literature iron speciation measurements (Table 1 in deMoor et al., 2013). The RH value of volcanic gases with magma of this fO2 value is calculated using the equilibrium constant of the chemical reaction 1) in the gas phase as follows (Table 1 in Ohba et al., 1994):
Assuming the magma temperature of 1,000 °C at an atmospheric pressure of 1 bar, the RH value when volcanic gases and magma are in equilibrium (i.e., log fO2 of −9) is estimated to be ca. −3 (Figure 8). This value should correspond to the original RH value before outgassing from the lava lake. However, the observed RH value of ca. −6 is significantly lower.
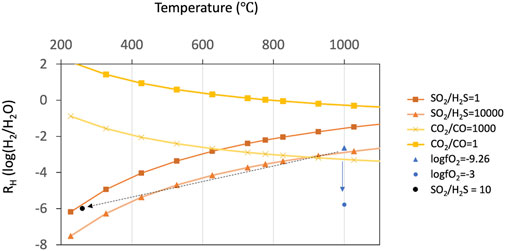
FIGURE 8. Stability (predominance) diagram in the system C-O-H-S in terms of RH and equilibrium temperature. Variations of RH as a function of temperature at a fixed fO2, SO2/H2S ratio, and CO2/CO ratio are shown. The two orange lines represent Giggenbach’s gas buffer lines where SO2/H2S ratios are 1 and 10,000 (Giggenbach, 1987). The two yellow lines represent stability lines where CO2/CO ratios are 1 and 1,000. Two blue dots represent stability points where log fO2 values are −9.26 and −3 at 1,000°C. The former corresponds to the calculation value from iron speciation (deMoor et al. (2013)). The latter corresponds to several percent mixing with the atmospheric air (Martin et al., 2006) that could explain the RH value of −6 at 1,000°C. Notice that the fO2 value of parental magma alters with the change in temperature.
At the same conditions described previously, the CO2/CO ratio when the volcanic gases and magma are in equilibrium is estimated using the following reaction (Table 1 in Ohba et al., 1994):
where XCO2 and XCO represent the mole fractions of CO2 and CO, respectively. When the RH value is ca. −3 (i.e., fO2 of 10−9), at 1,000°C, the CO2/CO ratio is estimated to be ca. 1,000 (Figure 8). This value is consistent with the observation in 2018, indicating that the chemical reaction (6) reaches the equilibrium
The observed RH value of −6 at 1,000°C corresponds to the fO2 value of more than ca. 10−3, which is higher than the magmatic fO2 value (Figure 8). To explain this discrepancy, we examine three possible processes: 1) additional meteoric or hydrothermal water after outgassing from the lava lake increases the H2O content, 2) chemical reaction of the volcanic gas within the closed system (i.e., equilibrium) at low temperature, and 3) oxidization of the volcanic gas in the air to lower the H2 content.
The process of 1) is not plausible. During the observation period a lava lake was present, so the major contribution of volcanic gases is likely to be volatiles degassed directly from the lava without any interactions with geothermal systems. Additional meteoric or non-magmatic H2O could be emitted by low-temperature hydrothermal fumaroles along the inner crater’s wall (Aiuppa et al., 2018). However, the H2O/SO2 ratios observed are about 100 and the SO2 emission rate from this volcano during the observation period is approximately one or two thousand tons per day (e.g., Varnam et al., 2021). To lower the RH value from -3 to -6 by adding non-magmatic H2O, the original H2O/SO2 ratios equilibrated with the magma would need to be of the order magnitude of 0.1, and non-magmatic H2O flux of more than several tens of thousands tons/day is required. Because this is not realistic, we reject this possibility.
We examined if cooling with chemical equilibrium in a closed system in the gas phase could explain this discrepancy (i.e., the possibility (b)). Within a closed system in the gas phase, the gas composition (SO2-H2-H2S-H2O) is thought to be controlled by the chemical reaction 3) (Giggenbach, 1987). The equilibrium constant and its temperature dependence are compiled by Ohba et al. (1994) as follows:
where XSO2 and XH2S represent the mole fraction of SO2 and H2S, respectively.
A line on RH versus temperature plot where SO2/H2S ratio is a constant value is called (Figure 8) (Giggenbach, 1987). The SO2/H2S ratio of volcanic gases in equilibrium with the magma at 1,000 °C and fO2 of 10−9 is estimated to be in the order of magnitude of 104 (Figure 8). This is consistent with the observation results that H2S is below the detection limit (i.e., SO2/H2S ratio is more than one thousand) (Figure 4).
The simple cooling in the gas phase within the closed system (the possibility b) changes the temperature, RH value, and SO2/H2S ratio simultaneously. The reaction 3) consumes 3 H2 molecules and produces one H2S molecule with a shift from the left-hand side to the right-hand side by cooling. If the RH value decreases from −3 to −6 by reaction (3), H2S is produced by one-third times the H2 consumption. We examined the amount of H2S production by reaction (3). Assuming that the initial RH value is −3 (i.e., H2/H2O = 10−3) and the SO2/H2S ratio is 104 at the magmatic temperature, when reaction 3) proceeds to lower the RH value to −6, the expected SO2/H2S ratio is estimated to be ca. 10 at the temperature of ca. 260°C. This value contradicts the observation results as H2S was under the detection limit (SO2/H2S ratio is more than several hundred). Consequently, the simple cooling in the gas phase within the closed system cannot explain the discrepancy.
If chemical reactions occur even after mixing with the air (i.e., not quenched rapidly after outgassing), the RH value will decrease by oxidation with atmospheric oxygen. The possibility of (c), that is, reaction 1) in the air to increase the fO2 value to 10−3 (Figure 8) could oxidize H2 and reduce the RH value. Assuming an O2 volume fraction of the ambient air of 0.21, only ca. 5 percent mixing with ambient air is needed to alter the fO2 value to 10−3. In this regard, Martin et al. (2006) calculated a thermodynamic equilibrium model optimized for volcanic gas chemistry and showed that the fractions of combustible components such as H2, CO, and H2S decrease drastically when mixing with the air. Two clear compositional regimes divided by a compositional discontinuity were found (Martin et al., 2006). They concluded that this compositional discontinuity is attributable to the amount of oxygen needed to oxidize the combustible components. The drastic decrease in the fraction of the combustible components (H2 and CO) occurs within the range of the mixing ratio with the air between 0 and 0.1 and at a temperature of more than 800°C. For instance, at 1,000°C, they exhibited that the RH value of the “Arc Mean” volcanic gas (Gerlach, 2004) drastically decreases from −2 to −6 with ca. 6 percent mixing with the air (Figure 12 in Martin et al., 2006). This model result is fairly consistent with our findings of an initial magmatic RH value of −3 but an observed RH value of −6. However, this thermodynamic model result is inconsistent with the observation of CO not being depleted whilst H2 is depleted; recent kinetics-based models have shown that H2 is more readily oxidized than CO (Roberts et al., 2019).
We now propose possible mechanisms that could promote the reaction of volcanic H2 in air at Masaya Volcano and suggest directions for future research. Hydrogen has been measured using Multi-GAS at the crater rim of Erebus volcano in Antarctica, which also has a lava lake (Moussallam et al., 2012). Measurements suggest that H2 is preserved in the volcanic plume by quenching in the Antarctic cold air and it is possible that the timescale of cooling is faster than Masaya Volcano. Using this direct comparison, a simple ascent of the plume from the surface of the lava lake to the crater rim alone is not sufficient to cause oxidization attributed to mixing with the air resulting in the huge loss in H2. To explain the H2-depleted volcanic plume observed at Masaya Volcano, an additional condition is necessary to oxidize the H2 after mixing with the air.
At Masaya Volcano, the flow speed of the lava lake was estimated to be as high as 13.7–16.4 m/s (Pering et al., 2019). This speed is significantly higher than other lava lake systems such as Erebus volcano (0.1 m/s) in Antarctica (Peters et al., 2014). Pering et al. (2019) concluded that they observed only a window into lava motion processes such as the deflection of ascending magma into a surface chamber. One possible factor to cause efficient oxidization is stagnated volcanic gases at the space above the lava lake that mixes with the air driven by rapid lava flow at high temperature without quenching. A kettle-like shape of the lava lake and the upper space (i.e., the window we observe corresponds to a spout) is presumed to keep volcanic gases at a high temperature (Figure 9). Residence time of volcanic gases at the high temperature space above the lava flow for oxidation is difficult to estimate. Roberts et al. (2019) argued that the oxidization of volcanic gases could proceed within a time scale of seconds, but this work was for dynamics in much larger plumes. It is not clear if this time scale is applicable for the plume that we observed at Masaya Volcano. However, qualitatively, if the reaction 1) is equilibrated at a high temperature inside of the kettle-like-shaped space above the lava lake, the low observed RH value of −6 might be explained.
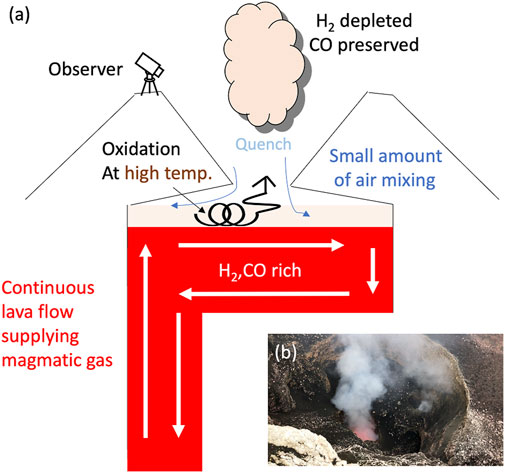
FIGURE 9. Schematic diagram to show the oxidization of H2 in the air at Masaya Volcano. (A) Cartoon to show the lava lake and the oxidization of the volcanic gases. Initially, when the volcanic gases are in equilibrium with the surrounding magma (red filled area; white arrows show the lava flow direction inferred from Pering et al. (2019)), the gases are rich in H2 and CO. Mixing with the air (blue arrows) at a high temperature oxidizes H2 (transparent orange area with coil-shaped arrows), then, the volcanic gases are quenched at the outlet of the vent, resulting in a poor H2 composition as observed. In contrast, CO is preserved because CO is likely to be kinetically inert compared to H2 (Roberts et al., 2019). (B) Photo taken at the rim of the Santiago crater, Masaya Volcano, Nicaragua. Observers could see only a portion of the lava lake through the window (i.e., the outlet of the vent).
If this speculation is correct, the periodicity of observed signals such as SO2 flux could not preserve information such as bubble-burst dynamics, which would be masked by the atmospheric transportation in the kettle-shaped space above the lava lake (Figure 9). In this regard, Pering et al. (2019) reported periodicity of 200–300 s oscillations in SO2 flux which could also not be seen in the volume of the gas in bubble bursts. They similarly concluded that the periodicity may not be attributed to the volcanic/magmatic process, but to atmospheric mechanisms such as atmospheric transport and turbulence.
These observations imply that volcanic gases are oxidized in the kettle-shaped space above the lava lake, depleting them in H2 by mixing with the air at a high temperature (Figure 9). The observed gas composition is likely to be superimposed by oxidation in air and would not preserve the magmatic information. On the other hand, the high H2 concentration at Erebus volcano in Antarctica (Moussallam et al., 2012) might be attributable to the quenching of the volcanic gas immediately after outgassing as there are no spaces above the lava lake to keep the volcanic gas at a high temperature and/or due to rapid cooling in the cold Antarctic atmosphere.
In contrast, the CO2/CO ratio of ca. 1,000 in 2018 corresponds to the equilibrium temperature of 1,000°C and magmatic fO2 of 10−9 (Oppenheimer et al., 2019), indicating that CO is not lost by the oxidization in the air. This result is consistent with the simulation results from Roberts et al. (2019), showing a relatively inert characteristic of CO comparing to H2. The difference in the CO2/CO ratio between 1998 and 2018 could simply be explained by a cooler, less active surface lava lake in 1998, causing equilibrium at a slightly lower temperature (900°C corresponding to the CO2/CO ratio of 6,000 rather than 1,000°C). Considering the more active degassing in 2018 (Aiuppa et al., 2018) compared to 1998, we consider this a likely explanation of the difference.
At volcanoes without lava lakes (e.g., Giggenbach, 1987; Aiuppa et al., 2011; Shinohara et al., 2018; Kazahaya et al., 2019; Ohba et al., 1994; Henley and Fischer, 2021) H2 and CO are detected, and the chemical equilibrium has been discussed to get insights into undermined magmatic/hydrothermal processes. It is also important to elucidate if the heat supply from the lava lake to volcanic gases is required for the oxidization after outgassing.
The high-speed lava flow (13.7–16.4 m/s at Masaya Volcano; Pering et al. (2019)) may be the key for the effective oxidization of the volcanic gas in the air. Similar atmospheric oxidations could take place at other volcanoes such as Ambrym, Vanuatu, which have a lava lake with a lava flow speed of 5 m/s (Radebaugh et al., 2016) or volcanoes where the H2 of the volcanic plume is under the detection limit such as Villarica, Chile (Sawyer et al., 2011; Moussallam et al., 2016).
In this study, we argue that the possibility of the oxidization of the volcanic gases attributed to mixing with the air at a high temperature by a simple predominance examination in the system C-O-H-S (Figure 8). However, detailed conditions such as the temperature, mixing ratio of the air, and residence time required to oxidize the volcanic gases are difficult to quantify. One future direction could be given by a plume chemistry model to handle the reaction rates controlling the composition of the volcanic gases in the air (Roberts et al., 2019) combined with a physical model of atmospheric turbulence and heat supply for ash-free plumes. The details of the oxidization processes may need to be examined extensively, not only using volcanic plumes with detectable H2, but also those depleted in H2 such as our study site, Masaya Volcano.
Concluding Remarks
We conducted volcanic gas observations at Masaya Volcano, Nicaragua, in January 2018 with a lava lake present. H2S was under the detection limit and the observed H2/H2O was surprisingly low, with an RH value of less than −6. This low RH value is significantly lower than the expected RH value of −3 calculated from petrological insights (temperature and fO2). To explain this discrepancy, we proposed that the oxidization in air at a high temperature would play a role controlling the H2 fraction. These results suggest that H2 is oxidized by several percent mixing with the air to increase the fO2 value from the magmatic value (10−9) to the order of magnitude of 10−3.
One key feature of the lava lake in Masaya Volcano is a very rapid lava flow with speeds of 13.7–16.4 m/s (Pering et al., 2019). It is possible that this rapid lava flow encourages effective mixing with the air, oxidizing the volcanic gas. A kettle-like shape around the vent is considered so that the volcanic gases can be stagnated above the lava lake with the air and oxidize at a high temperature.
Martin et al. (2006) and Roberts et al. (2019) proposed the plume chemistry model to discuss the oxidization of volcanic components such as H2, CO, and H2S. At Masaya Volcano, the possibility of combustion of H2 has been argued by deMoor et al. (2013). Our results support their ideas. The observed volcanic gas composition, depleted in H2, is likely the result of masking by atmospheric oxidization processes, so the gas composition observed does not reflect the original magmatic H2.
On the other hand, the CO2/CO ratio of ca. 1,000 observed in 2018 is consistent with the magmatic value with an equilibrium temperature of 1000°C. This implies that CO is not likely to be lost by the oxidization in the air. This hypothesis is consistent with the insight from the simulation results of Roberts et al. (2019) that pointed out that CO is kinetically less reactive comparing to H2.
Our results show that care must be taken to consider the effect of oxidization in the air, especially when quantifying the composition of high-temperature volcanic gases, when measuring the resulting mixture of volcanic gases and ambient air (e.g., Multi-GAS and FTIR). Lava lakes might traditionally be thought of as unlikely to be affected by secondary alterations such as hydrothermal processes. However, we show that even gas compositions emitted from lava lakes could be superimposed by atmospheric oxidation. Such gases therefore do not necessarily preserve magmatic information. At Masaya Volcano, the results from physical observations (i.e., the speed of lava flow and structure of the upper space above the lava lake) complement the puzzling volcanic gas composition observed to elucidate the processes of oxidization. Multi-disciplinary assessments and model calculations are crucial in solving these puzzles, especially in the interpretation of the complex datasets.
Data Availability Statement
The original contributions presented in the study are included in the article/Supplementary Material; further inquiries can be directed to the corresponding author.
Author Contributions
RK drafted the manuscript. RK, MV, BE, and MI collected the data in the field and analyzed them. MB and HS analyzed the volcanic gas data. All authors read and approved the final manuscript.
Conflict of Interest
The authors declare that the research was conducted in the absence of any commercial or financial relationships that could be construed as a potential conflict of interest.
Publisher’s Note
All claims expressed in this article are solely those of the authors and do not necessarily represent those of their affiliated organizations, or those of the publisher, the editors, and the reviewers. Any product that may be evaluated in this article, or claim that may be made by its manufacturer, is not guaranteed or endorsed by the publisher.
Acknowledgments
The authors would like to thank the staff of INETER, whose invaluable help and expertise made our fieldwork possible. RK thanks Marco Liuzzo and other INGV staff for their help in calibrating the Multi-GAS instrument. MV and BE acknowledge the support of the Natural Environment Research Council (NERC) EAO Doctoral Training Partnership (grant number NE/L002469/1). RK acknowledges Tjarda Roberts, Peter Kelly, and Valerio Acocella for their thoughtful reviews and comments, improving the manuscript.
Supplementary Material
The Supplementary Material for this article can be found online at: https://www.frontiersin.org/articles/10.3389/feart.2022.867562/full#supplementary-material
References
Aiuppa, A., de Moor, J. M., Arellano, S., Coppola, D., Francofonte, V., Galle, B., et al. (2018). Tracking Formation of a Lava Lake from Ground and Space: Masaya Volcano (Nicaragua), 2014-2017. Geochem. Geophys. Geosyst. 19, 496–515. doi:10.1002/2017gc007227
Aiuppa, A., Federico, C., Giudice, G., and Gurrieri, S. (2005). Chemical mapping of a fumarolic field: la Fossa Crater, Vulcano Island (Aeolian Islands, Italy). Geophys. Res. Lett. 32, L13309. doi:10.1029/2005gl023207
Aiuppa, A., Shinohara, H., Tamburello, G., Giudice, G., Liuzzo, M., and Moretti, R. (2011). Hydrogen in the Gas Plume of an Open-Vent Volcano, Mount Etna, Italy. J. Geophys. Res. 116, B10204. doi:10.1029/2011JB008461
Burton, M. R., Oppenheimer, C., Horrocks, L. A., and Francis, P. W. (2000). Remote Sensing of CO2 and H2O Emission Rates from Masaya Volcano, Nicaragua. Nicar. Geol. 28 (10), 915–918. doi:10.1130/0091-7613(2000)028<0915:rsocah>2.3.co;2
Cruikshank, D. P., Morrison, D., and Lennon, K. (1973). Volcanic Gases: Hydrogen Burning at Kilauea Volcano, Hawaii. Science 1824109, 277–279. doi:10.1126/science.182.4109.277
de Moor, J. M., Fischer, T. P., Sharp, Z. D., King, P. L., Wilke, M., Botcharnikov, R. E., et al. (2013). Sulfur Degassing at Erta Ale (Ethiopia) and Masaya (Nicaragua) Volcanoes: Implications for Degassing Processes and Oxygen Fugacities of Basaltic Systems. Geochem. Geophys. Geosyst. 14, 4076–4108. doi:10.1002/ggge.20255
Gerlach, T. M. (2004). Volcanic Sources of Tropospheric Ozone Depleting Trace Gases. Geochem. Geophys. Geosyst. 5, Q09007. doi:10.1029/2004gc000747
Giggenbach, W. F. (1996). “Chemical Composition of Volcanic Gases,” in Monitoring and Mitigation of Volcanic Hazards. Editors R. Scarpa, and R. I. Tilling (Berlin: Springer), 221–256. doi:10.1007/978-3-642-80087-0_7
Giggenbach, W. F. (1987). Redox Processes Governing the Chemistry of Fumarolic Gas Discharges from White Island, New Zealand. Appl. Geochem. 2, 143–161. doi:10.1016/0883-2927(87)90030-8
Henley, R. W., and Fischer, T. P. (2021). Sulfur Sequestration and Redox Equilibria in Volcanic Gases. J. Volcanol. Geotherm. Res. 414, 107181. doi:10.1016/j.jvolgeores.2021.107181
INETER (2021). Boletín mensual Sismos y Volcanes de Nicaragua Mayo, 2021, Dirección General de Geología y Geofísica. Available at: https://webserver2.ineter.gob.ni/boletin/2021/05/boletin-0521.pdf.
Kazahaya, R., Shinohara, H., Ohminato, T., and Kaneko, T. (2019). Airborne Measurements of Volcanic Gas Composition during Unrest at Kuchinoerabujima Volcano, Japan. Bull. Volcanol. 81, 7. doi:10.1007/s00445-018-1262-9
Martin, R. S., Mather, T. A., and Pyle, D. M. (2006). High‐temperature Mixtures of Magmatic and Atmospheric Gases. Geochem. Geophys. Geosyst. 7, 4. doi:10.1029/2005GC001186
Martin, R. S., Sawyer, G. M., Spampinato, L., Salerno, G. G., Ramirez, C., Ilyinskaya, E., et al. (2010). A Total Volatile Inventory for Masaya Volcano, Nicaragua. J. Geophys. Res. 115, B09215. doi:10.1029/2010jb007480
Moussallam, Y., Bani, P., Curtis, A., Barnie, T., Moussallam, M., Peters, N., et al. (2016). Sustaining Persistent Lava Lakes: Observations from High-Resolution Gas Measurements at Villarrica Volcano, Chile. Earth Planet. Sci. Lett. 454, 237–247. doi:10.1016/j.epsl.2016.09.012
Moussallam, Y., Oppenheimer, C., Aiuppa, A., Giudice, G., Moussallam, M., and Kyle, P. (2012). Hydrogen Emissions from Erebus Volcano, Antarctica. Bull. Volcanol. 74, 2109–2120. doi:10.1007/s00445-012-0649-2
Ohba, T., Hirabayashi, J.-i., and Yoshida, M. (1994). Equilibrium Temperature and Redox State of Volcanic Gas at Unzen Volcano, Japan. J. Volcanol. Geotherm. Res. 60, 263–272. doi:10.1016/0377-0273(94)90055-8
Oppenheimer, C., Francis, P., Burton, M., Maciejewski, A. J. H., and Boardman, L. (1998). Remote Measurement of Volcanic Gases by Fourier Transform Infrared Spectroscopy. Appl. Phys. B Lasers Opt. 67, 505–515. doi:10.1007/s003400050536
Oppenheimer, C., Scaillet, B., Woods, A., Sutton, A. J., Elias, T., and Moussallam, Y. (2018). Influence of Eruptive Style on Volcanic Gas Emission Chemistry and Temperature. Nat. Geosci. 11, 678–681. doi:10.1038/s41561-018-0194-5
Pering, T. D., Wilkes, T. C., England, R. A., Silcock, S. R., Stanger, L. R., Willmott, J. R., et al. (2019). A Rapidly Convecting Lava Lake at Masaya Volcano, Nicaragua. Front. Earth Sci. 6, 241. doi:10.3389/feart.2018.00241
Peters, N., Oppenheimer, C., Kyle, P., and Kingsbury, N. 2014 Decadal Persistence of Cycles in Lava Lake Motion at Erebus Volcano, Antarctica. Earth Planet. Sci. Lett. 395, 1. doi:10.1016/j.epsl.2014.03.032
Radebaugh, J., Lopes, R. M., Howell, R. R., Lorenz, R. D., and Turtle, E. P. (2016). Eruptive Behavior of the Marum/Mbwelesu Lava Lake, Vanuatu and Comparisons with Lava Lakes on Earth and Io. J. Volcanol. Geotherm. Res. 322, 105–118. doi:10.1016/j.jvolgeores.2016.03.019
Roberts, T., Dayma, G., and Oppenheimer, C. (2019). Reaction Rates Control High-Temperature Chemistry of Volcanic Gases in Air. Front. Earth Sci. 7, 154. doi:10.3389/feart.2019.00154
Rothman, L. S., et al. (2008). The HITRAN 2008 Molecular Spectroscopic Database. J. Quint. Spectrosc. Ra. 110, 533. doi:10.1016/j.jqsrt.2009.02.013
Sawyer, G. M., Salerno, G. G., Le Blond, J. S., Martin, R. S., Spampinato, L., Roberts, T. J., et al. (2011). Gas and Aerosol Emissions from Villarrica Volcano, Chile. J. Volcanol. Geotherm. Res. 203, 62–75. doi:10.1016/j.jvolgeores.2011.04.003
Shinohara, H. (2005). A New Technique to Estimate Volcanic Gas Composition: Plume Measurements with a Portable Multi-Sensor System. J. Volcanol. Geotherm. Res. 143, 319–333. doi:10.1016/j.jvolgeores.2004.12.004
Shinohara, H., and Witter, J. B. (2005). Volcanic Gases Emitted during Mild Strombolian Activity of Villarrica Volcano, Chile. Geophys. Res. Lett. 32, L20308. doi:10.1029/2005gl024131
Shinohara, H., Yokoo, A., and Kazahaya, R. (2018). Variation of Volcanic Gas Composition during the Eruptive Period in 2014-2015 at Nakadake Crater, Aso Volcano, Japan. Earth Planets Space 70, 151. doi:10.1186/s40623-018-0919-0
Shinohara, H., Matsushima, N., Kazahaya, K., and Ohwada, M. (2011). Magma-hydrothermal System Interaction Inferred from Volcanic Gas Measurements Obtained during 2003-2008 at Meakandake Volcano, Hokkaido, Japan. Bull. Volcanol. 73, 409–421. doi:10.1007/s00445-011-0463-2
Symonds, B. R., Rose, W. I., Bluth, G. J. S., and Gerlach, T. M. (1994). “Volatiles in Magmas,” in. Volatiles in Magmas. Editors M. R. Carroll, Mineralogical Society of America, 30. 1–66. doi:10.1515/9781501509674
Tamburello, G. (2015). Ratiocalc: Software for Processing Data from Multicomponent Volcanic Gas Analyzers. Comput. Geosciences 82, 63–67. doi:10.1016/j.cageo.2015.05.004
Keywords: volcanic gas composition, Fourier transform infrared spectroscopy, Multi-GAS, plume chemistry, masaya volcano (Nicaragua)
Citation: Kazahaya R, Varnam M, Esse B, Burton M, Shinohara H and Ibarra M (2022) Behaviors of Redox-Sensitive Components in the Volcanic Plume at Masaya Volcano, Nicaragua: H2 Oxidation and CO Preservation in Air. Front. Earth Sci. 10:867562. doi: 10.3389/feart.2022.867562
Received: 01 February 2022; Accepted: 14 June 2022;
Published: 14 July 2022.
Edited by:
Yosuke Aoki, The University of Tokyo, JapanReviewed by:
Tjarda Roberts, UMR7328 Laboratoire de physique et chimie de l'environnement et de l'Espace (LPC2E), FrancePeter Kelly, United States Geological Survey (USGS), United States
Copyright © 2022 Kazahaya, Varnam, Esse, Burton, Shinohara and Ibarra. This is an open-access article distributed under the terms of the Creative Commons Attribution License (CC BY). The use, distribution or reproduction in other forums is permitted, provided the original author(s) and the copyright owner(s) are credited and that the original publication in this journal is cited, in accordance with accepted academic practice. No use, distribution or reproduction is permitted which does not comply with these terms.
*Correspondence: Ryunosuke Kazahaya, dm9uLmthemFoYXlhQGFpc3QuZ28uanA=