- 1State Key Laboratory of Geomechanics and Geotechnical Engineering, Institute of Rock and Soil Mechanics, Chinese Academy of Sciences, Wuhan, China
- 2University of Chinese Academy of Sciences, Beijing, China
The Anqing Formation clay-gravel layer is widely distributed in the Anqing area of the upper reaches of the Wanjiang River. It is a typical soil-rock mixture composed of gravel and clay. The poor engineering properties of the clay-gravel layer are the main factors for the failure of the slope. On the basis of regional geological survey, the clay-gravel threshold, clay mineral composition and cementation characteristics of clay-gravel layer were studied. The in-situ horizontal push-shear tests under different gravel content, water environment and overlying load were designed and carried out, and its shear failure mode and strength were analyzed. The study found that the shear zone was in the shape of a broken line and was controlled by the particle size and distribution of the gravel. The shear strength of the clay-gravel layer is relatively high in the natural state due to the structure of the gravel and the friction and cementation force between the clay and the gravel. Water had the greatest influence on the shear strength of the clay-gravel layer, and the overlying load affected its shear strength within a certain range. The indoor rainfall erosion model test of the clay-gravel slope was carried out, and the failure and instability modes and mechanisms of the slope with different gravel contents were studied. When the gravel content was 30%, the failure of the slope surface was the development of gullies. The erosion damage process was similar to the soil slope. When the gravel content was 50%, affected by the distribution of gravel, the slope failure was manifested as the development of erosion pits, followed by local slumps, and finally the overall sliding in layers. When the gravel content was 70%, the clay particles on the slope were quickly washed away by the water flow, and the gravel skeleton of the slope formed a temporary relatively stable structure. After being disturbed, the gravel layer collapsed as a whole.
Introduction
The unique diagenetic environment in the upper reaches of the Wanjiang River, coupled with the special topographical features and tectonic environment, determine the unique engineering attributes of the strata in this area. The Anqing Formation clay-gravel layer is widely distributed in the Anqing section along the upper reaches of the Wanjiang River. It is a set of Neogene to Early Pleistocene clay and gravel alluvial strata. It is composed of gravel as aggregate and clay as filler, which is a special river alluvial soil-rock mixture. Soil-rock mixture is a heterogeneous, discontinuous, complex and irregular geological body (You and Tang, 2002; Hu et al., 2020). The engineering geological characteristics and mechanical properties of soil-rock mixtures of different regions, origins and types are quite different (Jin et al., 2017; Xia et al., 2017). The poor engineering properties of the Anqing Formation clay-gravel layer are the main factors that cause the instability and failure of engineering structures, and determine the instability deformation mechanism and failure mode of the slope to a large extent.
Many researchers have carried out a series of experimental and numerical simulation studies around the soil-rock mixture. Tang et al. (2018) used a large-scale single-shear tester to study the effect of rock content on the shear characteristics of soil-rock mixtures. Tao et al. (2019) studied the mechanical properties of soil-rock mixture under different rock content, water content and rock integrity through large-scale triaxial shear tests, and used Duncan-Zhang model to invert the parameters of the triaxial test. Chen et al. (2020) used the particle discrete element method to establish a mesoscopic model of particle flow in a soil-rock mixed slope, and discussed the influence of the mesoscopic structure on the development of the slip surface and the stability of the slope. However, the environment and stress conditions of the samples in the above studies are very different from those in the field, and it is difficult to reflect a more realistic deformation mechanism, strength characteristics and failure mode. Wang et al. (2016) studied the horizontal push-shear test of soil-rock mixed-fill foundation under different water environments, and concluded that saturated water immersion has a great influence on the shear surface, shear strength and push-shear deformation process. Xu and Hu (2008) carried out cyclic loading and unloading tests using a large-scale field horizontal shear tester, and achieved some meaningful results in deepening the study of soil-rock mixture and the deformation and failure mechanism of soil-rock mixture slopes. These studies have made some important progress in the strength characteristics and failure modes of soil-rock mixtures by carrying out in-situ tests, but the designed single-factor tests are difficult to fully reflect the engineering properties of soil-rock mixtures under the influence of complex on-site environments, and the engineering properties of soil-rock mixtures of different origins and types are significantly different. In the Anqing Formation clay-gravel layer, the gravel content is high, the gravel surface is smooth, the roundness is high, and the super-sized gravel content is small, which is relatively uniform on the whole. The matrix of the clay-gravel layer is mostly clay, and there is a certain bonding force between the clay and the gravel. In the natural state, the stratum can maintain a certain strength and has a high stability, but when it is disturbed or the environmental conditions change, the bonding ability is significantly reduced., and the engineering stability will also be greatly affected (Nie et al., 2012; Qian et al., 2017).
Under rainfall conditions, the Anqing Formation clay-gravel layer slope undergoes various degrees of erosion damage, which in turn leads to slope instability and landslides. At present, researchers have carried out many studies on geotechnical erosion, including the influence of rainfall intensity and slope on slope rill development and rill characteristics (De Vente and Poesen, 2005; Govers et al., 2007), the complexity of rill network development (Bryan and Rockwell, 1998; Mancilla et al., 2005), as well as representative indicators of rill development, such as rill head extension time, average head erosion rate, etc. (Shen et al., 2019). In addition, the slope velocity is an important parameter reflecting the erosion process of slope rill under rainfall conditions (Zhao et al., 2018), which plays an important role in studying the dynamic mechanism of slope rill erosion (An et al., 2012). Song (2013) conducted an indoor simulated scour test on a loess slope in western Liaoning, and discussed the changes of slope displacement and moisture content during the failure process of the slope based on finite element and particle flow methods. Ren (2017) carried out scouring failure tests on the disperse soil slope in Jilin with different initial moisture content, salt content, compaction degree and slope, and found that the process of scouring and erosion damage of the disperse soil slope was divided into three stages. These research results lay the foundation for the study of the failure mechanism of the Anqing Formation clay-gravel layer slope.
In this paper, the poor engineering geological characteristics of the Anqing Formation clay-gravel layer were studied, and the in-situ horizontal shear tests of the clay-gravel layer under the combined action of different gravel content, water environment and overlying load were designed and carried out, and its shear failure mode and strength were analyzed. The effects of various factors, especially water and load, on the strength properties of the clay-gravel layer were explored. The indoor rainfall erosion model test of the clay-gravel slope was carried out, and the failure and instability modes and mechanisms of the slope with different gravel contents were studied. The research can provide a theoretical basis for the protection and treatment of clay-gravel layer slopes.
Materials
Distribution Area and Geological Characteristics
The Anqing Formation clay-gravel layers from Neogene to Quaternary Early Pleistocene are mainly distributed along the Anqing area of the Yangtze River, and are mostly located on the highest terraces (mostly on the upper part of the base terraces), that is, the fourth-order terrace, and some are exposed in the third-order or the second-order terrace. The stratum is of river alluvial type, mainly including Anqing gravel layer and Wangjiang gravel layer. It is yellow and grayish-yellow, with a layer thickness of 10–20 m, and the main lithology is sand and gravel layer sandwiched with clay. The gravel diameter is 2–7 cm, the gravel content is 55–75%, the roundness is mainly sub-circular, and the sorting performance is average. The gravel composition is mainly quartz gravel, followed by quartz sandstone gravel, siliceous gravel, jade flint and limestone. The in-situ test and sampling site is located in Wangjiang County, west of the urban area of Anqing City, which is a diverse natural ecological environment and hilly area in the Yangtze River Basin. The distribution area and typical section of the clay-gravel layer are shown in Figure 1. The natural density of the clay-gravel layer is 1.87–2.11 g/cm3, the permeability coefficient is 5 × 10⁻⁵–2×10⁻⁴ cm/s, the natural moisture content of the clay is 12.59%, the plastic limit is 24.3%, and the liquid limit is 47.4%.
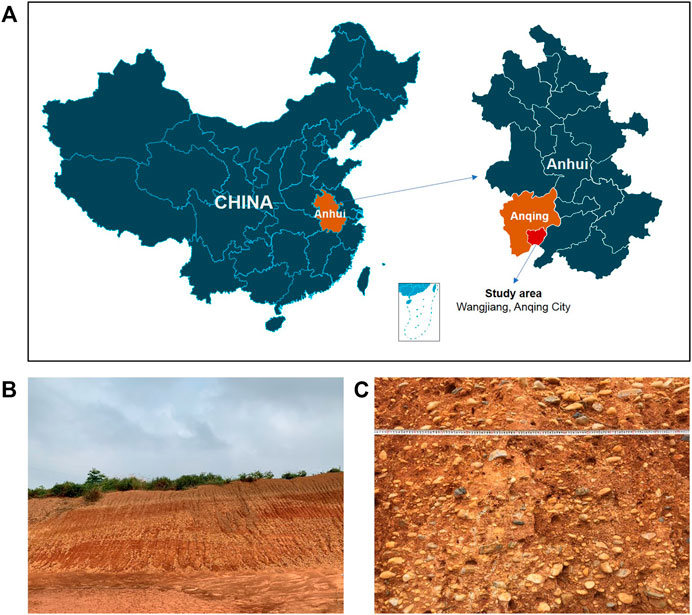
FIGURE 1. Distribution area and typical profile of Anqing Formation clay-gravel layer (A) distribution area (B) slope (C) typical profile.
Clay-Gravel Threshold
The clay-gravel layer is composed of gravel and clay with different particle sizes. When carrying out model tests and field tests related to the content of gravel, the clay-gravel threshold should be determined first, that is, a characteristic particle size should be determined, larger than which is gravel, and smaller is clay. Medley (2001) believed that in different research scales, the particle size distribution of soil-rock mixture satisfies self-similarity, and proposed a conceptual model of soil-rock threshold and rock content. The clay-gravel threshold is obtained by fractal geometry. The fractal structure equation of particle mass distribution is as follows (Mandelbrot 1977; Wang and Li, 2015).
Here,
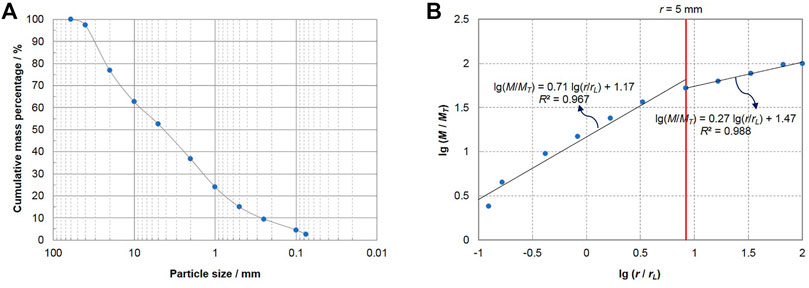
FIGURE 2. Clay-gravel particle size fractal and clay-gravel threshold (A) particle size distribution curve (B) clay-gravel threshold.
Composition of Clay Minerals
The clay and gravel in the clay-gravel layer were physically separated, and the separated clay was prepared into oriented sheets for XRD experiments. The illite/montmorillonite (I/S) mixed-layer ratio of the samples was tested using EG flakes treated with ethylene glycol (Zhu 1995). The test results show that the main clay minerals in the clay-gravel layer are kaolinite, illite and I/S mixed-layer. The average content of clay minerals in the clay of the clay-gravel layer is 29%, of which illite accounts for 3.99%, kaolinite accounts for 13.86%, I/S mixed-layer accounts for 11.16%, and the I/S mixed-layer ratio is 55.06%.
Clay and Gravel Cementation
Common cements formed by precipitation during freshwater diagenesis are divided into vadose zone fabrics and subcurrent zone fabrics. In the osmotic layer, due to the local contact of the particles with water, suspended microdroplet cements are generally formed on the underside of the particles; while in the subsurface layer, due to complete saturation, the distribution of the cements is relatively uniform (Qian et al., 2017).
For the cement in the clay-gravel layer, the white crystals on the interface between gravel and clay are the evaporation barriers formed by the concentration of chemical elements in the soil (Jones et al., 1984). The fissures between clay and gravel form dominant seepage channels. As the groundwater seeps down the pores, the salts are gradually concentrated and deposited on the surface of the gravel. This type of cementation is soil-rock interface cementation, and its cementing force is mainly affected by rainfall, permeability and continuous exposure time of the slope. Cementation increases the strength of the clay-gravel layer to a certain extent.
Strength Characteristics of Anqing Formation Clay-Gravel Layer
In-Situ Horizontal Push-Shear Test
In order to study the effects of different gravel content, water environment and overburden load on the mechanical properties of the clay-gravel layer, the following six sets of in-situ horizontal push-shear tests were designed and carried out (Figure 3). The water environment mainly included normal state and saturated state. Tests with no overburden load under normal and saturated conditions were carried out in the site with low gravel content, and the gravel content was 57%. In the site with high gravel content, the gravel content was 69%, tests with no overburden load under normal and saturated conditions, and tests with overburden loads of 10 and 20 kPa under saturated conditions were carried out respectively (Table 1). The field test device is shown in Figure 3A. During the test, the horizontal force was applied through the jack. When the pressure gauge showed the maximum reading and fell back to a stable low value, the maximum reading of the pressure gauge at this time was the initial loading horizontal force P1. Then, released the jack valve and continued to apply the horizontal force to the sample in the same way until the pressure gauge showed the maximum reading again, then the peak shear force at this time was the reloading horizontal force P2. The test could be stopped when P1 and P2 were obtained.
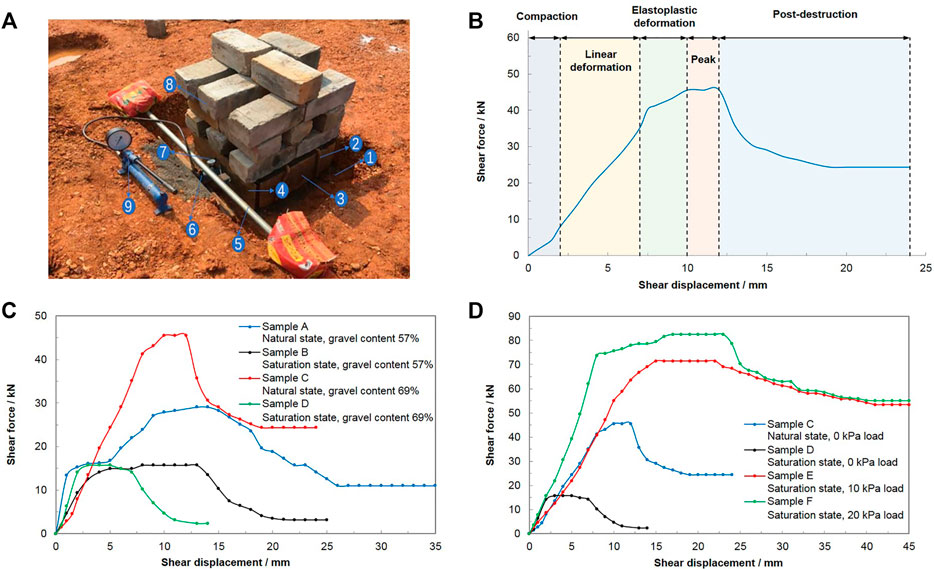
FIGURE 3. In-situ horizontal push-shear test (A) test device (1-Test pit, 2-Steel drill, 3-Limit steel plate, 4-Thrust steel plate, 5-Reference beam, 6-Horizontal loading jack, 7-Dial indicator, 8-Load, 9-Pressure pump) (B) stages of a typical curve (C) the curves under different gravel contents and water environments (D) the curves under different water environments and overlying loads.
Shear Force-Shear Displacement Curve
The typical shear force-shear displacement curve of the clay-gravel layer under different water environments and external loads is shown in Figure 3B. The curve is basically divided into five stages. 1) Compaction. With the increase of the shear force, the shear displacement increases rapidly, but the increment of the shear displacement is small. This is due to the closure of fissures in the specimen. 2) Linear deformation. The curve is approximately a straight line, and the deformation of the specimen increases linearly with the increase of the shear force. 3) Elastoplastic deformation. The curve shows a nonlinear relationship. With the increase of shear force, fissures appear in the specimen, and the fissures gradually expand. When the fissures encounter gravel during the expansion, local stress concentration occurs, and the strength of the clay-gravel layer is temporarily improved. 4) Peak. The shear force fluctuates in a small range, while the increase in the shear displacement is relatively large. The stress concentration effect formed by inter-gravel occlusion and extrusion and the stress release effect formed by inter-gravel dislocation and sliding are dynamically adjusted to achieve a relatively balanced state. 5) Post-destruction. With the increase of shear displacement, the shear force gradually decreases and tends to be stable, reaching the residual shear force.
Figure 3C shows the shear force-shear displacement curves of the clay-gravel layer under different gravel contents and different water environments. When the gravel content is 57%, the peak shear force in the natural state is only 29.05 kN, and the peak shear force in the saturated state is 45.9% lower than that in the natural state. When the gravel content is 69%, the peak shear force in the natural state is 45.53 kN, and the peak shear force in the saturated state is 65.5% lower than that in the natural state. With the increase of gravel content, the gravel skeleton effect in the clay-gravel layer is more obvious, the elastic modulus and strength are also larger, and the shear force peak value in natural state is larger. In the saturated state, due to water infiltration, lubrication and chemical interaction with cement, water fills the pores, the pore water pressure increases, the effective stress decreases, and the skeleton of the gravel is destroyed, resulting in structural damage. At the same time, the carbonate and aluminosilicate in the cement are slightly soluble in water, resulting in partial loss of the bonding force between the gravel and the clay. Therefore, the peak shear force in the saturated state is significantly lower than that in the natural state. Due to structural and cementitious failures, the peak shear force at saturation is less affected by the gravel content.
Figure 3D shows the shear force-shear displacement curves of the clay-gravel layer under different water environments and overlying loads. The peak shear force of sample C is 65.5% lower than that of sample D, the peak shear force of sample E is 56.9% higher than that of sample D, and the peak shear force of sample F is 81.0% higher than that of sample D. Meanwhile, the residual shear force values of samples E, F are close. As the overlying load increases, the peak shear force at saturation increases significantly, but the increase decreases gradually. Due to the overlying load, the sample is in a state of three-way compression, and its shear resistance is significantly improved. In the saturated state, the residual shear force when the overlying load is 10 and 20 kPa is approximately equal, indicating that only within a certain overlying load range, the residual shear force increases with the increase of the overlying load. The shear peak phase of the clay-gravel layer in the saturated state is longer than that in the normal state.
Shear Zone
The clay-gravel layer undergoes shear failure, and the shear zone (Figure 4A) is significantly different from the arc-shaped shear zone of the homogeneous soil. Figures 4B,C shows the comparison of shear zone morphology between homogeneous soil and clay-gravel layer. The shear zone of the clay-gravel layer is an irregular zigzag shape. The gravel on the sliding surface basically does not undergo shear failure, and the shear zone extends along the clay matrix. When encountering gravel, it expands along the edge of the gravel, that is, the clay-gravel interface, and passes around the gravel. Because the clay-gravel layer is not a continuous and isotropic medium, the elastic modulus and shear strength of gravel are much larger than those of clay, and there are primary fissures at the interface between the two. When sheared, stress concentration occurs at the interface, the fissures further expand, and further expand to the weak point to form a sliding surface.
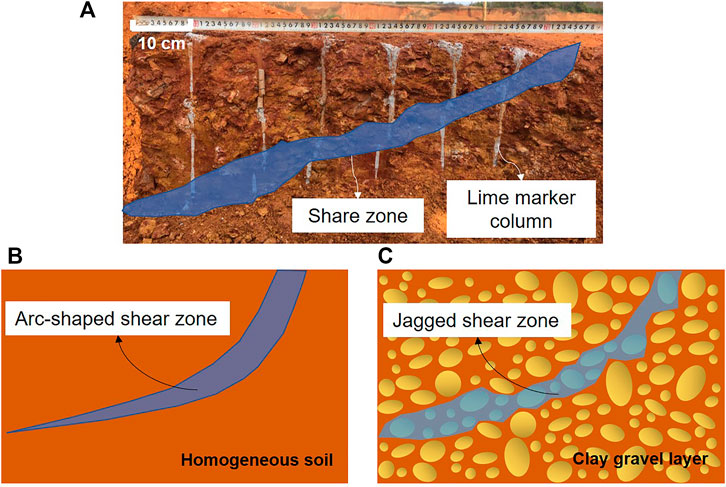
FIGURE 4. Shear zone (A) excavation profile of typical shear zone (B) homogeneous soil (C) clay-gravel layer.
Figure 5 shows the actual 2D shape of the shear zone of the clay-gravel layer. According to the morphology of the shear zones of the samples C and D, the maximum thickness and area of the shear zones in the normal state are larger than those in the saturated state. Because the area of the shear zone is proportional to the energy consumed in its formation. In the normal state, the elastic modulus and strength of the clay-gravel layer are larger than those in the saturated state, so the former absorbs more energy than the latter in the shearing process of the same size sample.
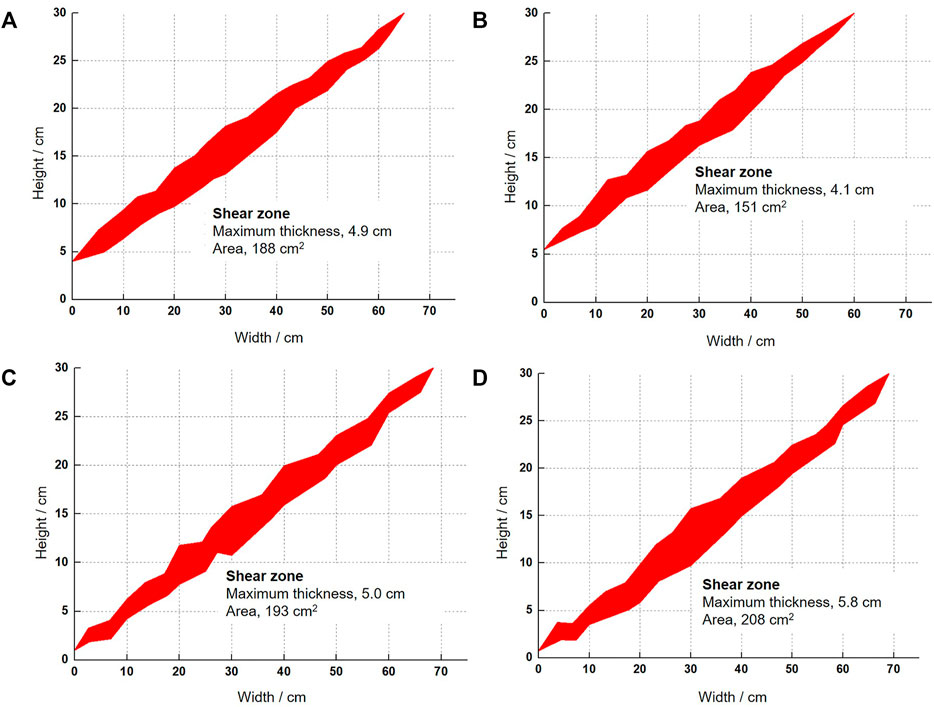
FIGURE 5. Two-dimensional shape of shear zone in clay gravel layer (A) Sample C (B) Sample D (C) Sample E (D) Sample F.
The shear zone generally develops along the weak surface in the clay-gravel layer. Compared with the gravel and clay, the interface between the gravel and the clay has lower strength and is a potential weak surface. During shearing, stress concentration occurs at the interface between gravel and clay, which then breaks and gradually penetrates to develop into a shear plane. Theoretically, the depth of the initial shear plane should be the height of the sample, but the test results show that due to the uneven spatial distribution of gravel, there may be a concentrated gravel layer at the bottom of the sample, which makes it difficult for the shear plane to start forming here. Therefore, the depth of the initial shear plane is related to the spatial distribution of the gravel. Compared with sample C, sample D is saturated, water seeps into the fissures, the pore water pressure in the soil increases, and the initial fissures expand further. Due to the lubrication of water, the occlusal force between the clay-gravel layers is reduced, thereby reducing its overall strength, resulting in more local potential slip zones in the interior of sample D. The initial shear plane depth of the shear zone of sample D is shallow, the width is small, and the sliding body range is small.
Through the comparison of samples D, E, and F, it is found that with the increase of the overlying load of the sample, the initial depth of the shear zone deepens, and the overall width also increases. The maximum thickness and area of the shear zone increases with the overburden load. Since the vertical displacement of the surface is constrained with the increase of the overlying load, the shear zone is not easy to develop to the original spaced surface and cut out, so the width of the shear zone becomes larger. Likewise, the sample is under three-way compression, and the shear zone extends deeper. Affected by the increase of the overlying load, the extent of the shear zone increases, and its formation consumes more energy.
Shear Strength
Considering different water environments and overlying loads, a study was carried out on the calculation method of the shear strength of the clay-gravel layer (Xu et al., 2006; Xu et al., 2007), and it was concluded that
When the sample is in a saturated state, the influence of water pressure should be considered in the calculation. Add the water pressure term to Equation 3
When the sample is in a saturated state and under the action of the overlying load, the influence of the water pressure and the overlying load should be considered in the calculation. Add the water pressure term and the overlying load term to Equation 3
Here, P1 represents the initial loading horizontal force (kN), P2 represents the reloading horizontal force (kN), B represents the width of the sample (m), Li represents the line length of the ith block on the slip surface (m), G represents the gravity of the sliding body (kN), αi represents the angle between the slip surface at the ith block and the horizontal plane (°), gi represents the gravity of the ith block (kN), hi represents the centerline height of the ith block (m), γ represents the natural weight of the sample (kN/m3), Wi represents the water pressure at the sliding surface of the ith block (kN), γm represents the water weight (kN/m3), Fi represents the overlying load applied to the ith block.
The shear strength results of the clay-gravel layer are shown in Table 2.
In the natural state, the strength of the clay-gravel layer is relatively large, which is due to the gradual compaction during the long-term deposition process and fewer primary fissures. In addition, there is a certain cementation effect between clay and gravel, and its shear failure needs to overcome a larger cementation force than the general soil-rock mixture. At the same time, the gravel content is relatively high, and the spatial distribution has a certain sequence, resulting in a relatively significant skeleton effect. After the clay is filled, a relatively dense structure is formed. With the increase of the gravel content, the skeleton effect of the gravel is more obvious. A denser structure is formed, and its strength is improved within a certain range (Li et al., 2007).
The shear strength of the clay-gravel layer decreases significantly in the saturated state. The main reasons are, 1) When saturated, the initial micro-cracks of the clay-gravel layer are filled with free water, and the pore water pressure increases, resulting in further expansion of the micro-cracks. 2) Due to the lubrication of water, particles of different particle sizes rub against each other, and the occlusal effect becomes weak. 3) Natural rainwater is often weakly acidic, and the cement will be slightly soluble in water, and the cementing force will be reduced.
Figure 6 shows the relationship between shear strength and influencing factors. It can be seen that with the application of the overlying load, c and φ increase significantly, but the increasing range gradually decreases and tends to be stable. c and φ of samples C and F are almost equal. The overlying load has the effect of compaction, which not only improves the compactness of the clay-gravel layer, but also makes the occlusion between the clay and the gravel more closely, and the normal stress on the interface between the clay and the gravel increases, which improves the shear strength. In addition, in the process of shear failure, it is necessary to overcome the gravitational work and restraint of the overlying load, so the horizontal shear force is larger than that without the overlying load, which leads to an increase in the shear strength under the overlying load condition. Compared with the two-dimensional compression state of the sample without the overlying load, the sample with the overlying load is in the three-dimensional compression state, and it is more difficult for shear failure to occur under the three-dimensional compression condition. Therefore, water has a great influence on the clay-gravel layer. When it is saturated, the strength drops sharply, and the load and strength are only positively correlated within a certain range. Beyond this range, the strength of the clay-gravel layer increases with the increase of the load is not obvious.
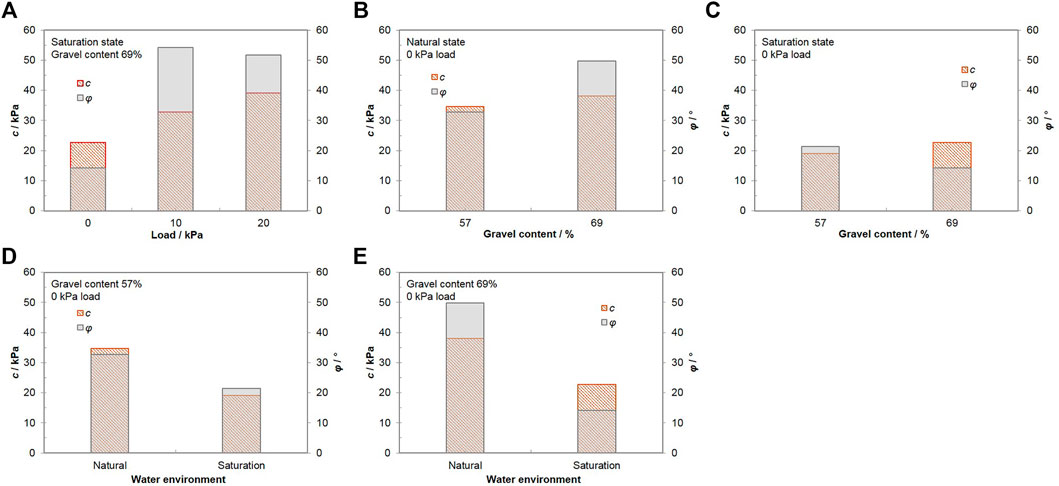
FIGURE 6. The relationship between shear strength and influencing factors (A) relationship with load (B) relationship with gravel content in natural state (C) relationship with gravel content in saturation state (D) relationship with water environment at low gravel content (E) relationship with water environment at high gravel content.
Evolution Law and Mechanism of Slope Erosion Damage
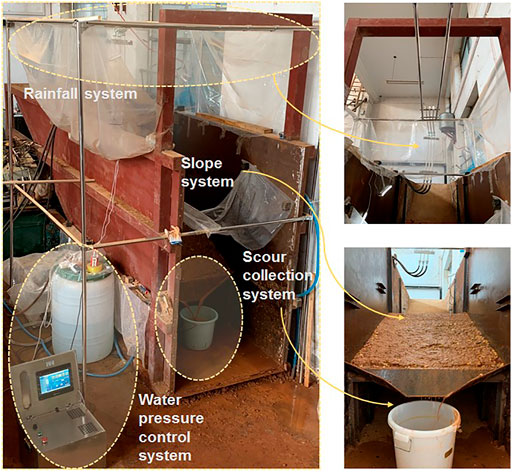
In order to study the evolution law of erosion damage of clay-gravel layer slopes, laboratory model tests of artificial rainfall erosion of slopes with different gravel contents were carried out. The gravel content in the test is 30, 50, and 70%, respectively. Before filling, a suitable sieve was selected to screen the clay-gravel layer to separate the clay and gravel according to the clay-gravel threshold. Then, according to the gravel content set in the test, after weighing and artificially proportioning, a certain quality of clay and gravel were mixed well. Finally, the mixed clay-gravel layer was filled into the model box. The test device is shown in Figure 7. Model test device includes the rainfall system, slope system, water pressure control system, camera system and scour collection system. In the test, the width of the slope was 1.0 m, the length was 1.5 m, the slope ratio was 1:1.5, and the rainfall intensity is 140 mm/h.
Evolution Law of Erosion Damage of Slope (Gravel Content 30%)
For the slope with a gravel content of 30%, the failure of the slope surface was the development of gullies (Figure 8). The erosion damage process was similar to the general soil slope, which was divided into three stages, 1) Sputter and sheet erosion, 2) Rill erosion, 3) Gully cutting and collapse damage.
1) Sputter and sheet erosion
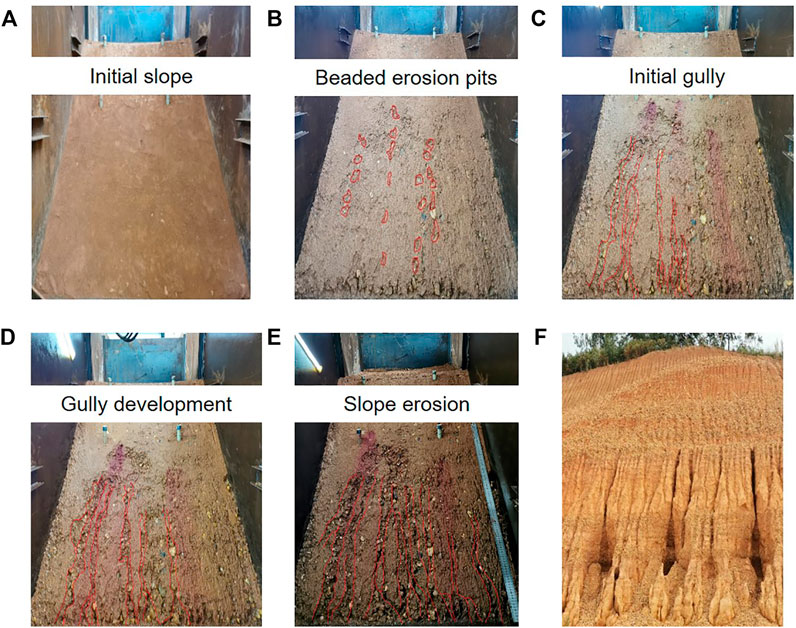
FIGURE 8. Evolution law of erosion damage of the test slope (gravel content 30%). (A) Initial slope (B) erosion pits (C) gully (D) gully development (E) slope erosion (F) actual slope failure.
In the early stage of rainfall, only very shallow groove marks appeared on the slope. Due to the low initial moisture content of the slope, the pores between soil particles were filled with air. The soil particles on the surface of the slope were relatively loose, and the kinetic energy of raindrops made the soil particles disperse, crack and splash. As the rainfall progressed, the moisture content of the topsoil increased rapidly, the pores between the particles were filled with water, the cohesion decreased, and the impact force of the raindrops fell, the surface layer of the slope appeared honeycomb-like, and this stage was called sputter erosion. After sputter erosion, the soil structure on the surface was destroyed and the pores were blocked. Since the rainfall intensity was much greater than the infiltration intensity, runoff was formed on the slope. Smaller particles in the slope surface were suspended and taken away. This process was called sheet erosion, and rills appeared on the slope surface.
2) Rill erosion
As the rainfall continued, the erosion and scour capacity of the runoff was further enhanced. If the erosion resistance of the soil particles on the slope was less than the scour force of the runoff, the downward shear force of the runoff would wash away the soil particles, forming bead-shaped erosion pits on the slope (Figure 8B). The density of the erosion pits from the top of the slope to the bottom of the slope increased sequentially. Due to the infiltration of rainwater, the strength of the slope decreased, and the erosion pit gradually deepened and widened, forming trace erosion, extending to the foot of the slope to form the head of the rill (Figure 8C). The impact of the runoff was not strong enough for the gravel to slide off. So, gravel blocked runoff, redirected it, and complicated rill erosion. Part of the gravel was embedded on the inner wall of the rill, which absorbed the energy of the runoff, and the soil particles around the gravel were more easily washed away by the runoff. The gravel fell into the rill, and erosion pits were formed on the walls of the rill, and the width of the rill was expanded (Figure 8D). The obstruction of gravel caused the diversion or branching of the rill, which made the shape of the rill more complex and the network of rill denser (Figure 8E).
3) Gully cutting and collapse damage
Next, the erosion method was transformed from rill erosion to cut ditch erosion, and the slope surface was transformed from planar erosion to linear erosion. The runoff collected at the lower part of the slope, which had a strong erosive force, and cut down both sides of the rill violently, causing local instability at the toe of the slope. Soil particles were washed away by water and gravel built up. Figure 8F shows the landslide with less gravel content, which was consistent with the test results.
Figure 9 shows the evolution process of slope scour failure. During the runoff flowing through the slope, the down-shear force of the runoff was greater than the erosion resistance of the soil on the slope. The local soil on the slope was washed away in an unstable state, and erosion pits were formed there, and the erosion pits were beaded on the slope (Figure 9B). The erosion pits developed towards the top of the slope, forming trace erosion, and extending to the bottom of the slope to form rill head. With the progress of rainfall, the erosion pits were gradually connected to form rills (Figure 9C). The rills developed continuously, and the rills merged with each other to form a network of gullies. The width and depth of the gullies at the bottom of the slope were larger than those at the top (Figure 9D). Rainwater further scoured and infiltrated deep into the slope, and the stability of the slope was affected.
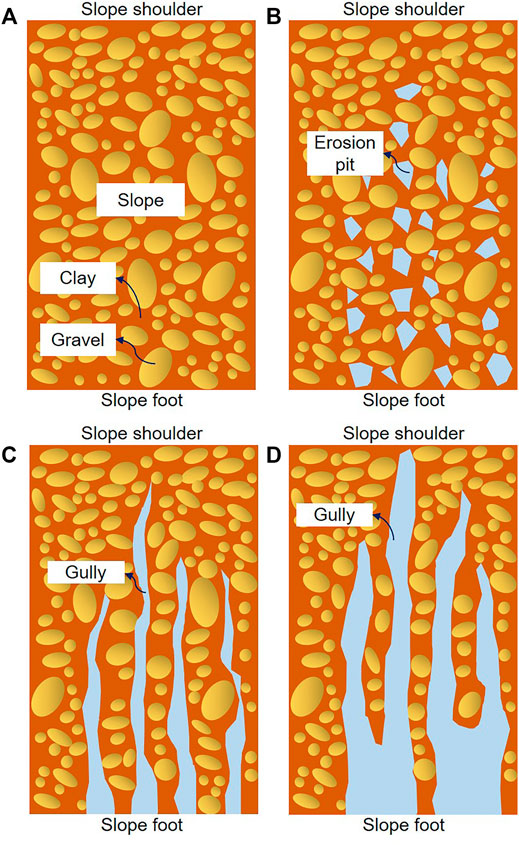
FIGURE 9. Simplified diagram of slope erosion failure evolution law (gravel content 30%). (A) Initial slope (B) erosion pits (C) gully (D) gully development.
Evolution Law of Erosion Damage of Slope (Gravel Content 50%)
For the slope with a gravel content of 50%, due to the skeleton effect of gravel, there was a difference in the failure form of slope surface and soil slope, and the slope surface damage was mainly erosion pit-shallow slump (Figure 10). The whole process was divided into the following three stages, 1) Sputter and sheet erosion, 2) Erosion pit erosion, 3) Layer-by-layer slump.
1) Sputter and sheet erosion
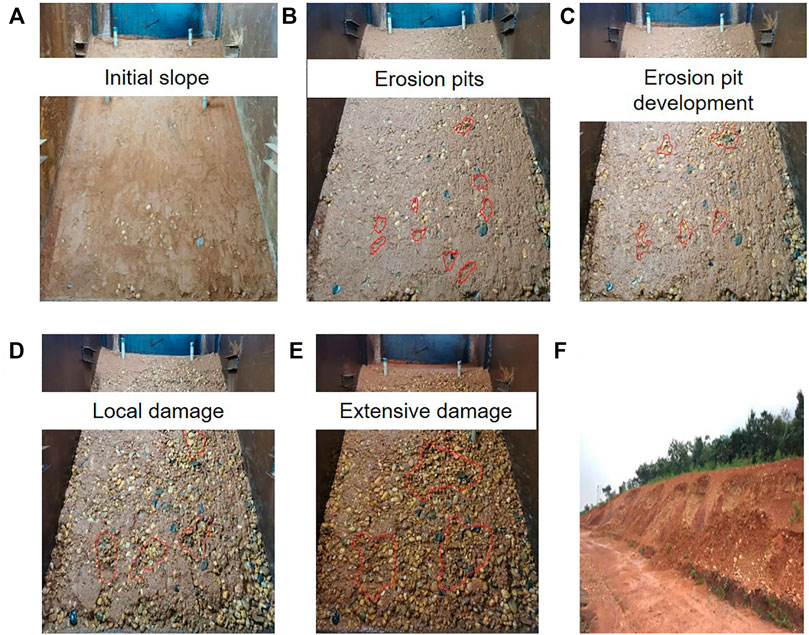
FIGURE 10. Evolution law of erosion damage of the test slope (gravel content 50%). (A) Initial slope (B) erosion pits (C) erosion pit development (D) slope local damage (E) slope extensive damage (F) actual slope failure.
This stage was similar to that of the 30% gravel content. Due to the increase of gravel content, the clay content of the slope decreased, and the degree of the erosion of the slope was relatively small.
2) Erosion pit erosion
Runoff washed away the clay particles on the slope, creating erosion pits on the slope. With the increase of the gravel content, a certain skeleton effect was formed between the gravels, and the runoff was not easy to wash away the gravel, and the gravel hindered trace erosion. The gravel beneath the erosion pit also prevented the erosion pit from forming a rill head. The presence of gravel prevented the development of erosion pits, and slope erosion did not form rills. The erosion pit developed laterally under the action of runoff. When the soil particles around the gravel were washed away, the gravel lose its supporting force and fallen into the erosion pit under the action of gravity, and the erosion pit developed gradually (Figure 10B). The appearance of the erosion pit enhanced the infiltration of the slope and softened the soil around the erosion pit. Under the action of runoff, the erosion pit expanded and deepened (Figure 10D).
3) Layer-by-layer slump
As the rainfall progressed, more erosion pits formed on the slope, and their locations were randomly distributed. When the erosion pits developed to a certain depth, the depth of the erosion pits would not increase temporarily, but expanded to the surrounding area. At this time, the erosion pits on the slope were connected with each other, forming a local layered slump, and the slope was unstable and damaged in the shallow layer, and then gradually developed to the deep layer. Figure 10F shows the failure of the slope in this form on site.
Figure 11 shows the evolution process of scour failure on the slope. Since the clay was more easily washed away than the gravel on the slope, erosion pits were formed between the gravel on the slope (Figure 11B). A small area of stagnant water was in the erosion pit, which provided conditions for the infiltration of rainwater, so that the fine-grained soil around the erosion pit was softened, the strength was reduced, and local damage occurred, so that the adjacent erosion pits were gradually connected under the condition that the interval soil was gradually destroyed. As a result, shallow slump failure was gradually formed (Figure 11C). Then, erosion pit failure continued to appear on the slip surface of the first layer, and then the slump failure process of the first layer was repeated to appear the second layer slump failure (Figure 11D). During the rainfall process, the slope surface was damaged by layer-by-layer slump, resulting in the erosion damage of the clay-gravel layer slope.
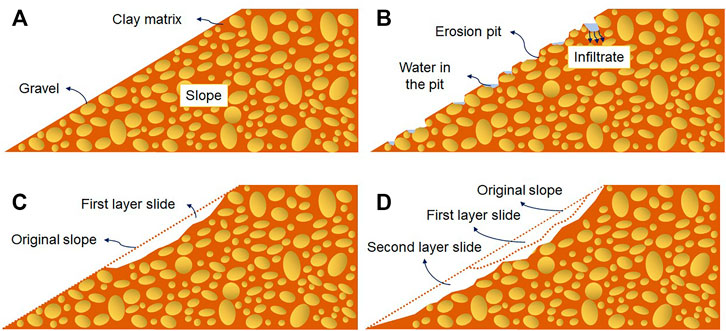
FIGURE 11. Simplified diagram of slope erosion failure evolution law (gravel content 50%). (A) Initial slope (B) erosion pits (C) slope local damage (D) slope extensive damage.
For the slope with a gravel content of 70%, the clay particles on the slope were quickly washed away by the water flow, and the gravel skeleton of the slope formed a temporary relatively stable structure (Figure 12). After being disturbed, the gravel layer collapsed as a whole.
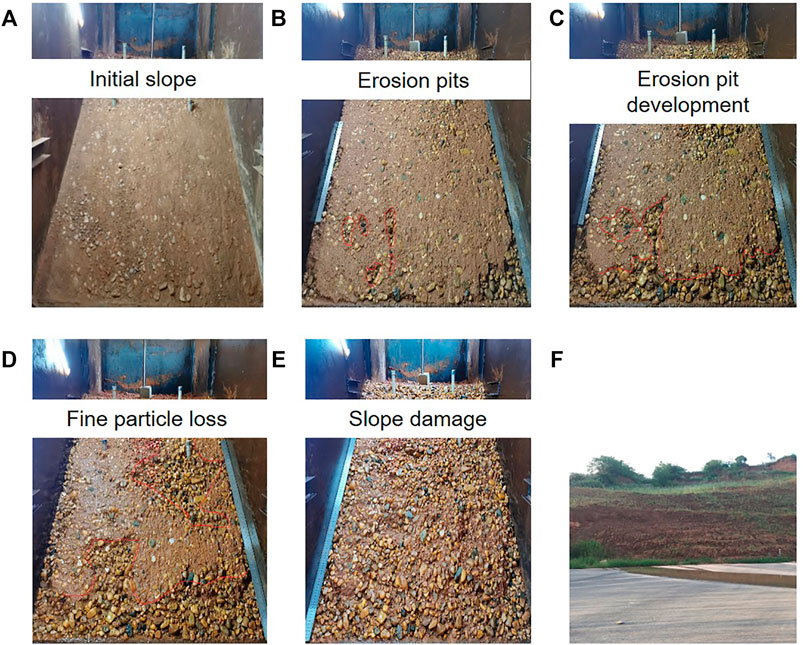
FIGURE 12. Evolution law of erosion damage of the test slope (gravel content 70%). (A) Initial slope (B) erosion pits (C) erosion pit development (D) fine particle loss (E) slope damage (F) actual slope failure.
The sputter and sheet erosion of the clay-gravel layer slope under the rainfall were similar to the above-mentioned two slope erosion processes and mechanisms (Figures 12A,B). When erosion pits were formed on the slope, the runoff velocity on the slope was large, and the runoff quickly washed away the clay around the gravel. However, due to the high content of gravel, the gravels contacted each other and occluded each other to form a skeleton structure, and the slope remained transiently stable. At the same time, due to the skeleton effect between the gravels (Figure 12C), the erosion pit would not develop to the depth to cause the collapse of the pit wall, but expanded to the surrounding, continued to wash away the clay between the gravels (Figure 12D), and gradually formed a gravel slope composed of macroporous gravels (Figure 12E). At this time, the slope ratio had a great influence on the stability of the slope. When the slope ratio was large, the sliding force on the gravel was greater than the anti-sliding force, which would cause the gravel to slide down, thereby causing the instability of the slope. In addition, since the cohesion between gravels was basically lost, when disturbed, even if the slope ratio was relatively small, the slope would suffer from extensive sliding failure (Figure 12F).
Figure 13 is the evolution process of slope erosion failure. In the early stage of rainfall, since the soil was more easily washed away than the gravel on the slope, erosion pits would be formed between the gravel on the slope (Figure 13B). However, due to the high gravel content, the contact and occlusion between the gravels formed a skeleton effect, and the slope remained transiently stable (Figure 13C). Moisture continued to erode deeper into the slope, softening the deep soil and washing away more clay. When disturbed or the environmental conditions changed, the gravel collapsed on a large scale and the slope was unstable (Figure 13D).
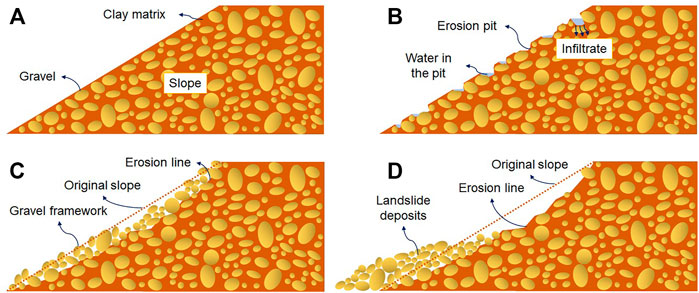
FIGURE 13. Simplified diagram of slope erosion failure evolution law (gravel content 70%). (A) Initial slope (B) erosion pits (C) fine particle loss (D) slope damage.
Conclusion
For the Anqing Formation clay-gravel layer, which is a special soil-rock mixture composed of gravel and clay, regional geological investigations, basic physical property tests, in-situ horizontal push-shear tests, and indoor large-scale slope rainfall erosion tests were carried out. The poor engineering geological properties of the clay-gravel layer and its influence on the slope deformation law and the failure mechanism of instability were studied.
The cementation of the clay-gravel layer was divided into clay-gravel interface salt cementation and clay matrix mineral cementation. The clay mineral content was 29%, including 3.99% illite, 13.86% kaolinite, and 11.16% I/S mixed layer. In the natural state, the strength of the clay-gravel layer was relatively high. When it encountered water, the cementation effect was easily lost, and the strength decreased rapidly.
The shear force-shear displacement curve was divided into five stages: compaction, linear deformation, elastoplastic deformation, peak and post-destruction. The larger the amount of gravel, the larger the peak shear force of the clay-gravel layer in the natural state. The peak shear force in the saturated state was significantly lower than that in the natural state. As the overlying load increased, the peak shear force increased. The shear zone was in the shape of a broken line. The shear zone extended along the clay matrix, and when encountering gravel, it bypassed the gravel and extended along the edge of the gravel, that was, the clay-gravel interface. At saturation, the shear strength of the clay-gravel layer decreased significantly. With the application of the overlying load, the shear strength increased within a certain range, but the increase of the strength with the increase of the load was not obvious. The effect of water than load on the strength characteristics of the clay-gravel layer was more significant.
Under rainfall conditions, the gravel content had an important influence on the erosion pattern and instability mechanism of the clay-gravel slope. When the gravel content was 30%, the failure of the slope surface was the development of gullies. The erosion damage process was similar to the soil slope. When the gravel content was 50%, affected by the distribution of gravel, the slope failure was manifested as the development of erosion pits, followed by local slumps, and finally the overall sliding in layers. When the gravel content was 70%, the clay particles on the slope were quickly washed away by the water flow, and the gravel skeleton of the slope formed a temporary relatively stable structure. After being disturbed, the gravel layer collapsed as a whole.
Data Availability Statement
The original contributions presented in the study are included in the article/Supplementary Material, further inquiries can be directed to the corresponding author.
Author Contributions
ZD: Writing–review & editing, Supervision, Validation, Funding acquisition. KH: Methodology, Writing–original draft. LJ: Data curation. JL: Investigation, Validation. FY: Methodology, Investigation. SC: Project administration, Supervision.
Funding
The work reported in this paper was financially supported by the National Natural Science Foundation of China (No. 42172308).
Conflict of Interest
The authors declare that the research was conducted in the absence of any commercial or financial relationships that could be construed as a potential conflict of interest.
Publisher’s Note
All claims expressed in this article are solely those of the authors and do not necessarily represent those of their affiliated organizations, or those of the publisher, the editors and the reviewers. Any product that may be evaluated in this article, or claim that may be made by its manufacturer, is not guaranteed or endorsed by the publisher.
Acknowledgments
We would like to acknowledge the reviewers and the editors for their comments and suggestions.
References
An, J., Zheng, F., Lu, J., and Li, G. (2012). Investigating the Role of Raindrop Impact on Hydrodynamic Mechanism of Soil Erosion under Simulated Rainfall Conditions. Soil Sci. 177 (8), 517–526. doi:10.1097/ss.0b013e3182639de1
Bryan, R. B., and Rockwell, D. L. (1998). Water Table Control on Rill Initiation and Implications for Erosional Response. Geomorphology 23 (2-4), 151–169. doi:10.1016/s0169-555x(97)00110-4
Chen, X., Shi, C., and Yang, J. X. (2020). Study on the Influence of Meso-Characteristics of Mixed Earth and Rock Slope on the Formation of Sliding Surface. J. Eng. Geology. 28 (4), 813. doi:10.13544/j.cnki.jeg.2019-332
De Vente, J., and Poesen, J. (2005). Predicting Soil Erosion and Sediment Yield at the basin Scale, Scale Issues and Semi-quantitative Models. Earth-Science Rev. 71 (1-2), 95–125. doi:10.1016/j.earscirev.2005.02.002
Govers, G., Gimenez, R., and Van, O. K. (2007). Rill Erosion, Exploring the Relationship between Experiments, Modelling and Field Observations. Earth-Science Rev. 84 (3-4), 87–102. doi:10.1016/j.earscirev.2007.06.001
Hu, R. L., Li, X., and Wang, Y. (2020). Engineering Geomechanical Properties and Structural Effects of Soil-Rock Mixtures. J. Eng. Geology. 28 (2), 255. doi:10.13544/j.cnki.jeg.2020-077
Jin, L., Zeng, Y. W., and Zhang, S. (2017). Large-scale Triaxial Test on the Influence of Mass Stone Content and Shape on the Mechanical Properties of Cemented Soil-Rock Mixture. Rock Soil Mech. 38 (1), 141–149.
Jones, B., Lockart, E. B., and Squair, C. (1984). Phreatic and Vadose Cements in the Tertiary Bluff Formation of Grand Cayman Island, British West Indies. Bull. Can. Pet. Geology. 32, 382.
Li, X., Liao, Q. L., and He, J. M. (2007). In-situ Experimental Study of Mechanical Properties of Soil-Rock Mixtures. J. rock Mech. Eng. 26 (12), 2377. doi:10.3321/j.issn:1000-6915.2007.12.001
Mancilla, G. A., Chen, S., and McCool, D. K. (2005). Rill Density Prediction and Flow Velocity Distributions on Agricultural Areas in the Pacific Northwest. Soil Tillage Res. 84 (1), 54–66. doi:10.1016/j.still.2004.10.002
Medley, E. (2001). Evaluating Safety of Concrete Gravity Dam on Weak Rock: Scott Dam-Discussion. J. Geotech. Geoenviron 127 (10), 901–902. doi:10.1061/(ASCE)1090-0241(2001)127:10(901)
Nie, Z. H., Li, K., and Xia, J. (2012). Research on Coarse-Grained Soil Collapsibility in Gobi Region. Amr 446-449, 1450–1453. doi:10.4028/www.scientific.net/amr.446-449.1450
Qian, Z. Z., Sheng, M. Q., and Tian, K. P. (2017). Cementation Mechanism and Micromechanical Model of Gobi Gravel Soil. Rock Soil Mech. 38 (S2), 138–144.
Ren, J. K. (2017). Research on Scour Mechanism of Dispersed Soil in Zhenlai Area of Jilin Province. Changchun: Jilin, Jilin University. M.Sc.
Shen, H.-o., Zheng, F.-l., Wang, L., and Wen, L.-l. (2019). Effects of Rainfall Intensity and Topography on Rill Development and Rill Characteristics on Loessial Hillslopes in China. J. Mt. Sci. 16 (10), 2299–2307. doi:10.1007/s11629-019-5444-5
Song, P. R. (2013). Characteristics and Numerical Simulation of Erosion Failure of Loess Slope. Changchun: Jilin University. Ph.D.
Tang, J. Y., Xu, D. S., and Liu, H. B. (2018). Effect of Rock Content on Shear Characteristics of Soil-Rock Mixture. Rock Soil Mech. 39 (1), 93. doi:10.16285/j.rsm.2017.1527
Tao, Q. D., He, Z. Y., and Jia, Y. (2019). Strength Characteristics and Influencing Factors of Earth-Rock Mixture Based on Triaxial Test. Sci. Technol. Eng. 19 (26), 310. doi:10.3969/j.issn.1671-1815.2019.26.049
Wang, J. Y., Cao, W. G., Zhai, Y. C., Zhang, G. C., and Zhang, Y. J. (2016). Research on Horizontal Shear Test of Soil and Stone Mixed Fill Foundation under Different Water Environment. J. Cent. south Univ. (natural Sci. edition) 47 (2), 615. doi:10.11817/j.issn.1672-7207.2016.02.035
Wang, Y., and Li, X. (2015). Study of Mesoscopic Fractal Feature and Mechanical Properties for Rock and Soil Aggregates Samples. J. Rock Mech. Eng. 34 (S1), 3397. doi:10.13722/j.cnki.jrme.2013.1527
Xia, J. G., Hu, R. L., Qi, S. W., Gao, W., and Sui, H. Y. (2017). Large Scale Triaxial Shear Test of Soil-Rock Mixture with Super Diameter Particles. J. rock Mech. Eng. 36 (8), 2031. doi:10.13722/j.cnki.jrme.2016.1638
Xu, W.-J., Hu, R.-L., and Tan, R.-J. (2007). Some Geomechanical Properties of Soil-Rock Mixtures in the Hutiao Gorge Area, China. Géotechnique 57 (3), 255–264. doi:10.1680/geot.2007.57.3.255
Xu, W. J., and Hu, R. L. (2008). Field Experimental Study on Mechanical Properties of Soil-Rock Mixture under Cyclic Load. J. Eng. Geology. 16 (1), 63. doi:10.3969/j.issn.1004-9665.2008.01.013
Xu, W. J., Hu, R. L., and Zeng, R. Y. (2006). Research on Horizontal Push-Shear In-Situ Test of Subwater Soil-Rock Mixture. Chin. J. Geotechnical Eng. 28 (7), 815. doi:10.3321/j.issn:1000-4548.2006.07.002
You, X. H., and Tang, J. S. (2002). Field Horizontal Shear Test of Soil-Rock Mixture. J. rock Mech. Eng. 21 (10), 1537. doi:10.3321/j.issn:1000-6915.2002.10.021
Zhao, L., Hou, R., Wu, F., and Keesstra, S. (2018). Effect of Soil Surface Roughness on Infiltration Water, Ponding and Runoff on Tilled Soils under Rainfall Simulation Experiments. Soil Tillage Res. 179, 47–53. doi:10.1016/j.still.2018.01.009
Keywords: clay-gravel layer, shear zone, shear strength, slope erosion, failure mechanism
Citation: Dai Z, Huang K, Jiang L, Li J, Yu F and Chen S (2022) Shear Strength Characteristics of Clay-Gravel Layer and Its Slope Failure Law and Mechanism. Front. Earth Sci. 10:865697. doi: 10.3389/feart.2022.865697
Received: 30 January 2022; Accepted: 22 February 2022;
Published: 15 March 2022.
Edited by:
Tingting Liu, Wuhan University of Technology, ChinaReviewed by:
XM Li, Zhongyuan University of Technology, ChinaLi Wei, China University of Geosciences Wuhan, China
Copyright © 2022 Dai, Huang, Jiang, Li, Yu and Chen. This is an open-access article distributed under the terms of the Creative Commons Attribution License (CC BY). The use, distribution or reproduction in other forums is permitted, provided the original author(s) and the copyright owner(s) are credited and that the original publication in this journal is cited, in accordance with accepted academic practice. No use, distribution or reproduction is permitted which does not comply with these terms.
*Correspondence: Zhangjun Dai, empkYWlAd2hyc20uYWMuY24=
 Zhangjun Dai
 Kang Huang1,2
 Jian Li

