 Shi-ling Wang
 Hui-juan Peng*
 Tian-rui Wang
- Key Laboratory of Tectonic Controls on Mineralization and Hydrocarbon Accumulation, Ministry of Natural Resources of the People's Republic of China, College of Earth Sciences, Chengdu University of Technology, Chengdu, China
The Hongniu–Hongshan Cu skarn deposit is located in the central part of the Zhongdian porphyry and skarn Cu belt in southwestern China. Various elements, including Al, Ti, Li, K, Na, Ca, Fe, and Ge, have been completed by using scanning electron microscopy–cathodoluminescence (SEM-CL) and laser ablation inductively coupled plasma-mass spectrometry (LA-ICP-MS) on quartz phenocrysts from the Hongniu–Hongshan porphyry and skarn Cu deposit. Three quartz generations were identified in the porphyritic granite based on the CL textures and trace element signatures. Samples of the first-generation quartz (Qtz1) contain dark gray luminescent cores assaying 22–85 ppm Ti, 58–129 ppm Al, 4–18 ppm Li, and 0.43–40 ppm Fe. The Ti-in quartz geothermometer indicates crystallization temperatures of 593–664°C for Qtz1. Samples of the second-generation quartz (Qtz2) are characterized by clear bright gray oscillatory overgrowths with medium Ti concentrations of 51–70 ppm with elevated and variable amounts of Al, Li, and Fe, and low K. The Ti-in quartz geothermometer indicates crystallization temperatures of 672–706°C. Samples of the third-generation quartz (Qtz3) contain narrow light gray rims assaying 56–93 ppm Ti, 80–101 ppm Al, 11–19 ppm Li, 1.42–17 ppm K, and 2–25 ppm Fe. The Qtz3 crystallised crystallized at higher temperatures of 706–799°C. Our study indicates that the quartz phenocryst in the Hongniu–Hongshan porphyry may have undergone two mixing episodes involving a second hotter magma. Before the first resorption, average Ti concentration in the quartz phenocryst cores was 24 ppm, and Ti of the bright band halo at the edge of the crystal core is 56 ppm; the maximum temperature difference is 109°C higher than that of the pre-resorption. Furthermore, the Ti concentration is 75 ppm at the edge of the quartz phenocryst before resorption. After resorption, the average Ti increased to 81 ppm at maximum temperature difference of 54°C higher than that of pre-resorption. Moreover, on the basis of quartz composition collected from 14 different deposits and our new dataset, we propose that covariations of Ge/Al ratio can be used to effectively discriminate magmatic quartz and hydrothermal quartz. Magmatic quartz has a Ge/Al ratio of <0.013, and the hydrothermal quartz has a ratio of >0.013.
1. Introduction
Quartz is not only one of the most abundant minerals in the crust but is also the most common gangue mineral in various hydrothermal deposits. Quartz commonly crystallizes at a wide range of temperature between 50° and 750°C from fluids with diverse origins and compositions (Rusk and Reed, 2002; Rusk et al., 2008; Thomas et al., 2010; Götte et al., 2011). Quartz is almost 100% SiO2 with amounts of mineral impurities assaying at the ppm levels.
Recent advances in the use of LA–ICP–MS have allowed for in situ analyses of numerous trace elements in quartz, such as Ti, Al, Li, Na, K, Fe, Ca, P, Mg, Mn, Cu, and Ge, at increasingly lower detection limits. The trace element concentrations in quartz is generally related to the abundance in melts or hydrothermal fluids, partitioning between the co-genetic minerals, pressure, temperature, and growth rate (Smith and Stenstrom, 1965; Andersson and Eklund, 1994; Gurbanov et al., 1999; Pagel and Orberger, 2000; Larsen et al., 2000; Götze et al., 2001; Takahashi et al., 2002; Larsen et al., 2004; Landtwing and Pettke, 2005; Wark and Watson, 2006; Jacamon and Larsen, 2009; Thomas et al., 2010; Rusk et al., 2011; Lehmann et al., 2011; Liang et al., 2014; Fu and Yan, 2020). Given that quartz is less prone to retrograde alteration and weathering than most hydrothermal minerals, its trace element composition can indicate its point of crystallization, which can be used to better understand the genesis of various types of deposits (Monecke et al., 2002; n; Wark and Watson, 2006; Rusk et al., 2008; Lehmann et al., 2009; Thomas et al., 2010; Agangi et al., 2011; Rusk, 2012; Wertich et al., 2018; Zhang et al., 2019; Fu and Yan, 2020). In addition, the trace element geochemistry of quartz and its cathodoluminescence (CL) reflectivity response have also been studied by various researchers (c.f. Marshall, 1988; Ramseyer and Müllis, 1990; Remond et al., 1992; Perny et al., 1992; Penniston-Dorland, 2001; Peppard et al., 2001; Götze et al., 2005; Rusk et al., 2006; Coulson et al., 2007; Rusk et al., 2008; Müller et al., 2010; Peng et al., 2010a; Peng et al., 2010b; Peng et al., 2010c; Götte et al., 2011; Rusk, 2012; Breiter et al., 2017a; Breiter et al., 2017b; Fu and Yan, 2020). These studies suggest that the trace element geochemistry of quartz is an indicator of its growth dynamics, physicochemical conditions during crystallization, and evolution (Monecke et al., 2002; Yang et al., 2008; Chen and Zhang, 2011; Götte et al., 2011). Furthermore, magmatic and hydrothermal quartz can be distinguished by their Ge/Al and Li/Al ratios (Müller et al., 2018).
The Hongniu–Hongshan skarn Cu deposit is located in the Zhongdian area of the Shangri-La County, Yunnan Province, China (Figure 1). The deposit includes two ore blocks known as the Hongshan and Hongniu blocks. The Hongshan block is relatively located to the northeast and has been mined since 1971, and the recently discovered Hongniu block is located to the southwest. In the past decade, the deposit has been regarded as skarn deposits (Hou et al., 2004; Song et al., 2006; Wang et al., 2011; Meng et al., 2013; Peng et al., 2014; Wang et al., 2016), and has been studied in detail, including isotopic ratio, fluid inclusion studies (Peng et al., 2016; Wang et al., 2016), mineralogy (Song et al., 2006; Wang et al., 2008; Peng et al., 2021; Tian et al., 2019), and geochronology (Wang et al., 2011; Huang et al., 2012; Meng et al., 2013; Peng et al., 2014).
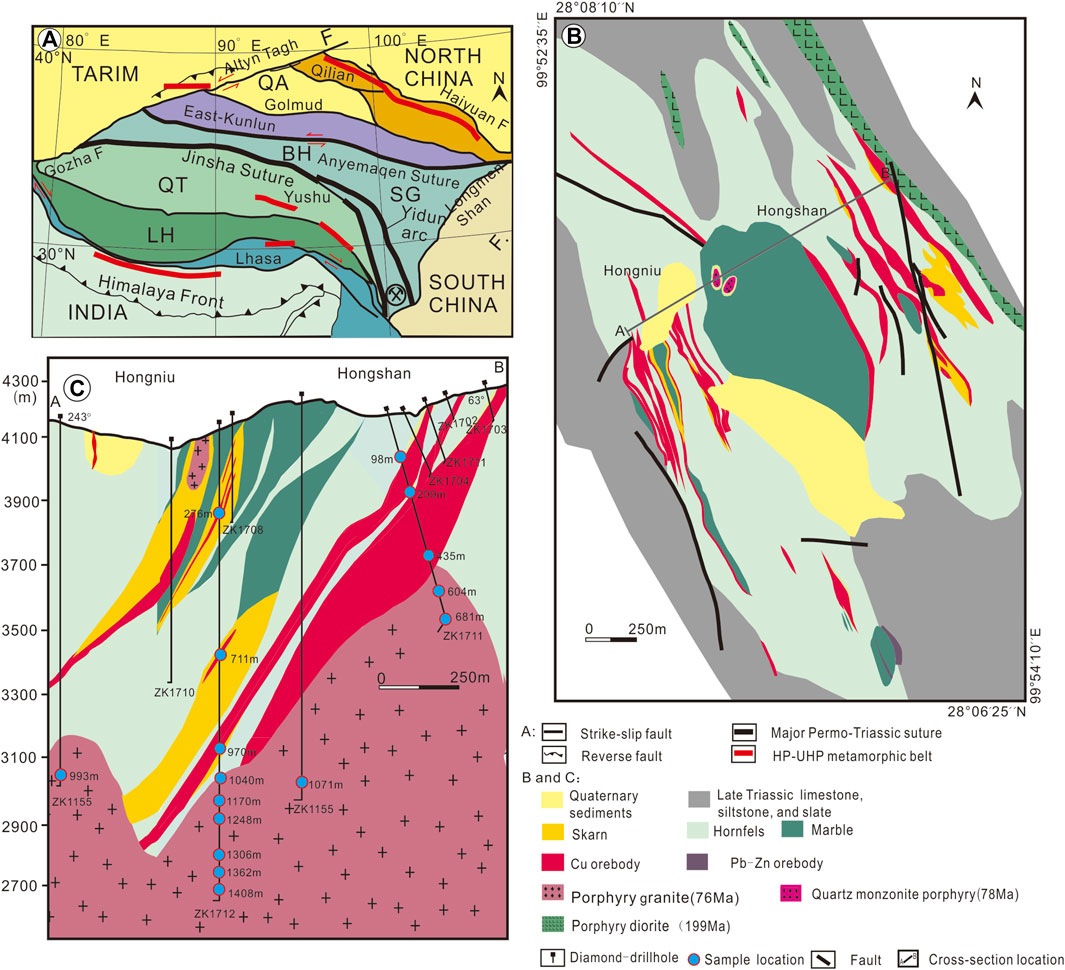
FIGURE 1. Geological maps showing (A) the tectonic setting of the Yidun Arc and Hongniu–Hongshan copper deposit (Xiong et al., 2014), (B) the Hongniu–Hongshan Cu deposit (Peng et al., 2021), and (C) simplified cross sections through the Hongniu–Hongshan Cu deposit, showing the spatial relationship between the different rock types and ore bodies. The locations of the cross sections are shown in panel B. The samples analyzed in this study were all collected from cross sections A–B. LH = Lhasa Block; QT = Qiangtang Block; BH = Bayan Har terrane; QA = Qaidam Basin; S = Suture; F = Fault.
A porphyritic granite has recently been identified in diamind-drillhole core from the northeastern part of the deposit (Figures 1A,B). The intrusion hosts quartz–pyrite–chalcopyrite–molybdenite veins, and sub-economic porphyry-type Cu–Mo mineralization at the Hongniu–Hongshan deposit. In this contribution, we present the petrographic description and trace element geochemistry of quartz aiming to understand the genesis of their trace element tenures, quartz crystallization, and resorption of quartz phenocrysts. We discuss whether the igneous host rock at the deposit underwent magmatic mixing or recharge. Additionally, quartz trace element data from 14 deposits were compiled to study the difference between magmatic and hydrothermal quartz.
2. Geological Setting
2.1 Regional Geology
The Hongniu–Hongshan Cu deposit is located in the Zhongdian area in the southern part of the Yidun Arc. The area is in the eastern part of the Paleo-Tethyan Orogen in South Asia (Figure 1A; Sengor and Natal, 1996; Hou et al., 2007; Qu et al., 2010; Xu et al., 2012; Xu et al., 2018). The Yidun Arc is bounded by the Jinshajiang Suture to the west and the Garze–Litang Suture to the east. It is connected to the western margin of the Yangtze Block and extends for over 500 km from Gaogong in Sichuan Province in the north to Zhongdian in Yunnan Province in the south (Figures 1A,B). The Zhongdian polymetallic belt is situated in the southern segment of the Yidun Arc and is considered one of the most important non-ferrous metallic belts in China. It is characterized by Late Triassic porphyry skarn Cu(-Mo) deposits, such as Xuejiping and Pulang (Leng et al., 2008; Wang et al., 2008; Hou et al., 2010; Li et al., 2011; Mao et al., 2014; Ting et al., 2018). Recent geochronological studies indicate that some intrusions and associated porphyry-skarn deposits in the belt formed in the Late Cretaceous, such as the Hongniu–Hongshan Cu and Tongchanggou Mo deposits (Li et al., 2012; Li et al., 2013; Meng et al., 2013; Peng et al., 2014).
2.2 Hongniu–Hongshan Deposit
The Hongniu–Hongshan deposit is located in the Shangri-La County (Zhongdian) of Yunnan Province. It covers an area of ∼24 km2 at an elevation of 4,060–4,460 m above sea level (Figures 1B,C). The country rocks include gray slate, quartzite, and limestone of the Late Triassic Qugasi Formation. The formation metamorphosed to biotite hornfels, calc–silicate hornfels, and marble near the porphyritic granite (Figure 1B). The country rocks are cut by NW- and NE-trending faults, with the NW-trending faults hosting the mineralization at the Hongniu–Hongshan deposit subparallel to the strike of the Qugasi Formation, and the NE-trending faults dipping SE (Figure 1B).
The Hongniu–Hongshan granite is subdivided into a ca. 199 Ma porphyritic diorite located in the northeastern part of the Hongshan ore block (Peng et al., 2014), ca. 78 Ma porphyritic quartz monzonite and ca. 76 Ma porphyritic granite (Huang et al., 2012). The younger igneous phases are thought to be genetically associated with the skarn and mineralization (Peng et al., 2016).
The porphyritic quartz monzonite is located in the central part of the deposit and is often in direct contact with marble (Figure 1B). It is light grayish to white with phenocrysts of plagioclase (25–35%), K-feldspar (5–10%), biotite (5–10%), and quartz (3–5%). The quartz monzonite hosts endoskarn and exoskarn zones. The endoskarn consists of reddish grossular garnet, diopside, vesuvianite, and epidote (Peng et al., 2016).
The porphyritic granite is present below a depth of ∼600 m at the deposit (Figure 1C), where it comprises 20- to 100-mm-long phenocrysts of pinkish K-feldspar and zoned gray plagioclase in a coarse- to fine-grained groundmass of the quartz, plagioclase, K-feldspar, biotite, and hornblende (Figures 2A–F), with accessory chalcopyrite, pyrite, sphene, and apatite. The porphyritic granite has an early K-alteration characterized by secondary biotite- and quartz- K-feldspar veins. This is overprinted by argillic and sericitic alteration in the upper part of the granite. Both alterations are overprinted by weak propylitic alteration characterized by chlorite and epidote, replacing biotite in the upper part of the deposit.
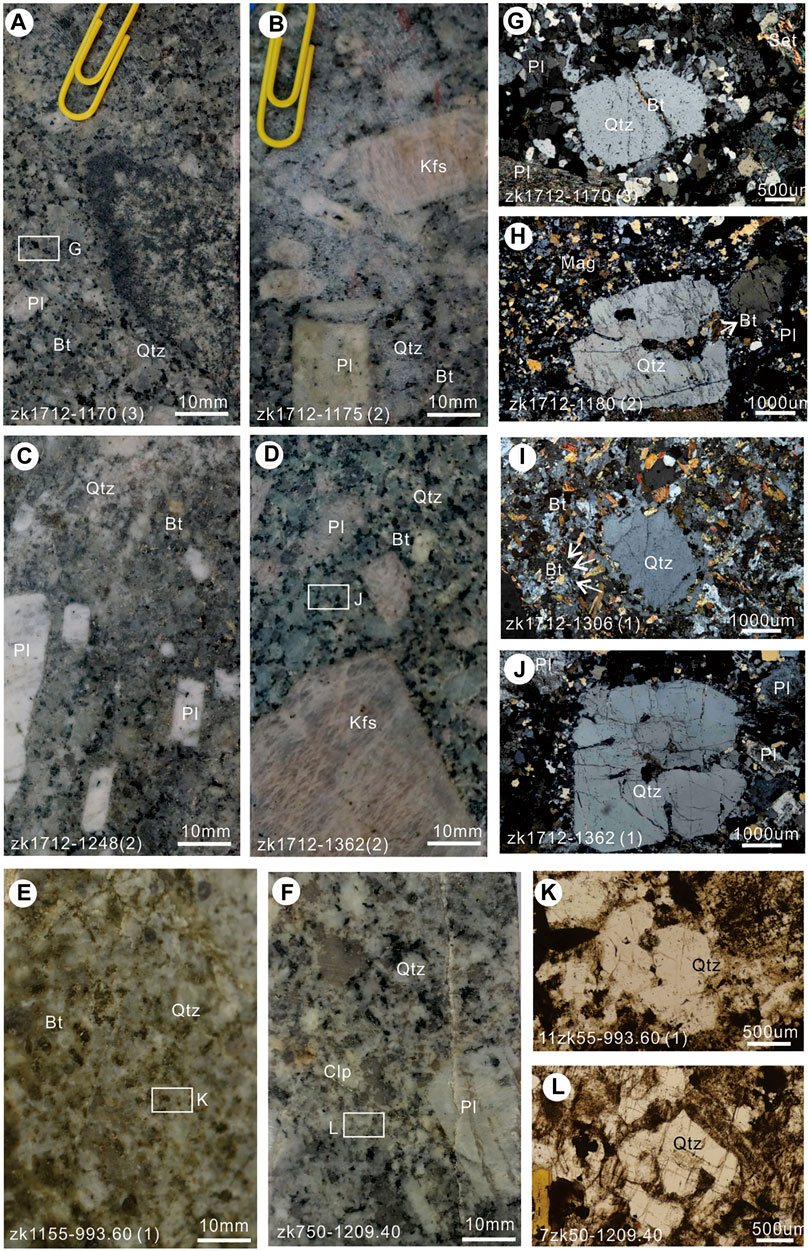
FIGURE 2. Photomicrographs of representative mineral assemblages from the Hongniu–Hongshan Cu deposit. The quartz forms phenocryst and is in the matrix in the porphyritic granite at the Hongniu–Hongshan deposit Panels (2A–F). Quartz coexists with K-feldspar, plagioclase, amphibole, and biotite. Quartz phenocryst is subhedral–euhedral and 4–6 mm in diameter, and some of them show rounded or embay surfaces (Panels 2G–L). The quartz matrix is allotriomorphic and 0.5–1 mm in size. Amp = amphibole; Bt = biotite; Kfs = K-feldspar; Pl = plagioclase; Qtz = quartz (after Kretz, 1983).
The prograde metamorphism at the Hongniu–Hongshan deposit includes garnet, pyroxene, and wollastonite. This assemblage is overprinted by an intense retrograde metamorphism characterized by epidote, tremolite, magnetite, and chlorite (Peng et al., 2021). The bulk of the mineralization is hosted by skarn and calc–silicate hornfels.
3. Samples and Analytical Methods
Twenty-one samples of drill cores were analysed from the porphyritic granite. Polished thin sections were used to petrologically study all of the samples, with emphasis on the occurrence, morphology, and texture of quartz. Seven samples were collected for scanning electron microscopy cathodoluminescence (SEM-CL) imaging and LA-ICP-MS analysis.
3.1 SEM-CL
SEM-CL images were obtained using a Tescan MIRA3 LM instrument set at an acceleration voltage of 15 kV and current of 15–20 nA/mm at Nanjing Hongchuang Geological Exploration Technology Service Co., Ltd., Nanjing, China. The bialkali tube had a CL response ranging from 300 nm (violet) to 650 nm (red), and it peaked in the violet spectrum at ∼400 nm. The CL images were collected from one scan with a 60-s photo speed and a processing resolution of 1,024 × 768 pixels. The brightness and contrast of the collected CL images were improved using Adobe Photoshop software.
3.2 LA-ICP-MS
Trace element concentrations of quartz was analyzed using an Agilent 7900 ICP-MS equipped with a GeoLasPro 193 nm ArFexcimer laser at the State Key Laboratory of Ore Deposit Geochemistry, Institute of Geochemistry, Chinese Academy of Sciences, Guiyang, China. The laser repetition was set at 10 Hz with an energy density of 12 J/cm2 and a spot size of 44 μm. The NIST SRM610 and GSD-1G standards were analyzed as external standards. The standards were run before and after each set of 10–15 spots on the analyzed samples. The analysis time for each spot was set at 90 s, comprising a 30-s background measurement time with the laser off, followed by 60 s with the laser on. An internal standard-independent calibration strategy, based on the normalization of the sum of all metal oxides to 100 wt%, was applied to the calibrations (Liu et al., 2008). The NIST SRM612 and GSD-1G standards were analyzed to monitor the accuracy of the results, which showed that the uncertainties of most elements (Li, Na, Mg, Al, K, Ca, Sc, Ti, Sb, Ge, Rb, and Sr) were <6%, with detection limits ranging from ppb to a few ppm. More details on the analytical procedures can be found in Lan et al. (2017).
4. Results
4.1 Quartz Petrography and Micro-Textures
The phenocrysts of porphyritic granite samples are composed of plagioclase (5-10 vol%), K-feldspar (∼5 vol%), quartz (<5 vol%), and amphibole (<5 vol%). Its matrix is mainly composed of feldspar, quartz, amphibole, and biotite. The quartz phenocrysts are subhedral to euhedral, 4–6 mm in diameter, and some are rounded or embayed (Figures 2G-L). The quartz in the matrix is allotriomorphic and 0.5–1 mm across. The euhedral quartz phenocrysts were selected for the CL structural analysis. Three generations of quartz phenocrysts (Qtz1–3) were identified (Figure 3).
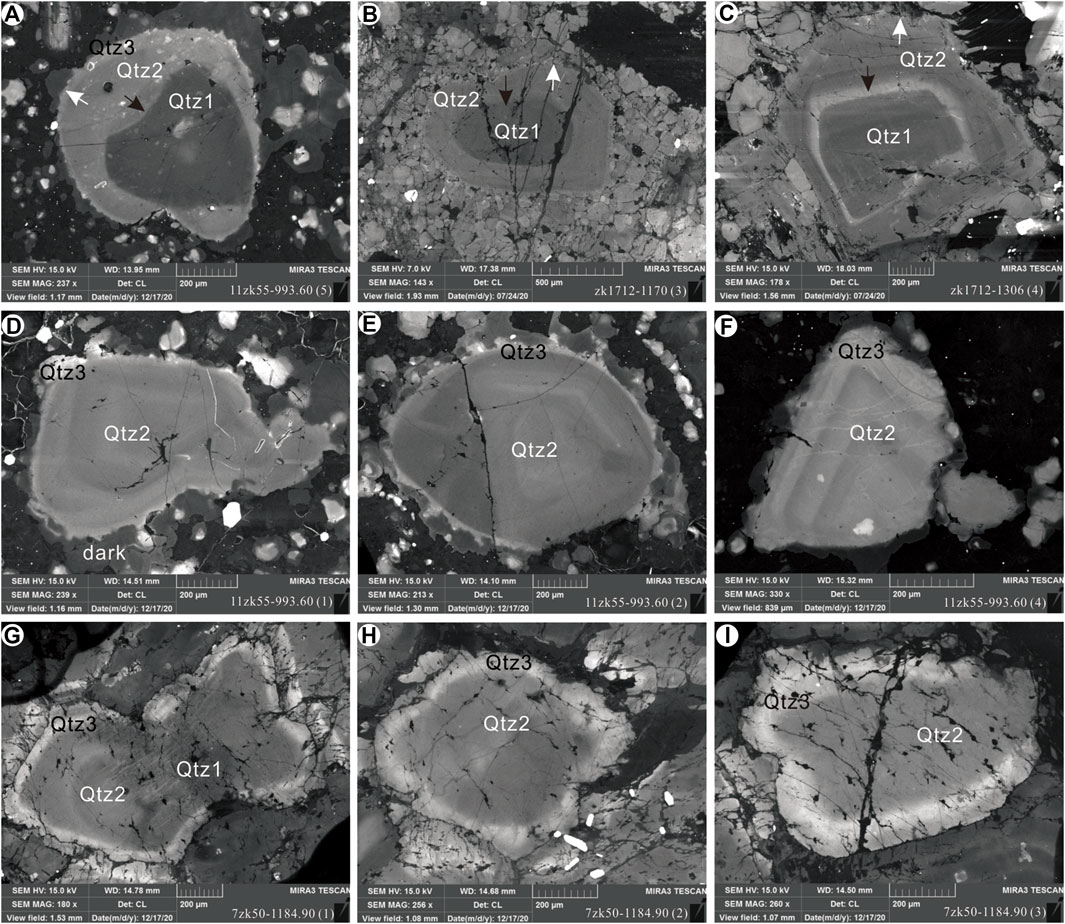
FIGURE 3. SEM-CL image of quartz from the Hongniu-Hongshan deposit. The quartz from the first generation of quartz (Qtz1) contains a strong dark grey luminescent core (in SEM-CL) with an average diameter of 0.4-0.6 mm (Figures 3A-C).The second generation of quartz (Qtz2) has a clear bright grey oscillatory overgrowth zonation with layers averaging 0.2 mm thick (Figures 3D-F). The third generation of quartz (Qtz3) typically has a narrow light grey rim on the SEM-CL images, with have an average thickness of 0.04 mm (Figures 3G-I). The black arrow show the resorption surfaces.
The first generation of quartz (Qtz1) is the most voluminous (Müller et al., 2010), and contains dark gray luminescent and rounded cores with an average diameter of 0.4–0.6 mm (Figures 3A,B). Some include slight oscillatory zones (Figure 3C). The second generation of quartz (Qtz2) has clear bright grey oscillatory zonation (Figures 3D–F). The average width of the growth is 0.2 mm. The zonation is commonly bright on the CL images and has been nucleated on weakly luminescent homogenous cores (dark in CL) (Figures 3, 4A-D). The third-generation quartz (Qtz3) crystals are represented by narrow light-gray rims, with an average width of 0.04 mm (Figures 3D–I). The crystal surfaces were wavy and probably developed shortly before crystallization (Figures 3A,D,E). The average crystal size of the matrix quartz is 0.02–0.04 mm, with weak contrasting growth zones (gray in CL).
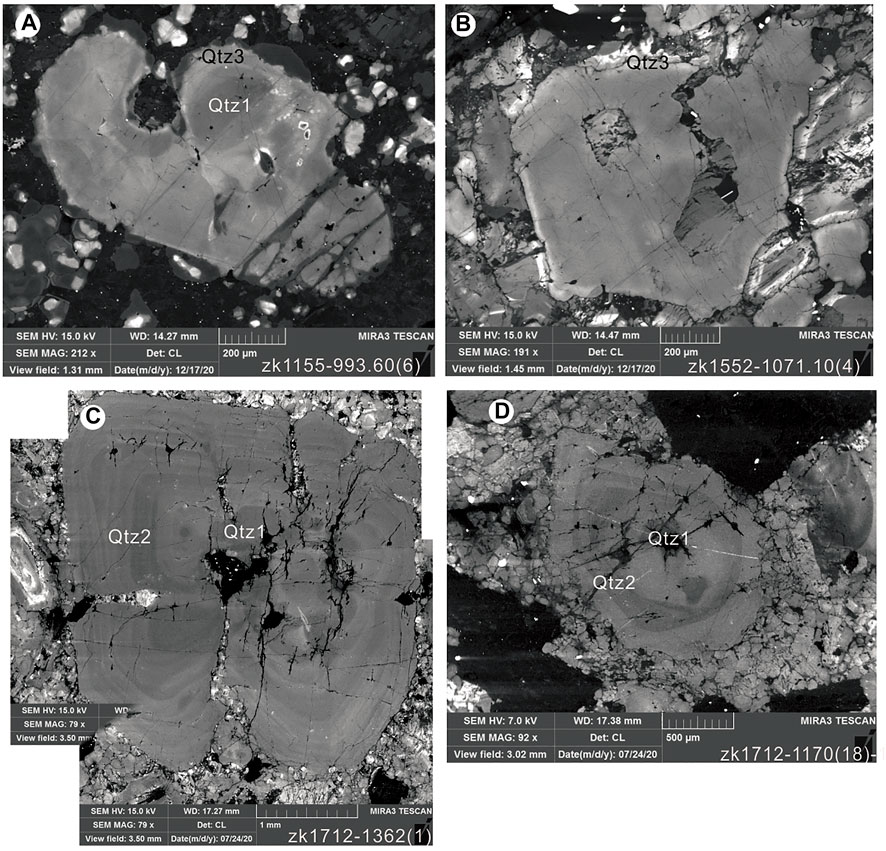
FIGURE 4. SEM-CL image of quartz from the Hongniu–Hongshan deposit (for explanations of symbols, see Figure 3).
4.2 Trace Element Compositions of Quartz Phenocryst
The samples were analyzed for Al, Ti, K, Fe, Ca, Na, Li, and P using LA-ICP-MS along transecting different quartz generations (Figure 5). The concentrations of these elements vary considerably between different quartz generations (Supplementary Table S1). The Al and Ti assays are relatively high in the three quartz generations of quartz, whereas Sb, Li, Ba, Sr, Ge, and As are common elements at lower concentrations (Figure 5). The concentrations of Zr, Nb, Gd, Hf, Ta, and U are below the detection limit in some analyzed spots.
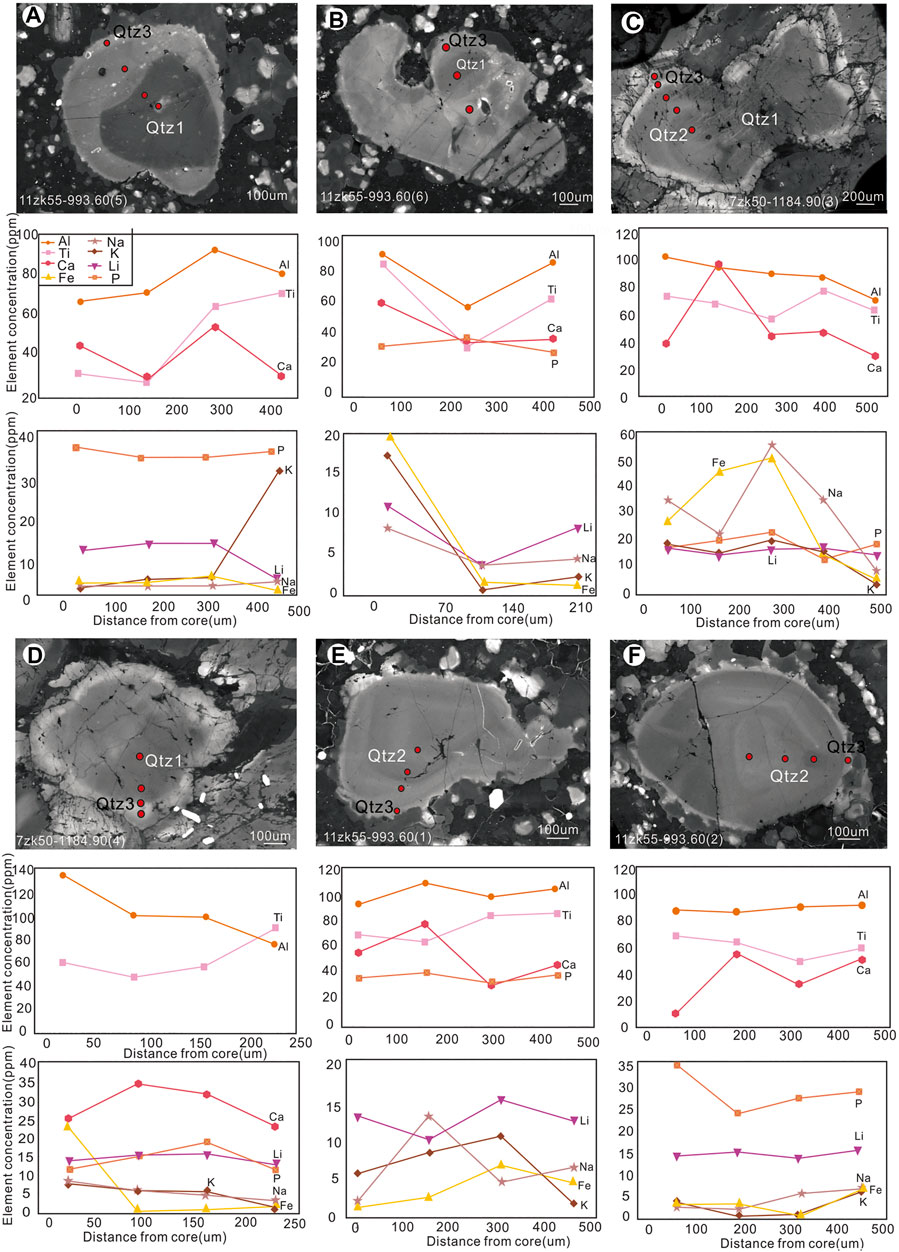
FIGURE 5. Concentrations of trace elements in single quartz phenocrysts from their core to rim determined using LA-ICP-MS.
The dark luminescent crystal cores in the Qtz1 phenocrysts have the lowest concentrations of Ti (22–47 ppm) among the three generations. The Qtz2 quartz with oscillatory zonation has medium Ti concentrations (51–70 ppm). The bright gray luminescent rim in the Qtz3 quartz is enriched in titanium, assaying 70–151 ppm Ti. The CL reflectivity always correlated positively with the Ti concentration in all the three generations of the quartz (Figure 6A).
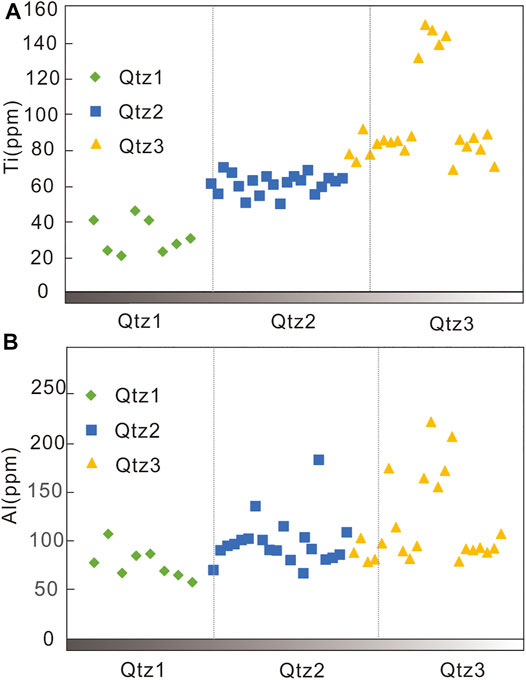
FIGURE 6. Content of Al and Ti contents in the three quartz generations from the Hongniu–Hongshan deposit.
Aluminum is the most common and abundant trace element in all of the three generations of the quartz, with a wide range in concentration. The Qtz1 quartz assays 58–129 ppm Al, Qtz2 assays 82–188 ppm Al, and Qtz3 assays 80–101 ppm (Figure 6B).
All of the quartz grains have relatively low Li assaying 4–18 ppm Li for Qtz1, 8–23 ppm Li for Qtz2, and 11–19 ppm Li for Qtz3. (Figure 5). The Qtz1 quartz assays 0.43–40 ppm FeT, Qtz2 assays 0.24–88 ppm, and Qtz3 assays 0.11–56 ppm FeT (Figure 5C). The Qtz1 and Qtz2 quartz samples have consistently low concentrations of K averaging 15 ppm K, but the Qtz3 quartz samples have a higher average value of 32 ppm K (Figure 5A). Phosphorus ranges from 13 to 47 ppm in all the three quartz generations, and in one crystal, P is evenly spread and does not correlate with any other element. Calcium is irregularly distributed among the three generations of quartz, with assays varying between 9 and 62 ppm. The Ca content of the Qtz3 samples, however, decreases significantly (Figures 5A,D). The Na content is variable among the three generations of quartz, ranging between 0.57 and 61 ppm. The Ge concentrations varied from 0.39 to 0.92 ppm in the three quartz generations, which corresponds to the range described from other magmatic systems (e.g., Jacamon and Larsen, 2009; Müller, 2018).
5. Discussion
5.1 Occurrence of Trace Elements in Quartz
The chemical structure of quartz consists of Si–O bonds with limited spaces, making it difficult for other elements to be incorporated in its structure (Jourdan et al., 2009). Previous geochemical studies of quartz have revealed significant occurrence of trace elements, such as Al, B, Ca, Cr, Cu, Fe, Ge, K, Li, Mg, Mn, Na, P, Rb, Pb, Ti, and U (Flem et al., 2002; Müller et al., 2003; Landtwing and Pettke, 2005; Müller and Koch-Müller, 2009). The LA-ICP-MS assays of Al, Na, K, Mg, Li, Mn, Fe, Ge, and Ti for most of the studied quartz phenocrysts were flat and stable (Figures 7A,B). This indicates that they are homogeneously distributed in the quartz crystal lattice, or are present as nanoparticles in the quartz (Genna and Gaboury, 2015; Dehnavi et al., 2018). However, significant differences between individual spots and irregular depth profiles for Ca, Sc, Ba, and As imply that these elements may be present in both the solid solution and as micro-inclusions in the quartz (Ciobanu et al., 2013; Figures 7C,D).
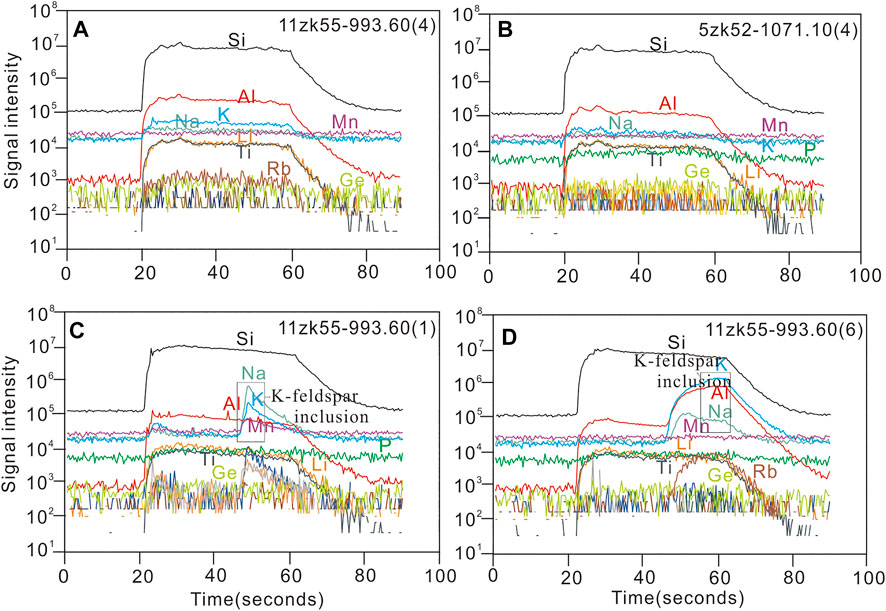
FIGURE 7. Time-resolved analysis (TRA) of elements across quartz grains.
Mono-, tri-, tetra-, and even pentavalent cations can be incorporated into the interstitial or tetrahedral sites of quartz to form crystal point defects (Götte and Ramseyer, 2012). Ge4+ and Ti4+ are similar in size to Si4+ and can substitute for it in the quartz crystal lattice (Chen et al., 2011; Rusk, 2012). Furthermore, pentavalent P5+ and trivalent Al3+ can combine to substitute for 2Si4+ (e.g., Chen et al., 2011). Trivalent Al3+ and Fe3+ can also enter quartz substituting for Si4+, which requires monovalent alkali metals (Li+, Na+, K+, and Rb+) or trivalent (Ca2+ and Sr2+) cations as charge compensators (Müller et al., 2003; Rusk et al., 2008; Götte and Ramseyer, 2012; Rusk, 2012). The quartz phenocrysts of the Hongniu–Hongshan deposit are significantly negatively correlated with Si and Ti (Figure 8B), which indicates that Ti4+ could enter quartz to substitute for Si4+ (Figure 9). In addition, Al negatively correlates with Si and positively correlates with alkali metals (Figures 8D–F). These elemental substitutions can be summarized by the equation Al3+ + Li+ (Na+, K+, and/or H+) → Si4+. Furthermore, a lack of clear positive correlation between Si and Ge and positive correlation between Al and Ge shown in Figures 8A,H indicates that Ge4+ has been substituted for Si4+ and Ge2+ acted as a charge compensator for the substitution of Si4+ by Al3+ (Götte and Ramseyer, 2012) (Figure 9).
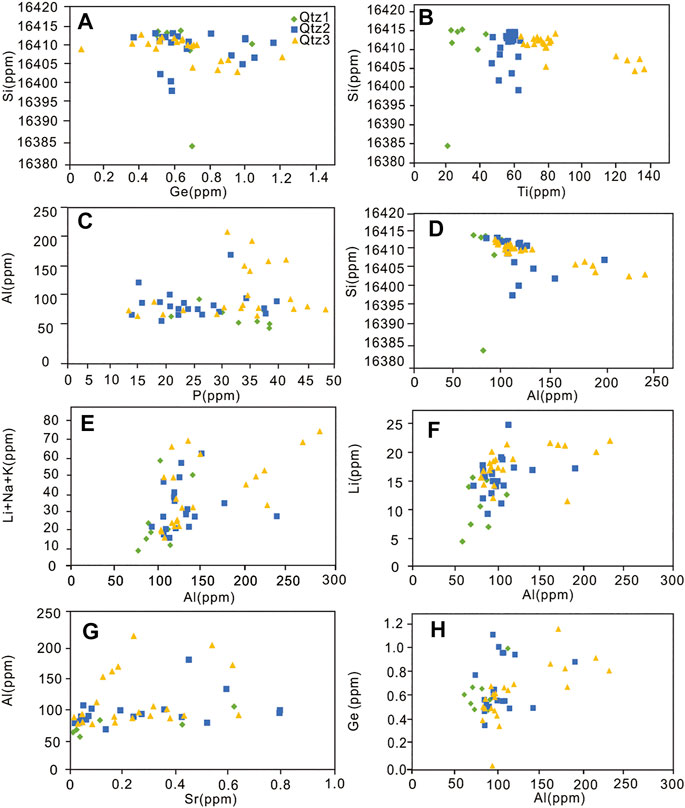
FIGURE 8. Plots of minor and trace elements in quartz from the Hongniu-Hongshan deposit.
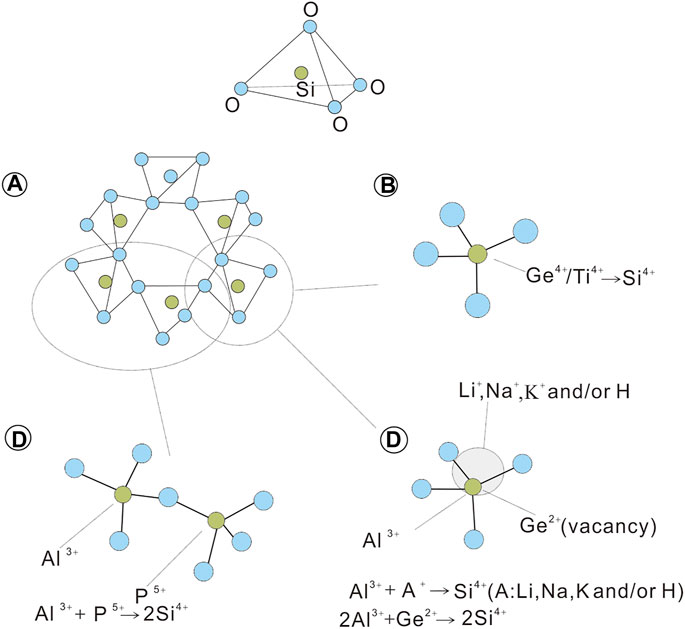
FIGURE 9. The substitution of trace elements in quartz from the Hongniu-Hongshan deposit (after Larsen et al., 2004).
5.2 Metallogenic Implications of the Hongniu–Hongshan Deposit
5.2.1 The Condition of the Quartz Phenocryst Crystallization
A significant correlation exists between Ti concentration and quartz precipitation temperature, especially at temperatures over 600°C (Wark and Watson, 2006; Wark et al., 2007; Götze, 2009; Thomas et al., 2010). The Ti concentration of the hydrothermal quartz formed at <350°C is < 10 ppm, and that formed at temperatures over 400°C is > 10 ppm (Rusk et al., 2008; Rusk, 2012). The Ti in the quartz samples from the study area assays 21–158 ppm indicative of relatively high crystallization over 400°C (Wark and Watson, 2006).
The crystallization temperature of the quartz is also affected by the pressure and Ti activity (αTiO2) of the melt or fluid (Wark and Watson, 2006; Huang and Audétat, 2012). The TitaniQ thermobarometer of Thomas (2015) is defined by the equation logTi = −0.27943 × 10⁴/T−(−660.53 × P0.35/T) + 5.6459, which helps in determining the quartz crystallization temperature using pressure. Peng et al. (2016) used fluid inclusion micro-thermobarometry to determine the formation temperatures of quartz phenocrysts in the Hongniu–Hongshan porphyritic granite, which ranged from ∼410° to 720°C at pressures of 680–940 bar. Owing to the relatively wide range of pressure, the crystallization temperature of quartz was calculated using the TitaniQ thermobarometer of Wark and Watson (2006) defined by the equation T(°C) = (−3,765/(log(Xqtz Ti/αTiO2)−5.69)−273. The TiO2 activity is difficult to determine; however, rutile is common in the samples of the porphyritic granite, which indicates that TiO2 is saturated (i.e.,αTiO2 = 1) (Hayden and Mathewes, 2005; Wark et al., 2007). From the TitaniQ thermobarometer, the crystallization temperature of Qtz1 was 593–664°C, and the gray oscillating rim of Qtz2 crystallized at 672–706°C. These temperatures are consistent with the temperatures measured by micro-thermometry of fluid inclusions. However, the Qtz3 crystallized at a temperature of 706–800°C, which is higher than the micro-thermometry temperatures. This is probably due to the small size of Qtz3, which resulted in a lack of melt/fluid inclusions.
The factors influencing Al concentrations in quartz are still under debate (Rusk, 2012)The high Al content in quartz indicate that it precipitated from a pH-dependent magma-derived hydrothermal fluid (Rusk et al., 2008; Müller et al., 2010; Götte, 2016). Breiter and Müller (2009) documented that there is no correlation between the Al content of igneous quartz and the Al content and peraluminosity of the parental melt. The relatively low average Al and K in Qtz1 presumably indicates that Al and K complexes in the magma preferentially precipitated as K-feldspar in the wall rock, incorporating Al and K that might have otherwise entered the quartz lattice. The higher average and variable Al content in Qtz2 of 71–187 ppm may reflect a relatively late-magmatic origin (Müller et al., 2000). The high Al content in Qtz3 of 79.5–227 ppm probably indicates that it precipitated from a magma-derived hydrothermal fluid. Acidic pH is commonly observed at this evolutionary stage of porphyry systems (Heinrich et al., 2005), providing the H+ necessary for the ionization of Al; however, Qtz3 shows the highest crystallization temperature among the three quartz generations pointing to a different origin.
5.2.2 Resorption of Quartz Phenocrysts
According to Müller et al. (2005, 2006, 2009), the processes that may form a resorption structure in quartz are 1) a semi-adiabatic magma ascent, 2) metasomatism by magma-derived hydrothermal fluids, and 3) magma mixing. The Ti-in quartz geothermometer provides the quartz crystallization temperature prior to and after a major phenocryst resorption episode. If resorption is caused by semi-adiabatic magma ascent, or the quartz grains were replaced by the magmatic fluid, the Ti-in quartz would not increase after resorption.
Supplementary Table S2 presents the changes in the minimum temperature after a major resorption episode. The resorbed cores and marginal resorption surfaces are overgrown by more luminescent quartz. Before resorption, the average concentration of Ti in the quartz phenocryst cores was 24 ppm at a crystallization temperature of ∼600°C. After resorption, the average concentration of Ti in the bright band halo at the edge of the crystal core was 56 ppm (Figure 10, white arrows). This was at a crystallization temperature of 683°C, being 83°C higher than that of pre-resorption, and a maximum temperature difference was 109°C. Furthermore, the Ti concentration was 75 ppm at the edge of the pre-resorption quartz phenocryst with a crystallization temperature of 714°C. During post-resorption, the average Ti increased to 81 ppm, with a crystallisation temperature of 72°C, and a maximum temperature difference of 54°C. Assuming that the concentration of trace elements in the solid phase is controlled by the concentration of the elements in the melt, the high Ti content in quartz indicates that the crystals became part of a more Ti-rich melt after resorption. This indicates that the quartz phenocrysts at the Hongniu–Hongshan have experienced two mixing episodes involving a high-temperature magma. However, the injection of hotter magma at the deeper levels of a magma reservoir may lead to higher gas pressures and trigger magma ascent (e.g., Blake and Pincus, 1996; Smith et al., 2004). This indicates that magma mixing and adiabatic magma ascent are normally simultaneous during magma evolution.
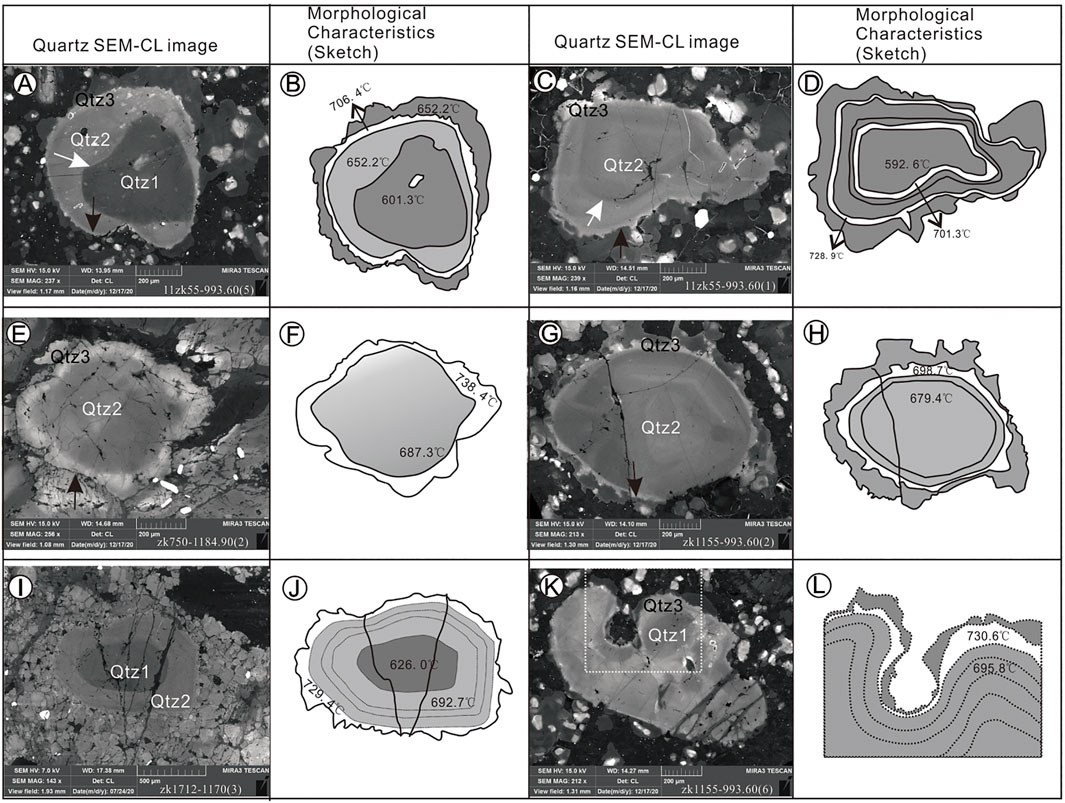
FIGURE 10. Structure sketch and the temperature changes before and after resorption of quartz phenocrysts from the Hongniu–Hongshan deposit.
5.3 Implications on Ore Deposit Type
The Al and Ti contents of epithermal, orogenic gold, and porphyry gold deposits differ from each other (Figures 11, 12, Supplementary Table S3). The Ti content of quartz from orogenic gold deposits is higher than that of typical epithermal deposits with values < 3 ppm and lower than that of quartz from typical porphyry deposits assaying 1–200 ppm at >400°C (Rusk et al., 2008; Rusk, 2012).
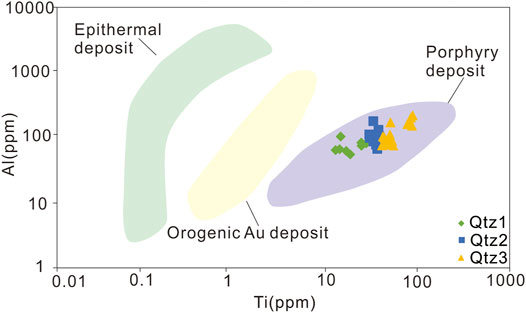
FIGURE 11. Diagram of Ti vs Al contents of quartz in the Hongniu-Hongshan deposit compared with data from Rusk (2012) including porphyry-type deposits, orogenic Au deposits, and epithermal deposits.
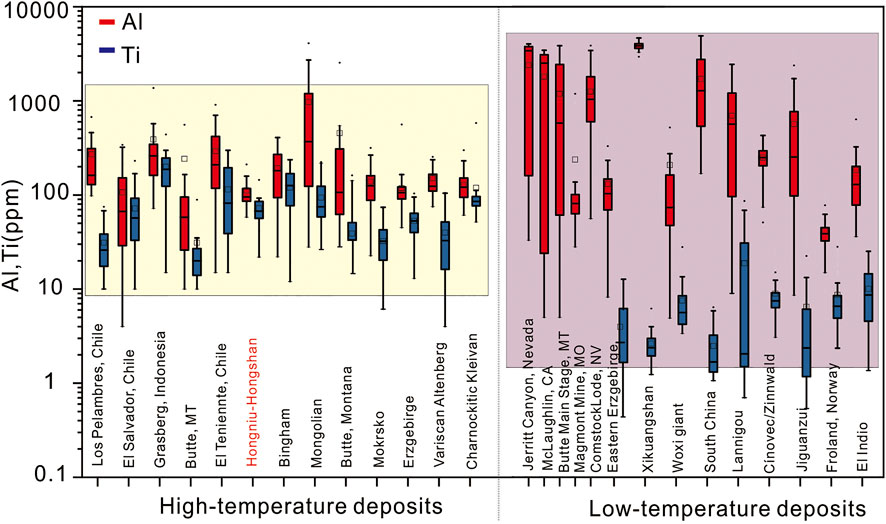
FIGURE 12. Box diagram of Al and Ti concentrations of quartz from 20 hydrothermal deposits (A = after Rusk et al., 2008; Mariane and Thoms 2005; Rusk et al., 2008; Jacamon and Larsen, 2009; Müller et al., 2010; Peng et al., 2010a; Müller et al., 2018; Zhang et al., 2019; Fu and Yan 2020).
The concentration of Al in quartz reflects its solubility in hydrothermal fluids, which is closely related to the fluid’s pH. Thus, the Al concentration in quartz reflects the flow at a certain pH, which may precipitate metal sulfides in hydrothermal deposits (Rusk et al., 2008). The Al content of quartz in porphyry deposits commonly ranges between 50 and 500 ppm, which is lower than that of orogenic gold deposits that assay 100–1,000 ppm Al. This may be due to the relatively Al-rich hydrothermal environment (Rusk, 2012). Hydrothermal quartz is mainly formed at high temperatures (500°–700°C) in porphyry deposits, and may be associated with K-alteration rather than Al-alteration (Rusk et al., 2008). Among the different types of deposits, the Al content of the low-temperature hydrothermal deposits is significantly variable. Some growth zones contain <50 ppm Al, while others contain >2000 ppm, with generally negligible amounts of Ti, Ge, and Mg (Francois and Larsen, 2009; Chen et al., 2011). Contrastingly, quartz always has a moderate concentration of Al in high-temperature hydrothermal deposits, which commonly assay several hundred ppm (Supplementary Table S3, Supplementary Table S4; Figure 12).
Although the Al and Ti assays of different types of deposits vary, it is difficult to distinguish magmatic quartz from hydrothermal quartz due to their overlap on the Al vs. Ti diagram in (Figure 13A, Supplementary Table S5). Previous studies show that the Li:Al atomic ratio of both magmatic and hydrothermal quartz does not exceed 1 (Figure 13B; Breiter and Mü;ller, 2009; Jourdan et al., 2009; Breiter and Mü;ller, 2009; Beurlen et al., 2011; Garate-Olave et al., 2017; Mü;ller et al., 2018). This indicates that the Li uptake by quartz is limited by the amount of Al3+ substituting for Si4+.
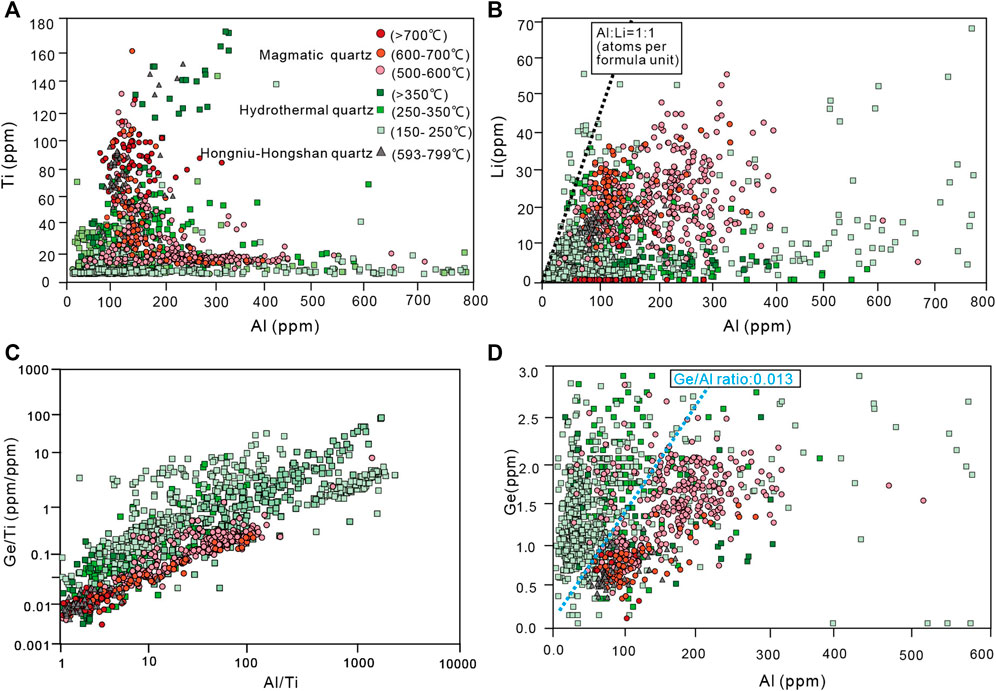
FIGURE 13. Variability of trace element concentrations in magmatic and hydrothermal quartz from 14 deposits (data from Götze et al., 2004; Mariane and Thoms, 2005; Rusk et al., 2008; Jacamon and Larsen, 2009; Müller et al., 2008, 2010; Peng et al., 2010a; Breiter et al., 2012, 2017a; Wertich et al., 2018; Müller et al., 2018; Zhang et al., 2019; Fu and Yan, 2020). A.Al versus Ti plot. B. Al versus Li plot. C. Al/Ti versus Ge/Ti plot. D. Al versus Ge plot.
The positive correlation between Al and Ge in Figure 13C shows that progression between magmatic and hydrothermal quartz increases in the quartz’s Ge content and decreases in the Al content. Thus, the magmatic quartz can be distinguished from hydrothermal quartz by its increased Ge content. The Ge/Al ratio in the two types of quartz increased systematically from high to low temperatures of quartz crystallization. Similar observations were made by Müller et al. (2018)who proposes magmatic and hydrothermal quartz populations can be distinguished by their Ge/Al weight ratio based on the study of the Late Palaeozoic Zinnwald/Cínovec Sn-W-Li greisen-type deposit: magmatic quartz has a Ge/Al ratio of < 0.008 whereas hydrothermal quartz a ratio of >0.008. The Ge assay varies from 0.35 to 1.17 ppm in the Hongniu-Hongshan deposit (Supplementary Table S1) and the average Ge/Al ratio is 0.006, which corresponds to the range reported from other magma-related deposits. On the basis of quartz composition collected for this study from 14 different deposits and our new dataset, we propose that magmatic quartz has a Ge/Al ratio of <0.013, and the hydrothermal quartz has a ratio of >0.013 (Figure 13D). The decreasing average Ge content of the hydrothermal quartz is consistent with the finding of Pokrovskii and Schott (1998), who attributed it to the decreasing solubility of Ge in the hydrothermal fluid with decreasing temperature. In the other words, Ge is preferentially incorporated in quartz compared with Al under hydrothermal conditions.
6. Conclusion
The quartz phenocrysts in the Hongniu–Hongshan porphyritic granite have Ti4+–Al3+–Li+(–Na+–K+–H+) substituting for Si4+ in the quartz lattice, where Ge2+ acts as a charge compensator for the substitution of Si4+ by Al3+.
From the CL textures and trace element concentrations, three quartz generations and two mixing episodes involving a later hotter magma were identified in the porphyritic granite at the deposit. Before the first resorption, the average concentration of Ti in the quartz phenocryst core was 24 ppm, and that in the bright band halo at the rim of core was 56 ppm. This was at a temperature of 109°C higher than that at the pre-resorption stage. Furthermore, the Ti assay of the edge of the quartz phenocryst was 75 ppm before resorption. At the post-resorption stage, the average Ti content increased to 81 ppm at a temperature of 54°C higher than that at the pre-resorption stage.
Based on the quartz composition data collected from 14 different deposits, the magmatic quartz can be distinguished from the hydrothermal quartz using the Ge/Al ratio. The magmatic quartz has a Ge/Al ratio of <0.013, and the hydrothermal quartz has a Ge/Al ratio >0.013.
Data Availability Statement
The original contributions presented in the study are included in the article/Supplementary Material, further inquiries can be directed to the corresponding author.
Author Contributions
S-lW completed the original draft (first draft). H-jP completed the writing—review and editing. T-rW assisted in the pretreatment of samples and participated in the discussion. HZ made unique suggestions for the article. QZ finished sorting out the reference articles. D-jY completed the collection of partial data and the production of maps. SC assisted in the conception of the previous article and the analysis of samples. XT assisted in data analysis and made maps.
Funding
This study was supported by the National Natural Science Foundation of China (41972077 and 41502074).
Conflict of Interest
Author SC is currently employed by SW Resources and Hydropower Survey, Design and Research Institute Co. Ltd., China, but he was not employed here at the time of research.
The remaining authors declare that the research was conducted in the absence of any commercial or financial relationships that could be construed as a potential conflict of interest.
Publisher’s Note
All claims expressed in this article are solely those of the authors and do not necessarily represent those of their affiliated organizations, or those of the publisher, the editors, and the reviewers. Any product that may be evaluated in this article, or claim that may be made by its manufacturer, is not guaranteed or endorsed by the publisher.
Acknowledgments
We thank the editors for their constructive recommendations that have improved this manuscript. We also thank general manager Yuan Qiuyun, of the Nanjing Hongchuang Geological Exploration Technology Service Company Limited, for assistance with the CL analysis, and Han Junjie, of the Institute of Geochemistry, Chinese Academy of Sciences for his help during LA-ICP-MS analyses.
Supplementary Material
The Supplementary Material for this article can be found online at: https://www.frontiersin.org/articles/10.3389/feart.2022.864118/full#supplementary-material
Supplementary Table S1 | Average trace element concentrations of quartz from the Hongniu–Hongshan deposit.
Supplementary Table S2 | Increase of the Ti contents and quartz crystallization temperatures before and after major resorption episodes documented by the chemical zoning of quartz phenocrysts.
Supplementary Table S3 | Corresponding relationship between formation temperature and Al/Ti content of 20 hydrothermal deposits.
Supplementary Table S4 | Date from Al and Ti concentrations of quartz from 20 hydrothermal deposits.
Supplementary Table S5 | Date from the quartz composition collected from 14 different deposits and our new dataset.
References
Agangi, A., McPhie, J., and Kamenetsky, V. S. (2011). Magma Chamber Dynamics in a Silicic LIP Revealed by Quartz: the Mesoproterozoic Gawler Range Volcanics. Lithos 126, 68–83. doi:10.1016/j.lithos.2011.06.005
Andersson, U. B., and Eklund, O. (1994). Cellular Plagioclase Intergrowths as a Result of crystal-magma Mixing in the Proterozoic Land Rapakivi Batholith, SW Finland. Contr. Mineral. Petrol. 117, 124–136. doi:10.1007/bf00286837
Beurlen, H., Müller, A., Silva, D., and Da Silva, M. R. R. (2011). Petrogenetic Significance of LA-ICP-MS Trace-Element Data on Quartz from the Borborema Pegmatite Province, Northeast Brazil. Mineral. Mag. 75, 2703–2719. doi:10.1180/minmag.2011.075.5.2703
Breiter, K., Durisova, J., Hrstka, T., Korbelova, Z., Vankova, M H., Galiovaa, M V., et al. (2017a). Assessment of Magmatic vs. Metasomatic Processes in Rare-Metal Granites: A Case Study of the Cinovec/Zinnwald Sn-W-Li Deposit, Central Europe. Lithos 292, 198–217.
Breiter, K., Korbelova, Z., Chladek, S., Uher, P., Knesl, I., Rambousek, P., et al. (2017b). Diversity of Ti-Sn-W-Nb-Ta Oxide Minerals in the Classic Granite-Related Magmatic-Hydrothermal Cinovec/Zinnwald Sn-W-Li Deposit (Czech Republic). Europ. J. Mineral. 29, 727–738.
Breiter, K. M., and Müller, A. (2009). Evolution of Rare-Metal Granitic Magmas Documented by Quartz Chemistry. ejm 21, 335–346. doi:10.1127/0935-1221/2009/0021-1907
Breiter, K., Svojtka, M., Ackerman, L., and Švecová, K. (2012). Trace Element Composition of Quartz from the Variscan Altenberg-Teplice Caldera (Krušné hory/Erzgebirge Mts, Czech Republic/Germany): Insights into the Volcano-Plutonic Complex Evolution. Chem. Geology. 326-327, 36–50. doi:10.1016/j.chemgeo.2012.07.028
Chen, J. F., and Zhang, H. (2011). Trace Elements in Quartz Lattice and Their Implications for Petrogenesis and Mineralization. Gaoxiao Dizhi Xuebao 17, 125–135. (in Chinese with English abstract).
Chen, X. D., Chen, Z. Y., Cheng, Y. B., and Ye, H. S. (2011). Characteristics and Applications of Trace Elements in Hydrothermal Quartz: Recognition and Progress. Geol. Rev. 5, 707–717. (in Chinese with English abstract).
Ciobanu, C. L., Cook, N. J., Kelson, C. R., Guerin, R., Kalleske, N., and Danyushevsky, L. (2013). Trace Element Heterogeneity in Molybdenite Fingerprints Stages of Mineralization. Chem. Geology. 347, 175–189. doi:10.1016/j.chemgeo.2013.03.011
Coulson, I. M., Edwards, P. R., and Lee, M. R. (2007). Preface: Recent Developments in Microbeam Cathodoluminescence with Applications to Mineralogy. Am. Mineral. 92, 233–234. doi:10.2138/am.2007.476
Flem, B., Larsen, R. B., Grimstvedt, A., and Mansfeld, J. (2002). In Situ analysis of Trace Elements in Quartz by Using Laser Ablation Inductively Coupled Plasma Mass Spectrometry. Chem. Geology. 182, 237–247. doi:10.1016/s0009-2541(01)00292-3
Francois, J., and Larsen, R. B. (2009). Trace Element Evolution of Quartz in the Charnockitic Kleivan Granite, SW-Norway: The Ge/Ti Ratio of Quartz as an index of Igneous Differentiation. Lithos 107, 28–291.
Fu, S. L., and Yan, J. (2020). Trace Element Chemistry of Hydrothermal Quartz and its Genetic Significance: A Case Study from the Xikuangshan and Woxi Giant Sb Deposits in Southern China. Ore Geology. Rev. 126, 103–112. doi:10.1016/j.oregeorev.2020.103732
Garate-Olave, I., Müller, A., Roda-Robles, E., Gil-Crespo, P. P., and Pesquera, A. (2017). Extreme Fractionation in a Granite-Pegmatite System Documented by Quartz Chemistry: The Case Study of Tres Arroyos (Central Iberian Zone, Spain). Lithos 286-287, 162–174. doi:10.1016/j.lithos.2017.06.009
Genna, D., and Gaboury, D. (2015). Deciphering the Hydrothermal Evolution of a VMS System by LA-ICP-MS Using Trace Elements in Pyrite: an Example from the Bracemac-McLeod Deposits, Abitibi, Canada, and Implications for Exploration. Econ. Geology. 110, 2087–2108. doi:10.2113/econgeo.110.8.2087
Götte(2016). Trace Element Composition of Authigenic Quartz in Sandstones and its Correlation With Fluid-Rock Interaction During Diagenesis (Book Chapter). Geol. Soc. Spec. Publ. 435, 373–387.
Götte, T., Pettke, T., Ramseyer, K., Koch-Muller, M., and Mullis, J. (2011). Cathodoluminescence Properties and Trace Element Signature of Hydrothermal Quartz: a Fingerprint of Growth Dynamics. Am. Mineral. 96, 802–813. doi:10.2138/am.2011.3639
Götte, T., and Ramseyer, K. (2012). Trace Element Characteristics, Luminescence Properties and Real Structure of Quartz. Springer Geology. 2197, 265–285. doi:10.1007/978-3-642-22161-3_12
Götze, J. (2009). Chemistry, Textures and Physical Properties of Quartz - Geological Interpretation and Technical Application. Mineral. Mag. 73, 645–671. doi:10.1180/minmag.2009.073.4.645
Götze, J., Plötze, M., Graupner, T., Hallbauer, D. K., and Bray, C. J. (2004). Trace Element Incorporation into Quartz: a Combined Study by ICP-MS, Electron Spin Resonance, Cathodoluminescence, Capillary Ion Analysis, and Gas Chromatography. Geochimica et Cosmochimica Acta 68, 3741–3759. doi:10.1016/j.gca.2004.01.003
Götze, J., Plötze, M., and Habermann, D. (2001). Origin, Spectral Characteristics and Practical Applications of the Cathodoluminescence (CL) of Quartz - a Review. Mineralogy Pet. 71, 225–250. doi:10.1007/s007100170040
Götze, J., Plötze, M., and Trautmann, T. (2005). Structure and Luminescence Characteristics of Quartz from Pegmatites. Am. Mineral. 90, 13–21. doi:10.2138/am.2005.1582
Gurbanov, A, Koschug, D, Williams, I, and Braun, J. (1999). A New Method for the Estimation of Cooling and Denudation Rates Using Paramagnetic Centers in Quartz: A Case Study on the Eldzhurtinskiy Granite, Caucasus. J. Geophys. Res. Solid Earth 104 (B8), 17531–17549.
Hayden, B., and Mathewes, R. (2005). The Rise and Fall of Complex Large Villages on the British Columbian Plateau: A Geoarchaeological Controversy. Canad. J. Archaeol. 33, 281–296.
Heinrich, C. A., Moritz, R., and Peytcheva, I. (2005). Geochronology and Geodynamics of Late Cretaceous Magmatism and Cu-Au Mineralization in the Panagyurishte Region of the Apuseni-Banat-Timok-Srednogorie Belt, Bulgaria. Ore Geol. Rev. 27, 95–126.
Hou, Z. Q., Gao, Y. F., and Meng, X. J. (2004). Genesis of Adakitic Porphyry and Tectonic Controls on the Gangdese Miocene Porphyry Copper belt in the Tibet an Orogen. Acta Petrologica Sinica 20, 239–248. (in Chinese with English abstract).
Hou, Z. Q. (2010). Metallogensis of Continent Al Collision. Acta Geologica Sinica-English Edition 84, 30–58. (in Chinese with English abstract).
Hou, Z., Zaw, K., Pan, G., Mo, X., Xu, Q., Hu, Y., et al. (2007). Sanjiang Tethyan Metallogenesis in S.W. China: Tectonic Setting, Metallogenic Epochs and deposit Types. Ore Geology. Rev. 31, 48–87. doi:10.1016/j.oregeorev.2004.12.007
Huang, R., and Audétat, A. (2012). The Titanium-In-Quartz (TitaniQ) Thermobarometer: A Critical Examination and Re-calibration. Geochimica et Cosmochimica Acta 84, 75–89. doi:10.1016/j.gca.2012.01.009
Huang, X., Xu, J., Chen, J., and Ren, J. (2012). Geochronology, Geochemistry and Petrogenesis of Two Periods of Intermediate-Acid Intrusive Rocks from Hongshan Area in Zhongdian Arc. Acta Petrologica Sinica 28, 1493–1506.
Jacamon, F., and Larsen, R. B. (2009). Trace Element Evolution of Quartz in the Charnockitic Kleivan Granite, SW-Norway: the Ge/Ti Ratio of Quartz as an index of Igneous Differentiation. Lithos 107, 281–291. doi:10.1016/j.lithos.2008.10.016
Jourdan, A.-L. V., Mullis, J., Ramseyer, K., Spiers, C. J., and Spiers, C. J. (2009). Evidence of Growth and Sector Zoning in Hydrothermal Quartz from Alpine Veins. ejm 21, 219–231. doi:10.1127/0935-1221/2009/0021-1881
Lan, T. G., Hu, R. Z., Fan, H. R., Bi, X. W., Tang, Y. W., Zhou, L., et al. (2017). In-situ Analysis of Major and Trace Elements in Fluid Inclusion and Quartz: LA-ICP-MS Method and Applications to Ore Deposits. Acta Petrologica Sinica 33, 3239–3262. (in Chinese with English abstract).
Landtwing, M. R., and Pettke, T. (2005). Relationships between SEM-Cathodoluminescence Response and Trace-Element Composition of Hydrothermal Vein Quartz. Am. Mineral. 90, 122–131. doi:10.2138/am.2005.1548
Larsen, R. B., Henderson, I., Ihlen, P. M., and Jacamon, F. (2004). Distribution and Petrogenetic Behaviour of Trace Elements in Granitic Pegmatite Quartz from South Norway. Contrib. Mineral. Petrol. 147, 615–628. doi:10.1007/s00410-004-0580-4
Larsen, R. B., Polve, M., and Juve, G. (2000). Granite Pegmatite Quartz from Evje-Iveland: Trace Element Chemistry and Implications for the Formation of High-Purity Quartz. Norges Geologiske Undersokelse 436, 57–66.
Lehmann, K., Berger, A., Götte, T., Ramseyer, K., and Wiedenbeck, M. (2009). Growth Related Zonations in Authigenic and Hydrothermal Quartz Characterized by SIMS-, EPMA-, SEM-CL- and SEM-CC-Imaging. Mineral. Mag. 73, 633–643. doi:10.1180/minmag.2009.073.4.633
Lehmann, K., Pettke, T., and Ramseyer, K. (2011). Significance of Trace Elements in Syntaxial Quartz Cement, Haushi Group Sandstones, Sultanate of Oman. Chem. Geology. 280, 47–57. doi:10.1016/j.chemgeo.2010.10.013
Leng, C. B., Zhang, X. C., and Wang, S. X. (2008). Geochemical Characteristics of Porphyry Copper Deposits in the Zhongdian Area, Yunnan as Exemplified by the Xuejiping and Pulang Porphyry Copper Deposits. Acta Mineralogica Sinica 27, 415–442. (in Chinese with English abstract).
Li, W. C., Li, H. J., Yu, G. H., and Yin, G. H. (2013). Porphyry Metallogenic System of Geza Arc in the Sanjiang Region, Southwestern China. Acta Petrologica Sinica 29, 1129–1144. (in Chinese with English abstract).
Li, W. C., Yu, H. J., and Yin, G. H. (2012). Re-Os Dating of Molybdenite from Tongchanggou Mopolymetallic deposit in Northwest Yunnan and its Metallogenic Environment. Mineral. Deposits 31, 282–292. (in Chinese with English abstract).
Li, W. C., Zeng, P. S., Hou, Z. Q., and White, E. C. (2011). The Pulang Porphyry Copper deposit and Associated Felsic Intrusions in Yunnan Province, Southwest China. Econ. Geology. 106, 79–92.
Liang, Y., Wang, G., Liu, S., Sun, Y., Huang, Y., and Hoshino, K. (2014). A Study on the Mineralization of the Woxi Au-Sb-W Deposit, Western Hunan, China. Resource Geology. 65, 27–38. doi:10.1111/rge.12053
Liu, X. C., Xiong, X. L., Audetat, A., Li, Y., Song, M. S., Li, L., et al. (2008). Partitioning of Copper Between Olivine, Orthopyroxene, Clinopyroxene, Spinel, Garnet and Silicate Melts at Upper Mantle Conditions. Geochim. Et Cosmochim. Acta. 125, 1–22.
Mao, J., Pirajno, F., Lehmann, B., Luo, M., and Berzina, A. (2014). Distribution of Porphyry Deposits in the Eurasian Continent and Their Corresponding Tectonic Settings. J. Asian Earth Sci. 79, 576–584. doi:10.1016/j.jseaes.2013.09.002
Mariane, R. L., and Thoms, P. (2005). Relationships between SEM-Cathodoluminescence Response and Trace-Element Composition of Hydrothermal Vein Quartz. Am. Mineral. 90, 122–131. doi:10.2138/am.2005.1548
Meng, J. Y., Yang, L. Q., and Liu, L. (2013). Re-Os Dating of Molybdenite from the Hongshan Cu-Mo deposit in Northwest Yunnan and its Implications for Mineralization. Acta Petrologica Sinica 29, 1214–1222. (in Chinese with English abstract).
Monecke, T., Kempe, U., and Götze, J. (2002). Genetic Significance of the Trace Element Content in Metamorphic and Hydrothermal Quartz: a Reconnaissance Study. Earth Planet. Sci. Lett. 202, 709–724. doi:10.1016/s0012-821x(02)00795-1
Mü ller, A., Wiedenbeck, M., Van Den Kerkhof, A. M., Kronz, A., and Simon, K. (2003). Trace Elements in Quartz - a Combined Electron Microprobe, Secondary Ion Mass Spectrometry, Laser-Ablation ICP-MS, and Cathodoluminescence Study. ejm 15, 747–763. doi:10.1127/0935-1221/2003/0015-0747
Müller, A., Behr, H. J., and Kerkhof, A. M. (2009). The Evolution of Late Hercynian Granites and Royalties Documented by Quartz: A Review. Earth Environ. Sci. Trans. R. Soc. Edinb. 100, 3549. doi:10.1017/s1755691009016144
Müller, A., Breiter, K., Seltmann, R., and Pécskay, Z. (2005). Quartz and Feldspar Zoning in the Eastern Erzgebirge Volcano-Plutonic Complex (Germany, Czech Republic): Evidence of Multiple Magma Mixing. Lithos 80 (1), 201–227. doi:10.1016/j.lithos.2004.05.011
Müller, A., Herklotz, G., and Giegling, H. (2018). Chemistry of Quartz Related to the Zinnwald/Cínovec Sn-W-Li Greisen-type deposit, Eastern Erzgebirge, Germany. J. Geochemical Exploration 190, 357–373. doi:10.1016/j.gexplo.2018.04.009
Müller, A., Herrington, R., Armstrong, R., Seltmann, R., Kirwin, D. J., Stenina, N. G., et al. (2010). Trace Elements and Cathodoluminescence of Quartz in Stockwork Veins of Mongolian Porphyry-Style Deposits. Miner Deposita 45, 707–727. doi:10.1007/s00126-010-0302-y
Müller, A., and Koch-Müller, M. (2009). Hydrogen Speciation and Trace Element Contents of Igneous, Hydrothermal and Metamorphic Quartz from Norway. Mineral. Mag. 73, 569–583. doi:10.1180/minmag.2009.073.4.569
Müller, A., Seltmann, R., and Behr, H.-J. (2000). Application of Cathodoluminescence to Magmatic Quartz in a Tin Granite - Case Study from the Schellerhau Granite Complex, Eastern Erzgebirge, Germany. Mineralium Deposita 35, 169–189. doi:10.1007/s001260050014
Müller, A., Thomas, R., Wiedenbeck, M., Seltmann, R., and Breiter, K. (2006). Water Content of Granitic Melts from Cornwall and Erzgebirge: A Raman Spectroscopy Study of Melt Inclusions. ejm 18, 429–440. doi:10.1127/0935-1221/2006/0018-0429
Müller, A., Wiedenbeck, M., Flem, B., and Schiellerup, H. (2008). Refinement of Phosphorus Determination in Quartz by LA-ICP-MS through Defining New Reference Material Values. Geostandards Geoanalytical Res. 32, 361–376. doi:10.1111/j.1751-908x.2008.00901.x
Pagel, M., and Orberger, B. (2000). Diagenetic Evolution of Cretaceous Siltstones From Drill Core MAR 501 (South-Eastern France). J. Geochem. Explor. 69, 115–118.
Peng, H.-j., Mao, J.-w., Hou, L., Shu, Q.-h., Zhang, C.-q., Liu, H., et al. (2016). Stable Isotope and Fluid Inclusion Constraints on the Source and Evolution of Ore Fluids in the Hongniu-Hongshan Cu Skarn Deposit, Yunnan Province, China. Econ. Geology. 111, 1369–1396. doi:10.2113/econgeo.111.6.1369
Peng, H.-j., Mao, J.-w., Pei, R.-f., Zhang, C.-q., Tian, G., Zhou, Y., et al. (2014). Geochronology of the Hongniu-Hongshan Porphyry and Skarn Cu deposit, Northwestern Yunnan Province, China: Implications for Mineralization of the Zhongdian Arc. J. Asian Earth Sci. 79, 682–695. doi:10.1016/j.jseaes.2013.07.008
Peng, H.-j., Zhang, C.-q., Mao, J.-w., Santosh, M., Zhou, Y.-m., and Hou, L. (2015). Garnets in Porphyry-Skarn Systems: A LA-ICP-MS, Fluid Inclusion, and Stable Isotope Study of Garnets from the Hongniu-Hongshan Copper deposit, Zhongdian Area, NW Yunnan Province, China. J. Asian Earth Sci. 103, 229–251. doi:10.1016/j.jseaes.2014.10.020
Peng, H. J., Lin, H., Sun, C., Zou, H., Wang, T. R., and Ma, Z. Z. (2021). Geochemistry of Magnetite from the Hongniu-Hongshan Cu Skarn deposit in Yunnan Province, SW China. Ore Geology. Rev. 136 (2021), 104–237. doi:10.1016/j.oregeorev.2021.104237
Peng, H. J., Wang, X. W., Qin, Z. P., Hou, L., and Zhou, Y. (2010b). The Characteristics of Cathodoluminescence Visualized Microstructure in Quartz: A Case Study from the Jiama Igneous Rock in Tibet. Bull. Mineralogy, Pet. Geochem. 29 (3), 45–52. (in Chinese).
Peng, H. J., Wang, X. W., Qin, Z. P., Hou, L., and Zhou, Y. (2010c). The Magmatic Hydrothermal Transition Evidence from Mineralogy of the Jiama Copper Polymetallic deposit in Tibet. Unpublished: Journal of Chengdu University of Technology Science. (in Chinese with English abstract).
Peng, H. J., Wang, X. W., Tang, J. X., Qin, Z. P., Zhou, Y., and Hou, L. (2010a). The Application of Quartz Cathodoluminescence in Study of Igneous Rock. Rock Mineral. Anal. 29 (2), 65–73. (in Chinese with English abstract).
Penniston-Dorland, S. C. (2001). Illumination of Vein Quartz Textures in a Porphyry Copper Ore deposit Using Scanned Cathodoluminescence: Grasberg Igneous Complex, Irian Jaya, Indonesia. Am. Mineral. 86, 652–666. doi:10.2138/am-2001-5-606
Peppard, B. T., Steele, I. M., Davis, A. M., Wallace, P. J., and Anderson, A. T. (2001). Zoned Quartz Phenocrysts from the Rhyolitic Bishop Tuff. Am. Mineral. 86, 1034–1052. doi:10.2138/am-2001-8-910
Perny, B., Eberhardt, P., Ramseyer, K., Mullis, J., and Pankrath, R. (1992). Microdistribution of Al, Li, and Na in Alpha Quartz: Possible Causes and Correlation with Short-Lived Cathodoluminescence. Am. Mineral. 77, 534–544.
Pokrovski, G. S., and Schott, J. (1998). Thermodynamic Properties of Aqueous Ge(IV) Hydroxide Complexes from 25 to 350°C: Implications for the Behavior of Germanium and the Ge/Si Ratio in Hydrothermal Fluids. Geochimica et Cosmochimica Acta 62, 1631–1642. doi:10.1016/s0016-7037(98)00081-7
Qu, X. M., Jiang, J. H., Xin, H. B., and Chen, H. (2010). A Study of Two Groups of Adakite Almost Simulteneously Formed in Gangdese Collisional Orogen, Tibet: Why Does One Group Contain Copper Mineralization and the Other Not. Mineral. Deposits 29 (3), 382–390. (in Chinese with English abstract).
Ramseyer, K., and Müllis, J. (1990). Factors Influencing Short-Lived Blue Cathodoluminescence of Alpha-Quartz. Am. Mineral. 75, 791–800.
Remond, G., Cesbron, F., and Chapoulie, R. (1992). Cathodoluminescence Applied to the Micro Characterization of mineral Materials: A Present Status in Experimentation and Interpretation. Scanning Microsc. 6 (1), 23–68.
Rusk, B. (2012). Cathodoluminescent Textures and Trace Elements in Hydrothermal Quartz. Springer Geology. 2197-9545, 307–329. doi:10.1007/978-3-642-22161-3_14
Rusk, B. G., Lowers, H. A., and Reed, M. H. (2008). Trace Elements in Hydrothermal Quartz: Relationships to Cathodoluminescent Textures and Insights into Vein Formation. Geol 36, 547–550. doi:10.1130/g24580a.1
Rusk, B. G., Reed, A. H., Dilles, J. H., and Kent, A. J. R. (2006). Intensity of Quartz Cathodoluminescence and Trace-Element Content in Quartz from the Porphyry Copper deposit at Butte, Montana. Am. Mineral. 91, 1300–1312. doi:10.2138/am.2006.1984
Rusk, B., Koenig, A., and Lowers, H. (2011). Visualizing Trace Element Distribution in Quartz Using Cathodoluminescence, Electron Microprobe, and Laser Ablation-Inductively Coupled Plasma-Mass Spectrometry. Am. Mineral. 96, 703–708. doi:10.2138/am.2011.3701
Rusk, B., and Reed, M. (2002). Scanning Electron Microscope-Cathodoluminescence Analysis of Quartz Reveals Complex Growth Histories in Veins from the Butte Porphyry Copper deposit, Montana. Geol 30, 727–730. doi:10.1130/0091-7613(2002)030<0727:semcao>2.0.co;2
Sengör, A. M. C., and Natal, B. A. (1996). Paleotectonics of Asia: Fragments of a Synthesis. World Reg. Geology. 8, 486–640.
Smith, J. V., and Stenstrom, R. C. (1965). Electron-Excited Luminescence as a Petrologic Tool. J. Geology. 73, 627–635. doi:10.1086/627098
Smith, V. C., Shane, P., and Nairn, I. A. (2004). Reactivation of a Rhyolitic Magma Body by New Rhyolitic Intrusion before the 15.8 Ka Rotorua Eruptive Episode: Implications for Magma Storage in the Okataina Volcanic Centre, New Zealand. J. Geol. Soc. 161, 757–772. doi:10.1144/0016-764903-092
Soltani Dehnavi, A., McFarlane, C. R. M., Lentz, D. R., and Walker, J. A. (2018). Assessment of Pyrite Composition by LA-ICP-MS Techniques from Massive Sulfide Deposits of the Bathurst Mining Camp, Canada: from Textural and Chemical Evolution to its Application as a Vectoring Tool for the Exploration of VMS Deposits. Ore Geology. Rev. 92, 656–671. doi:10.1016/j.oregeorev.2017.10.010
Song, B., Cai, X., and Xu, X. (2006). Cenozoic Hot-spring Exhalative Mineralization Hongshan Copper-Polymetallic deposit in Zhongdian, NW Yunnan. Chin. J. Geology. 41, 700–710. (in Chinese with English abstract).
Takahashi, M., Mizuta, T., Ishiyama, D., Kimura, J., and Takada, J. (2002). Characteristics of Trace Elements in Quartz by LA-ICP-MS and the Origin of Ore Fluid Responsible for Gold Mineralization at the Hishikari Epithermal Gold deposit, Japan. Resource Geology. 52, 51–67. (in Japanese).
Thomas, J. B., Bruce Watson, E., Spear, F. S., Shemella, P. T., Nayak, S. K., and Lanzirotti, A. (2010). TitaniQ under Pressure: the Effect of Pressure and Temperature on the Solubility of Ti in Quartz. Contrib. Mineral. Petrol. 160, 743–759. doi:10.1007/s00410-010-0505-3
Tian, Z. D., Leng, C. B., Zhang, X. C., Zafar, T., and Lai, C. K. (2019). Chemical Composition, Genesis and Exploration Implication of Garnet from the Hongshan Cu-Mo Skarn deposit, SW China. Ore Geology. Rev. 112, 103–106. doi:10.1016/j.oregeorev.2019.103016
Ting, G. L., Rui, Z. H., and Xian, W. (2018). Metasomatized Asthenospheric Mantle Contributing to the Generation of Cu-Mo Deposits within an Intracontinental Setting: a Case Study of the ∼128 Ma Wangjiazhuang Cu-Mo deposit, Eastern North China Craton. J. Asian Earth Sci. 160, 460–489.
Wang, P., Dong, G., Santosh, M., Liu, K., and Li, X. (2016). Copper Isotopes Trace the Evolution of Skarn Ores: a Case Study from the Hongshan-Hongniu Cu deposit, Southwest china. Ore Geology. Rev. 88, 822–831.
Wang, S. X., Bi, X. W., and Leng, C. B. (2011). LA-ICP-MS Zircon U-Pb Dating of Granite Porphyry in the Hongshan Cu-Polymetallic deposit, Zhongdian, Northwest Yunnan, China and its Geological Implication. Acta Mineralogica Sinica 31, 315–321. (in Chinese with English abstract).
Wang, S. X., Zhang, X. C., and Leng, C. B. (2008). Stable Isotopic Compositions of the Hongshan Skarn Copper deposit in the Zhongdian Area and its Implication for the Copper Mineralization Process. Acta Petrologica Sinica 24, 480–488. (in Chinese with English abstract).
Wark, D. A., Hildreth, W., Spear, F. S., Cherniak, D. J., and Watson, E. B. (2007). Pre-eruption Recharge of the Bishop Magma System. Geology 35, 235–238. doi:10.1130/g23316a.1
Wark, D. A., and Watson, E. B. (2006). TitaniQ: a Titanium-In-Quartz Geothermometer. Contrib. Mineral. Petrol. 152, 743–754. doi:10.1007/s00410-006-0132-1
Wertich, V., Leichmann, J., Dosbaba, M., and Götze, J. (2018). Multi-Stage Evolution of Gold-Bearing Hydrothermal Quartz Veins at the Mokrsko Gold Deposit (Czech Republic) Based on Cathodoluminescence, Spectroscopic, and Trace Elements Analyses. Minerals 8, 335. doi:10.3390/min8080335
Xiong, F. H., Ma, C. Q., Jiang, H. A., Liu, B., and Huang, J. (2014). Geochronology and Geochemistry of Middle Devonian Mafic Dykes in the East Kunlun Orogenic Belt, Northern Tibet Plateau: Implications for the Transition from Prototethys to Paleotethys Orogeny. Chemie Der Erae-Geochem. 74 (2), 225–235.
Xu, J., Xie, G. D., and Xiao, Y. (2018). Dynamic Analysis of Ecological Environment Quality Combined with Water Conservation Changes in National Key Ecological Function Areas in China. Sustainability 3987, 2071–2105.
Xu, Z. Q., Yang, J. S., and Li, H. Q. (2012). Indosinian Collision-Orogenic System of Chinese Continent and its Orogenic Mechanism. Acta Petrologica Sinica 28, 1697–1709. (in Chinese with English abstract).
Yang, Z. M., Hou, Z. Q., Li, Z. Q., Song, Y. C., and Xie, Y. L. (2008). Direct Record of Primary Fluid Exsolved from Magma: Evidence from Unidirectional Solidification Texture (UST) in Quartz Found in Qulong Porphyry Copper deposit, Tibet. Mineral. Deposits 27, 188–199. (in Chinese with English abstract).
Keywords: Hongniu–Hongshan deposit, quartz, cathodoluminescence, trace elements, skarn
Citation: Wang S-l, Peng H-j, Wang T-r, Zou H, Zhou Q, Yang D-j, Sun C and Tian X (2022) Trace Element Composition and Cathodoluminescence of Quartz in the Hongniu–Hongshan Skarn Deposit in Yunnan Province, Southwest China. Front. Earth Sci. 10:864118. doi: 10.3389/feart.2022.864118
Received: 28 January 2022; Accepted: 29 March 2022;
Published: 11 May 2022.
Edited by:
Leon Bagas, China Geological Survey, ChinaReviewed by:
Qihai Shu, China University of Geosciences, ChinaLin Hou, Chengdu Geological Survey Center, China
Copyright © 2022 Wang, Peng, Wang, Zou, Zhou, Yang, Sun and Tian. This is an open-access article distributed under the terms of the Creative Commons Attribution License (CC BY). The use, distribution or reproduction in other forums is permitted, provided the original author(s) and the copyright owner(s) are credited and that the original publication in this journal is cited, in accordance with accepted academic practice. No use, distribution or reproduction is permitted which does not comply with these terms.
*Correspondence: Hui-juan Peng, MzQ2NjY1NDAxQHFxLmNvbQ==