 Junhua Zhu
- 1School of Civil Engineering and Architecture, East China Jiaotong University, Nanchang, China
- 2Engineering Research and Development Centre for Underground Technology of Jiangxi Province, Nanchang, China
- 3Communications Design and Research Institute Co., Ltd. of Jiangxi Prov., Nanchan, China
- 4China Jikan Research Institute of Engineering Investigations and Design Co., Ltd., Xi'an, China
- 5Sichuan Highway Planning, Survey, Design and Research Institute Ltd., Chengdu, China
A reservoir area is mostly located in the canyon area, and the geological structure is complex. There are a large number of unstable slopes on the bank of the reservoir. The stability of bank slope is greatly affected by water storage and reservoir water regulation. In addition, sudden rainstorm and other external factors can reduce slope stability. In this article, the physical model test is used to study the seepage field and deformation characteristics of typical reservoir bank slopes with sand layers under different rainfall intensities, different water level fluctuation rates, and their coupling effects. The model has a length of 4.0 m, a width of 1.0 m, and a height of 0.9 m, and the piezometers and white balls are used to monitor the pore water pressures and displacements inside the slope model individually. The results show that the responsiveness of pore water pressure inside the slope lags behind both water level fluctuation and rainfall. The lag time is inversely proportional to the water level fluctuation rates under the single water level fluctuation condition, while it is proportional to water level fluctuation rates in the water level decline stage under the coupling effect condition. The rapid impoundment of the reservoir area has a strengthening effect on the stability of the reservoir bank slope. However, accelerated deformation of the slope occurs in the stage of water level decline, and the deformation rate is proportional to the water level fluctuation rates.
Introduction
A reservoir area is located in the gorge where the geological structure is complex. There are many unstable slopes on the bank of the reservoir, whose stabilities are greatly affected by the regulation of reservoir storage (Jiang et al., 2019). In addition, other external effects, such as sudden rainstorms, may lead to instability and failure. Compared with landslides in mountainous areas, landslides around reservoir banks are involved in various boundary conditions, including immersion infiltration of reservoir water, wave erosion, and water level fluctuation. The complete understanding of the deformation and failure characteristics, stability evolution law, and instability mechanism of reservoir landslides is the key to preventing and controlling geological disasters in reservoir areas.
In 1987, Gatto and Doe (1987) suggested that most of the bank collapses could be associated with the reservoir water level and the effect of wind-wave erosion. They concluded that the bank collapse should be treated as a site-specific problem because of the complexity and variability of numerous factors that may contribute to the collapse. In recent years, research on reservoir landslides has developed rapidly. Many previous field investigations have revealed that layered soil influenced the rainfall water movement and distribution of water content, which are two factors determining slope failures. However, the influence of an intermediate coarse layer on slope failure is still not evident due to many uncontrollable factors of a natural slope, such as the slope angle and rainfall intensity, (Hamrouni et al., 2019). Sengani and Mulenga (2020) used FLACSlope [Numerical software “Finite Difference Method (FDM)”] to simulate FoS and pore water pressure in sunny and rainy conditions of the Thulamela Municipality roads (R523); the results show that extreme rainfall can reduce the shear strength and resistance of the soil slope material. Bogaard and Greco (2016) thought that rainfall was one of the most common hazards responsible for triggering landslides. Some researchers think that the hydrology in and around a landslide area leads the pore pressure to replace the soil skeleton stress; as a result, the shear strength of the soil is reduced. Tang et al. (2020) evaluated the influence of the middle coarse layer on the slope stability during heavy rainfall through physical model tests; he found that intermediate coarse layers embedded between finer ones may initially confine the infiltration within the overlying finer layers, delaying the infiltration and eventually inducing a lateral flow diversion in the inclined slope. With the rigid body limit equilibrium method, Sun et al. (2017) studied the long-term stability of reservoir bank slope under the influence of periodic rainfall and fluctuation of reservoir water level.
By using the finite element numerical method to model the fluid-solid coupling effect, Wang et al. (2007) analyzed the stress field, seepage field, and stability of reservoir slope under the effect of water level fluctuation and pointed out that the sudden drop in water level was the main factor leading to the instability of the slope. Jiao et al. (2014) used the discontinuous deformation analysis method (DDA) to simulate the failure process of the Qian Jiang Ping landslide in the Three Gorges Reservoir area. Zhang et al. (2018) classified the slope failure mechanisms of the Da Gang Shan reservoir into creep–shear–tension failure and toppling–tensile–shear models. Min et al. (2013) monitored the Shi Liu Shu Bao landslide in the Three Gorges Reservoir area for many years and found that the deformation of the shallow landslide was mainly controlled by rainfall, while the change in the reservoir water level had a significant influence on the stability of deep landslide. (Hu et al. 2017b) studied the evolution process of the anti-landslide pile system by using a variety of field monitoring methods. Ji et al. (2018) studied the effects of slope gradient, material grain-size diameter, material density, wave height, and water level fluctuation on the bank collapse by orthogonal experiments. They found that slope gradient is the most sensitive factor affecting the bank collapse width, followed by soil density, clay proportion, wave height, and water level.
According to the existing literature, there are few research that focuses on the mechanism of bank slope with sand layer under hydro-mechanical coupling effects. In this article, a typical bank slope with a sand layer around a water conservancy and shipping hub reservoir was selected as the research object. By referring to some geological survey reports about this reservoir area, the large-scale indoor model test was designed to study the stability and deformation failure characteristics of slope under the conditions of different rainfall intensities (R), different water level fluctuation rates (V), and rainfall-coupled water level fluctuation. This study provides a certain reference for revealing the instability mechanism of the reservoir bank slope.
Methods and Materials
The Xin Gan shipping hub is located in Ji’an City, Jiangxi Province, China; it is in the subtropical humid monsoon climate zone. The geomorphic units include structural denudation of middle and low mountains, denudation of hills and gully terrain, river erosion accumulation landform (Ganjiang alluvial plain); low denudation hills and gully terrain are y given out first, followed by alluvial plain. The Ganjiang River Basin is in the East Asian monsoon region with a humid subtropical climate, where the annual average temperature is between 17.2 and 19.3°C, and the extreme highest and the lowest temperatures are 41.6°C and −14.3°C, respectively. The average annual precipitation is 1,300–1,800 mm, and the maximum daily rainstorm occurs mainly from April to September. Heavy rainstorms are concentrated in frontal rain from May to June, and are mainly affected by typhoons from July to September.
In order to improve the irrigation conditions of farmland in the Xin Gan area and avoid crop waterlogging disasters, large-scale field lifting operations were carried out on agricultural canals, bucket canals, bucket ditches, and agricultural ditches. The total area is 656.45 mu and its elevation is 33–36 m. After field lifting, the typical slope becomes complicated, and it is composed of low-surface permeability weathered material, a middle fine sand layer, and bottom silty clay. In the reservoir area, the water level fluctuates between 5 and 8 m, and the slope stability changes obviously when rainfall happens. Therefore, it is of great practical significance to explore the stability of the slope under the effect of water level fluctuation in the rainy season.
According to the topography of the reservoir area, a simplified physical model of reservoir bank slope is constructed. Considering the test conditions, the scale ratio of this model is determined as 1:15. The height of the slope model is 0.86 m, the length of the slope toe is 2.73 m, the angle of the lower steep slope is 44.3°, and the angle of the upper slope is 19.6°. The geological structure in the reservoir area is simplified and contains three different soil layers: the upper soil layer (0.13 m), the middle sand layer (0.2 m), and lower silty clay (0.53 m).
Selection of Similar Materials
According to the similarity theorem (Stull, 1988), in order to ensure the lateral similarity between the physical model and the real case, the physical and mechanical properties and seepage characteristics of the model material need to be considered simultaneously. The geometric similarity coefficient, Cl = n = 15, with the dimensional analysis method, and related properties of the model material are determined as follows:
In the formula Cρ, Cg, Cε, Cφ, Ck, Cc, Cq, and Cv are density similarity coefficient, gravity acceleration similarity coefficient, strain similarity coefficient, internal friction angle similarity coefficient, permeability similarity coefficient, cohesion similarity coefficient, rainfall intensity similarity coefficient, and water level fluctuation rate similarity coefficient, respectively.
In this test, the weathered soil collected in the field with low permeability is used in the upper layer. The quartz sand is used as the permeable layer in the middle, and the lower silty clay is made of quartz sand, bentonite, and silty clay as the matching materials. The quartz sand and silty clay are mainly used to adjust the strength of similar materials, and bentonite is mainly used as the binder. Through a large number of laboratory tests, the physical and mechanical properties of similar materials in each group were comprehensively analyzed and compared, and the ratio of similar materials in the lower silty clay was finally determined, as shown in Table 1.
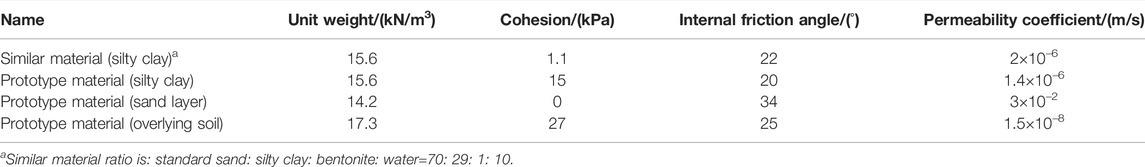
TABLE 1. Comparison of the silty clay parameters.
Testing Apparatus
As shown in Figure 1, the model box has a length of 4.0 m, a width of 1.0 m, and a height of 0.9 m. It consists of three parts: the rainfall control system, the water level control, and the monitoring system. The transverse sides of the model box are toughened glass, and the longitudinal ends are steel plates. In the meantime, the gridline with 10 cm spacing and the contour line after slope scaling are attached to the toughened glass outside. The outlet is designed at the bottom of the front slope, and the water supply hose, micro flowmeter, and spherical solenoid valve with V port are connected to realize accurate water level control. The rainfall system is set on the rainfall bracket above the model box.
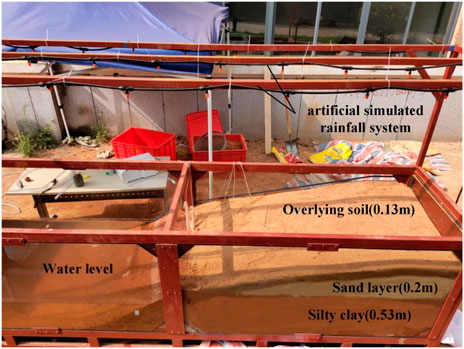
FIGURE 1. Physical model box.
Monitoring System
Each soil layer was filled into the model box according to the required compaction level. Then, white foam balls were arranged at the grid intersection and slope surface, among which 6 balls were selected as reference points to analyze the displacement and deformation during failure. Seepage in the slope was monitored by embedding six piezometers with a measuring range from −10 to 10 kPa and an accuracy of ±0.1%FS (P1–P6) (Figure 2). As shown in Figures 2B,C, in the process of slope filling, the piezometers and white balls are buried, and the piezometers are buried in the soil layer between 0.33 and 0.53 m; the balls are placed close to the glass for observation conveniently. Continuous detection was carried out within 2 h after each test. Subsequently, the displacement of D1–D6 was expressed by the relative displacement between the grids and white balls measured by the camera per hour.
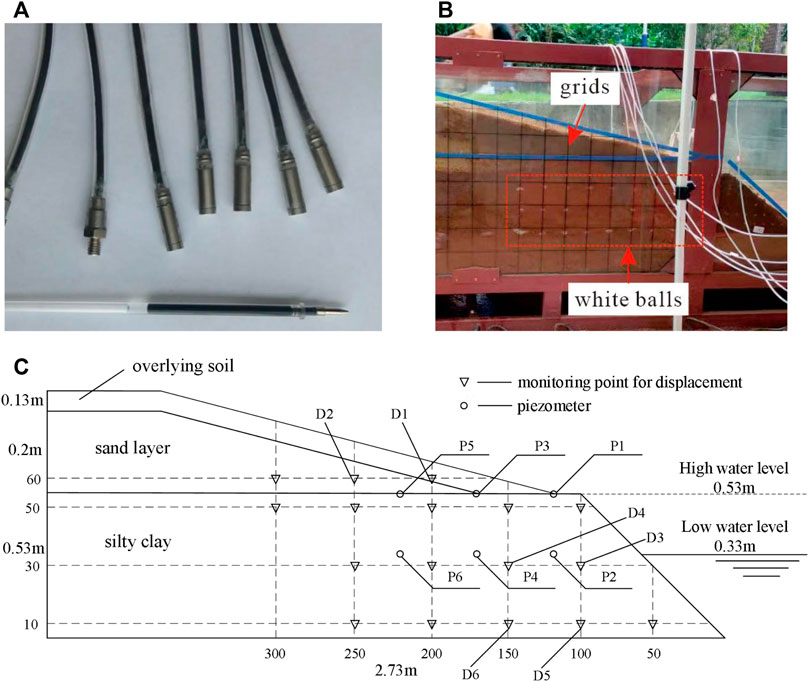
FIGURE 2. Monitoring system. (A) Piezometers; (B) white balls and grids buried in the model box; and (C) piezometer and displacement monitoring points.
Test Scheme
According to the real project, the average annual rainfall during the operation of the reservoir area is 1,300–1,800 mm, and half of the rainfall is concentrated in the rainy season (from April to September). On this basis, the most unfavorable factors are considered, which means that the rainfall intensity R is 0.002 m/h, 0.003 m/h, and 0.004 m/h, and the rainfall is annually uniform. The complete water level fluctuation from the highest level (0.53 m) to the lowest level (0.33 m) with three different fluctuation rates V (0.5 m/d, 1.0 m/d, and 1.5 m/d) is considered in tests. Under the coupling effect, the maximum rainfall intensity R (0.004 m/h) is applied when the water level of the slope model rises to 0.53 m and then drops back to 0.33 m at different fluctuation rates. The specific test conditions are shown in Table 2.
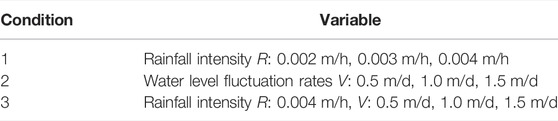
TABLE 2. Design of working conditions.
Results
Condition 1: Different Rainfall Intensities
The static water level was controlled at 0.53 m to study the change in pore water pressure in the slope during rainfall. Three rainfall intensities R of 0.002 m/h, 0.003 m/h, and 0.004 m/h were set, and lasted for 38 h. The measured data from piezometers P3 and P4 and displacement monitoring points D1, D2, and D4 were selected for analysis.
It can be seen from Figure 3 that under the single effect of rainfall, the overall change trend of seepage in the slope is similar, and the response speed and variation amplitude of pore water pressure at each monitoring point are proportional to R. When R = 0.004 m/h, at the 15th hour, the pore water pressure of P3 rapidly increased to −0.9 kPa and slowly decreased to −1.28 kPa in the next 9 h. After the process, the pore water pressure curve tended to be gentle. This surge phenomenon gradually disappeared with the decrease of R (0.002 m/h, 0.003 m/h). At the same time, it can be found that as P3 decreased, the pore pressure at the monitoring point P4 also increased rapidly, roughly the same as the displacement of monitoring points, which became stable as the deformation reached the maximum value. Under the impacts of rainfall, slope runoff, and transient saturation, the displacement of monitoring points D1 and D2 is larger than that of D4. When R = 0.004 m/h, the maximum displacement difference between D1 and D4 reached 0.24 cm, and the displacement at D2 also increased significantly.
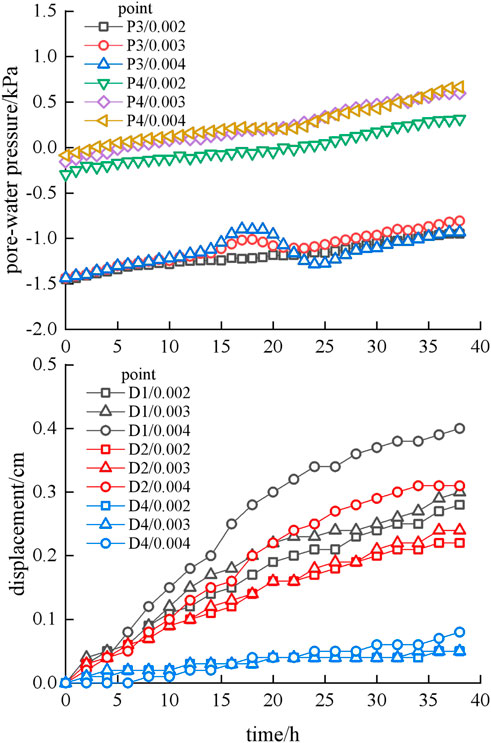
FIGURE 3. Pore water pressure of P3 and P4 and displacement of D1, D2, and D4 in condition 1.
Condition 2: Different Water Level Fluctuation Rates
Figure 4 shows that the pore water pressure of slope presents the same variation characteristics of first increasing, stabilizing, and then decreasing. The variation characteristic lags behind the water level fluctuation, and lag time is inversely proportional to V. The piezometers P1 and P3, which lie in the upper layer, responded rapidly when the water level rises to the height of the monitoring points. By contrast, the piezometers P2, P4, and P6, which lie in the deeper layer, have lag time scales of 2–6 h. With the increase of V, the lag time is getting shorter. This result is in contrast with Jiang et al. (2019), which indicates that the lag time is proportional to V in a loess slope during the water level decline process.
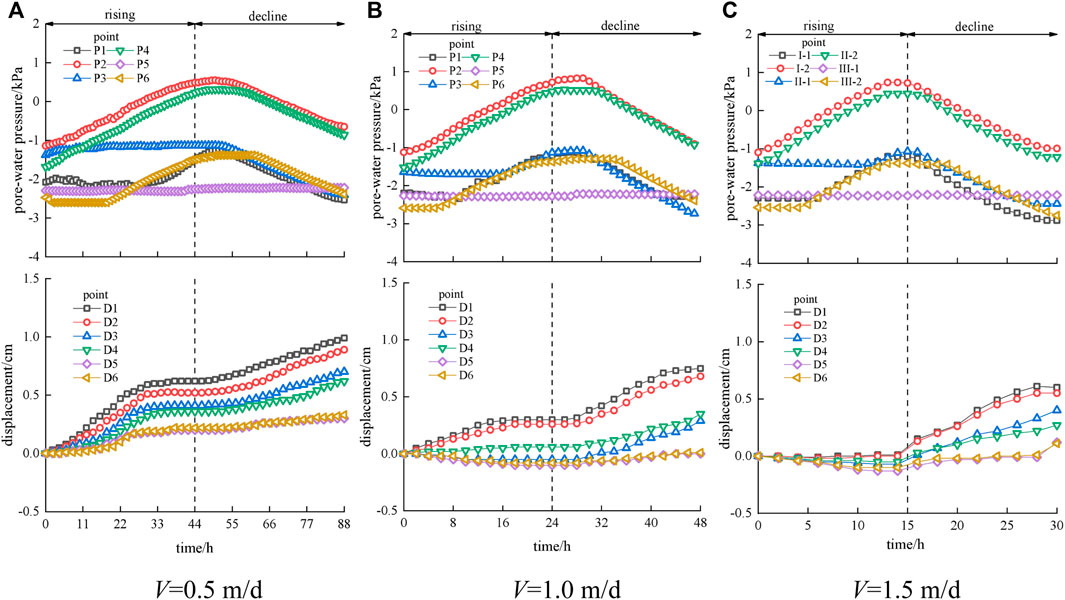
FIGURE 4. Pore water pressure and displacement under different water level fluctuation rates in front of slope.
According to the displacement monitoring data, the negative impact on the slope stability during the decline process is greater than that during the rising process, and as the value of V increases, even the rising process even plays a positive role in promoting the slope stability (Huang, 2007; Macfarlane, 2009; Qi-Lang et al., 2011; Li et al., 2018; Wang et al., 2019). We can find that the displacement caused by the water rising effect is negative when the values of V are 1.0 m/d and 1.5 m/d (Figures 4B,C), and the deformation rates during the decline process decrease with increasing V. However, when the V is 0.5 m/d, no negative value occurs and the deformation rates are larger. It also shows that the closer to the slope surface, the larger the displacement value is. Meanwhile, the displacement caused by water level fluctuations is larger than that caused by rainfall. In other words, water level fluctuation exhibits a greater impact on the slope stability than rainfall within a certain range and plays a dominant role in triggering landslides (Calcaterra et al., 2000; Guan et al., 2005).
Condition 3: Coupled Hydro-Mechanical Effect
Figure 5 presents the pore water pressure and displacement curves of the slope caused by the coupling effect of different water level fluctuation rates and rainfall. It shows that the variation characteristics of pore water pressure are similar to those under condition 2. However, its lag time is proportional to V. The peak value of P1, which is near the slope surface, increases slightly compared with that under condition 2, and the lag times of P3 and P6 are shortened to 2–4 h. However, because of the thicker covering layer, longer permeability path, and larger horizontal permeability coefficient of the sand layer, the pore water pressure curves of P5 maintain flat and the rainwater converges to P1 and P3.
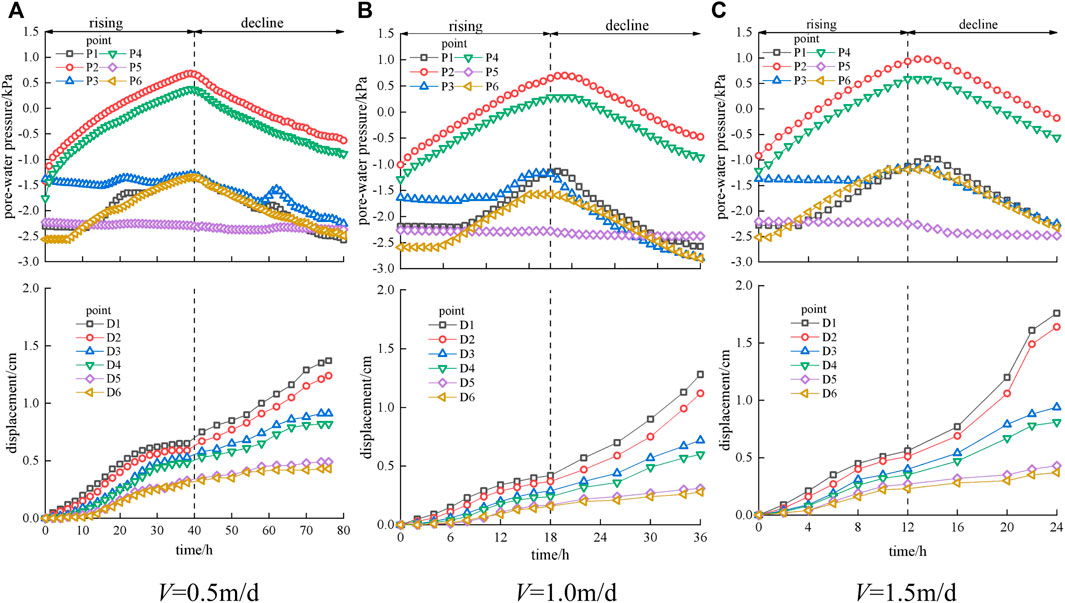
FIGURE 5. R=0.004 m/h, pore water pressure and displacement under different water level fluctuation rates in front of slope.
The pore water pressures of P1 and P3 present a phenomenon of sudden increase and then decrease in the decline process of V = 0.5 m/d (Figure 5A), but this phenomenon cannot be observed when V=1.0 m/d and V=1.5 m/d. From the displacement curves, it appears that negative displacement would not be observed in the rising process of the coupling effect condition. Compared with those under the other two conditions, the deformation rates and final displacement under this condition are larger and the final displacement is proportional to V. It also shows that the closer to the slope surface, the larger the displacement value is. At the same time, the result shows that the deformation rates are converged in the rising process and accelerated in the declining process, and that the acceleration inflection points are consistent with the time of the decline point of pore water pressure.
Discussion
Rainfall Infiltration Regulation
Figure 6 shows the envelope of the moist front based on the variation of pore water pressure at each measuring point under different rainfall intensities and external observation during the test. The results reveal that the migration range of moist front is enhanced as the rainfall rate increases.

FIGURE 6. Envelopes of moist front inside slope under different rainfall intensities.
The result in Figure 3A shows a phenomenon where the pore water pressure of P3 suddenly increases and then decreases. This phenomenon has a significant difference from the homogenous silty clay slope whose pore water pressure monotonically increases during persistent rainfall (Fakher Hamrouni et al., 2019). The reason is that P3 is located at the junction of three layers of soil. When the rainfall intensity is low, the infiltration process is relatively smooth in the upper weathered soil layer. When rainwater infiltrates the junction of multi-layer soil, due to the difference in permeability coefficient between upper and lower soil layers, the lower soil layer forms an air-water film on the interface of the soil layer caused by the action of matrix suction, which resists the further downward seepage of pore water. At present, a closed soil shell forms in the upper layer and the pore air of the lower layer is compressed such that the resisted pore water is concentrated at the junction, causing a sharp increase in the pore water pressure of P3.
With the continuous infiltration of rainfall, the pore air escapes through the soil pore as the pore air pressure increases to the maximum value to break the air-water film. At this time, a local drainage channel appears in the sand layer, so that the water gathered at the interface quickly migrates to the sand layer. Due to the larger permeability coefficient of the sand layer, the rainwater infiltrates rapidly so that the pore water pressure curve drops to a low situation (He et al., 2021; Hu et al., 2017a; Mein & Larson, 1973; Prete et al., 1998; Wei et al., 2018). But, with the increase of rainfall intensity R, the pore water pressure of the upper layer caused by rainwater infiltration is too large to break the air-water film quickly that the moist front migrates to the sand layer rapidly. Therefore, the phenomenon of sharply increased P3 gradually disappears. Slip deformation of the upper layer driven by seepage force has a significant influence on the overall stability of the slope (Song et al., 2011; Sun et al., 2014; Huang et al., 2017a; Mandal et al., 2019; Zhao et al., 2020).
Discussion on Seepage Field Characteristics Under Hydro-Mechanical Coupling
The internal seepage of reservoir bank slope with sand layer is an extremely complex process caused by the water-force coupling effects. As mentioned above, the response of pore water pressure inside the slope lags behind water level fluctuation and rainfall, and the change of pore water pressure in the shallow slope is higher than that in the deep slope. However, there is an opposite result to the single water level fluctuation condition where the lag time in the decline process of the coupling effect condition is proportional to V and is shorter. This phenomenon, different from the research results of many scholars, is closely related to the existence of sand layer inside the slope (Liu et al., 2005; Jin et al., 2012; Shen et al., 2018; Xu et al., 2018).
In the single water level fluctuation condition, as the permeability coefficient of the sand layer is much larger than those of upper weathered soil and lower clay soil, water migrates and accumulates in the sand layer rapidly after the surface soil is saturated in the rising process. Then the stored water in the sand layer, similar to a small reservoir, is replenished to the outward of slope in the decline process. Throughout the process, according to Darcy law, v = ki, the smaller V, the smaller the Δh (which refers to the water head difference per unit time) , and the smaller the hydraulic gradient i and permeability rate v of water in soil are, resulting in a larger lag time of pore pressure. Therefore, the lag time is inversely proportional to the water level fluctuation rates.
In the coupling effect condition, the seepage situation of the single water level fluctuation changes because of the increasing rainfall. As the rainwater is replenishing the sand layer, a longer duration of rainfall occurs with a smaller water level fluctuation rate. As a result, a higher groundwater level caused by rainwater infiltration forms in the sand layer. When the water level declines, there exists a larger instantaneous water head difference Δh during a lower water level fluctuation rate, and the pore water pressure responds more rapidly. Therefore, the lag time of the decline process is proportional to the water level fluctuation rate.
Figure 5A shows that a consistent phenomenon of sudden increase and then decrease occurs on the pore water pressure curves of P1 and P3 when V = 0.5 m/d. This is because when the water level decreases to a certain degree, the water head difference between the sand layer and the outside water level caused by continuous rainfall infiltration will increase, and the pore water pressure of the junction of multi-layer soil will increase sharply. It shows that for the reservoir bank slope with a sand layer, the influence of rainfall on the slope stability is more significant than that of water level fluctuation when the water level fluctuation rate is less than a certain degree that needs further exploration.
Discussion on Deformation Characteristics Under Coupled Hydro-Mechanical Effect
According to the results, the final displacements of slope caused by coupled rainfall and water level fluctuation are larger than those under the other two conditions, and the displacements caused by single rainfall infiltration are the lowest. In addition, the displacement near the slope surface is larger than that inside of the slope. This finding indicates that the deformation of the slope is developing from surface to inside in the three conditions.
As shown in Figure 7, in single water level fluctuation condition, the development of the slope plastic zone is inhibited, and the overall deformation rates of the slope are small, even producing negative values of slope displacement at the fluctuation rate of 1.5 m/d. It means that the larger the water level rising rate is, the smaller the slope displacements are. The reason is that, as the water level rises, an anti-sliding force is generated and enlarged continuously in the front of the slope with the increase in hydrodynamic pressure. Meanwhile, the water level outside the slope is higher than that inside the slope, so that the seepage force towards the inside slope is produced and becomes larger with the increase of the water level fluctuation rate. Therefore, at the prophase of the water level rising process, rapid water storage has a certain stabilizing effect on the front edge of the slope (Wang, 2000; Nardi et al., 2012; Peng, 2014; He et al., 2018; Jiading et al., 2018).
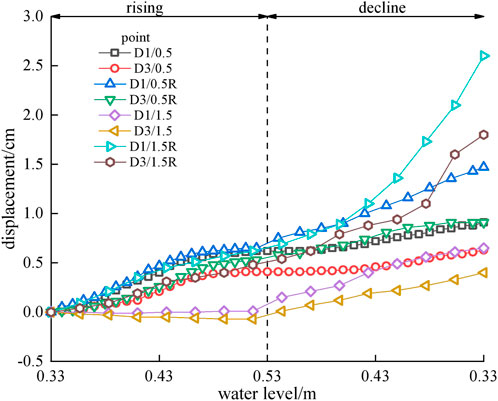
FIGURE 7. Displacement curves of D1 and D3 points under different working conditions.
However, in the coupling effect condition, the slope deformation rates increase significantly. The test results show that accelerated deformation of the slope occurs in the water level decline stage, and the deformation rate is proportional to the water level decline rate. Throughout the process, the change in trend of the front displacement of the slope conforms to the three stages of deformation and failure of the slope in terms of theory. The deformation rates are converged in the rising process and accelerated in the decline process, and the acceleration inflection point matches the decline point of pore water pressure well. The reason is that the expansion speed of moist front is accelerated and the total stress of the slope is enhanced because of rainfall infiltration, and thus the ratio of effective stress to the total stress is reduced. Meanwhile, rainfall infiltration results in a reduction in the water head difference between the outside and inside of the slope owing to the rapid rise of water, which weakens or even inhibits the development of the slope plastic zone.
At the decline process, the groundwater of the slope migrates towards outside, which leads to the reduction of pore water pressure and redistribution of internal stress, produces the consolidation settlement of soil, and magnifies the displacement of the slope.
Continuous rainfall produces dynamic scouring load on the slope surface, and continuous infiltration weakens the mechanical properties of the overlying soil layer. Combined with the seepage force generated from the internal soil to the outside of the slope, the anti-sliding force in front of the slope decreases during the decline process and the displacement increases significantly. At this time, a main fracture appears along the direction vertical to the slope at the trailing edge and several secondary fractures occur with the continuous infiltration of rainwater and the decline of water level (Figure 8). They continuously develop into the deep and finally leads to the local slip failure (Fha et al., 2021; Huang et al., 2020; Huang et al., 2017b; Zhang et al., 2021; Zhang et al., 2020a; Zhang et al., 2020b). Therefore, we can conclude that the deformation and failure course of the reservoir bank slope with sand layer is co-controlled by hydrodynamic effects, seepage force effects, and water-induced weakening effects, and the water level fluctuation is the dynamic factor and rainfall is the triggering factor.
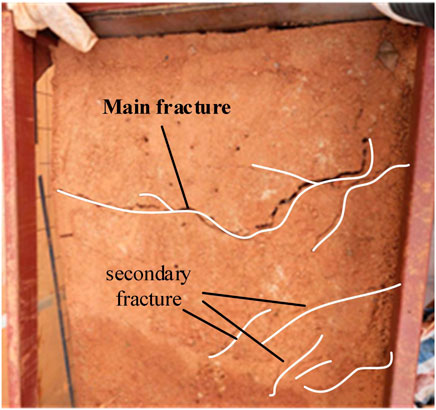
FIGURE 8. Slope cracks.
Conclusion
(1) In the low rainfall intensity condition, an air-water film was produced at the intersection of the upper layer and the sand layer because of a large difference in their permeability coefficient, and it has a positive effect in resisting rainfall infiltration.
(2) Due to the existence of sand layer in the slope in the single water level fluctuation condition, the lag time of pore water pressure is inversely proportional to V. Conversely, the lag time of pore water pressure in the coupling effect condition is shorter and proportional to V during the decline process.
(3) The final displacements of slope caused by coupled rainfall and water level fluctuation are larger than those caused by other two conditions. In addition, the displacement near the slope surface is larger than that inside the slope. This indicates that the deformation of the slope develops from surface to inside in the three conditions.
(4) Accelerated deformation of the slope occurs in the water level decline stage, and the deformation rate is proportional to the water level decline rate. The deformation and failure processes of the reservoir bank slope with sand layer are co-controlled by hydrodynamic effects, seepage force effects, and water-induced weakening effects, and the water level fluctuation is the dynamic factor, and the rainfall is the triggering factor.
Data Availability Statement
The raw data supporting the conclusion of this article will be made available by the authors, without undue reservation.
Author Contributions
Conceptualization, JZ and DX; investigation, QL; methodology, WC; resources, JQ; formal analysis, QL; supervision, NW; writing—original draft, QL; funding acquisition, RZ. All authors have read and agreed to the published version of the manuscript.
Funding
This research was funded by the National Natural Science Foundation of China, 51868021, the National Natural Science Foundation of China, 52168047, the Jiangxi Provincial Natural Science Foundation, 20202BABL20405, the High Speed Railway Joint Fund of NSFC (Grant No. U1934208), the Natural Science Foundation of Jiangxi Province (20212BAB214009), and the Jiangxi Graduate Innovation Fund Project (YC2020-S361).
Conflict of Interest
Author DX is employed by Communications Design and Research Institute Co., Ltd. of Jiangxi Province.
Author JQ is employed by China Jikan Research Institute of Engineering Investigations and Design Co., Ltd.
Author WC is employed by Sichuan Highway Planning, Survey, Design and Research Institute Ltd.
The remaining authors declare that the research was conducted in the absence of any commercial or financial relationships that could be construed as a potential conflict of interest.
Publisher’s Note
All claims expressed in this article are solely those of the authors and do not necessarily represent those of their affiliated organizations, or those of the publisher, the editors, and the reviewers. Any product that may be evaluated in this article, or claim that may be made by its manufacturer, is not guaranteed or endorsed by the publisher.
References
Bogaard, T. A., and Greco, R. (2016). Landslide Hydrology: from Hydrology to Pore Pressure. WIREs Water 3 (3), 439–459. doi:10.1002/wat2.1126
Calcaterra, D., Parise, M., Palma, B., and Pelella, L. (2000). The Influence of Meteoric Events in Triggering Shallow Landslides in Pyroclastic Deposits of Campania, Italy. Cardiff: 8th International Symposium on Landslides.
Fha, B., Jy, A., Xf, B., Chi, Y. A., Jh, C., Wei, C. D., et al. (2021). Uncertainty Pattern in Landslide Susceptibility Prediction Modelling: Effects of Different Landslide Boundaries and Spatial Shape Expressions - ScienceDirect. Geosci. Front. 13, 101317. doi:10.1016/j.gsf.2021.101317
Gatto, L. W., and Doe, W. W. (1987). Bank Conditions and Erosion along Selected Reservoirs. Environ. Geol. Water Sci. 9 (3), 143–154. doi:10.1007/bf02449947
Guan, R., Zhang, W., and Zhou, C. B. (2005). Numerical Analysis of Saturated-Unsaturated Seepage Problem of Rock Slope under Rainfall Infiltration. Rock Soil Mech. 26 (10), 1545–1550.
Hamrouni, F., Trabelsi, H., Jamei, M., and Olivella, S. (2019). Numerical Analysis of Landslides Caused by Rainfall in a Reduced Physical Slope Model. Eur. J. Environ. Civ. Eng. 25, 1–22. doi:10.1080/19648189.2019.1580223
He, C., Hu, X., Dwayne, D., Tannant, F. T., Zhang, Y., and Zhang, H. (2018). Response of a Landslide to Reservoir Impoundment in Model Tests. Eng. Geol. 247, 84–93. doi:10.1016/j.enggeo.2018.10.021
He, J., Wang, S., Liu, H., Nguyen, V., and Han, W. (2021). The Critical Curve for Shallow Saturated Zone in Soil Slope under Rainfall and its Prediction for Landslide Characteristics. Bull. Eng. Geol. Environ. 80, 1–19. doi:10.1007/s10064-020-02016-1
Hu, W., Scaringi, G., Xu, Q., Pei, Z., Van Asch, T. W. J., and Hicher, P.-Y. (2017a). Sensitivity of the Initiation and Runout of Flowslides in Loose Granular Deposits to the Content of Small Particles: An Insight from Flume Tests. Eng. Geol. 231, 34–44. doi:10.1016/j.enggeo.2017.10.001
Hu, X., Tan, F., Tang, H., Zhang, G., Su, A., Xu, C., et al. (2017b). In-situ Monitoring Platform and Preliminary Analysis of Monitoring Data of Majiagou Landslide with Stabilizing Piles. Eng. Geol. 228, 323–336. doi:10.1016/j.enggeo.2017.09.001
Huang, F., Huang, J., Jiang, S., and Zhou, C. (2017a). Landslide Displacement Prediction Based on Multivariate Chaotic Model and Extreme Learning Machine. Eng. Geol. 218, 173–186. doi:10.1016/j.enggeo.2017.01.016
Huang, F., Yin, K., Huang, J., Gui, L., and Wang, P. (2017b). Landslide Susceptibility Mapping Based on Self-Organizing-Map Network and Extreme Learning Machine. Eng. Geol. 223, 11–22. doi:10.1016/j.enggeo.2017.04.013
Huang, F., Cao, Z., Jiang, S. H., Zhou, C., and Guo, Z. (2020). Landslide Susceptibility Prediction Based on a Semi-supervised Multiple-Layer Perceptron Model. Landslides 17 (2), 2919–2930. doi:10.1007/s10346-020-01473-9
Huang, R. (2007). Large-Scale Landslides and Their Sliding Mechanisms in China since the 20th Century. Chin. J. Rock Mech. Eng. 26 (3), 433–454.
Ji, F., Liu, C., Zhou, H., Liu, H., and Liao, Y. (2018). Identifying the Influences of Geological Factors on Reservoir Bank Collapse by a Model Test. Bull. Eng. Geol. Environ. 77, 127–139. doi:10.1007/s10064-016-0951-x
Jiang, Q. Q., Jiao, Y. Y., Song, L., Wang, H., and Xie, B. T. (2019). Experimental Study on Reservoir Landslide under Rainfall and Water-Level Fluctuation. Rock Soil Mech. 40, 4361–4370. doi:10.16285/j.rsm.2018.1617
Jiao, Y.-Y., Zhang, H.-Q., Tang, H.-M., Zhang, X.-L., Adoko, A. C., and Tian, H.-N. (2014). Simulating the Process of Reservoir-Impoundment-Induced Landslide Using the Extended DDA Method. Eng. Geol. 182, 37–48. doi:10.1016/j.enggeo.2014.08.016
Jin, A. B., Deng, F. G., Li, L. F., and Zhang, M. Z. (2012). Research on Stability Mechanism of Fissured Loess Slope Influenced by Rainfall and Evaporation. Amm 170-173, 380–385. doi:10.4028/www.scientific.net/amm.170-173.380
Li, S., Sun, Q., Zhang, Z., and Luo, X. (2018). Physical Modelling and Numerical Analysis of Slope Instability Subjected to Reservoir Impoundment of the Three Gorges. Environ. Earth Sci. 77 (4), 138. doi:10.1007/s12665-018-7321-x
Liu, X. X., Xia, Y. Y., Zhang, X. S., and Guo, R. Q. (2005). Effects of Drawdown of Reservoir Water Level on Landslide Stability. Chin. J. Rock Mech. Eng. 24 (8), 1439–1444.
Macfarlane, D. (2009). Observations and Predictions of the Behaviour of Large, Slow-Moving Landslides in Schist, Clyde Dam Reservoir, New Zealand. Eng. Geol. 109 (1-2), 5–15. doi:10.1016/j.enggeo.2009.02.005
Mandal, A. K., Li, X., and Shrestha, R. (2019). Influence of Water Level Rise on the Bank of Reservoir on Slope Stability: A Case Study of Dagangshan Hydropower Project. Geotechnical Geol. Eng. 37, 5187–5198. doi:10.1007/s10706-019-00972-4
Mein, R. G., and Larson, C. L. (1973). Modeling Infiltration during a Steady Rain. Water Resour. Res. 9 (2), 384–394. doi:10.1029/wr009i002p00384
Min, X., Ren, G. M., and Xin, L. M. (2013). Deformation and Mechanism of Landslide Influenced by the Effects of Reservoir Water and Rainfall, Three Gorges, China. Nat. Hazards 68 (2), 467–482. doi:10.1007/s11069-013-0634-x
Nardi, L., Rinaldi, M., and Solari, L. (2012). An Experimental Investigation on Mass Failures Occurring in a Riverbank Composed of Sandy Gravel. Geomorphology 164, 56–69. doi:10.1016/j.geomorph.2011.08.006
Peng, S. (2014). State-Of-Art Art of Bank Collapse Predicting of Reservoir and A Balanced Alluvial Accumulation Approach. Chin. J. Rock Mech. Eng. 11 (7), 782–791.
Del Prete, M., Guadagno, F. M., and Hawkins, A. B. (1998). Preliminary Report on the Landslides of 5 May 1998, Campania, Southern Italy. Bull. Eng. Geol. Environ. 57 (2), 113–129. doi:10.1007/s100640050028
Qi-Lang, L. E., Wang, H. D., Xue, X. Q., Gao, Y. L., and Wang, G. (2011). Relationship between the Deformation Features of the Huayuanyangjichang Landslide and Water Level Changes in the Three Gorges Reservoir Area. Hydrogeology Eng. Geol. 38 (6), 68–73.
Sengani, F., and Mulenga, F. K. (2020). Influence of Rainfall Intensity on the Stability of Unsaturated Soil Slope: Case Study of R523 Road in Thulamela Municipality, Limpopo Province, South Africa. Appl. Sci. 10 (24), 1–32. doi:10.3390/app10248824
Shen, J., Gao, Y., Wen, L., and Jin, X. (2018). Deformation Response Regularity of Liujiaba Landslide under Fluctuating Reservoir Water Level Condition. Nat. Hazards 94 (1), 1–16. doi:10.1007/s11069-018-3378-9
Song, K., Yan, E. C., Zhu, D. P., and Zhao, Q. Y. (2011). Base on Permeability of Landslide and Reservoir Water Change to Research Variational Regularity of Landslide Stability. Rock Soil Mech. 32 (9), 2798–2802.
Sun, Y., Guo, N., and Pan, S. (2014). Research on Response Relationship between Seepage Field in Landslide and Reservoir Water Level Fluctuation: Case of Lijiapo Landslide in Three Gorges Reservoir Area. Yangtze River.
Sun, G., Yang, Y., Cheng, S., and Hong, Z. (2017). Phreatic Line Calculation and Stability Analysis of Slopes under the Combined Effect of Reservoir Water Level Fluctuations and Rainfall. Can. Geotechnical J. 54, 5. doi:10.1139/cgj-2016-0315
Tang, J. (2020). Physical Model Experiments on Water Infiltration and Failure Modes in Multi-Layered Slopes under Heavy Rainfall. Appl. Sci. 10, 3458. doi:10.3390/app10103458
Wang, B., Tang, H., Zhu, J., Xiang, W., and Liang, J. (2007). Deformation and Failure Mechanisms of Reservoir Landslide Considering Fluid-Solid Coupling Effect. Chin. J. Rock Mech. Eng. 26 (Suppl.2), 4484–4489.
Wang, L., Yin, Y., Huang, B., and Dai, Z. (2019). Damage Evolution and Stability Analysis of the Jianchuandong Dangerous Rock Mass in the Three Gorges Reservoir Area. Eng. Geol. 265, 105439. doi:10.1016/j.enggeo.2019.105439
Wang, Y. (2000). Study on Prediction Method for Reservoir Bank Caving. Chinese J. Geotech. Engg. 22 (5), 569–571.
Wei, H., Gianvito, S., Qiang, X., and Runqiu, H. (2018). Internal Erosion Controls Failure and Runout of Loose Granular Deposits: Evidence from Flume Tests and Implications for Postseismic Slope Healing. Geophys. Res. Lett. 45 (11), 5518–5527. doi:10.1029/2018GL078030
Xu, Y., Ma, Y., Qiao, S., and Feng, K. (2018). Study on the Deformation and Failure Modes of Filling Slope in Loess Filling Engineering: a Case Study at a Loess Mountain Airport. Landslides 15, 2423–2435. doi:10.1007/s10346-018-1046-5
Zhang, S.-l., Lv, P.-f., Yang, X.-g., Chen, X.-z., and Zhou, J.-w. (2018). Spatiotemporal Distribution and Failure Mechanism Analyses of Reservoir Landslides in the Dagangshan Reservoir, South-West China. Geomatics, Nat. Hazards Risk 9 (1), 791–815. doi:10.1080/19475705.2018.1480536
Zhang, Y. G., Tang, J., He, Z. Y., Tan, J., and Li, C. (2020a). A Novel Displacement Prediction Method Using Gated Recurrent Unit Model with Time Series Analysis in the Erdaohe Landslide. Nat. Hazards 105 (1), 1–31. doi:10.1007/s11069-020-04337-6
Zhang, Y. G., Tang, J., Liao, R. P., Zhang, M. F., and Su, Z. Y. (2020b). Application of an Enhanced BP Neural Network Model with Water Cycle Algorithm on Landslide Prediction. Stoch. Environ. Res. Risk Assess. 35, 1273–1291. doi:10.1007/s00477-020-01920-y
Zhang, Y. G., Chen, X. Q., Liao, R. P., Wan, J. L., and Su, Z. Y. (2021). Research on Displacement Prediction of Step-type Landslide under the Influence of Various Environmental Factors Based on Intelligent WCA-ELM in the Three Gorges Reservoir Area. Nat. Hazards 107 (3), 1709–1729. doi:10.1007/s11069-021-04655-3
Keywords: water-force coupling, reservoir bank slope containing sand, water level fluctuation, seepage field, deformation characteristics
Citation: Zhu J, Lv Q, Xie D, Zeng R, Wang N, Qiao J and Cai W (2022) Physical Model Test on the Deformation Mechanism of Reservoir Bank Slopes With Sand Layers Under Coupled Hydro-Mechanical Conditions. Front. Earth Sci. 10:863370. doi: 10.3389/feart.2022.863370
Received: 27 January 2022; Accepted: 14 June 2022;
Published: 19 July 2022.
Edited by:
Faming Huang, Nanchang University, ChinaReviewed by:
Murali Krishna A, Indian Institute of Technology Tirupati, IndiaYong Fu, Southern University of Science and Technology, China
Maria Datcheva, Bulgarian Academy of Sciences (BAS), Bulgaria
Copyright © 2022 Zhu, Lv, Xie, Zeng, Wang, Qiao and Cai. This is an open-access article distributed under the terms of the Creative Commons Attribution License (CC BY). The use, distribution or reproduction in other forums is permitted, provided the original author(s) and the copyright owner(s) are credited and that the original publication in this journal is cited, in accordance with accepted academic practice. No use, distribution or reproduction is permitted which does not comply with these terms.
*Correspondence: Junhua Zhu, MzA2MkBlY2p0dS5lZHUuY24=; Dian Xie, NzkwODI1NTk0QHFxLmNvbQ==