
94% of researchers rate our articles as excellent or good
Learn more about the work of our research integrity team to safeguard the quality of each article we publish.
Find out more
ORIGINAL RESEARCH article
Front. Earth Sci., 21 February 2022
Sec. Atmospheric Science
Volume 10 - 2022 | https://doi.org/10.3389/feart.2022.862989
This article is part of the Research TopicENSO Nonlinearity and Complexity: Features, Mechanisms, Impacts and PredictionView all 14 articles
In boreal summer, variations of intensity and location of the western North Pacific subtropical high (WNPSH) have significant impacts on weather and climate in East Asia. In this study, the medium-range prediction of WNPSH is comprehensively evaluated with various scores based on reforecast data of the National Centers for Environmental Prediction - Global Ensemble Forecast System, and the predictability source of the WNPSH medium-range forecasting is further analyzed by examining how well the model can reproduce the modulation of El Niño-Southern Oscillation (ENSO) on WNPSH as observed. The results show that this system has a systematic bias in the WNPSH forecasts, mainly manifested by the weak strength and the southeastward shifted position, and such a bias further increases with lead time. Effective prediction skills of WNPSH are 10–11 days for its intensity and area, 7 days for its ridge line, but only 1–3 days for its western boundary ridge point in terms of different scores, respectively, which can be improved through developing a bias correction method of prediction. It is demonstrated that the medium-range predictability of WNPSH is mainly originated from ENSO and its significant lagged effects on WNPSH well revealed in observation can be realistically reproduced by this system within the effective prediction lengths. A strong ENSO modulation of the WNPSH prediction skills has been clearly found in terms of the different indices, which depends on the ENSO’s developing and decaying phases. The intensity and area of WNPSH are usually highly predictable due to the ENSO effect being reproduced by the system well while the location indices of WNPSH have relatively low predictability, which are mainly affected by internal variability and difficultly captured by the model. Predictability analysis of WNPSH as modulated by ENSO shows good potential for medium-range forecasting with high skills.
In the subtropics of the northern and southern hemispheres, there exist the subtropical high-pressure belts. Due to the land-sea distributions, such belts often break into several high-pressure monomers, collectively referred to as subtropical highs. The western North Pacific subtropical high (WNPSH) is well known over the East Asia area as a permanent high-pressure circulation system, usually represented by the 5880-gpm line surrounded area in the 500-hPa geopotential height field west of 180°E (Liu et al., 2012). In previous studies, various indices for representing the WNPSH activities have been defined (Yang and Sun, 2003; Huang et al., 2015; Huang and Li, 2015; Yang et al., 2017; He et al., 2018). The WNPSH’s area, intensity and position movements have been confirmed to have significant influences on summer precipitation and typhoon activity in the East Asia (Huang, 1963; Zhu et al., 1992; Tao and Wei, 2006; Matsumura et al., 2015; Wen et al., 2015). Given that WNPSH has high impacts on the East-Asian weather/climate, the medium- and long-term prediction as well as predictability regarding its intensity and location variations are of particular importance.
WNPSH has significant signals on various time scales as regulated by diverse factors. Many studies have shown a close relationship between the El Niño-Southern Oscillation (ENSO) and WNPSH (Ying and Sun 2000; Cai et al., 2003; Wang and Zou 2004; Li et al., 2017; Zhang et al., 2017). Ying and Sun (2000) examined the response of WNPSH to anomalous tropical sea surface temperature (SST) and revealed that SST anomalies in the eastern equatorial Pacific could enhance the strength of WNPSH through the so-called anomalous “quasi-walker circulation”. Cai et al. (2003) explored the relationship between the summer WNPSH and previous SST and found that the formation of the ENSO event was ahead of the transition of WNPSH intensity for about half a year. Wang and Zou (2004) proposed a possible mechanism for explaining the interannual variation of WNPSH calculating the correlation between WNPSH and ENSO. Zhang et al. (2017) reviewed the effects of El Niño on WNPSH and the mechanism of WNPSH formation and further pointed out the asymmetric effects of El Niño and La Niña. Although understanding of ENSO affecting WNPSH is relatively mature, there are few systematic studies on the different ENSO stages, especially the La Niña’s influence on WNPSH characteristics such as intensity, area, western ridge point, and ridge line due to the asymmetry of ENSO. It is worthy of a deep study of how such influences can be predicted in dynamical operational models.
There have been many studies aiming to illustrate the predictability source of WNPSH on the climate timescale. Some of them suggested that ENSO is the major source of seasonal predictability of summer circulation patterns including WNPSH in East Asia (Wu et al., 2003; Wang et al., 2009; Zhou et al., 2020). Others have emphasized on the importance of the teleconnection associated with the tropical Indian Ocean in generating the anticyclone over the western North Pacific (Yang et al., 2007; Li et al., 2008; Xie et al., 2009; Wu et al., 2010; Zhang et al., 2012; Song and Zhou, 2014; He et al., 2019). However, it should be noted that the tropical Indian Ocean SST comes from the Indo-West Pacific capacitor (Xie et al., 2009), which is closely related to ENSO. And a paucity of attention has been paid to the forecast verification and predictability analysis of WNPSH on the weather timescale. In recent, Gao et al. (2020) verified the medium-range (1–15 days) forecasts of the WNPSH intensity, area, western boundary point and ridgeline using 2-year real-time operational forecasts in China. Further investigations for the WNPSH weather forecast verification and predictability analysis would be needed by using long enough datasets.
In this study, we will focus on the medium-range forecasts of WNPSH for comprehensively verifying its indices of different properties and investigating its modulation by ENSO through employing a multi-decade reforecast dataset from the National Centers for Environmental Prediction (NCEP) of the National Oceanic and Atmospheric Administration (NOAA). This dataset has been widely employed in forecast research by providing us with an opportunity to evaluate the model’s ability to predict certain phenomena over the medium-to-long term (Hamill et al., 2013). The remainder of this paper is organized as follows: The data and methods are given in Section 2. The forecasting skill of WNPSH in the model is evaluated in Section 3. Section 4 shows the model’s ability to reproduce the ENSO modulation on WNPSH. Predictability source of WNPSH is illustrated in Section 5. Summary and discussions are presented in Section 6.
The model reforecast dataset used in this study was previously generated from the Global Ensemble Forecast System (GEFS) version 10 of NCEP/NOAA, covering the period of 1985–2019, with the horizontal resolution of 1 ° × 1 ° and vertical resolution of 42 levels, the reforecast data have 11 ensemble members, and each member has a forecast out to 16 days. The initial condition of NCEP-GEFS was generated from the climate forecast system reanalysis (CFSR), using the ensemble transforms with rescaling (ETR) to form the perturbed initial condition, and the stochastic total tendency perturbation (STTP) scheme to represent the effect of model uncertainties. More details on NCEP-GEFS can be obtained from Hamill et al. (2013).
The verification data used in this study include: 1) National Centers for Environmental Prediction/Department of Energy (NCEP/DOE) Reanalysis 2 (Kanamitsu et al., 2002) covering the period from 1 January 1951 to 31 December 2019, including wind and geopotential height; 2) The Niño 3.4 SST anomaly index is downloaded from the website of National Climate Center of China Meteorological Administration, https://cmdp.ncc-cma.net/cn/index.htm; 3) monthly SST data are from Climate Prediction Center (CPC), https://www.cpc.ncep.noaa.gov.
For easy comparison, the verification and reforecast data are interpolated to a uniform resolution of 1° longitude × 1° latitude, and our results do not depend on such a resolution. In this study, we only examine WNPSH in boreal summer (June to August, JJA).
Here, we use a series of WNPSH indices defined by Liu et al. (2012), including the WNPSH intensity, area, western boundary point, and ridge line, which can well reflect the impact of WNPSH on summer rainfall in East Asia. The four indices can be used to quantify the strength and relative position of WNPSH, thereby more intuitively representing its basic characteristics. Referring to Liu et al. (2012), the daily WNPSH indices are defined as follows:
1) Area and intensity: the area index is defined by the area surrounded by the grids, which are not less than 5,880°gpm in the range of 110–180°E and north of 10°N at 500-hPa. Correspondingly, the difference between the height over these grids and 5,870°gpm is multiplied by the area defined above and then accumulated, and the result is defined as the intensity index.
2) Ridge line: the average latitude of the characteristic line, featured by a zonal wind u = 0,
3) Western boundary ridge point (ridge point for short): the longitude at the westernmost boundary of the 5,880 gpm grid in the range of 90°–180°E. If it is west of 90°E, it will be counted as 90°E. If the 5,880°gpm contour is not present, it is replaced by the historical maximum.
Various verification statistics are calculated to evaluate the forecasting skill of the WNPSH intensity and location by the reforecast. Mean error (ME), normalized root mean square error (NRMSE) and correlation coefficient (R) are used to measure the deviation, amplitude error and consistency between observation and model reforecasts, respectively. The agreement between the predicted and observed time series is represented by the values of ME and NRMSE close to 0, and that of R close to 1. The effective skills of the WNPSH forecasts by this forecasting system can be determined as R ≥ 0.6 and NRMSE < 1 as usual. Their definitions are as follows:
and an additional performance score (PS) that can consider both similarity and magnitude error (Chen et al., 2013),
Here, Fi and Oi are the ith values in the forecast and observational time series, respectively. n is the sample size.
As a primary circulation pattern in East Asia, WNPSH is usually characterized by the area surrounded by the 5880-gpm line in 500-hPa height field. Figure 1 shows the distribution of the 5880-gpm lines in the summer-mean height in terms of different lead days. It is clearly found there are systematic biases in the WNPSH forecasts, such as a smaller area, eastward and southward shift of location. Such biases further increase with the extension of the forecast time. Interestingly, the southward shift of WNPSH in the reforecasts is different from most CMIP3 and CMIP5 AGCM models, which reproduce the northward shift bias of WNPSH (Song and Zhou, 2014).
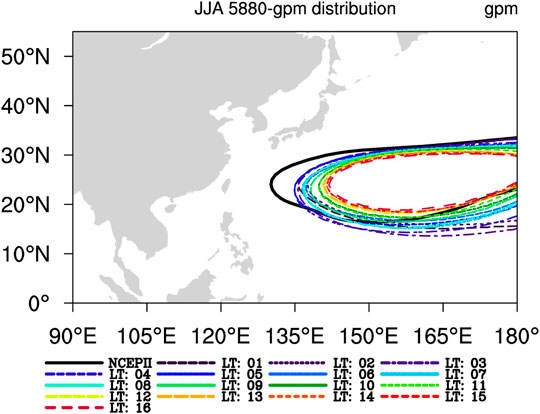
FIGURE 1. Summer-averaged 5880-gpm lines of the NCEP/DOE Reanalysis (black line) and NCEP-GEFS reforecasts (color lines) at different lead times (LT, unit: day).
The forecasting skill of the WNPSH indices by the NCEP-GEFS reforecasts is shown in Figure 2. For ME, the reforecasts reproduce a weaker WNPSH with a smaller area and a southeastward shifted position, consistent with Figure 1. Compared with the corresponding threshold, days with the effective skills of the intensity, area, ridge point, and ridge line in terms of the NRMSE score are 10, 9, 0, and 7 days, respectively. In terms of the R score, the most commonly used in verifying forecast, days with the effective skills of the intensity, area, ridge point, and ridge line can reach 11, 10, 3, and 7 days, respectively. These verification results indicate that the forecasting skill of the ridge point is the worst in NCEP-GEFS because the position of WNPSH shifts too east in the model compared to observation. Similar results were also found in other models (Niu and Zhai, 2013), which mean that state-of-art models still have biases in predicting the longitudinal motion of WNPSH. In addition, the model’s ability to predict the ridge line of WNPSH is also quite limited (∼7 days). Given that the location of WNPSH is closely related to summer rainfall distributions in China (Liu et al., 2012), the model’s medium-term forecasting of WNPSH is still challenging.
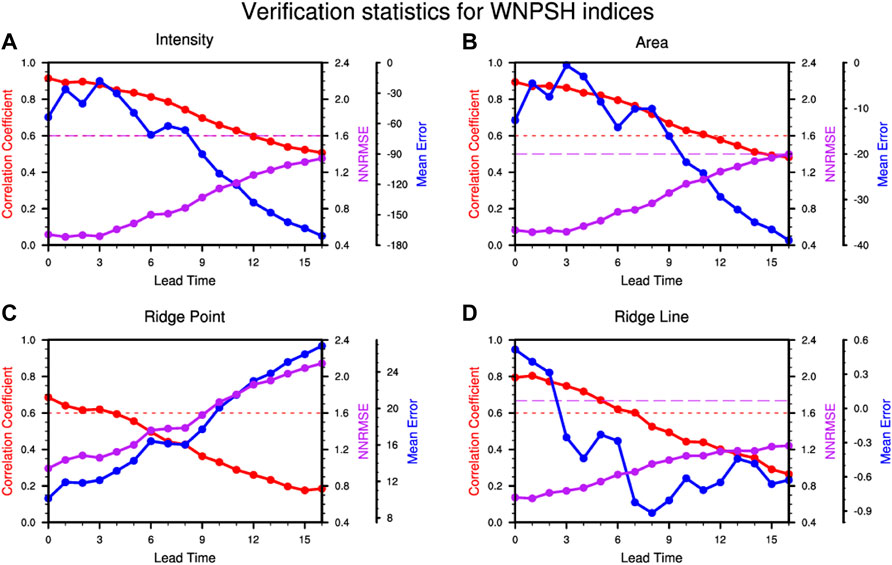
FIGURE 2. Verification statistics as a function of lead time (days), where red lines represent correlation coefficient (R), purple lines do normalized root mean square error (NRMSE) and blue lines do mean error (ME) for verifying the WNPSH indices of (A) intensity, (B) area, (C) western boundary ridge point and (D) ridgeline by the NCEP-GEFS reforecasts. The red and purple dash lines represent the corresponding thresholds of R and NRMSE, respectively.
As shown in Figure 1, the predictions of WNPSH of NCEP GEFS have a systematic bias. Here, we develop a bias correction method as derived in Eq. 5. The climatic states of observations and reforecasts can be obtained at different leads.
where,
After the correction, as seen in Figure 3, the R-score only shows a slight improvement with the effective skills of 11, 11 5, and 8°days for intensity, area, ridge point, and ridge line, respectively. However, it is clear that not only the average errors of the four WNPSH indices are decreased, but also their effective skills in terms of the NRMSE score are increased to 13, 11, 5, and 9°days, respectively. Especially, for the ridge point, the NRMSE of the corrected forecasts has been increased by more than one pentad. These results indicate that the predictive capability of the WNPSH index in the model system can be greatly improved by developing a bias correction method which idea has been widely adopted in climate predictions. This is quite meaningful with highly predictable WNPSH signals for rainfall forecasts in China due to the significant positive correlations of the forecasting skill between WNPSH and precipitation (Song and Zhou, 2014).
Many previous studies have proven the lag effect of ENSO on WNPSH. The significant lag correlations between the Niño3.4 index and the WNPSH indices, as shown in Figure 4, indicate the effect of the SST anomalies in the tropical Pacific on WNPSH after 4 months of the ENSO peak. It is worth noting that similar results can also be obtained using the Niño3 and Niño4 indices. This means that ENSO does have a significant impact on the WNPSH’s intensity, area, and ridge point, except for the ridge line due to its relatively lower correlation. Previous experiences tell that ENSO in different phases usually has quite different modulation effects on WNPSH. To examine such modulation of WNPSH by ENSO at different phases, the approach of Chou et al. (2003) is applied to classification the ENSO phases (see Table 1).
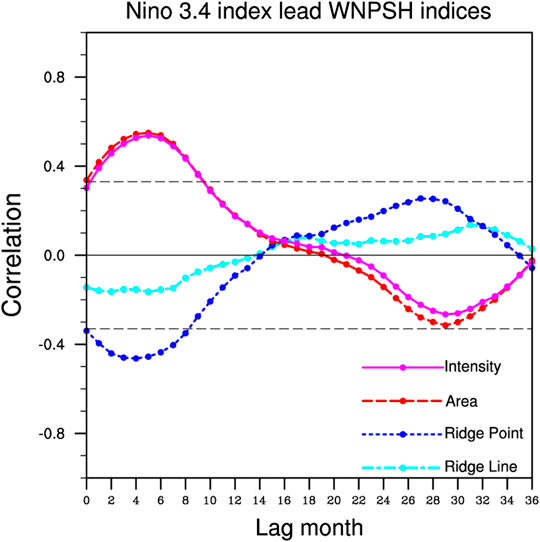
FIGURE 4. Lagged correlations between Niño 3.4 index and WNPSH indices. Only annual cycle is removed from WNPSH indices before calculating the lagged correlations. The dashed lines are the significant correlation values at the 95% confidence level, where the degree of freedom is estimated by each year.
Considering the availability of the reforecast data, only the impact of ENSO on the boreal summer WNPSH from 1985 to 2019 can be examined here. Composite patterns in terms of the ENSO phases in Figure 5 show a significant modulation on the WNPSH behaviors in observation. In the developing phase of El Niño (Figure 5B), anomalous westerly winds in the equatorial central and western Pacific act to weaken the easterlies in the south of WNPSH, making the WNPSH weaker, smaller, and westward shifted. As a contrast, in the El Niño decaying phase, anomalous easterly winds in the equatorial western Pacific make the WNPSH stronger, larger, and eastward shifted, compared with the climatology (Figure 5C), which has been demonstrated as the indirect responses of ENSO through the air-sea teleconnection (Wang et al., 1999) and the Indian Ocean capacitor effect (Xie et al., 2009). La Niña’s two phases show generally opposite situations of the WNPSH’s intensity, area, and positions, compared to El Niño phases (Figures 5D,E).
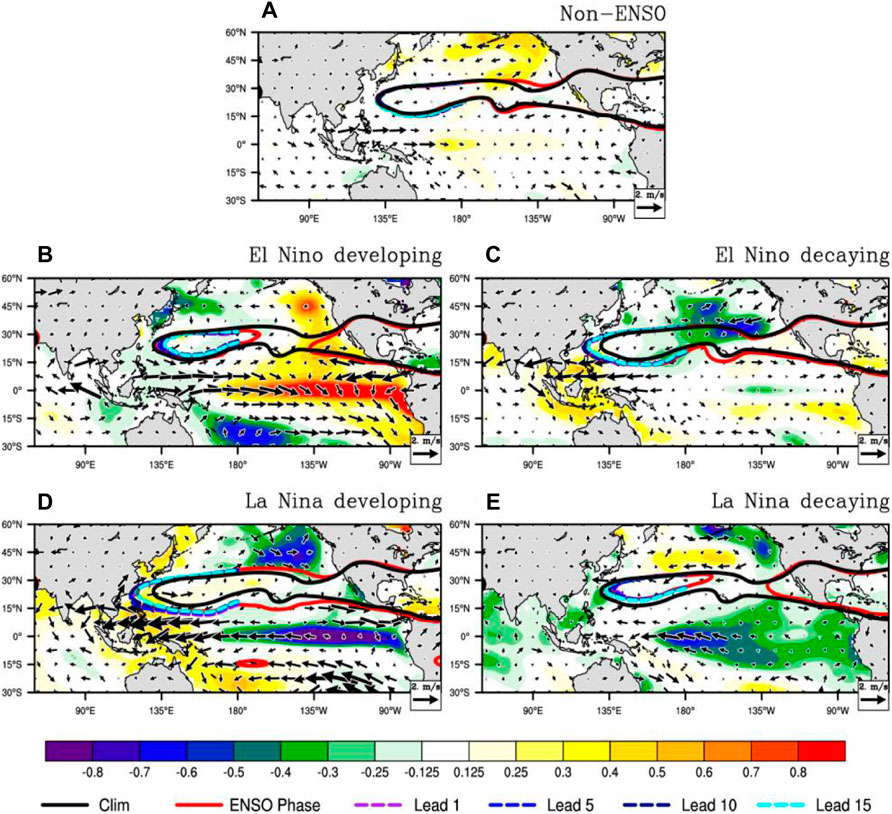
FIGURE 5. Composites for 5880-gpm over 500-hPa height field [contours, black line represent all years during 1985–2019 and color lines are for a specific phase of ENSO in observation (red) and the model at different lead days], SST (shading, units: °C) and 850-hPa wind anomalies (vector, m s−1) during the non-ENSO (A), El Niño developing (B), El Niño decaying (C), La Niña developing (D) and La Niña decaying (E) summers.
The observed modulation of the different ENSO phases on WNPSH can be well reproduced by the model system at different leads whether the prediction results have been corrected or not, as clearly seen in Figure 5. This means that NCEP-GEFS can accurately catch the impact of ENSO on the WNPSH properties such as intensity and position, which vary little with lead, illustrating the potentials for the medium-range prediction of WNPSH. The clearer modulation of ENSO on WNPSH can be directly seen in Figure 6, which shows the variations of the WNPSH indices with the ENSO phases. Generally, the model system can capture well the evolutions of the different WNPSH indices throughout the four ENSO phases; i.e., WNPSH is stronger (weaker) and more westward (eastward) in the EDy (EDp) and LDp (LDy) summers. Indeed, the predictions have certain systematic biases regardless of the indices and the biases tend to become larger as the lead time increases. For example, the magnitudes of the WNPSH intensity and area have been clearly underestimated (overestimated) in the EDp and EDy (LDy) summers. Interestingly, for the LDp, the model also produces a varying strength bias and even changes signs of the bias with lead time increases. Similar modulation was found for the ridge point, which has an eastward shift in the model predictions in the EDp and EDy summers, but a westward shift in the LDy summers. In particular, in the LDp summers, the WNPSH ridge point predicted by the model shifts westward and gradually becomes an eastward shift as the lead time increases. The modulation of ENSO to the ridge line is not as significant as the other three indices (see Figure 4) and thus the WNPSH ridge line predicted by the model varies weakly with the ENSO phase changing.
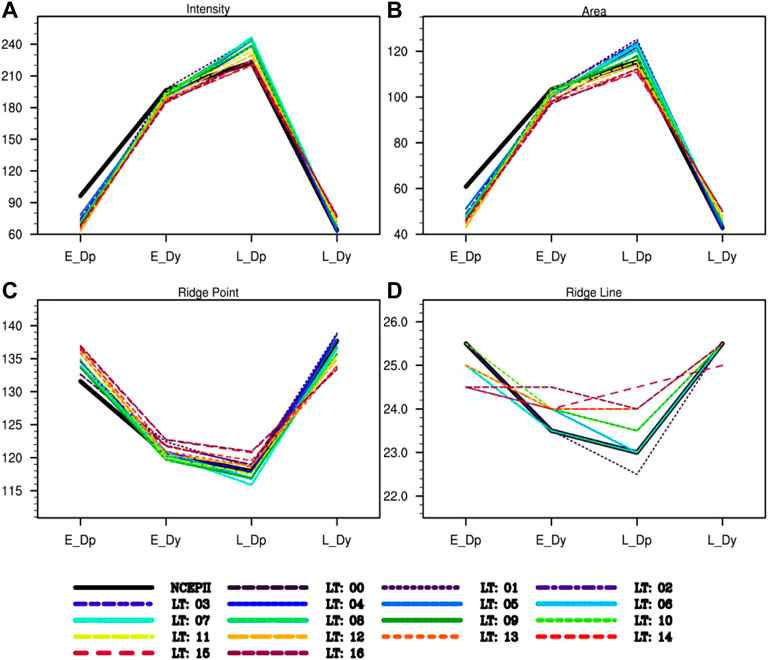
FIGURE 6. Forecasts of the WNPSH indices in NCEP-GEFS for (A) Intensity, (B) Area, (C) ridge point and (D) ridge line during the different phases of ENSO (E_Dp, E_Dy, L_Dp and L_Dy represent the El Niño developing, El Niño decaying, La Niña developing, and La Niña decaying summers, respectively) at the different lead time (0–16 days).
From Section 4, we have seen that ENSO has a significant modulation on WNPSH and it has been reasonably reproduced by NCEP-GEFS at different leads. Then, one natural question here is whether ENSO or any other factor plays a role in regulating medium-range predictability as well as prediction skills for WNPSH? To answer this question, we will reveal the predictability source of WNPSH at the medium range, which can provide indications for relevant weather forecasts. Figure 7 first shows the yearly prediction skills of the WNPSH indices at different leads. Clearly, prediction skills of the four indices decrease as the lead time increases and also show interannual variability. Overall, the peaks and valleys of skill fluctuations are well consistent with each other among different lead times, which implies that initial states of the model system largely determine the quality of forecasts. Although the skill variations of the intensity and area indices are relatively consistent, they are still significantly different from those of the ridge point and ridge line. This suggests that the factors affecting the prediction skill for the WNPSH intensity and position may be different. In the following, we work to study the influence factors that contribute to the prediction skill of the intensity and position of WNPSH.
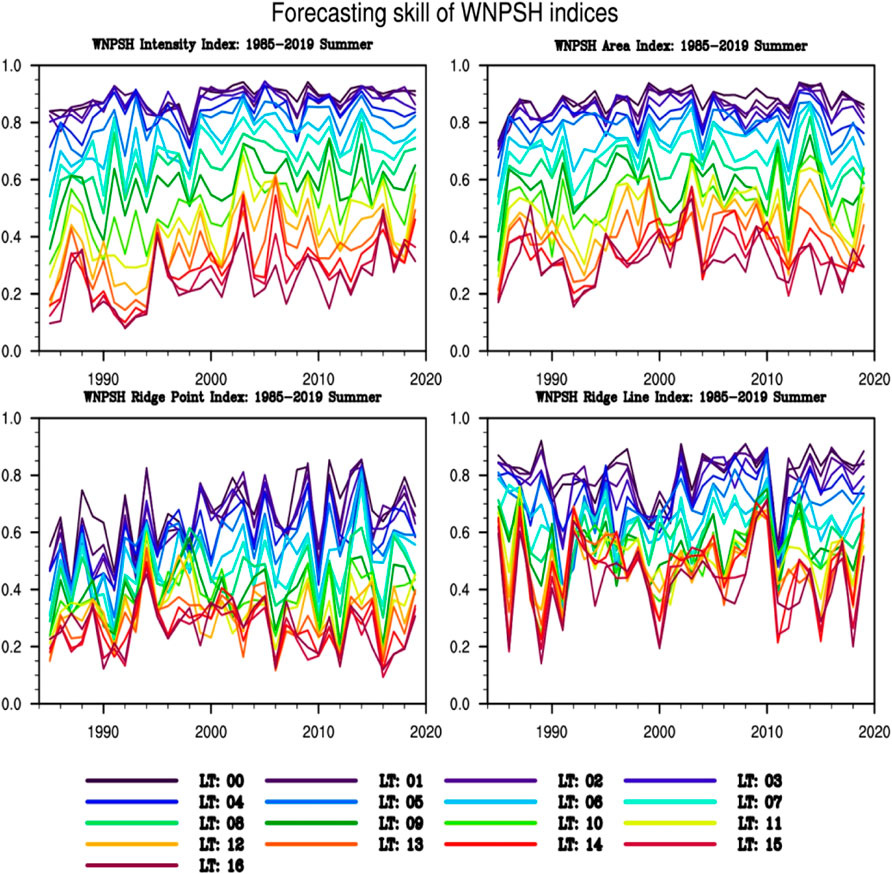
FIGURE 7. Yearly variations in prediction skills of the summer WNPSH indices (A–D) represent intensity, area, ridge point, and ridge line, respectively.
Figure 8 shows the averaged skills from all the different leads in Figure 7. It is seen that the prediction skill not only has strong interannual variations, but also an interdecadal change around 2000. That is, the prediction skill after 2000 suddenly becomes much higher than before, which reason is still unclear. Although the WNPSH intensity is significantly affected by ENSO (Figure 6), and its prediction skills vary greatly from year to year (Figure 7), we do not find a clear relationship between prediction skills and the ENSO phases. For example, the 3 years with the highest skills are 2003, 2006, and 2009, which correspond to the EDy, weak EDp, and EDp years, respectively. In contrast, the 3 years with the lowest skills are 1985, 1992, and 1994, corresponding to the LDy, EDy, and non-ENSO years, respectively.
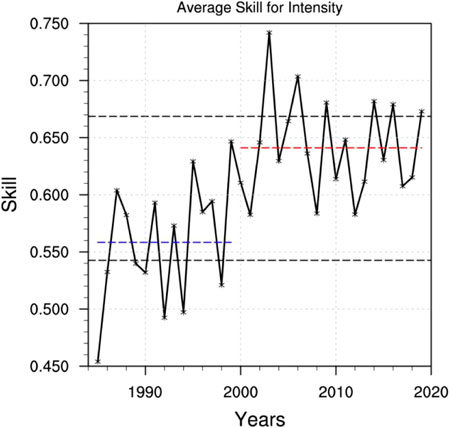
FIGURE 8. The average prediction skills of the WNPSH intensity index of different lead times as shown in Figure 7. The two black dotted lines represent that the all-year mean pluses or minuses one standard deviation. The blue dashed line represents the average skill during 1985–1999 and the red one does during 2000–2019.
To further reveal what dynamical processes may contribute to the prediction skill of intensity, Figure 9A shows correlations between the prediction skills in Figure 8 and the 500-hPa geopotential height and SST anomalies. There are mainly three highly correlated height anomalies, one in the WNP and two in the northeastern and southeastern tropical Pacific. The positive height anomaly corresponds to the positive SST anomaly over the WNP region, indicating the atmospheric forcing on the ocean there. Clearly, the maximum correlations with SST are located over the TIO, which are dynamically connected with the maximum correlations of the WNP height, constituting a TIO-WNP teleconnection (Yang et al., 2007; Li et al., 2008; Xie et al., 2009; Wu et al., 2010; Zhang et al., 2012; He et al., 2019). In Figures 9A,B significant correlation of 0.81 is found between the box-average-defined indices of the SST anomalies in TIO and the 500-hPa height anomalies in WNP, meaning that the former can explain a variance greater than 60% of the latter. Previous studies figured out that a successful reproduction of the interannual East-Asian summer Monsoon (EASM) pattern highly depends on the TIO-WNP teleconnection (Zhang et al., 2012; Song and Zhou 2014). Our results clearly suggest that the TIO-WNP teleconnection is also crucial for the medium-range predictability of the WNPSH intensity, i.e., a stronger teleconnection contributing to higher prediction skills. The TIO SST and WNP anomalies have significant correlations of 0.64 and 0.58 with prediction skills of the WNPSH intensity, respectively, and also show clear upward trends (Figure 9B). This may be the reason for the observed interdecadal change of the intensity skills around 2000 (Figure 8). In other words, the warming of TIO since 2000 has enhanced WNPSH through the TIO-WNP teleconnection and then led to a significant increase in the intensity skills. ENSO may have an indirect effect on prediction skills of the WNPSH intensity due to the significant modulation as shown in Figure 6A though their direct connection is not yet found. Moreover, a similar conclusion has also been found for the WNPSH area index (not shown).
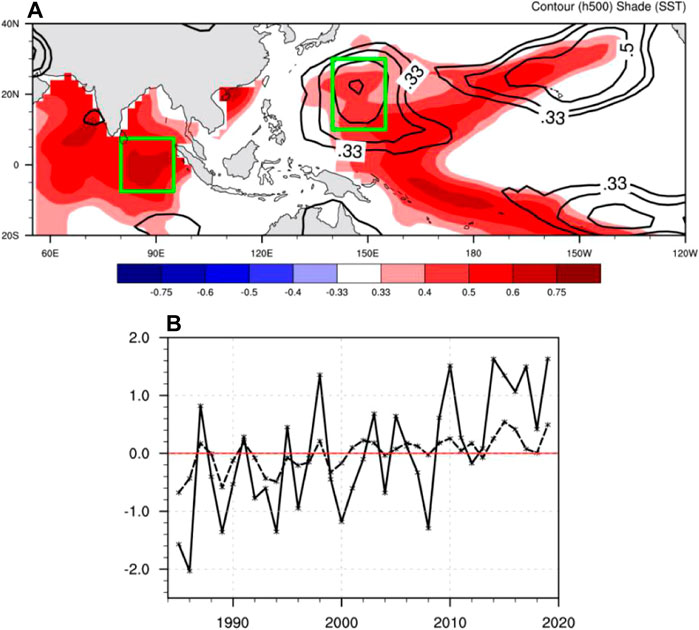
FIGURE 9. (A) Correlation coefficients between 500-hPa height (contours), SST anomaly (shade) and the prediction skills of the WNPSH intensity in Figure 8, only show the values that pass the 95% confidence t-test. (B) The standardized domain-averaged indices of the SST anomaly (dashed line) in the tropical Indian Ocean and 500-hPa height anomaly (solid line) in the western North Pacific, where the two domains are defined by the boxes in (a).
For ridge point (Figure 10A), the years with higher prediction skills are 1994 (EDp), 2005 (non-ENSO), 2009 (EDp), and 2014 (non-ENSO), and the years with lower skills are 1985 (LDy), 1987 (EDy), and 1991 (EDp). For ridge line (Figure 10B), the years with prediction skills greater than 1 standard deviation are 1985 (LDy), 1987 (EDy), and 2010 (EDy and LDp), and the years with skills less than 1 standard deviation are 1991 (EDp), 1999 (persisting La Niña), 2000 (LDy), and 2011 (LDy). However, we cannot find a close relationship between prediction skills of the WNPSH position and ENSO or other common factors, which may be the main reason that their prediction skills are relatively lower compared to the WNPSH intensity and area (Figures 2, 3). We compared prediction skills of the two position indices with their standard deviations and found that these skills may be mainly contributed from their variability. As seen in Figure 10A, the fluctuation in prediction skills of the ridge point and its variability corresponds well with a significant correlation of 0.36 at the 95% confidence level and 0.55 at the 99.9% confidence level after detrending. This confirms prediction performance of the ridge point can be largely affected by its variability. That is when the east-west movement of ridge point is more (less) frequent, the prediction skills tend to be higher (lower). In contrast, the variability of the ridge line has only a weakly negative correlation (about -0.2) with its prediction skill.
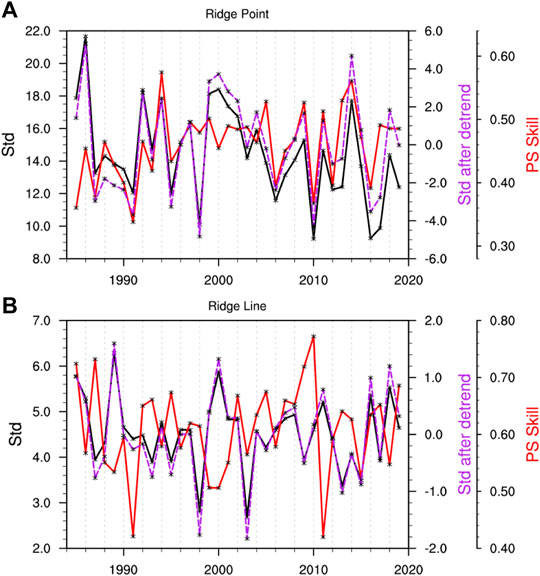
FIGURE 10. Average prediction skills of the WNPSH (A) ridge point and (B) ridge line indices of different lead times in Figure 7. The red lines represent PS skills, the black lines do standard deviation, and the purple lines do standard deviation after detrending.
Although it is difficult to directly determine which process is related to the prediction skill of the ridge point, we could find out the factor that determines the variability of ridge point and thus those processes may indirectly affect prediction skill. Correlations of the ridge point skill with the 500-hPa height anomalies show the significant regions in the tropics (Figure 11A). It is worth noting that the significant negative correlations are not caused by climate trends that have been removed before the correlation calculating. Figure 11B shows standard deviations of the ridge point and the height anomaly indices averaged over the entire tropical region. A significant correlation can be found between them in boreal summer and even spring height anomalies are also highly correlated with the ridge point in terms of their standard deviations, which indicates that the height anomalies over tropics in spring may have implications for predicting the summer WNPSH. The correlations between the standard deviations of ridge point and height anomalies are −0.55 and −0.64 in spring and summer, respectively, which are statistically significant at the 99.9% confidence level. This means that the east-west movement of WNPSH will be more frequent when the height anomalies in the tropics are negative. Note that the prediction skill of the ridge point tends to be higher when the WNPSH has more frequent east-west movement (Figure 10A). Therefore, the height anomalies in the tropics may indirectly affect the performance of the ridge point prediction.
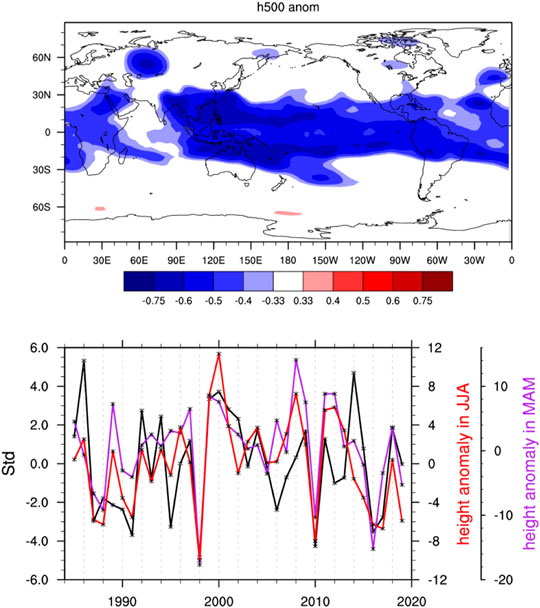
FIGURE 11. (A) Correlation coefficients between the detrended 500-hPa height anomaly and the ridge point prediction skills in Figure 10A, only show the values passing the 95% confidence t-test. (B) Standard deviations of the WNPSH ridge point index (black line), the 500-hPa height anomaly indices during summer (red line) and spring (purple line) averaged over the tropical region (30°S–30°N, 0–360°E). Here, the height anomalies have been multiplied by -1.
Variations of the WNPSH intensity and location are closely related to weather and climate in East Asia. Research on their prediction evaluation and predictability analysis has been a crucial issue. However, less attention is paid to the medium-range forecasting and its predictability source though many prior studies have paid much attention to the seasonal forecasting of WNPSH and its predictability. In this study, a few scores were used to comprehensively evaluate the performance of NCEP-GEFS in medium-ranged forecasting WNPSH. In addition, given the significant ENSO modulation of WNPSH, the capability of the model system in reproducing such modulation and the predictability sources of the WNPSH medium-range forecasting were also investigated.
NCEP-GEFS has a systematic bias in the WNPSH forecasts, mainly manifested by the weak strength, eastward and southward shift of location, and such a bias can further increase with the extension of forecast length. The three skill scores (called ME, NRMSE, and R), measuring the amplitude error, normalized deviation, and consistency between the forecasts and observations, respectively, have been used to evaluate the prediction skills of the WNPSH indices. The results show that the skillful prediction lengths of WNPSH intensity, area, ridge point and ridge line are 10 (11), 9 (10), 0 (3), 7 7) days in terms of NRMSE (R), respectively, which can be improved to 13 (11), 11 (11), 5 (5), and 9 8) days through introducing the correction method of systematic bias.
The Niño 3.4 index of representing ENSO is significantly correlated with the intensity, area, and ridge point of WNPSH, with the peak correlations at 4-months lag, showing the significant modulation of the WNPSH by ENSO. Further results show that the WNPSH intensity and area tend to be stronger (weaker) during the EDy (EDp) and LDp (LDy) summers, and the ridge point is also accompanied by westward extension during the EDy and LDp summers and eastward withdrawal during the EDp and LDy summers. Such a modulation can be well reproduced by the NCEP GEFS which thus has given realistic forecasts to some degree. This means that the medium-range weather forecasting system (not climate prediction system) can also capture the seasonal anomalies of WNPSH associated with ENSO on the interannual time scale.
The predictability source of the medium-range forecasting of the WNPSH indices was further analyzed. Our results showed that the prediction skill of the intensity could be modulated by the TIO-WNP teleconnection, i.e., the stronger latter is, the higher skills of the form are. However, the prediction skill of the WNPSH location indices is less affected by external forcing, but more by internal variability. For the ridge point, its prediction skill is positively proportional to its variability that has a significantly negative correlation with the geopotential height anomalies in the tropics, implying that the latter may indirectly affect the prediction skill of ridge point.
This study showed that the capability of NCEP-GEFS to accurately reproduce the TIO-WNP teleconnection strength and the height anomalies in the tropics is the key for the model system to give accurate medium-range forecasts of WNPSH. However, the results have been based on one model only. In the next steps, more models that own the medium-range reforecasts need to be introduced to validate our results. In addition, we have only examined the predictability source of interannual variations in the prediction skills of WNPSH. Future research will be needed to investigate issues in the sub-seasonal variations of the prediction skills and their predictability Gao et al., 2019.
The original contributions presented in the study are included in the article/Supplementary Material, further inquiries can be directed to the corresponding author.
LG provided the idea and wrote the paper, PR carried out the analysis. JZ contributed to discussing the results and writing the paper. All authors commented on the manuscript.
This work was jointly supported by the National Natural Science Foundation of China (41875138 and 42175015) and the National Key Research and Development Program of China (2018YFF0300103).
The authors declare that the research was conducted in the absence of any commercial or financial relationships that could be construed as a potential conflict of interest.
All claims expressed in this article are solely those of the authors and do not necessarily represent those of their affiliated organizations, or those of the publisher, the editors and the reviewers. Any product that may be evaluated in this article, or claim that may be made by its manufacturer, is not guaranteed or endorsed by the publisher.
Cai, X. Z., Wen, Z. Z., and Wu, B. (2003). Relationship between West Pacific Subtropical High and ENSO and its Influence on Rainfall Distribution of Rainy Season in Fujian. J. Trop. Meteorology 19 (1), 36–42. (in Chinese). doi:10.3969/j.issn.1006-8775.2003.01.007
Chen, L., Yu, Y., and Sun, D.-Z. (2013). Cloud and Water Vapor Feedbacks to the El Niño Warming: Are They Still Biased in CMIP5 Models? J. Clim. 26, 4947–4961. doi:10.1175/jcli-d-12-00575.1
Chou, C., Tu, J.-Y., and Yu, J.-Y. (2003). Interannual Variability of the Western North Pacific Summer Monsoon: Differences between ENSO and Non-ENSO Years. J. Clim. 16, 2275–2287. doi:10.1175/2761.1
Gao, L., Ren, H.-L., Zheng, J., and Chen, Q. (2019). Diagnosing Features of Extreme Temperature Variations in China Based on the NCEP-GEFS Reforecasts. Trans. Atmos. Sci. 42 (1), 58–67. (in Chinese). doi:10.13878/j.cnki.dqkxxb.20180911001
Gao, L., Ren, P., Zhou, F., Zheng, J., and Ren, H. (2020). Evaluations and Ensemble Approaches of Western-Pacific Subtropical High and South-Asian High Ensemble Forecasting in GRAPES-GEPS. Adv. Earth Sci. 35 (7), 715–730. (in Chinese). doi:10.11867/j.issn.1001-8166.2020.060
Hamill, T. M., Bates, G. T., Whitaker, J. S., Murray, D. R., Fiorino, M., Galarneau, T. J., et al. (2013). NOAA's Second-Generation Global Medium-Range Ensemble Reforecast Dataset. Bull. Amer. Meteorol. Soc. 94, 1553–1565. doi:10.1175/bams-d-12-00014.1
He, C., Lin, A., Gu, D., Li, C., Zheng, B., Wu, B., et al. (2018). Using Eddy Geopotential Height to Measure the Western North Pacific Subtropical High in a Warming Climate. Theor. Appl. Climatol. 131, 681–691. doi:10.1007/s00704-016-2001-9
He, C., Zhou, T., and Li, T. (2019). Weakened Anomalous Western North Pacific Anticyclone during an El Niño–Decaying Summer under a Warmer Climate: Dominant Role of the Weakened Impact of the Tropical Indian Ocean on the Atmosphere. J. Clim. 32, 213–230. doi:10.1175/jcli-d-18-0033.1
Huang, S. S. (1963). A Study of the Longitudinal of Movement and its Forecasting of Subtropical Anticyclones. Acta Meteorologica Sinica (in Chinese) 33 (3), 320–332. doi:10.11676/qxxb1963.030
Huang, Y., and Li, X. (2015). The Interdecadal Variation of the Western Pacific Subtropical High as Measured by 500 hPa Eddy Geopotential Height. Atmos. Oceanic Sci. Lett. 8 (6), 371–375. doi:10.3878/AOSL20150038
Huang, Y., Wang, H., Fan, K., and Gao, Y. (2015). The Western Pacific Subtropical High after the 1970s: Westward or Eastward Shift? Clim. Dyn. 44, 2035–2047. doi:10.1007/s00382-014-2194-5
Kanamitsu, M., Ebisuzaki, W., Woollen, J., Yang, S.-K., Hnilo, J. J., Fiorino, M., et al. (2002). NCEP-DOE AMIP-II Reanalysis (R-2). Bull. Amer. Meteorol. Soc. 83 (11), 1631–1644. doi:10.1175/bams-83-11-1631
Li, S., Lu, J., Huang, G., and Hu, K. (2008). Tropical Indian Ocean basin Warming and East Asian Summer Monsoon: A Multiple AGCM Study. J. Clim. 21, 6080–6088. doi:10.1175/2008jcli2433.1
Li, T., Wang, B., Wu, B., Zhou, T., Chang, C.-P., and Zhang, R. (2017). Theories on Formation of an Anomalous Anticyclone in Western North Pacific during El Niño: A Review. J. Meteorol. Res. 31, 987–1006. doi:10.1007/s13351-017-7147-6
Liu, Y., Li, W., Ai, W., and Li, Q. (2012). Reconstruction and Application of the Monthly Western Pacific Subtropical High Indices. J. Appl. Meteorol. Sci. (in Chinese) 23 (4), 414–423.
Matsumura, S., Sugimoto, S., and Sato, T. (2015). Recent Intensification of the Western pacific Subtropical High Associated with the East Asian Summer Monsoon. J. Clim. 28 (7), 2873–2883. doi:10.1175/jcli-d-14-00569.1
Niu, R., and Zhai, P. (2013). Synoptic Verification of Medium-Extended-Range Forecasts of the Northwest pacific Subtropical High and South Asian High Based on Multi-center TIGGE Data. Acta Meteorol. Sin 27 (5), 725–741. doi:10.1007/s13351-013-0513-0
Song, F., and Zhou, T. (2014). Interannual Variability of East Asian Summer Monsoon Simulated by CMIP3 and CMIP5 AGCMs: Skill Dependence on Indian Ocean-Western Pacific Anticyclone Teleconnection. J. Clim. 27 (4), 1679–1697. doi:10.1175/jcli-d-13-00248.1
Tao, S., and Wei, J. (2006). The Westward, Northward Advance of the Subtropical High over the West Pacific in Summer. J. Appl. Meteorol. Sci. (in Chinese) 17 (5), 513–525. doi:10.11898/1001-7313.20060509
Wang, C., Weisberg, R., and Virmani, J. (1999). Western Pacific interannual variability associated with the El Niño-Southern Oscillation. J. Geophys. Res. 104(C3), 5131–5149. doi:10.1029/1998JC900090
Wang, B., Lee, J.-Y., Kang, I.-S., Shukla, J., Park, C.-K., Kumar, A., et al. (2009). Advance and Prospectus of Seasonal Prediction: Assessment of the APCC/CliPAS 14-model Ensemble Retrospective Seasonal Prediction (1980-2004). Clim. Dyn. 33, 93–117. doi:10.1007/s00382-008-0460-0
Wang, C., and Zou, L. (2004). West Pacific Subtropical High’s Interannual Variability and Relativity to ENSO. J. Trop. Meteorology (in Chinese) 20 (2), 137–144. doi:10.3969/j.issn.1004-4965.2004.02.004
Wen, N., Liu, Z., and Liu, Y. (2015). Direct Impact of El Niño on East Asian Summer Precipitation in the Observation. Clim. Dyn. 44, 2979–2987. doi:10.1007/s00382-015-2605-2
Wu, R., Hu, Z.-Z., and Kirtman, B. P. (2003). Evolution of ENSO-Related Rainfall Anomalies in East Asia. J. Clim. 16, 3742–3758. doi:10.1175/1520-0442(2003)016<3742:eoerai>2.0.co;2
Wu, B., Li, T., and Zhou, T. (2010). Relative Contributions of the Indian Ocean and Local SST Anomalies to the Maintenance of the Western North Pacific Anomalous Anticyclone during the El Niño Decaying Summer*. J. Clim. 23, 2974–2986. doi:10.1175/2010JCLI3300.1
Xie, S.-P., Hu, K., Hafner, J., Tokinaga, H., Du, Y., Huang, G., et al. (2009). Indian Ocean Capacitor Effect on Indo-Western Pacific Climate during the Summer Following El Niño. J. Clim. 22, 730–747. doi:10.1175/2008jcli2544.1
Yang, H., and Sun, S. Q. (2003). Longitudinal Displacement of the Subtropical High in the Western Pacific in Summer and its Influence. Adv. Atmos. Sci. 20, 921–933. doi:10.1007/BF02915515
Yang, J., Liu, Q., Xie, S.-P., Liu, Z., and Wu, L. (2007). Impact of the Indian Ocean SST basin Mode on the Asian Summer Monsoon. Geophys. Res. Lett. 34, L02708. doi:10.1029/2006GL028571
Yang, R., Xie, Z., and Cao, J. (2017). A Dynamic index for the Westward ridge point Variability of the Western Pacific Subtropical High during Summer. J. Clim. 30, 3325–3341. doi:10.1175/jcli-d-16-0434.1
Ying, M., and Sun, S. (2000). A Study on the Response of Subtropical High over the Western Pacific on the SST Anomaly. Chin. J. Atmos. Sci. (in Chinese) 24, 193–206. doi:10.1007/s10011-000-0335-3
Zhang, M., Li, S., Lu, J., and Wu, R. (2012). Comparison of the Northwestern Pacific Summer Climate Simulated by AMIP II AGCMs. J. Clim. 25, 6036–6056. doi:10.1175/JCLI-D-11-00322.1
Zhang, R., Min, Q., and Su, J. (2017). Impact of El Niño on Atmospheric Circulations over East Asia and Rainfall in China: Role of the Anomalous Western North Pacific Anticyclone. Sci. China Earth Sci. 60, 1124–1132. doi:10.1007/s11430-016-9026-x
Zhou, F., Ren, H. L., Hu, Z. Z., Liu, M. H., Wu, J., Liu, C. Z., and Tang, D. (2020). Seasonal Predictability of Primary East Asian Summer Circulation Patterns by Three Operational Climate Prediction Models. QJR Meteorol. Soc. 146, 629–646. doi:10.1002/qj.3697
Keywords: medium-range predictability, western north Pacific subtropical high, enso, NCEP-GEFS, ensemble reforecasts
Citation: Gao L, Ren P and Zheng J (2022) Medium-Range Predictability of Boreal Summer Western North Pacific Subtropical High and Its ENSO Modulation. Front. Earth Sci. 10:862989. doi: 10.3389/feart.2022.862989
Received: 26 January 2022; Accepted: 07 February 2022;
Published: 21 February 2022.
Edited by:
Ruihuang Xie, Ocean University of China, ChinaReviewed by:
Chao He, Jinan University, ChinaCopyright © 2022 Gao, Ren and Zheng. This is an open-access article distributed under the terms of the Creative Commons Attribution License (CC BY). The use, distribution or reproduction in other forums is permitted, provided the original author(s) and the copyright owner(s) are credited and that the original publication in this journal is cited, in accordance with accepted academic practice. No use, distribution or reproduction is permitted which does not comply with these terms.
*Correspondence: Li Gao, Z2FvbEBjbWEuZ292LmNu
Disclaimer: All claims expressed in this article are solely those of the authors and do not necessarily represent those of their affiliated organizations, or those of the publisher, the editors and the reviewers. Any product that may be evaluated in this article or claim that may be made by its manufacturer is not guaranteed or endorsed by the publisher.
Research integrity at Frontiers

Learn more about the work of our research integrity team to safeguard the quality of each article we publish.