 Luyang Zhang
 Zhaolin Wang1
- 1School of Public Administration, Chongqing Technology and Business University, Chongqing, China
- 2School of Public Administration and Law, Northeast Agricultural University, Harbin, China
- 3Yiyang Tobacco Monopoly Administration, Yiyang, China
As the research area of this study, Sanjiang Plain is an important grain-producing area and commodity grain base in China, which plays an important role in China’s food security and stability. From 2000 to 2015, the climatic conditions and cultivated land use in this region changed significantly. The climatic basis for the changes occurring to the regional cultivated land-use area was revealed using several analytical methods such as correlation coefficient and geographic detector. The findings are as follows: (1) The internal changes of cultivated land use were mainly from dry land changed to paddy field, and the area ratio of dry land to paddy field gradually decreased from 3.80:1 to 1.19:1. (2) The average air temperature and precipitation during the tillage period were 18.05 °C and 428.25 mm, respectively. (3) The long-term increasing temperature trend promotes the transformation from dry land to paddy fields, but the increase in June precipitation inhibits it. (4) Regional hydrothermal climatic factors can go some way toward explaining the cultivated land-use spatial distribution. The trends of two factors are interlinked, and together explain the changes more effectively than when just considering individual factors.
Introduction
Heated discussions between the United Nations Sustainable Development Goals (SDGs) and Nature-based Solutions (NbS) mean that climate change and its impact on food security have attracted the attention of several researchers, both in China and elsewhere (Khanal et al., 2018; Ali et al., 2020; Xu et al., 2020; Fujimori et al., 2022). The adaptability of agricultural production, cultivated land use, and layout to climate changes has become a hot topic. Although China’s grain output has maintained sustained growth for many years, it is still difficult to balance long-term production and demand. According to the theory of crop growth dynamics, climatic conditions such as temperature and precipitation are the basic limiting conditions for crops to grow. Only in suitable climatic conditions can crops be cultivated and then developed into cultivated land. But does climate change have an impact on the change of cultivated land use? What is the impact of climate change on cultivated land-use change? These questions have not been answered, which is not conducive to the protection and rational utilization of cultivated land resources. Therefore, responding and adapting cultivated land use to climate changes and adjusting climate adaptive planting to ensure national food security and stability are vitally important.
According to the Third National Assessment Report on Climate Change, China’s warming rate has exceeded the global average of 0.9–1.5°C/100a since 1900 (The third National Climate Change Assessment Report writing committee, 2015). With the change of climate, planting systems and cultivated land layout in China vary in their regional climate adaptability, and the expansion of paddy fields in the cultivated land is prominent. Northeast China is a typical area of paddy field expansion among cultivated land (Ye et al., 2009; Li et al., 2020), and climate change is an important reason for the development of paddy fields in that area. However, the response characteristics of changed cultivated land use and distribution under different climatic factors and trends remain unclear, and the climatic basis for the change of both paddy field and dry land also needs more research. Most of the studies on the use of cultivated land in response to climate change have focused on the impact of climate change on food security and grain production potential (Du et al., 2018a; Purola et al., 2018; Xiao et al., 2021; Dasgupta and Robinson, 2022), the analysis of the factors driving cultivated land-use change (Shi and Shi, 2015; Cao et al., 2016; Shao et al., 2020; Wang et al., 2021), and the simulation of cultivated land-use change under different climate scenarios (Zhou et al., 2017; Duku et al., 2018; Strasser et al., 2019; Giuliani et al., 2022). However, there are relatively few studies on the impact of regional climate change on the internal change of cultivated land use and its distribution. In some studies, annual climate data were selected for analysis, as it is clearly unsuitable to use annual mean analysis for areas with large climate differences and a short farming period.
Sanjiang Plain became an important grain base in China after its transformation from “Great northern wilderness” to “Great northern warehouse.” Since it is located in the northern part of the mid-temperate zone, the change in regional climate has been significant in recent years under the general environment of global warming (Liang et al., 2014). Temperature and precipitation are important limiting factors of regional crop planting. Since 2000, with regional and global climate warming, the suitable planting areas for crops shifting to the north has fostered the adjustment of regional cultivated land planting structures, increased planting area, and further increased grain output (Du et al., 2018b). Regional hydrothermal climate changes have a significant impact on cultivated land use. In the long run, the hysteresis of human activities in response to climate change is declining (Fang and Sheng, 2000), indicating that the hysteresis of the cultivated area in response to climate change has a decreasing trend. We selected the period 2000–2015 because the climate and cultivated land-use changes in the study area were significant. Using analytical methods, such as geographic detectors and correlation analysis, the climatic basic characteristics of the changes in the area of paddy fields and dry land were further clarified on the basis of understanding the changes in regional cultivated land use and internal structure, as well as the trend of hydrothermal and climate change during the farming period. This provides a basis for the adjustment of regional cultivated land planting structure and the guarantee of a stable food supply.
Overview of the Study Area
Sanjiang Plain is located in the northeast of Heilongjiang Province. The elevation ranges from −3 to 1,110 m, with the north, north-east, and south-east lying low and the north-west and south high (Figure 1). It is located in the humid, semi-humid, and mid-temperate continental monsoon climate zone. Its average annual temperature is 1–4°C and average annual precipitation is 450–650 mm. Moreover, the soil is mainly meadow soil and swamp soil, with a high organic and nutrient content, which is ideal for agricultural cultivation in this important grain supply area. In 2015, cultivated land was the principal land use, followed by forest.
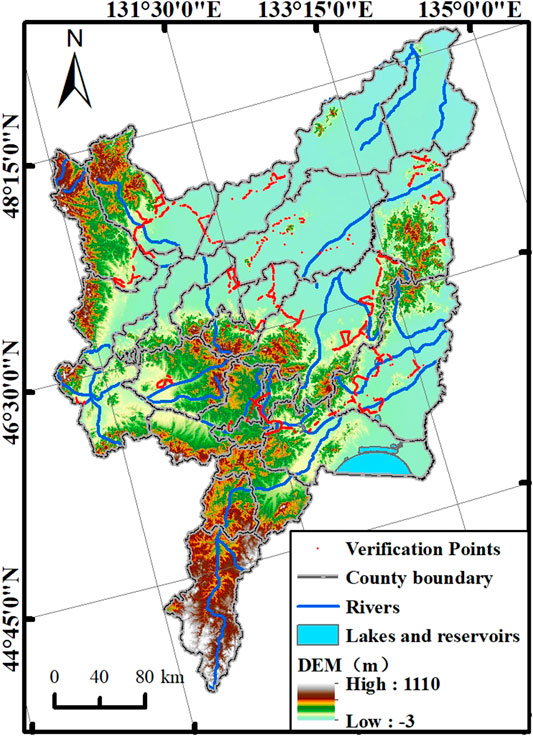
FIGURE 1. Schematic diagram of the study area.
Data Sources and Research Methods
Data Source and Pre-Processing
Cultivated Land-Use Data
Landsat TM images were used to visually interpret the changed areas in 2000, 2005, and 2015 based on the land-use data in 2010 using the ArcGIS platform. The 2010 land-use data were fully translated according to the “Remote Sensing Monitoring Data of China’s Land Use Status in 2010.” The data were released by the Resources and Environmental Science Data Center of the Chinese Academy of Sciences, with a scale of 1:100,000, good data accuracy and strong reliability (Liu, 1996). The interpretation and signs in 2000, 2005, and 2015 are the same as those in 2010, including 6 first-class land types and 25 second-class land types, of which, cultivated land includes both dry land and paddy fields. The interpretation results were tested and amended by means of field sample point verification (Figure 1). Finally, the cultivated land-use data in 2000, 2005, 2010, and 2015 were extracted for analysis.
Hydrothermal Climate Data
Climatic data were selected from the precipitation and temperature data during the tillage period (May–September) between 2000 and 2015 from “China Surface Precipitation (Temperature) Monthly Value 0.5° × 0.5° Grid Data Set (V2.0).” Due to the lack of temperature data from May to July and September in 2015, the missing data were calculated and supplemented according to the “China Surface Temperature Daily Value 0.5° × 0.5° Grid Data Set.” Additionally, in order to study the response of cultivated land use to regional hydrothermal climate change, the spatial resolution of the hydrothermal climate data was interpolated to 2 km by cubic convolution using the ArcGIS software Resample tool according to the grid scale standard of cultivated land use.
Research Methodology
Climatic Tendency Rate
We calculated the trend direction and degree of climatic factors over time to represent the long-term change trend of climatic factors (Wei, 2007).
xi represents the climatic factor variation with sample size n, and ti represents the time corresponding to xi. A linear regression equation of xi and ti is thus established:
For climatic factor variable xi and time ti, the least square estimation of regression coefficient b and constant a is
where b*10 is the climatic factor tendency rate, the unit of temperature tendency rate is °C/10a, and the unit of precipitation tendency rate is mm/10a. The positive or negative value of b indicates the trend direction of climatic factor x, and when b > 0, the climatic factor x increases with time t. When b < 0, the climatic factor x decreases with time t. The absolute value of b indicates the trend degree of climatic factor x.
Geo-Detector Factor Detection
Through the similarity of the independent variable X and dependent variable Y in the spatial distribution, the extent to which X explains the spatial differentiation of Y can be determined (Wang and Xu, 2017). The greater the similarity, the stronger the influence. Measured by q, the following expression is used:
where h = 1, … , L, h is a delamination of Y or X; Nh and N are the number of units in layer h and the whole region.
Geo-Detector Interaction Detection
The interaction between different factors of Xs was identified, and it was evaluated whether factors X1 and X2 will increase or weaken the influence of the dependent variable Y when acting together, or whether the effects of these factors on Y are independent of each other (Zhou et al., 2017). We calculated the influence of X1, X2, X1 ∩ X2 to Y, respectively, and compared q(X1), q(X2), and q(X1 ∩ X2). When q(X1 ∩ X2) < min (q(X1), q(X2)), the interaction between X1 and X2 on Y is nonlinearly weakened. When min (q(X1), q(X2)) < q(X1 ∩ X2) < max (q (X1), q (X2)), the nonlinearity of the single factor weakens. When q(X1 ∩ X2) > max (q(X1), q(X2)), it shows a two-factor enhancement. When q(X1 ∩ X2) = q(X1) + q(X2), it shows they are independent of each other. When q(X1 ∩ X2) > q(X1) + q(X2), it shows a nonlinear enhancement.
Results and Analysis
Analysis of Cultivated Land-Use Change
From 2000 to 2015, as for the changes of the cultivated land use in the study area, there were basically three types: dry land unchanged, dry land changed to paddy field, and paddy field unchanged (Figure 2). The areas where dry land has not changed are mainly located in the central and southern parts of the Sanjiang Plain, accounting for 51.28% of the total area. The areas where dry land has changed to paddy field area are mainly located in the northeast of the Sanjiang Plain, accounting for 24.68% of the total area. The areas where the paddy field has not changed are mainly distributed at the junction of the area where dry land has not changed and the area where dry land has changed to paddy field, accounting for 19.27% of the total area. Using the ArcGIS software mean center tool to calculate the density center of cultivated land-use change, it was found that the density center of dry land change and the density center of paddy field change showed opposite trends. In 2000, 2005, 2010, and 2015, the density center of the area where the dry land changed continued to move to the southwest, while the density center of the area where the paddy field changed kept moving northeast. The density center of the area where paddy field changed to dry land migrated to the northeast first and then to the northwest, with an overall trend of migration to the northeast. The density center from dry land to paddy field showed a trend of migration in the northeast direction first and then in the southwest direction, with an overall trend of migration to the northwest. Generally, the external change in cultivated land use in the Sanjiang Plain between 2000 and 2015 was small. The majority of transformations were internal changes in cultivated land use, and the area ratio of dry land to paddy field in the region gradually decreased from 3.80:1 in the year 2000 to 1.19:1 in 2015.
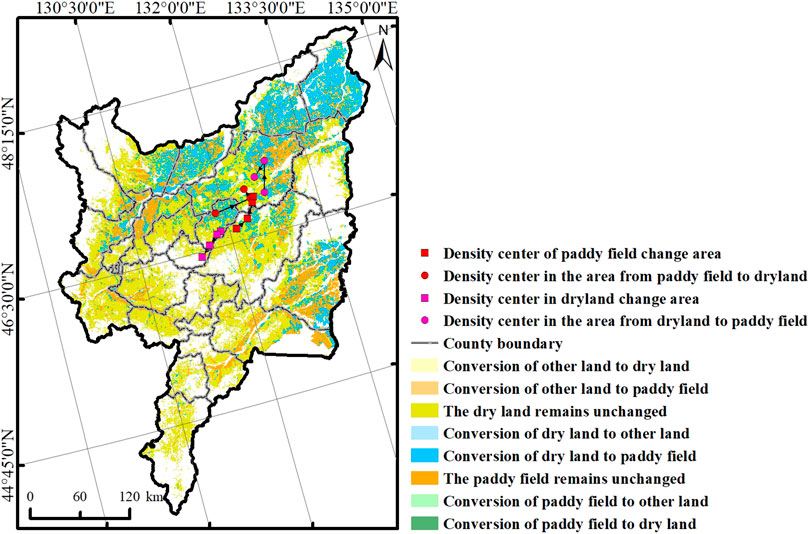
FIGURE 2. Changes in cultivated land use from 2000 to 2015.
Analysis of Climate Change of Water and Heat in the Cultivation Period
The average temperature and precipitation during the growing seasons from 2000 to 2015 within the study area were 18.05°C and 428.25 mm, respectively. The monthly variation of air temperature and precipitation during the tillage period is parabolic and reaches its peak in July. The Raster Calculator and Contour tool in ArcGIS software were used to calculate the climate tendency rate and draw isolines (Figure 3). The results show that the temperature tendency rate during the tillage period demonstrates a relatively obvious meridional zonality, with a gradual increase from west to east. Apart from the long-term decreasing trend of air temperature in some western regions, most regions show an increasing trend, and the warming range in the northeast of the study area is relatively high. The distribution of precipitation tendency rate within the tillage period does not display obvious zonal characteristics, but the characteristics of high precipitation in the north and low in the south are still obvious. Apart from the continuing decreasing trend in some southern areas, precipitation in most areas has risen, with increases in the northeast of the study area being noticeably high. Simultaneously, the precipitation tendency rate density degree is scattered in the north and dense in the south, and the regional difference of precipitation change in the north of the study area is relatively small, while that in the south of the study area is relatively large.
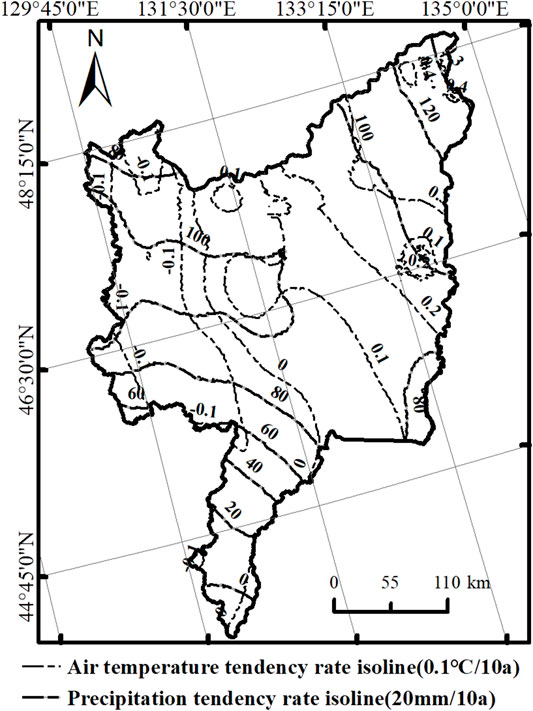
FIGURE 3. Distribution of isolines of tendency rate of hydrothermal climatic factors from 2000 to 2015.
Response Analysis of Cultivated Land Use to Hydrothermal Climate Conditions
Correlation Analysis
In order to analyze the spatial change of regional cultivated land areas, the ArcGIS software Fishnet tool was used to grid the cultivated land-use data in the study area. In order to avoid patch fragmentation caused by the gridding, based on comprehensively considering spatial heterogeneity, patch size, and other characteristics, the study area was divided into 27,927 2 km × 2 km grids while referring to the landscape ecology requirement of selecting 2–5 times the average patch area as the sampling grid size. We calculated the cultivated land-use change area in the grids between 2000 and 2015, and assigned the corresponding grid according to the calculated area. Since the change of cultivated land use in the study area is mainly an internal change, the response characteristics of dry land and paddy field to hydrothermal climatic factors vary. The changes in dry land and paddy field were calculated separately, and the spatial sequence correlation with hydrothermal climatic factors was attained. The types of cultivated land-use change are counted as dry land unchanged, dry land changed, dry land changed to paddy field, dry land changed to other, other changed to dry land, paddy field unchanged, paddy field changed, paddy field changed to dry land, paddy field changed to other, and other changed to paddy field. We considered the change and distribution of hydrothermal climatic factors during farming periods from 2000 to 2015, selected the temperature tendency rate (Tt), average temperature (Tm), average temperature in May (T5), average temperature in June (T6), average temperature in July (T7), average temperature in August (T8), and average temperature in September (T9). We also analyzed the precipitation tendency rate (Pt), mean precipitation (Pm), mean precipitation in May (P5), mean precipitation in June (P6), mean precipitation in July (P7), mean precipitation in August (P8), and mean precipitation in September (P9). The Pearson correlation coefficient of regional cultivated land-use change and spatial distribution of hydrothermal climatic factors was calculated via the SPSS software Correlation analysis tool.
By analyzing the correlation between dry land changed types and hydrothermal climatic factors (Table 1), it was found that the types of dry land changed to paddy field, dry land changed, and dry land unchanged have a relatively strong correlation with hydrothermal climatic factors, while the changes from other types of land to dry land and the changes from dry land to other types of land have a relatively weak correlation with hydrothermal climatic factors. Among all the hydrothermal climatic factors, the positive correlation coefficient between Tt and the conversion of dry land to paddy field is the largest, being 0.424, and the long-term increasing trend in regional temperature promotes the transition from dry land to paddy field. In addition, the negative correlation coefficient between P6 and the conversion of dry land to paddy field is the largest, which is 0.303, and the increase in regional precipitation during June inhibits the transformation from dry land to paddy field. The positive correlation coefficients of P9, Pt, T7, T8 and the conversion of dry land to paddy field are greater than 0.2, and an increase in related hydrothermal climatic factors can promote the transformation from dry land to paddy field. The positive correlation coefficient between P6 and dry land changed has the largest value at 0.264, and the increase of regional precipitation in June promotes the transformation from other land types to dry land. Moreover, the negative correlation coefficient between Tt and dry land changed has the largest value at 0.378, and the long-term increasing regional temperature trend promotes the transformation from dry land to other land types. The negative correlation coefficients of P9, Pt, and dry land changed are larger than 0.2, and the increase of related hydrothermal climatic factors promotes the transfer of dry land. The positive correlation coefficient between T5 and dry land unchanged shows the largest value at 0.283, and the increase in May regional temperature promotes dry land stability. The negative correlation coefficient between Tt and dry land unchanged is the largest at 0.260, and the long-term increasing regional temperature trend inhibits dry land stability and promotes change. The positive correlation coefficients of T6, Tm, T7, and dry land unchanged are greater than 0.2, and the increase in related hydrothermal climatic factors can promote dry land stability. The negative correlation coefficient between P9 and dry land unchanged is greater than 0.2, and the increase in regional precipitation in September has a restraining effect on dry land stability.
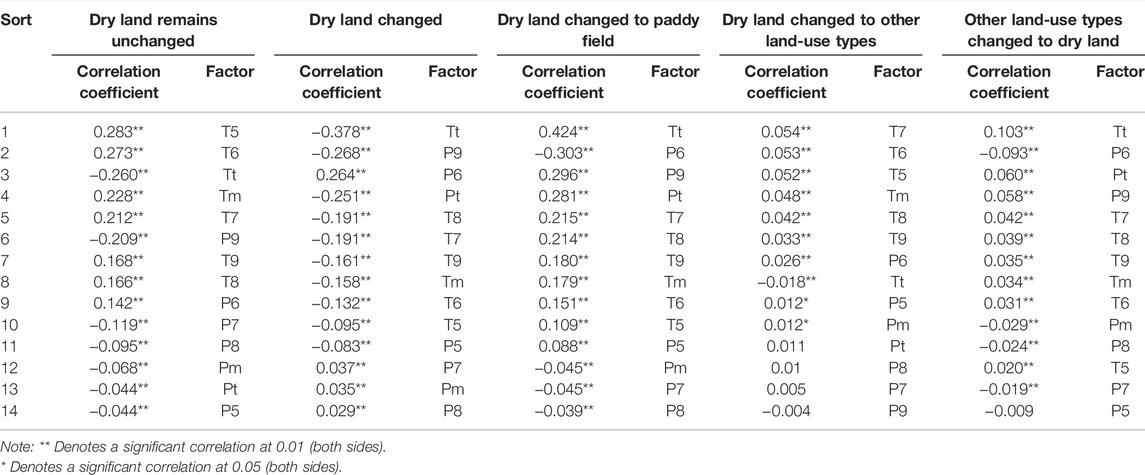
TABLE 1. Correlation order between dry land changed types and hydrothermal climatic factors.
Analysis of the correlation between paddy field changed types and hydrothermal climatic factors (Table 2) suggests that two types of land, namely paddy field changed and paddy field unchanged, are strongly associated with hydrothermal climatic factors, whereas the conversion of other types to paddy fields, the conversion of paddy fields to dry land, and the conversion of paddy fields to other types have relatively weak correlations with hydrothermal climatic factors. Among all the hydrothermal climatic factors, the positive correlation coefficient between Tt and paddy field changed is the largest at 0.431, and the long-term increasing regional temperature trend promotes the conversion of other land-use types to paddy fields. As for the negative correlation coefficient, the one between P6 and paddy field changed is the largest at 0.307, and the increase of regional precipitation in June promotes the conversion of paddy fields to other land-use types. The positive correlation coefficients of P9, Pt, T8, T7, and paddy field changed are all greater than 0.2, and the increase of related hydrothermal climatic factors can also promote the conversion of other land-use types to paddy fields. As for the positive correlation coefficient, the one between T8 and paddy field unchanged is the largest at 0.236, and the increase of regional temperature in August promotes paddy field stability. The positive correlation coefficients of T9, Tm, T7, and the paddy field unchanged are all greater than 0.2, and the increase of related hydrothermal climatic factors can also promote paddy field stability.
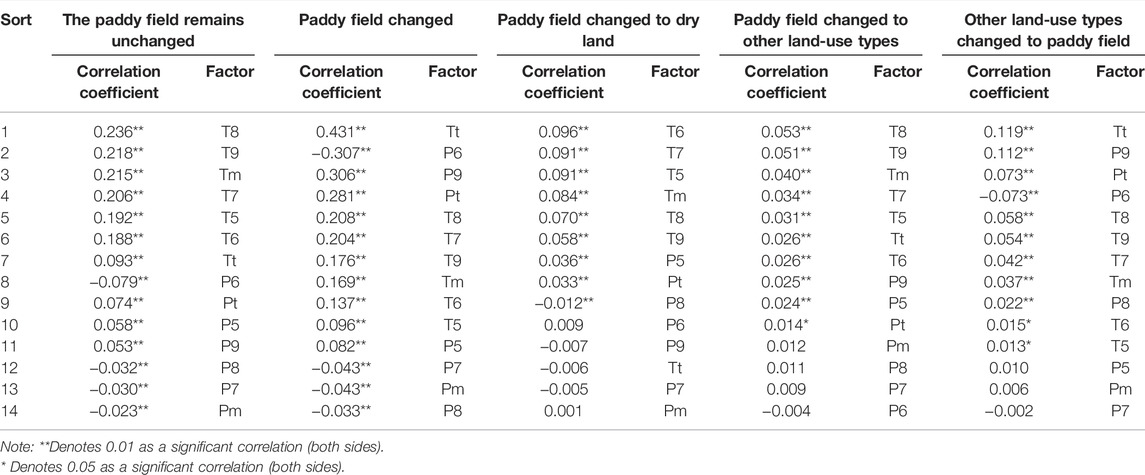
TABLE 2. Correlation between paddy field changed types and hydrothermal climatic factors.
Comprehensive analysis shows that the response of cultivated land-use change and hydrothermal climatic factors is mainly manifested as paddy field changed, dry land changed to paddy field, dry land changed, dry land unchanged, and paddy field unchanged, among which, the conversion from dry land to paddy field is the main constituent of paddy field transfer in and dry land transfer out. Temperature increases in the early stages of tillage favor dry land stability, while average temperature increases in the latter stages favor paddy field stability. The long-term increase in temperature during the farming period, the increase in precipitation in September, and the increase in the long-term trend in precipitation can all promote a reduction of dry land and increase of paddy fields, and promote the switch from dry land to paddy field. The increase of precipitation in June promotes the increase of dry land and decrease of paddy field, while inhibiting the switch from dry land to paddy field.
According to the theory and mechanism of crop growth dynamics, the growth of rice needs certain heat resources and accumulated temperature conditions. Therefore, the trend of long-term increase of air temperature provides a basis for the accumulation of accumulated temperature in the study area, provides necessary conditions for the growth and planting of rice, and is conducive to the expansion of paddy fields. In addition, the same season of water and heat will promote the good growth of rice, and the long-term increasing trend of precipitation is very helpful to rice planting. The dry land in the study area is dominated by maize and soybean, and the water absorption in the early and middle tillage period is the key to affect the quality, while the water demand in the late tillage period is relatively small.
Factor Spatial Effect Analysis
Due to the conversion of dry land to other land, other land to dry land, paddy field to dry land, paddy field to other land, and other land to paddy field, these types of cultivated land-use changes have a low correlation with regional hydrothermal climatic factors (all correlation coefficients <0.2). Consequently, it is ignored in the analysis of factor spatial influences. The types of cultivated land-use change that show a strong correlation with hydrothermal climatic factors were selected, and the spatial influence of hydrothermal climatic factors on cultivated land-use change was further analyzed via the Geographic Detector factor detection tool (Figure 4). As the software input requires quantifiable independent variables, it is necessary to reduce the amount of hydrothermal climatic factors, before dividing the independent variables into 15 levels, according to the natural breakpoint method matching the actual study area situation and relevant literary references. The results show that the influence of regional hydrothermal climatic factors in the spatial distribution on the five types of cultivated land-use change was significant (p < 0.01).
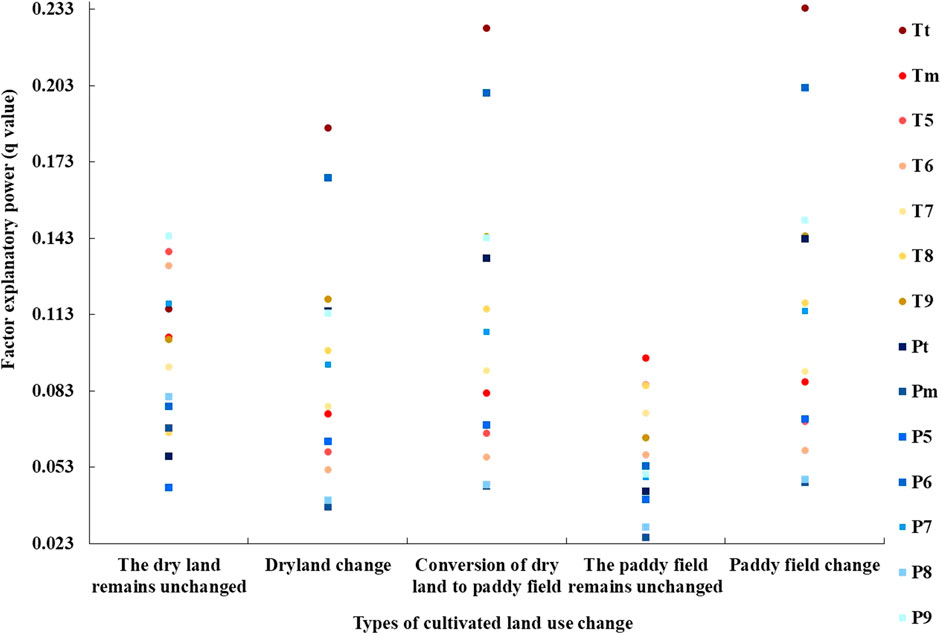
FIGURE 4. Spatial influence of hydrothermal climatic factors on cultivated land-use change.
Regional hydrothermal climatic factors have the greatest influence on the spatial distribution of paddy field changed, followed by dry land changed to paddy field, dry land unchanged, and dry land changed. Regional hydrothermal climatic factors have the weakest comprehensive explanatory power for the spatial distribution of paddy fields unchanged. Hydrothermal climatic factors with more than 10% influence on the spatial distribution of paddy field changed area are: Tt (23.4%), P6 (20.2%), P9 (15.0%), T9 (14.4%), Pt (14.3%), T8 (11.8%), and P7 (11.5%). The long-term regional temperature changes during the farming period, the precipitation in the middle and late periods of the farming period, the temperature in the late period of the farming period, and the long-term changes of the precipitation in the farming period all have a strong explanatory power for the spatial distribution of paddy field changed. The hydrothermal climatic factors that can induce more than 10% of the spatial distribution of dry land changing to paddy field area are: Tt (22.6%), P6 (20.0%), T9 (14.4%), P9 (14.3%), Pt (13.5%), T8 (11.5%), and P7 (10.6%). The long-term changes of regional temperature during the farming period, the precipitation in the middle and late periods of the farming period, the temperature in the late period of the farming period and the long-term precipitation in the farming period all show a strong explanatory power for the spatial distribution of the dry land changed to paddy field. The hydrothermal climatic factors with more than 10% influence on the spatial distribution of dry land unchanged area are: P9 (14.4%), T5 (13.8%), T6 (13.2%), P7 (11.7%), Tt (11.5%), Tm (10.4%), and T9 (10.3%). Precipitation in the middle and late periods of the regional farming period, the temperature during the farming period, and the long-term changes of temperature during the farming period have a strong explanatory power for the spatial distribution of the dry land areas that do not change. The hydrothermal climatic factors with more than 10% influence on the spatial distribution of dry land changed area are: Tt (18.6%), P6 (16.7%), T9 (11.9%), Pt (11.4%), and P9 (11.4%). The long-term changes of temperature during the farming period, the precipitation in the middle and late periods of the farming period, the temperature in the late period of the farming period, and the long-term precipitation during the farming period have a strong explanatory power for the spatial distribution of the dry land changed area. The explanatory power of hydrothermal climatic factors to the spatial distribution of the area where the paddy field is unchanged is less than 10%. The temperature conditions during the farming period have a strong explanatory power for the spatial distribution of the unchanging areas of paddy field.
Comprehensive analysis shows that the conversion from dry land to paddy field is mainly in the form of paddy field changed and dry land changed, and the influence of hydrothermal climatic factors on the spatial distribution of the above three is relatively consistent. The long-term temperature change trend during the farming period has the strongest explanatory power for the spatial distribution of the above three types. The precipitation in June, the precipitation in September, the temperature in September, and the long-term change trend of the precipitation in the farming period have a large explanatory power, all of which are greater than 10%, and these findings correspond to the results obtained from the correlation analysis of the three elements and the hydrothermal climatic factors. The monthly temperature during the tillage period strongly affects the spatial distribution of unchanging area of paddy field. The temperature is the limiting factor in regional paddy field planting, and differences in temperature greatly influence paddy field distribution. The precipitation in the later period of the cultivation period, the temperature during the cultivation period, and the long-term temperature change during the cultivation period have a strong explanatory power for the spatial distribution of the dry land areas without change, and related hydrothermal climatic factors affect the distribution of dry land.
Influencing Factors Interaction Analysis
Furthermore, the explanatory power of the spatial distribution of cultivated land-use changes under the interaction of two hydrothermal climatic factors was analyzed. It is found that the two hydrothermal climatic factors have an enhanced interaction effect on the spatial explanatory power of cultivated land-use changes, that is, the interaction effect of any two factors on the spatial distribution of cultivated land-use change is greater than that of one factor alone. Among them, the lowest interactive explanatory power of the hydrothermal climatic factors to the dry land unchanged area is 10.9%, while that to the dry land changed area is 9.7%. The lowest interactive explanatory power of hydrothermal climatic factors for the area from dry land changed to paddy field is 11.5%, while that for the constant paddy field area is 7.9%, and that for the paddy field changed area is 11.7%. Compared with a solitary action, the effect is significantly greater.
The interaction of hydrothermal climatic factors on the top 5 influences on spatial distribution of cultivated land-use change types was analyzed (Table 3). The interaction of P6 ∩ P9 on the spatial distribution of dry land changed to paddy field is a two-factor enhancement, and the rest are nonlinear enhancements. The maximum interactive explanatory power of dual hydrothermal climatic factors for the conversion of dry land to paddy field is 40.1%, which is 17.5% higher than the maximum explanatory power of the single factor. The maximum interactive explanatory power of the dual hydrothermal climatic factor to the change of dry land is 35.6%, which is 17.0% higher than the maximum explanatory power of the single factor, while that to the dry land unchanging area is 31.1%, which is 16.8% higher than the maximum explanatory power of the single factor. The maximum interactive explanatory power of the dual hydrothermal climatic factor to the paddy field change area is 39.7%, which is 16.3% higher than the maximum explanatory power of the single factor, while that to the constant paddy field area is 21.6%, which is 12.0% higher than the maximum explanatory power of the single factor. P5 ∩ P6 is the most significant interaction affecting the spatial distribution of the conversion of dry land to paddy field, paddy field change, and dry land change. Tt ∩ P7 is the most significant interaction that affects the spatial distribution of dry land invariant areas, and T5 ∩ P5 is the most significant interaction that affects the spatial distribution of the constant area of the paddy field.
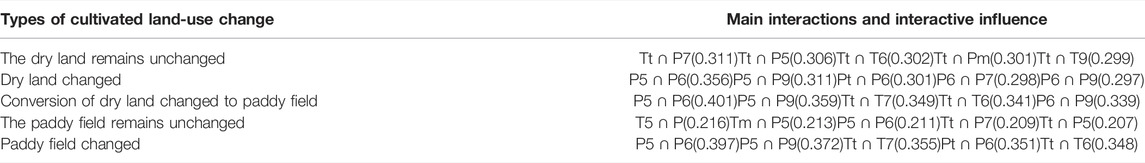
TABLE 3. Spatial interaction and influence of hydrothermal climatic factors on cultivated land-use change.
Conclusions and Discussions
Conclusions
As an important grain growing area, Sanjiang Plain has experienced significant changes in climate and cultivated land use between 2000 and 2015. The distribution and change characteristics of cultivated land use, the trend in hydrothermal climatic factor changes, and the response of cultivated land use to hydrothermal climate conditions in the study area were analyzed via hydrothermal climate data and cultivated land-use data during the tillage period. Studies have shown that:
1) From 2000 to 2015, the external change of cultivated land use in the study area was small. The internal change of cultivated land use was mainly from dry land to paddy field, and the area ratio of dry land to paddy field gradually decreased from 3.80:1 in the year 2000 to 1.19:1 in the year 2015. The density center of the dry land change area continued to move to the southwest, and that of the paddy field change area continued to move to the northeast. The density center of the area where paddy field changed to dry land migrated to the northeast as a whole, and the density center of the area where dry land changed to paddy land migrated to the northwest as a whole.
2) The average temperature and precipitation during the farming period from 2000 to 2015 were 18.05°C and 428.25 mm, respectively. The temperature tendency rate during the tillage period showed obvious meridional zonality, and gradually increased from west to east. In addition, the range of warming in the study area was relatively high. The precipitation tendency rate in the tillage period was high in the north and low in the south. The increase of precipitation of the study area was relatively high, and the regional difference was smaller in the north than in the south.
3) The increase of temperature in the early part of tillage promoted dry land stability, while the increase of temperature near the end of tillage promoted paddy field stability. The long-term trend of temperature increased during the cultivation period, the precipitation in September, and the long-term precipitation trend promoted the conversion of dry land to paddy land. The increase of June precipitation inhibited the conversion of dry land to paddy field.
4) Regional hydrothermal climatic factors had significant explanatory power on the spatial distribution of cultivated land-use changes, and the long-term trend of changing air temperature during the tillage period had the strongest explanatory power for the spatial distribution of paddy field changes, which was 23.4%. The conversion of dry land to paddy field was the main form of paddy field change and dry land change. The explanatory power of hydrothermal climatic factors on the spatial distribution of the three types of cultivated land-use changes was relatively consistent, and the long-term temperature trends during the cultivation period had the strongest explanatory power for the spatial distribution of the above three types of cultivated land-use changes. Air temperature is the limiting factor of regional paddy field planting, and changes in air temperature greatly influence paddy field distribution. The precipitation in the later period of the farming period, the temperature during the farming period, and the long-term change trend of the temperature during the farming period have a greater impact on the spatial distribution of dry land areas without change.
5) The explanatory power of the two hydrothermal climatic factors on the spatial distribution of cultivated land-use changes both showed an enhanced interaction, and its effect was significantly higher than through a single factor. P5 ∩ P6 is the most significant interaction that affects the spatial distribution of dry land changed to paddy field area, the spatial distribution of paddy field change area, and the spatial distribution of dry land change area. Tt ∩ P7 is the most significant interaction that affects the spatial distribution of dry land invariant areas, and T5 ∩ P5 is the most significant interaction that affects the spatial distribution of the constant area of the paddy field.
Discussions
Climate is the basic restrictive condition affecting cultivated land-use systems. Water and heat conditions have a direct impact on the distribution and change of cultivated land use by affecting the suitability of crop planting. This paper analyzes the response characteristics of cultivated land-use changes, especially changes in the scale and structure of paddy fields and dry land, and changes in hydrothermal climatic factors during the cultivation period. Northeast China is an area that is sensitive to global environmental change. Global warming increases the accumulated temperature and promotes the northward shift of crop planting boundaries, providing important pre-conditions for an increase in cultivated land (Man et al., 2016). Temperature is the main limiting factor for crop growth in northeast China. Temperature increase has different effects on the production potential of different crops in northeast China. It has the greatest impact on rice, followed by corn and soybeans, which have the least sensitivity to temperature changes (Zhou, 2015). The growth of rice is highly dependent on heat, and the increase of accumulated temperature promotes the northward movement of the suitable paddy field cultivation area (Gao and Liu, 2011). The influence of average annual temperature change on farmland productivity in the Sanjiang Plain is greater than that of average annual precipitation (Guo et al., 2009). Air temperature during tillage significantly influences the NDVI of paddy fields in the Sanjiang Plain (Zhang et al., 2021). The research results of this paper correspond with other relevant research conclusions. Air temperature is the limiting factor in regional paddy field planting, and variation in air temperature greatly influences paddy field distribution. The long-term air temperature change trend during the growing season has the strongest effect on the spatial distribution of conversion from dry land to paddy field, and the trend of increasing temperature will promote the conversion of dry land to paddy field.
Climate change has a certain impact on the use of cultivated land in the study area, especially the composition of dry land and paddy field, and promotes the transformation from dry land to paddy field to a certain extent. However, cultivated land utilization is a complex system, which is influenced by multiple factors such as natural conditions, human activities, and social economy. The influence mechanism is very complex. Regional topography, economic benefits of crops, and policy guidance will have an impact on the change of cultivated land use. This study discusses the impact of climate change on cultivated land use, especially the basic constraints of dryland and paddy field planting, without considering the interaction of climate and other factors, which is the limitation of this study and the direction to be carried out in the future. In addition, in the process of reclaiming wetlands into cultivated land, the change of land cover leads to the change of land surface reflectivity, which has an impact on land surface temperature (Shen et al., 2020). Although during the study period of this study, the regional cultivated land use mainly shows internal changes, that is, the transformation between dry land and paddy land, the influence of cultivated land use on land surface temperature is relatively small. This is still the limitation of this study and the direction to be carried out in the future.
The basic data of cultivated land use used in this study are based on Landsat TM data combined with visual interpretation. Although the interpretation results are modified by sampling data, according to the random sampling method, the calculation accuracy meets the basic research needs. Because of the imaging principle and resolution of remote sensing data, it is different from the real land cover, which cannot truly and completely express the real land cover. The inaccuracy of data sources will make the research results have some uncertainties (Zhang et al., 2017; Shen et al., 2020; Malkoç et al., 2021). At the same time, the accuracy of data sources restricts the research scale, resulting in the analysis accuracy of this study is mesoscale. In the future, we should combine meteorological station data and more detailed land-use data for small-scale analysis and research, and then put forward targeted farming decision-making suggestions.
The change in hydrothermal climatic factors promotes the transformation from dry land to paddy field in the Sanjiang Plain and enhances the development of the regional agricultural economy. However, the expansion of paddy fields has an important impact on the balance and allocation of regional water and soil resources (Lu et al., 2018; Zhou et al., 2018). It is possible that the temperature may decrease due to the “wetland effect” of paddy fields (Du et al., 2019), thus affecting the sustainable use of regional paddy fields. Making full use of the regional conditions and climate change characteristics, monitoring and evaluating the carrying capacity of regional water and soil resources, reasonably controlling the scale of paddy fields, the structure and layout of paddy fields and dry land, and alleviating the contradiction between supply and demand of water and soil resources are urgent problems which need to be solved.
Data Availability Statement
The original contributions presented in the study are included in the article/supplementary material, further inquiries can be directed to the corresponding author.
Author Contributions
GD contributed to the conception of the study; LZ performed the experiment; ZW and SE contributed significantly to analysis and manuscript preparation; LZ performed the data analyses and wrote the manuscript; ZC helped perform the analysis with constructive discussions.
Conflict of Interest
The authors declare that the research was conducted in the absence of any commercial or financial relationships that could be construed as a potential conflict of interest.
Publisher’s Note
All claims expressed in this article are solely those of the authors and do not necessarily represent those of their affiliated organizations, or those of the publisher, the editors and the reviewers. Any product that may be evaluated in this article, or claim that may be made by its manufacturer, is not guaranteed or endorsed by the publisher.
References
Ali, M. G. M., Ibrahim, M. M., El Baroudy, A., Fullen, M., Omar, E.-S. H., Ding, Z., et al. (2020). Climate Change Impact and Adaptation on Wheat Yield, Water Use and Water Use Efficiency at North Nile Delta. Front. Earth Sci. 14, 522–536. doi:10.1007/s11707-019-0806-4
Cao, Q. W., Wu, J. S., Tong, D., Zhang, X. N., Lu, Z. Q., and Si, M. L. (2016). Drivers of Regional Agricultural Land Changes Based on Spatial Autocorrelation in the Pearl River Delta, China. Resour. Sci. 38 (04), 714–727.
Dasgupta, S., and Robinson, E. J. Z. (2022). Attributing Changes in Food Insecurity to a Changing Climate. Sci. Rep. 12, 4709. doi:10.1038/s41598-022-08696-x
Du, C. Y., Gong, L. J., Zhang, Z. G., Zhao, H. Y., Wu, S., Tian, B. X., et al. (2018). Characteristics and Effects on Crop Production of Heat Resources Changes in Heilongjiang Province. Chin. J. Eco-Agriculture 26 (2), 242–252.
Du, G. M., Ma, J. P., Zhang, L. Y., Sun, X. B., Zhang, Z. Y., and Liu, Z. (2018). Spatiotemporal Characteristics of Grain Potential Productivity Change under the Background of Climate Change over the Past 50 Years in the Sanjiang Plain. Res. Soil Water Conservation 25 (02), 361–366.
Du, G. M., Liu, W. Q., Yu, J. X., and Zhang, S. (2019). Influence of Paddy Field and Dry Field Distribution on Local Surface Temperature by Remote Sensing Inversion in Sanjiang Plain. Trans. Chin. Soc. Agric. Eng. (Transactions CSAE) 35 (5), 259–267.
Duku, C., Zwart, S. J., and Hein, L. (2018). Impacts of Climate Change on Cropping Patterns in a Tropical, Sub-humid Watershed. Plos One 13 (3), e0192642. doi:10.1371/journal.pone.0192642
Fang, X. Q., and Sheng, J. F. (2000). Human Adaptation to Climate Change: a Case Study of Changes in Paddy Planting Area in Heilongjiang Province. J. Nat. Resour. 15 (3), 213–217.
Fujimori, S., Wu, W., Doelman, J., Frank, S., Hristov, J., Kyle, P., et al. (2022). Land-based Climate Change Mitigation Measures Can Affect Agricultural Markets and Food Security. Nat. Food 3, 110–121. doi:10.1038/s43016-022-00464-4
Gao, J., and Liu, Y. (2011). Climate Warming and Land Use Change in Heilongjiang Province, Northeast China. Appl. Geogr. 31 (2), 476–482. doi:10.1016/j.apgeog.2010.11.005
Giuliani, M., Lamontagne, J. R., Hejazi, M. I., Reed, P. M., and Castelletti, A. (2022). Unintended Consequences of Climate Change Mitigation for African River Basins. Nat. Clim. Chang. 12, 187–192. doi:10.1038/s41558-021-01262-9
Guo, Z. X., Wang, Z. M., Liu, D. W., Song, K. S., and Song, C. C. (2009). Analysis of Temporal and Spatial Features of farmland Productivity in the Sanjiang plain. Trans. Chin. Soc. Agric. Eng. (Transactions CSAE) 25 (1), 249–254.
Khanal, U., Wilson, C., Lee, B. L., and Hoang, V.-N. (2018). Climate Change Adaptation Strategies and Food Productivity in Nepal: a Counterfactual Analysis. Climatic Change 148, 575–590. doi:10.1007/s10584-018-2214-2
Li, Z., Liu, M., Hu, Y., Xue, Z., and Sui, J. (2020). The Spatiotemporal Changes of Marshland and the Driving Forces in the Sanjiang Plain, Northeast China from 1980 to 2016. Ecol. Process. 9, 24. doi:10.1186/s13717-020-00226-9
Liang, H., Wang, P. J., Zhang, J. C., and Li, W. J. (2014). Spatial and Temporal Distribution of Variation in Heat Resource over Northeast China during the Period from 1960 to 2011. J. Nat. Resour. 29 (3), 466–479.
Liu, J. Y. (1996). China Resources and Environment Remote Sensing Macro Survey and Dynamic Research. Beijing: China Science and Technology Press.
Lu, Z., Lei, G. P., Guo, J. P., Wang, J. W., Ma, X. P., and Li, S. Z. (2018). Study on the Balance of Water and Soil Resources in the Black Soil Area of Northern Songnen Plain. China Land Sci. 32 (03), 59–67.
Malkoç, E., Rüetschi, M., Ginzler, C., and Waser, L. T. (2021). Countrywide Mapping of Trees outside Forests Based on Remote Sensing Data in Switzerland. Int. J. Appl. Earth Observation Geoinformation 100, 102336.
Man, W. D., Wang, Z. M., Liu, M. Y., Lu, C. Y., Jia, M. M., Mao, D. H., et al. (2016). Spatio-temporal Dynamics Analysis of Cropland in Northeast China during 1990-2013 Based on Remote Sensing. Trans. Chin. Soc. Agric. Eng. (Transactions CSAE) 32 (7), 1–10.
Purola, T., Lehtonen, H., Liu, X., Tao, F., and Palosuo, T. (2018). Production of Cereals in Northern Marginal Areas: An Integrated Assessment of Climate Change Impacts at the Farm Level. Agric. Syst. 162, 191–204. doi:10.1016/j.agsy.2018.01.018
Shao, Y., Jiang, Q. o., Wang, C., Wang, M., Xiao, L., and Qi, Y. (2020). Analysis of Critical Land Degradation and Development Processes and Their Driving Mechanism in the Heihe River Basin. Sci. Total Environ. 716, 137082. doi:10.1016/j.scitotenv.2020.137082
Shen, X. J., Liu, B. H., Jiang, M., and Lu, X. G. (2020). Marshland Loss Warms Local Land Surface Temperature in China. Geophys. Res. Lett. 47, e2020GL087648. doi:10.1029/2020gl087648
Shi, X. L., and Shi, W. J. (2015). Identifying Contributions of Climate Change and Human Activities to Spatial-Temporal Cropland Changes: A Review. Acta Geographica Sinica 70 (9), 1463–1476.
Strasser, U., Förster, K., Formayer, H., Hofmeister, F., Marke, T., Meißl, G., et al. (2019). Storylines of Combined Future Land Use and Climate Scenarios and Their Hydrological Impacts in an Alpine Catchment (Brixental/Austria). Sci. Total Environ. 657, 746–763. doi:10.1016/j.scitotenv.2018.12.077
The third National Climate Change Assessment Report writing committee (2015). The Third National Climate Change Assessment Report. Beijing: Science Press.
Wang, F., Yuan, X., and Xie, X. (2021). Dynamic Change of Land Use/land Cover Patterns and Driving Factors of Nansihu Lake Basin in Shandong Province, China. Environ. Earth Sci. 80, 180. doi:10.1007/s12665-021-09476-y
Wang, S., and Xu, C. D. (2017). Instrumental Networking and Social Network Building: How Horizontal Networking and Upward Networking Create Social Capital. Acta Psychologica Sinica 49 (1), 116–134. doi:10.3724/sp.j.1041.2017.00116
Wei, F. Y. (2007). Modern Climate Statistical Diagnosis and Prediction Technology. Beijing: Meteorological Press.
Xiao, D., Zhang, Y., Bai, H., and Tang, J. (2021). Trends and Climate Response in the Phenology of Crops in Northeast China. Front. Earth Sci. 9, 811621. doi:10.3389/feart.2021.811621
Xu, Y. L., Zhao, Y. C., and Zhai, P. M. (2020). Advances in Scientific Understanding on Climate Change and Food Security from IPCC Special Report SRCCL. Clim. Change Res. 16 (1), 37–49.
Ye, Y., Fang, X. Q., Ren, Y. Y., Zhang, X. Z., and Chen, L. (2009). Changes in Cultivated Land Cover in the Northeast China in the Past 300 Years. Sci. China (Series D: Earth Science) 39 (03), 340–350.
Zhang, L. Y., Lei, G. P., Guo, Y. Y., and Lu, Z. (2021). Delayed Responses of Normalized Difference Vegetation index of Cultivated Land to Climatic Factors in Sanjiang Plain. Acta Pedologica Sinica 58 (2), 526–536.
Zhang, Y., Li, Q., Huang, H., Wu, W., Du, X., and Wang, H. (2017). The Combined Use of Remote Sensing and Social Sensing Data in fine-grained Urban Land Use Mapping: A Case Study in Beijing, China. Remote Sensing 9, 865. doi:10.3390/rs9090865
Zhou, G. S. (2015). Research prospect on Impact of Climate Change on Agricultural Production in China. Meteorol. Environ. Sci. 38 (1), 80–94.
Zhou, H., Lei, G. P., Yang, X. X., Zhao, Y. H., and Zhang, J. X. (2018). [Simulation for Balanced Effect of Soil and Water Resources on Cultivated Land in Naoli River Basin, Northeast China under the RCPs Climate Scene], Northeast China under the RCPs Climate Scene. Ying Yong Sheng Tai Xue Bao 29 (04), 1302–1312. doi:10.13287/j.1001-9332.201804.019
Keywords: land use, cultivated land-use change, response analysis, hydrothermal climate change, Sanjiang Plain
Citation: Zhang L, Wang Z, E S, Du G and Chen Z (2022) Analysis of Climatic Basis for the Change of Cultivated Land Area in Sanjiang Plain of China. Front. Earth Sci. 10:862141. doi: 10.3389/feart.2022.862141
Received: 25 January 2022; Accepted: 28 March 2022;
Published: 02 May 2022.
Edited by:
Li Peng, Sichuan Normal University, ChinaReviewed by:
Xiangjin Shen, Northeast Institute of Geography and Agroecology (CAS), ChinaXiaolan Wang, Southwest University of Science and Technology, China
Copyright © 2022 Zhang, Wang, E, Du and Chen. This is an open-access article distributed under the terms of the Creative Commons Attribution License (CC BY). The use, distribution or reproduction in other forums is permitted, provided the original author(s) and the copyright owner(s) are credited and that the original publication in this journal is cited, in accordance with accepted academic practice. No use, distribution or reproduction is permitted which does not comply with these terms.
*Correspondence: Guoming Du, bm1nZGdtQDEyNi5jb20=