- 1Northwest University, Xi’an, China
- 2Shangluo University, Shangluo, China
In recent years, under the background of the global climate, drought and flood disasters have occurred frequently in China. Historical climate research is an important part of the international Climate Variability and Predictability project. Based on the existing historical documents and literatures about counties and distributions in the Qinling Mountains from 1850 to 1959, we reconstructed a sequence of drought and flood grades. The characteristics of droughts and floods, including their phases, periodicity, and mutability in all regions from 1850 to 1959, were analyzed by employing the accumulative anomaly, wavelet analysis, and sliding t-test techniques. The results showed that there were 76 droughts and floods in the Qinling Mountains from 1850 to 1959, with droughts and floods occurred 29 and 47 times, respectively, accounting for 38.16% and 61.84% of the total events, respectively. The changes in drought and flood grade sequences in the Qinling Mountains had obvious phases, showing alternating dry and wet periods. A fluctuating climatic phase with both floods and droughts occurred from 1850 to 1879 and from 1949 to 1959; the climate was relatively wet from 1880 to 1912; the climate was relatively dry from 1913 to 1948. The seasonal variation in droughts in the Qinling mountains was concentrated on spring, summer, and back-to-back summer and autumn seasons; while the seasonal variation in floods was concentrated on summer and autumn, and back-to-back summer and autumn seasons. Moreover, there were two periods, 5∼7 a and 11 a, that corresponded to the El Niño-Southern Oscillation (ENSO) activity cycle and were consistent with global climate change. Through the sliding t-test technique and comparison of the drought-flood change sequence, there were two common significant mutations on a decade scale and 20-year scale. The positive PSDI swings are conducive to increased flood occurrence and negative PSDI values to increased drought occurrence, and these changes have good consistency of changes in the two data sources, and also verify the good reliability of the reconstruction results in this paper.
Introduction
The current global climate system is the cumulative result of natural changes in the past environment. To understand the current characteristics and future trends of climate, it is necessary to understand how the climate has changed from ancient times to the present. Therefore, the historical climate is an important part of the international Climate Variability and Predictability (CLIVAR) project (Duplessy and Overpeck, 1994). It is of great significance to reconstruct the historical climate change sequence using continuous historical data. As an ancient civilization with a long history and cultural tradition, China has abundant historical documents and continuous historical climate information, which have unique advantages in the field of historical climate research. In other words, these data provide greater possibilities for the reconstruction of China’s historical climate status and its evolutionary process (Zhu, 1973; Zheng et al.,1993; Bradley, 1993). Drought and flood are the two most frequent natural disasters in Chinese dynasties (Zhang et al., 2013; Zhang et al., 2014; Xiao et al., 2015) and had significant impacts on the regional social economy, agricultural production, and people’s lives and property safety. With the global environmental change, extreme climate events have occurred more frequently (Easterling, 2000), the impact of global drought and flood had further expanded, and the frequency of occurrence of global drought and flood disasters has increased; drought and flood events have gradually become a popular topic in climate research (Zhou, 2003; Wang et al., 2007; Xiao et al., 2015; Konisky et al., 2016; Paulo et al., 2016; Wan et al., 2018).
In recent years, the study of climate change in historical periods has been reconstructed from historical materials, especially the Ming and Qing Dynasty archives, and there have been more achievements. For example, Ge et al. (2007), Zheng et al. (2014), Hao et al. (2008), Ding and Zheng (2020), and Zhang et al. (1997) made a breakthrough in the processing of higher resolution data, such as Yu-Xue-Fen-Cun (Yu-Xue-Fen-Cun is China’s earliest, systematic historical archive of ancient weather conditions. To timely understand the agricultural affairs, the rulers of the Qing Dynasty required local officials to report to the Emperor in the form of official reports on the depth of rain (Yu) and snow (Xue) in the area under their jurisdiction, as well as the start and end date of rain and snow. Since “cun” and “fen” were the units of measurement in the Qing Dynasty, it was called “Yu-Xue-Fen-Cun”.) and established a series of basic climate change sequences, such as plum rain activity in the lower reaches of the Yangtze River and precipitation in the middle and lower reaches of the Yellow River, over the past 300 years. However, the spatial resolution of Yu-Xue-Fen-Cun data varies greatly. On the whole, the quantity and continuity of data in North China and the middle and lower reaches of the Yangtze River are relatively good, while the data are generally poor in other regions of China. Therefore, it is difficult to reconstruct high-resolution precipitation through historical data, but instead, the changes in drought and flood grades are mainly documented (Zhang et al., 2018), such as in the Atlas of Drought and Flood Distribution in China in the Last 500 Years and its subsequent reconstruction research (Institute of Meteorological Science, Central Meteorological Administration, 1981; Zhang and Liu, 1993; Zhang et al., 2003; Bai, 2010). For western China, which has a relatively special climate, it is relatively difficult to use historical materials to study its historical climate due to historical limitations and a lack of early data. However, a few scholars have collected a large amount of historical data, local chronicles, and some instrumental data, which make up for the lack of high spatial resolution data and have made great progress in reconstructing the sequences of droughts and floods. Bi et al. (2016) collected and classified drought and flood disaster data in eastern Northwest China from 1470 to 1912 and reconstructed the sequence of drought and flood grades. They found that the drought and flood grade sequence has a high degree of consistency with stalagmite oxygen isotope records during the same period and corresponds to another precipitation sequence, which can indirectly prove the reliability and feasibility of recovered historical flood and drought grade sequences based on historical documentary data. Based on the statistics and collation of the data of drought and flood disasters in the Baoji area from 1368 to 1911, Wan et al. (2018) believed that the successive occurrence of drought and flood events in the Baoji area during the Ming and Qing dynasties was a response to global climate change. Based on historical document records as proxy data, Han et al. (2019) reconstructed the sequence of extreme drought events in North China during 1000–2000 AD and then analyzed the characteristics and principles of these extreme drought events. Liu and Yang (2021) reconstructed the extreme drought and flood events in Southwest China over the past 600 years (1400–2000 AD). By using the drought and flood grade method and the percentile threshold method, they found that ENSO (El Niño-Southern Oscillation) and PDO (Pacific Decadal Oscillation) played an important role in extreme drought and flood events.
The Qinling Mountains are located in the ecological transition zone between warm temperate and subtropical zones in China and represent the most important ecological barrier and one of the richest areas of global biodiversity in central China. As an important geographic and climatic boundary between northern and southern China, this area represents a significant focus and hotspot for climate change research in China (Bai et al., 2019). In recent years, scholars have performed more research on the contemporary climate of the Qinling Mountains (Li et al., 2018; Zhang et al., 2018; Bai et al., 2019; Lu and Lu, 2019; Qi et al., 2020; Zhao et al., 2020; Zhang et al., 2021) but less research on the ancient climate of the Qinling Mountains. To understand the current characteristics and future trends of climate, it is necessary to understand how the climate has changed from ancient times to the present.
Based on the existing historical documents and literatures about counties in the Qinling Mountains, according to the criterion of droughts and floods grade, we reconstructed the sequence of droughts and floods grade from 1850 to 1959. To verify the reliability of the sequence, we performed a comparative analysis of the PDSI data and the sequence of the Qinling Mountains. This study is intended to provide theoretical support for climate refinement research, water resource protection, and regional ecological civilization in the Qinling Mountains.
Data and Methods
Overview of the Study Areas
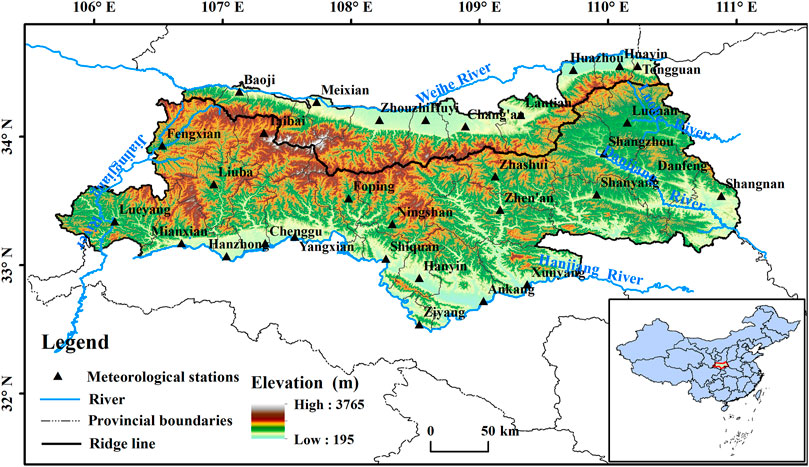
The Qinling Mountains stretch across the middle of China and represent a large mountain range that runs from east to the west and generally coincides with the January 0°C isotherm and 800 mm equipluve in China (Bai et al., 2019). The Qinling Mountains are the boundary between the humid monsoon climate and the semihumid monsoon climate, as well as the dividing line between the mixed evergreen and deciduous broad-leaved forest in the northern subtropics and the warm-temperate deciduous broad-leaved forest (Lu and Lu, 2019). The alpine and mid-mountainous landforms of the Qinling Mountains are generally 1500–3000 m above sea level, with a diverse climate, diverse mountain distribution, and obvious vertical zoning characteristics (Bai et al., 2019). As the altitude rises, the warm temperate zone and the medium temperate zone appear in turn, and a cold temperate zone and other vertical climatic zones appear (the southern slope is below the warm temperate zone, and there is a northern subtropical zone). The vertical zonality of the climatic zones and the corresponding vegetation also presents obvious vertical zoning characteristics. This study utilizes the hinterland of the Qinling Mountains in Shaanxi Province as the study area (105°42′∼111°06′E and 32°40′∼34°35′N). The Weihe River is the boundary between the Qinling Mountains to the north and the Hanjiang River to the south, and it traverses southern Shaanxi from east to the west (Figure 1).
Data and Preprocessing
The selection of historical documents took into account the influence of climate on a large scale and local climate change and selected historical books, local chronicles, and historical monographs were utilized as data sources. Data sources in this study were based on “A Compendium of Chinese Meteorological Records of the Last 3000 Years” (Zhang, 2000), “Brief Records on Historical Natural Disasters in Shaanxi” (Wang, 2002), “Encyclopedia of Meteorological Disasters in China; Shaanxi Volume” (Wen and Zhai, 2005), “Disaster History in Northwest China” (Yuan, 1994), and “A collection of historical materials on natural disasters in China’s agriculture” (Zhang, 1994). Shaanxi provincial chronicles and county and city chronicles of each administrative region in the Qinling mountains were also utilized.
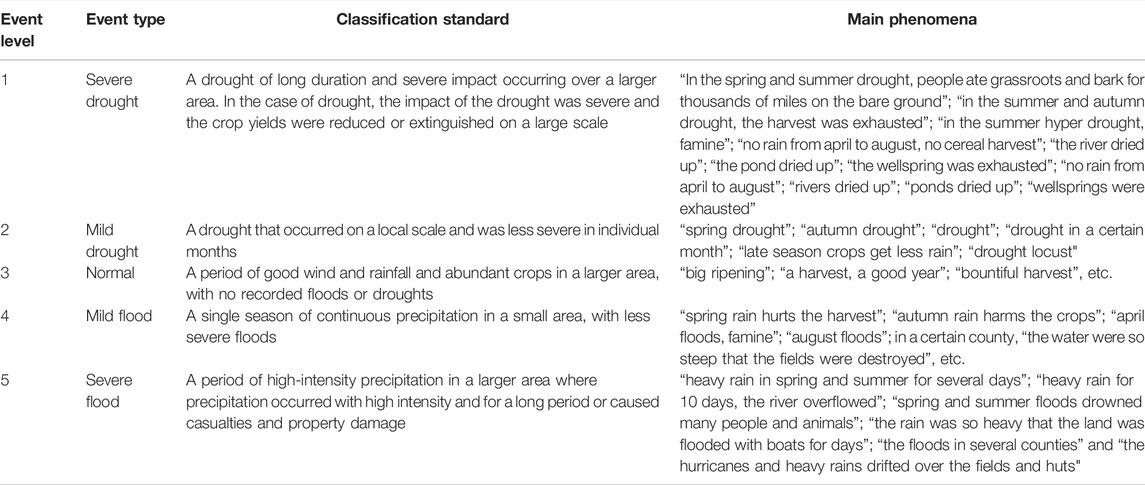
For the classification of drought and flood levels in the Qinling mountains, we referred to past classifications of drought and flood levels from the Distribution of Droughts and Floods in the Last 500 Years in China (CMA, 1981), Atlas of the Distribution of Droughts and Floods in the Last 500 Years in Northwest China (Bai, 2010), and the national standard of Classification of Meteorological Droughts (GB/T20481-2006). According to the descriptions of droughts and floods in limited historical data sources, following the duration, intensity, extent of damage, and degree of damage of the disasters, while taking into account the approximate proportion of various records, we classified droughts and floods into five levels based on the standards described in Table 1, including severe drought, mild drought, normal, mild flood, and severe flood. In our reconstructed series, we have validated the records using different sources for the same event. In our reconstructed series, we validated the records using different sources for the same event. We used the drought and flood events in Huaxian County in 1852 as an example. According to the classification standard, the key drought and flood phenomena can be found to discern the drought and flood levels.
It is important to note that when there were multiple records for a given year, the descriptions that were longer in duration, more widespread in impact, or had caused more damage or loss were selected for grading. If there were records of both drought and flooding in a given year and a review of the literature revealed that there was a record of “rain” in 1 month but drier records in two adjacent months, then it was classified as “mild drought.” According to the records of historical data, we can see that the drought in our paper is a combination of hydrological drought and agricultural drought (Tables 1, 2).
Material and Methods
Wavelet Analysis
Based on the Fourier transform, wavelet analysis is a time-frequency analysis method that reflects the local abruptness of time series and better analyses the characteristics of the series over time compared with the Fourier transform. In this paper, the wavelet coefficients are calculated by the wavelet transform method; the periodicity of the sequence is calculated by the real part distribution of the wavelet coefficients, and the wavelet variance reflects the change in the fluctuation energy of the time series with the time scale. Since the evolution of the time series of droughts and floods is continuous and has multiple time scales, this paper adopts the continuous complex wavelet transform based on the Morlet function for analysis. The continuous wavelet transform of the drought and flood hazard class function
where,
The wavelet transform form is:
Sliding t-test
The basic principle of the sliding t-test (Sheng et al., 2001) is to test for abrupt changes in a climate series by examining the significance of the difference between the means of two sample groups. The basic idea is to test whether there is a significant difference between the means of two subseries in a climate series as a question of whether there is a significant difference between the means from the two overall series. If the difference between the means of the two subseries exceeds a certain significance level, it is assumed that a qualitative change in the mean value has occurred and that a sudden change in the type and intensity of the hazard has occurred. Let us suppose the two contrastive sequences respectively are X1 and X2, while
where s1 and s2 respectively are the variances of X1 and X2; n1 and n2 are the lengths of the two sequences; t meets the distribution of t (n1+n2-2); and α is the given significance level. If
The Cross Wavelet Transform
The cross wavelet transform (XWT) was used to analyze the relationship between drought and flood sequence and ENSO and sunspots in the Qinling Mountains. The cross wavelet transform (XWT) of two time series
The cross-wavelet power spectrum can be defined as
This technique can study the interrelationship between two time series in the time-domain frequency from multiple time scales. The method can reveal the correlation and consistency at two different time scales and can reproduce the phase relationship in the time-frequency space.
Results
Characteristics of the Change in Drought and Flood Levels
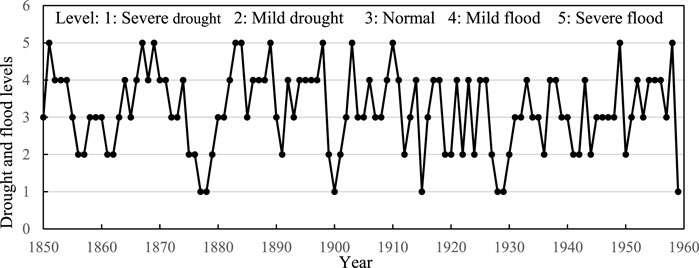
According to Figure 2, there were 76 drought and flood events in the Qinling Mountains from 1850 to 1959. There were 29 droughts and 47 floods, which accounted for 38.16% and 61.84% of the total events, respectively. According to the statistics of drought and flood levels, there were 7 severe droughts, 22 mild droughts, 34 normal years, 36 mild floods, and 11 severe floods. From 1850 to 1959, floods occurred more frequently than droughts, indicating a relatively humid climate in the Qinling mountains. There was a continuous distribution of droughts and floods in the level of droughts and floods, with alternating drought and flood events. In terms of the levels of droughts and floods, the Qinling Mountains were characterized by a continuous distribution between droughts and floods, with alternating patterns continuously existing in the drought and flood events.
Interannual Variation in Drought and Flood Characteristics
We statistically analyzed the drought and flood characteristics in the Qinling Mountains based on a period of every 10 years (Table 3). We found that a total of 76 drought and flood events occurred in Qinling from 1850 to 1959, and the average frequency was 1.45 years. Overall, the higher frequency of floods than droughts indicates a relatively wet climate in the Qinling mountains from 1850 to 1959. These drought and flood events occurred more frequently from 1870 to 1929, and the frequency showed an increasing trend. However, the frequency of drought and flooding varied in different periods as follows: droughts dominated from 1870 to 1879 and from 1920 to 1929; floods dominated from 1850 to 1869 and from 1950 to 1959; and there were few drought and flood events in 1930–1949.
The cumulative anomaly and 5-year sliding processing of the grade index of drought and flooding from 1850 to 1959 in the Qinling Mountains are shown in Figure 3, where the upward curve indicates a wet trend and the downward curve indicates a dry trend. The drought and flood series in the Qinling Mountains have obvious stage characteristics, which are mainly divided into a rising stage and a falling stage. The period of rising from 1880 to 1912 can be divided into a rising stage from 1880 to 1898, rising stage from 1904 to 1912, and decreasing stage from 1899 to 1904, indicating that flooding occurred more frequently than drought during this phase, while a drought lasting for approximately 5 years occurred between 1899 and 1904. After consulting the data, it was found that there was a large-scale drought with a long duration in approximately 1900. The declining stage from 1913 to 1948 indicates that droughts occurred more frequently than floods during this period.
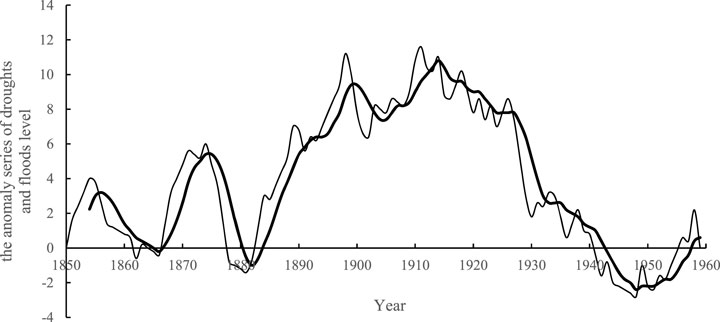
FIGURE 3. The anomaly series of drought and flood levels in the Qinling Mountains from 1850 to 1959 (the thin line is the anomaly series of drought and flood levels, and the thick line is the movable sequence for 5 years)
Generally, the droughts and floods in the Qinling Mountains fluctuated significantly from 1850 to 1959, showing alternating dry and wet periods. Floods were concentrated on the years 1850–1869 and from1880 to 1899, and droughts in the years 1910–1929. Fluctuations were relatively smooth for the first 30 years of the second half of the 19th century, followed by a trend of increased flooding, and then, as the 20th century progressed, drought events occurred more frequently than flooding events throughout the Qinling Mountains.
Seasonal Variation in the Characteristics of Droughts and Floods
The Chinese lunar calendar is used to divide the seasons, namely, spring from January to March, summer from April to June, fall from July to September, and winter from October to December. Among the disasters with obvious seasonal records in the existing literature data, drought and flooding in the Qinling Mountains occurred mainly in a single season but also occurred in two, three, or even four seasons (Figure 4). Among them, a single season was the most frequent period of drought and the most frequent in summer, and drought occurred 16 times in a single season, 9 times on the northern slope, and 7 times on the southern slope. Among the double season droughts, spring and summer droughts were predominant. Among the double season droughts, spring and summer droughts were predominant, with 10 occurrences, while triple and all-season droughts also occurred. Floods were also predominantly single-season floods, with summer and autumn being the most frequent periods of flooding, occurring 20 and 21 times, respectively, and flooding on the northern slopes was higher in summer than on the southern slopes, while on the southern slopes, it was higher in autumn than in summer; double-season floods were mostly consecutive floods in summer and autumn, occurring 19 times in total. There were no historical records of three or four seasons of flooding.
In conclusion, the seasonal variation in droughts in the Qinling mountains was concentrated on spring, summer, and back-to-back summer and fall seasons, while the seasonal variation in floods was concentrated on summer and fall, and back-to-back summer and autumn seasons. These seasonal characteristics of droughts and floods may have been related to monsoonal activity in the Qinling mountains.
The Periodical Characteristics of Droughts and Floods
Morlet wavelets were used to diagnose the characteristics of drought and flood cycles in the Qinling Mountains (Figure 5). The horizontal coordinates of the figure are time series, the vertical coordinates are time scales, and the contour curves are the real part values of wavelet coefficients for drought and flood levels (Figure 5A). The central closure of the contour corresponds to the center of precipitation abundance and deficit (center of drought and flood), with positive values indicating flood and negative values indicating drought and the size of the central value reflecting the intensity of fluctuating oscillations. Wavelet variance difference can reflect the change of signal wave energy, so as to determine the main period in a time series (Figure 5B). From the real part of the wavelet analysis (Figure 5A), we found obvious alternating characteristics in the Qinling mountains on the time scale, where a drought followed a flood and equally a flood followed a drought. However, overall, we demonstrated that flood events were still dominant in this period, which may have been related to the inherent frequency of climate change in the Qinling mountains. The wavelet variance analysis showed that there were three oscillation cycles at approximately 5∼7 a, 11 a, and 20∼32 a (Figure 5B). Among them, the 20∼32 periodic oscillation was at a maximum peak, which was the first cycle of drought/flood sequence change in the Qinling Mountains. What is clear from Figure 3 is that this is simply a result of one prolonged period of positive values of the drought-flood metric for 40 years (1890–1930). This is clearly a distortion effect of the wavelet analysis working with only 110 years of data. With this in mind, we removed all the results from the timescales of 20 years and longer. So, the 11 a periodic oscillation was the first cycle, and the 5∼7 a periodic oscillation was the second cycle. These significant cycles were consistent with sunspot activity and the El Nino activity cycle, indicating that the periods of drought and flood change in the Qinling Mountains were closely linked to the cycles of sunspot and sea-air movements.
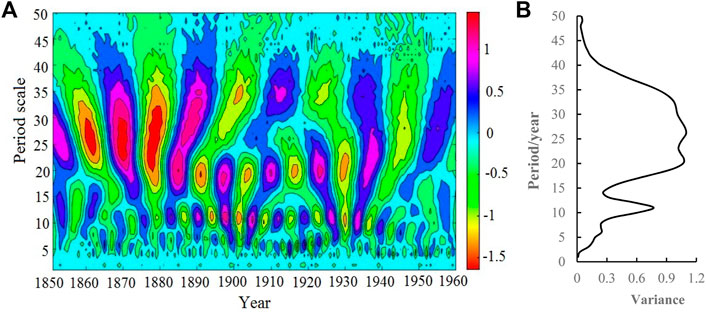
FIGURE 5. Wavelet analysis of real parts and variance plots of drought and flood hazard class indices in the Qinling mountains.
The Mutation Characteristics of Droughts and Floods
The sliding t-test method was used to determine drought/flood mutation by examining whether the difference between the means of the two groups of samples was significant. To avoid the drift of mutation points caused by arbitrarily selected subsequence length, we used variable subsequence lengths for experimental comparisons and determined the subsequence lengths to be 10 and 20 years. Under the given significance level α = 0.05, when n1 = n2 = 10, by t-distribution degrees of freedom f = n1 + n2−2 = 18 (t0.05 = ±2.101), the statistical values were above the significance level of 0.05 in 5 places (Figure 6A); when n1 = n2 = 20, f = n1 + n2−2=38 (t0.05 = ±2.024), there were 3 more places above the 0.05 significance level (Figure 6B).
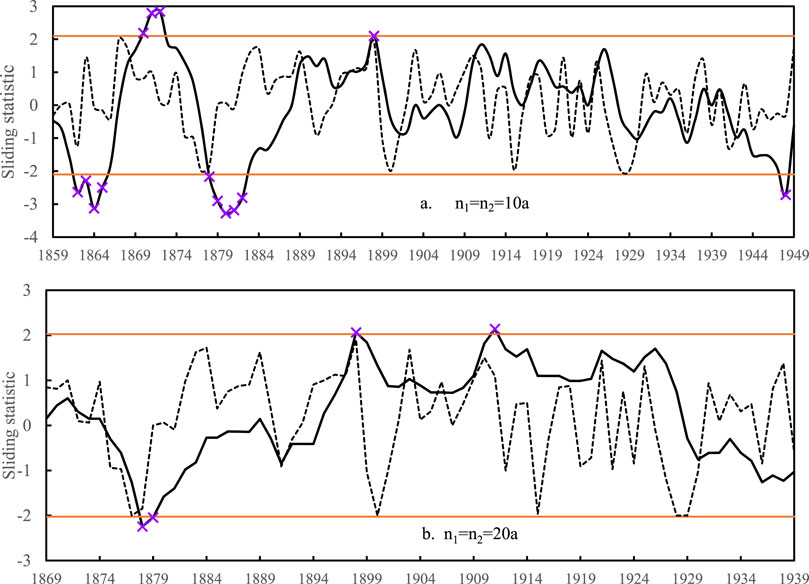
FIGURE 6. The sliding t-test statistic curve of drought and flood levels in the Qinling mountains from 1850 to 1959 (orange line is the threshold value line of the 95% t-distribution; thin black dashed line is the change line of the drought and flood sequence; thick black line is the statistic curve of the t-test; × is a mutation point).
Through the test and comparison of the two different subsequences, there were two significant mutations in common, which occurred in 1878–1882 and 1898. One of the two mutations was from the beginning of the drought period to the flood period, and the other was from the flood period to the drought period. From the perspective of the overall change, the climatic evolutionary features of drought period-flood period alternation are presented.
Discussion
Reliability Validation of Drought and Flood Grade Sequences
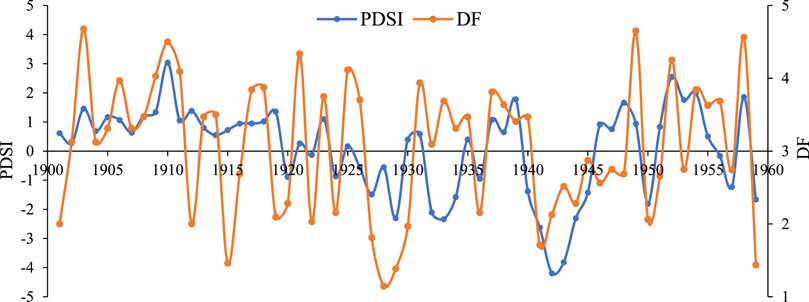
In the study area, the long-term trend of the drought and flood grade series and the PDSI for the Qinling Mountains from 1901 to 1959 were analyzed and compared to further investigate drought and flood conditions and test the reliability of the drought and flood grade series in the Qinling Mountains from 1850 to 1959 that was recovered from historical records. The PDSI data were obtained from the deglobalized 0.5° × 0.5° monthly scale self-corrected PDSI database constructed by the Climate Research Unit (CRU) of East Anglia University, United Kingdom. We downloaded the PDSI data of nine grids in the Qinling Mountains and took the average of all the grids as the PDSI values of the Qinling area. In order to satisfy the conditions for comparative analysis, the reconstruction period after 1901 was selected. In general, by breaking down the DF metric to consider the occurence of floods and droughts separately, we found the positive PSDI swings are conducive to increased flood occurrence and negative PSDI values to increased drought occurrence (Figure 7). These changes have good consistency of changes in the two data sources, and also verify the good reliability of the reconstruction results in this paper.
However, there are periods when droughts and floods do not coincide with the change of negative and positive PSDI values, such as the early 1930s and from 1946 to 1948. These differences in drought and flood changes may be due to the two indices have different classification criteria, and PDSI is a state-based metric with positive values denoting a wet extremes (i.e., floods) and negative values denoting dry extremes (i.e., droughts), and the DF metric is an occurrence-based metric—that includes both floods and droughts in the accounting; or due to different sampling points, different spatial scales of the reconstructed data, or human factors; or due to the reconstructed data were mainly based on the most significant drought and flood event per year, ignoring other less severe droughts and floods. While in general, the positive PSDI swings are conducive to increased flood occurrence and negative PSDI values to increased drought occurrence.
The Mechanisms of Floods and Droughts
The Qinling Mountains are located in the eastern monsoon region of China, which is the boundary between the northern subtropical zone and the warm temperate zone, and the mechanisms affecting Qinling Mountain drought and flood evolution are complex. It has been shown that precipitation in northern China is negatively correlated with SST in the eastern equatorial Pacific, and that ENSO is closely related to Asian monsoon variability and influences precipitation over most of China (Zhu and chen, 2002; Lu, 2005); when ENSO was in the cold phase, the Walker and Hadley circulations were strengthened by the higher SST over the equatorial Western Pacific, and the descending branch broke the subtropical high northward, presenting a humid climate in northern China (Yang and Lau, 2004). The periodic changes of 5∼7a in the drought-flood reconstruction sequence data further prove this relationship. Therefore, in order to further explore the relationship between drought and flood changes in the Qinling Mountains and the large-scale circulation, the reconstructed drought and flood data are analyzed with the Pacific Southern Oscillation index.
It has been shown that, during the very low solar activity period, the eastern part of China shows a “flood-drought-flood” pattern from south to north, i.e., the Yangtze River basin is drought-prone, and southern and northern China are flooded; the opposite is true for the very high period (Ge et al., 2016). There are negative correlations between precipitation and sunspots and they are most obvious in 9-year time scale in the Yellow River Basin in China (Li and Yang, 2006); the sunspot number and drought and flood of Guanzhong Plain in China showed negative relationship through 1960s, since the 1970s to the present, the two factors showed the positive relationship (Dou and Yan, 2013).
These studies demonstrate that there is a relationship between sunspots and changes in the drought and flood index series. In addition, since the cycles of drought and flood data in the Qinling Mountains are similar to those of sunspots, the relationship between drought and flood data and sunspots is analyzed in the paper. We chose sunspot number (1850–1959) and the Southern Oscillation Index (SOI, 1876–1959) to analyze the causes of drought and flood variability in the Qinling Mountains.
Through cross wavelet analysis (Figure 8), we found that there was a significant resonant periodic oscillation of approximately 9∼12 a between sunspot and Qinling drought/flood sequence values from 1850 to 1940. There was a significant positive correlation before 1910 and a significant negative correlation after 1910. That is, before 1910, when sunspots reached a peak year, the Qinling Mountains were prone to flooding events, and after 1910, when sunspots reached a valley year, the Qinling Mountains were prone to flooding events. During 1892–1920, the Southern Oscillation Index (SOI) and the drought/flood series in the Qinling Mountains had a significant resonant periodic oscillation of 4∼8 a, and the two were mostly positively correlated. The factors affecting Qinling Mountain drought and flood evolution are complex. Future studies should identify more influencing factors, conduct in-depth mechanistic exploration, and provide suggestions for the production of forestry and agriculture in this region. Nevertheless, the presented analysis suggests that there are periods where the occurence of droughts and floods vary distinctly with sunspot activity and SOI.
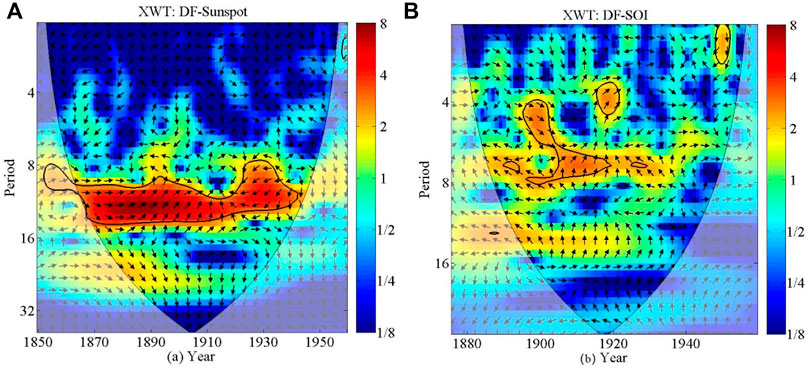
FIGURE 8. Cross wavelet power between DF and sunspot and between DF and SOI in the Qinling Mountains (Note: The closed area of the solid black circle is the standard background spectrum test with a 95% confidence level; arrows indicate the phase relationship, ← indicates a negative correlation between two series changes, → indicates positive correlation; ↑ indicates drought and flood sequence change lags the sunspot change phase by 90°, ↓ indicates drought and flood sequence change phase ahead of the sunspot by 90°; DF denotes drought and flood sequence; XWT: Cross wavelet transform).
The factors affecting Qinling Mountain drought and flood evolution are complex. Future studies should identify more influencing factors, conduct in-depth mechanistic exploration, and provide suggestions for the production of forestry and agriculture in this region.
Study Limitations
In this paper, the grade sequences of droughts and floods in the Qinling Mountains from 1850 to 1959 were reconstructed using historical data, but the droughts and floods can reflect only the trend of abnormal climate change, which is mainly determined by the nature of historical data itself. From the classification criteria of drought and flood grade, we can see that our reconstructed data were mainly based on the most significant drought and flood event per year, ignoring other less severe droughts and floods. However, the study of historical droughts and floods can be regarded as an effective method of research. Given the limitations of historical documents and literature, although the collected historical materials have been compared and verified, the years with no records or conflicting records have not been verified one by one, and the obscure language of historical materials leads to some subjectivity and uncertainty in the classification of classes. According to the definitions of meteorological drought, hydrological drought, agricultural drought, and socioeconomic drought, as well as the records of historical data and the classification criteria of drought and flood grade, we can see that the drought in our paper is quite difficult to distinguish properly between the different types of drought.
Wavelet analysis is a powerful tool for observing the periodic nature of timeseries, but we must be very careful in judging and interpreting the periodicity of time series between the timespan of the raw data and the periodic timescales of the wavelet decomposition. It is clear that wavelet timescales of 20 years or longer are compromised in the 100-year timespan of droughts and floods reconstruction. With this in mind, we removed all the results from the timescales of 20 years and longer. In addition, drought and flood occurrences are not only affected by ENSO and solar activity but also may be closely related to air-sea interaction influences and large-scale human activities, which will be the direction of future research.
Conclusion
In this paper, the grade sequences of drought and flood in the Qinling mountains from 1850 to 1959 were reconstructed by using historical data, and we used various mathematical methods to study the characteristics of drought and flood disasters in this region. Our conclusions are as follows:
A total of 76 drought and flood events occurred in the Qinling area from 1850 to 1959. Among these events, droughts and floods occurred 29 and 47 times, respectively, which accounted for 38.16% and 61.84% of the total events, respectively. From 1850 to 1959, floods occurred more frequently than droughts, indicating a relatively humid climate in the Qinling mountains. There was a continuous distribution of droughts and floods in the hierarchy of droughts and floods, with alternating drought and flood events.
The changes in drought and flood grade sequences in the Qinling Mountains had obvious phases. A fluctuating climatic phase with both floods and droughts occurred from 1850 to 1879 and from 1949 to 1959; the climate was relatively wet from 1880 to 1912, and the climate was relatively dry from 1913 to 1948. The seasonal variation in droughts in the Qinling mountains was concentrated on spring, summer, and back-to-back summer and autumn seasons, while the seasonal variation in floods was concentrated on summer and autumn, and back-to-back summer and autumn seasons.
Through the sliding t-test method and comparison of the drought-flood change sequence, there were two significant mutations in common, which occurred in 1878–1882 and 1898. One of the two mutations was from the beginning of the drought period to the flood period, and the other was from the flood period to the drought period. From the perspective of the overall change, the climatic evolutionary features of drought period-flood period alternation were presented.
Wavelet variance analysis showed that there were 2 oscillation cycles at approximately 5∼7 a, and 11 a. Sunspots and the Southern Oscillation Index (SOI) were closely related to the changes in drought and flooding in the Qinling Mountains.
The positive PSDI swings are conducive to increased flood occurrence and negative PSDI values to increased drought occurrence, which indirectly proved that the sequence recovered from historical documents has good reliability.
Data Availability Statement
The original contributions presented in the study are included in the article/Supplementary Material, further inquiries can be directed to the corresponding author.
Author Contributions
SZ: Investigation, Methodology, Writing—Original draft preparation. GQ: Conceptualization, Data curation, Software. KS: Visualization, Writing—Review and Editing. LZ: Data Curation, Formal analysis. HB: Supervision, Conceptualization, Project administration, Funding acquisition.
Funding
Funding for this work was provided from Shaanxi Agricultural Science and Technology innovation Drive project (NYKJ-2021-XA-005).
Conflict of Interest
The authors declare that the research was conducted in the absence of any commercial or financial relationships that could be construed as a potential conflict of interest.
Publisher’s Note
All claims expressed in this article are solely those of the authors and do not necessarily represent those of their affiliated organizations, or those of the publisher, the editors and the reviewers. Any product that may be evaluated in this article, or claim that may be made by its manufacturer, is not guaranteed or endorsed by the publisher.
Supplementary Material
The Supplementary Material for this article can be found online at: https://www.frontiersin.org/articles/10.3389/feart.2022.860750/full#supplementary-material
References
Bai, H. Y., Liu, K., Wang, J., and Li, S.-H. (2019). Vegetation Response and Adaptation in the Qinling Mountains under the Background of Climate Change. Beijing: The science press Press. (in Chinese).
Bai, H. Z. (2010). Atlas of Drought and Flood Distribution in Northwest China during the Last 500 Years (1470-2008). Beijing: China Meteorological Press.
Bi, S. B., Lu, Y., Bi, S. J., Qian, Y. J., and Sun, L. (2019). Characteristics and Comparative Analysis of the Reconstructed Drought/Flood grade sequence of eastern Northwest China from 1470 to 1912. Environ. Earth Sci. 78, 678. doi:10.1007/s12665-019-8706-1
Bradley, A. (1993). “Requirements for Defence Standard 00-55,” in High-Resolution Record of Past Climate from Monsoon Asia, the Last 2000 Years and beyond, Recommendations for Research (Beijing: PAGES Workshop Report, Series), 93–94. doi:10.1007/978-1-4471-3556-2_6
Central Meteorological Administration (CMA) (1981). Yearly Charts of Dryness/Wetness in China for the Last 500 Years Period. Beijing: Cartographic Publishing House. (in Chinese).
Ding, L. L., and Zheng, J. Y. (2020). Reconstruction and Characteristics Analysis of Series of Seasonal Drought/flood Grades over Hanjiang River Basin during 1735-1911. Geogr. Res. 39 (3), 721–734. (in Chinese). doi:10.11821/dlyj020190163
Dou, R. Y., and Yan, J. P. (2013). Relationships between Drought and Flood Disasters in Guanzhong Plain and the Activities of Sunspot. J. Arid Land Resour. Environ. 27 (8), 76–82. (in Chinese). doi:10.13448/j.cnki.jalre.2013.08.029
Du, R. S., Shang, F. H., and Ma, N. (2019). Automatic Mutation Feature Identification from Well Logging Curves Based on Sliding T Test Algorithm. Clust. Comput. 22, S14193–S14200. doi:10.1007/s10586-018-2267-z
Duplessy, J. C., and Overpeck, J. (1994). The PAGES/CLIVAR Intersection-Providing Paleoclimatic Perspective Needed to Understand Climate Variability and Predictability, Coordinated Research Objectives of the IGBP and WCRP Programs. Venice, Italy.
Easterling, D. R., Meehl, G. A., Parmesan, C., Changnon, S. A., Karl, T. R., and Mearns, L. O. (2000). Climate Extremes: Observations, Modeling, and Impacts. Science 289 (5487), 2068–2074. doi:10.1126/science.289.5487.2068
Ge, Q. S., Guo, X. F., Zheng, J. Y., and Hao, Z. X. (2007). Plum Rain Changes in the Middle and Lower Reaches of Yangtze River since 1736. Sci. Bull. 52 (23), 2792–2797. (in Chinese). doi:10.3321/j.issn:0023-074x.2007.23.016
Ge, Q. S., Liu, L. L., Zheng, J. Y., and Hao, Z. (2016). Spatial Patterns of Drought/flood over Eastern China in the Periods of Anomalous Solar Activity during the Past Millennium. Acta Geogr. sin. 71 (5), 707–717. doi:10.11821/dlxb201605001
Grinsted, A., Moore, J. C., and Jevrejeva, S. (2004). Application of the Cross Wavelet Transform and Wavelet Coherence to Geophysical Time Series. Nonlin. Process. Geophys. 11 (5/6), 561–566. doi:10.5194/npg-11-561-2004
Han, J. F., Yang, Y. D., and Man, Z. M. (2019). Reconstruction and Analysis of the Sequence of Extreme Drought Events in the North of China during AD 1000-2000. J. Palaeogeogr. 21 (4), 675–684. (in Chinese). doi:10.7605/gdlxb.2019.04.045
Hao, Z. X., Zheng, J. Y., and Ge, Q. S. (2008). Precipitation Cycles in the Middle and Lower Reaches of the Yellow River (1736−2000). J. Geogr. Sci. 18, 17–25. doi:10.1007/s11442-008-0017-5
Institute of Meteorological Science, Central Meteorological Administration (1981). Atlas of Drought and Flood Disaster Distribution in China in the Last 500 Years. Beijing: Cartographic Publishing House. (in Chinese).
Konisky, D. M., Hughes, L., and Kaylor, C. H. (2016). Extreme Weather Events and Climate Change Concern. Clim. Change 134 (4), 533–547. doi:10.1007/s10584-015-1555-3
Li, C. H., and Yang, Z. F. (2006). Relationship between Solar Activities and Precipitation in the Yellow River Basin. Meteorol. Mon. 31 (11), 42–44. (in Chinese). doi:10.3969/j.issn.1000-0526.2005.11.010
Li, S. S., Lu, J. Y., Yan, J. P., Liu, X., Kong, F., and Wang, J. (2018). Spatiotemporal Variability of Temperature in Northern and Southern Qinling Mountains and its Influence on the Climatic Boundary. Acta Geogr. Sin. 73 (1), 13–24. (in Chinese). doi:10.11821/dlxb201801002
Liu, W., and Yang, Y. D. (2021). Reconstruction and Analysis of Extreme Drought and Flood Events in Southwest China in the Past 600 Years. Quat. Sci. 41 (2), 368–378. (in Chinese). doi:10.11928/j.issn.1001-7410.2021.02.06
Lu, F. Z., and Lu, H. Y. (2019). A High-Resolution Grid Dataset of Air Temperature and Precipitation for Qinling-Daba Mountains in Central China and its Implications for Regional Climate. Acta Geogr. Sin. 74 (5), 875–888. (in Chinese). doi:10.11821/dlxb201905003
Lu, Riyu (2005). Interannual Variation of Precipitation in Flood Season in North China and SST over Equatorial Eastern Pacific. Chin. Sci. Bull. 50 (11), 1131–1135. (in Chinese). doi:10.1360/04wd0271
Paulo, A., Martins, D., and Pereira, L. S. (2016). Influence of Precipitation Changes on the SPI and Related Drought Severity. An Analysis Using Long-Term Data Series. Water Resour. Manage 30, 5737–5757. doi:10.1007/s11269-016-1388-5
Qi, G. Z., Bai, H. Y., and Meng, Q. (2020). Climate Change in the Qinling Mountains in Spring during 1959—2018. Arid Zone Res. 36 (5), 1079–1091. (in Chinese). doi:10.13866/j.azr.2019.05.04
Sheng, Z., Xie, S. Q., and Pan, C. Y. (2001). Probability and Mathematical Statistics[M]. Beijing: Higher Education Press. ( in Chinese).
Wan, H., Song, H., Zhu, C., Zhang, B., and Zhang, M. (2018). Spatio-temporal Evolution of Drought and Flood Disaster Chains in Baoji Area from 1368 to 1911. J. Geogr. Sci. 28 (3), 337–350. doi:10.1007/s11442-018-1476-y
Wang, S. S. (2002). Brief Records on Historical Natural Disasters in Shaanxi. Beijing: China Meteorological Press. (in Chinese).
Wang, S., Wen, X., Luo, Y., Dong, W., Zhao, Z., and Yang, B. (2007). Reconstruction of Temperature Series of China for the Last 1000 Years. Chin. Sci. Bull. 52 (23), 3272–3280. doi:10.1007/s11434-007-0425-4
Wen, K. G., and Zhai, Y. A. (2005). Encyclopedia of Meteorological Disasters in China: Shaanxi Volume. Beijing: China Meteorological Press. (in Chinese).
Xiao, L. B., Fang, X. Q., Zheng, J. Y., and Zhao, W. (2015). Famine, Migration, and War: Comparison of Climate Change Impacts and Social Responses in North China between the Late Ming and Late Qing Dynasties. Holocene 25 (6), 191–196. doi:10.1177/0959683615572851
Yang, F., and Lau, K.-M. (2004). Trend and Variability of China Precipitation in Spring and Summer: Linkage to Sea-Surface Temperatures. Int. J. Climatol. 24 (13), 1625–1644. doi:10.1002/joc.1094
Yuan, L. (1994). Disaster History in Northwest China. Lanzhou: Gansu People’s Publishing House. (in Chinese).
Zhang, B. (1994). A Collection of Historical Materials on Natural Disasters in China's Agriculture. Xi’an: Shaanxi Science and Technology Press. (in Chinese).
Zhang, D. E. (2000). A Compendium of Chinese Meteorological Records of the Last 3000 Years. Nanjing: Jiangsu Education Press. (in Chinese).
Zhang, D. E., Li, X. Q., and Liang, Y. Y. (2003). Renewal of the Atlas of Drought and Flood Distribution in China in the Last 500 Years (1993-2000). J. Appl. meteorological Sci. 14 (3), 379–388. doi:10.3969/j.issn.1001-7313.2003.03.015
Zhang, D. E., Liu, C. Z., and Jiang, J. M. (1997). Reconstruction of Six Regional Day/wet Series and Their Abrupt Changes during the Last 1000 Years in East China. Quat. Sci. 4 (1), 1–11. (in Chinese). doi:10.3321/j.issn:1001-7410.1997.01.001
Zhang, D. E., and Liu, C. Z. (1993). Supplement of the Atlas of Drought and Flood Distribution in China in the Last 500 Years (1980-1992). Meteorol. Mon. 19 (11), 41–45. (in Chinese). doi:10.7519/j.issn.1000-0526.1993.11.009
Zhang, J., Man, Z. M., Xiao, W. W., and Shen, Z. Z. (2013). Research on Sequence Reconstruction and Characteristics Diagnosis of Droughts and Floods in the Middle Yellow River since the Qing Dynasty (1644-2009). Geogr. Res. 32 (9), 1579–1590. doi:10.11821/dlyj201309001
Zhang, K. J., Yang, S., and Su, Y. (2014). A Comparison of the Spatial and Temporal Distribution of Flood and Drought in the Ming and Qing Dynasty. J. Earth Environ. 5 (6), 385–391. (in Chinese). doi:10.7515/JEE201406004
Zhang, S. H., Bai, H. Y., Qi, G. Z., Liang, J., Zhao, T., and Meng, Q. (2021). Changes of Climate Zone Boundary of the Qinling Mountains from 1960 to 2019. J. Nat. Resour. 36 (10), 2491–2506. (in Chinese). doi:10.31497/zrzyxb.20211004
Zhang, Y., Bai, H. Y., Su, K., Huang, X. Y., Meng, Q., and Guo, S. Z. (2018). Spatial Variation of Extreme Temperature Change on Southern and Northern Slopes of Shaanxi Section in Qinling Mountains during 1960-2013. Acta Geogr. Sin. 73 (7), 1296–1308. (in Chinese). doi:10.11821/dlxb201807009
Zhao, T., Bai, H., Yuan, Y., Deng, C., Qi, G., and Zhai, D. (2020). Spatio-temporal Differentiation of Climate Warming (1959-2016) in the Middle Qinling Mountains of China. J. Geogr. Sci. 30 (4), 657–668. doi:10.1007/s11442-020-1748-1
Zheng, J. Y., Zhang, P. Y., and Zhou, Y. F. (1993). During Historical Times by Using the Number of Drought/flood Counties. Geogr. Res. 12 (3), 1–9. (in Chinese).
Zheng, J., Ge, Q., Li, M., Zhang, X., Liu, H., and Hao, Z. (2014). Drought/flood Spatial Patterns in Centennial Cold and Warm Periods of the Past 2000 Years over Eastern China. Chin. Sci. Bull. 59, 2964–2971. doi:10.1360/n972014-00393
Zhou, Q. (2003). Analysis on the Correspondence between the Agricultural Disasters Caused by Droughts and Waterlogging in Baoji and the Climate Change in East China during the Past 1500 Years. Arid Zone Res. 20 (2), 123–126. (in Chinese). doi:10.7515/JEE201406004
Zhu, K. Z. (1973). The Primary Study of Climate Changes in China since the Past 5ka. Sci. China (Series B) 2, 169–189. (In Chinese).
Keywords: sequence of droughts and floods, wavelet analysis, climate change, the qinling mountains, historical climate
Citation: Zhang S, Qi G, Su K, Zhou L and Bai H (2022) Research on Sequence Construction and Characteristics Diagnosis of Droughts and Floods in the Qinling Mountains of China From 1850 to 1959. Front. Earth Sci. 10:860750. doi: 10.3389/feart.2022.860750
Received: 24 January 2022; Accepted: 01 June 2022;
Published: 23 June 2022.
Edited by:
Adam Schlosser, Massachusetts Institute of Technology, United StatesCopyright © 2022 Zhang, Qi, Su, Zhou and Bai. This is an open-access article distributed under the terms of the Creative Commons Attribution License (CC BY). The use, distribution or reproduction in other forums is permitted, provided the original author(s) and the copyright owner(s) are credited and that the original publication in this journal is cited, in accordance with accepted academic practice. No use, distribution or reproduction is permitted which does not comply with these terms.
*Correspondence: Hongying Bai, aG9uZ3lpbmdiYWlAMTYzLmNvbQ==
 Shanhong Zhang
 Guizeng Qi
 Kai Su1