 Zhanjun Chen
 Anzhao Ji1
95% of researchers rate our articles as excellent or good
Learn more about the work of our research integrity team to safeguard the quality of each article we publish.
Find out more
ORIGINAL RESEARCH article
Front. Earth Sci. , 15 February 2022
Sec. Structural Geology and Tectonics
Volume 10 - 2022 | https://doi.org/10.3389/feart.2022.860473
This article is part of the Research Topic Quantitative Characterization and Engineering Application of Pores and Fractures of Different Scales in Unconventional Reservoirs View all 24 articles
Fractures are the main seepage channels in tight reservoirs, and they affect the distribution of high-quality reservoirs and the enrichment of hydrocarbons. Fine logging identification of fractures in the strongly heterogeneous continental tight oil reservoirs of the Upper Triassic Yanchang Formation in the Ordos Basin is a hot and difficult point in the field of petroleum geology. In this paper, taking the Yanchang Formation as an example, a fractal model was constructed to identify fractures in tight oil reservoirs using a large number of cores, conventional and micro-resistivity imaging logging data. The results show that high-angle, vertical and bedding fractures are mainly developed in the Yanchang Formation tight sandstones. There is a negative correlation between sand body thickness and fracture development degree. The fracture sensitivity parameters were used to construct a coupled fractal fracture index. The fractal model incorporates logging information from natural gamma, acoustic wave time difference, rock density, and shallow lateral resistivity. In addition, the constructed fracture fractal index realizes the functions of multi-conventional logging information fusion, which can effectively identify fracture development segments in sandstone. According to the statistics, the fracture identification rate is 83.3%. The study also found that with the increase of sandstone brittleness index, the fracture index has a “S” shape increasing trend. Therefore, the content of brittle mineral components in sandstone is an important factor affecting the development degree of natural fractures, and fractures are more likely to occur in high brittle, thin sand bodies. The highly brittle framework minerals have strong stress-supporting capacity, which can keep fractures open by resisting high overlying loads.
In recent years, continental tight sandstone is considered to be another new hot spot in the global unconventional oil and gas exploration and development after shale gas (Dong et al., 2018; Chen et al., 2021). Natural fractures are commonly developed in tight oil sandstone reservoirs, and the degree of fracture development is a key factor for whether low permeability reservoirs can obtain high and stable productivity (Casini et al., 2016; Bhatti et al., 2020; Bukar et al., 2021). Fractures have well geophysical responses in well logs, so well logs are often used to identify natural fractures (Hu et al., 2020; Guo et al., 2021; Han et al., 2021; He et al., 2021). At present, the research methods of tight reservoir fractures around the world include core observation, experimental testing, conventional, imaging logging and seismic prediction (Nakaya and Nakamura., 2007; Lai et al., 2018; Li., 2021). The comprehensive evaluation of fractures involves the genesis mechanism, prediction and distribution law of fractures (Santosh and Feng., 2020; Wang and Wang., 2021; Xu and Dowd., 2010; Li, et al., 2020). Logging identifications of fracture are generally based on a single conventional log series or based on multiple log series (Dong et al., 2018; Chen et al., 2021; Han et al., 2021). Among them, fracture identification via multi-logging parameters has high fracture identification accuracy. Fracture identification models with multiple logging parameters are usually constructed on the basis of multiple regression method, differential equivalent model, principal component analysis, and variable-scale fractal theory (Yin and Wu., 2020; Han et al., 2021).
Large-scale tight sandstone reservoirs are developed in the Upper Triassic Yanchang Formation in the Ordos Basin. The distribution law of strong heterogeneity tight sandstone reservoirs is very complex (Cao et al., 2020; Lai et al., 2018). Previous predictions for “sweet spots” of oil reservoirs in the Ordos Basin were mainly based on studies for source rock distribution, sedimentary microfacies, petrophysical properties and diagenesis (Fan et al., 2020a; Fan et al., 2020b; Fu and Wang., 2020). However, in recent years, a large number of core-scale fractures have been found in the tight sandstones of the Yanchang Formation in the marginal areas of the Ordos Basin. Most of these fractures are vertical fractures with shearing properties, and their vertical penetration depths are mostly in the range of 1–5 m. The presence of fractures can significantly increase the permeability of tight reservoirs (Gao., 2019; Fan., 2020; Hong et al., 2020).
The strata of the Yanchang Formation in the western Ordos Basin are relatively gentle as a whole, and the horizontal fluctuation of the stratum per kilometer is usually less than 10 m. However, compared with the tectonic stability zone in the central Ordos Basin, the tectonic activity in the western Ordos Basin is relatively stronger, which is manifested by the development of small-scale faults and fractures (Lai et al., 2018; Yin, et al., 2018). However, with the in-depth exploration and development of hydrocarbons, more and more fractures have been discovered in the tight sandstones in the low-amplitude structural areas of the Ordos Basin. Although the degree of fracture development is relatively low, its influence on the migration and accumulation of oil and gas cannot be ignored (Olson et al., 2009; Peacock et al., 2018). On the one hand, these fractures can enhance the fluid migration ability and hydrocarbon accumulation, and on the other hand, they can affect the fracturing effect and well pattern deployment. Therefore, fractures are an important parameter in the evaluation of petroleum geology and engineering. For tight oil reservoirs, how to maintain long-term stable production and enhance oil recovery is the main problem faced by many oilfield companies. Therefore, it is particularly important to find an effective method for fine evaluation of fractures in tight reservoirs.
At present, there are few systematic studies on the fine logging evaluation of the tight oil reservoirs in the Yanchang Formation in the western Ordos Basin. Existing studies mainly focus on the qualitative aspects of fracture identification, fracture type classification, fracture origin and its evolution mode. In this paper, taking the Yanchang Formation as an example, a fractal model was constructed to identify fractures in tight oil reservoirs, combining a large number of cores, conventional and micro-resistivity imaging logging data. This study can provide guidance for the prediction of tight oil sweet spots in similar areas.
The study area is located in Block J (Figure 1A) in the west of the Yishan Slope, Ordos Basin, and the target layers are the Chang 6 and Chang 8 Members of the Upper Triassic Yanchang Formation (Figure 1B). The target layer has the structural form of low in the west and high in the east, but the strata in the west are buried deeper than those in the east. Nine oil groups are developed in the Upper Triassic Yanchang Formation, which are Chang 1, 2, 3, 4 + 5, 6, 7, 8, 9 and 10 Members from top to bottom. The Chang 6 and Chang 8 Members in the study area belong to delta sediments, and their provenance mainly came from the northern and NNE regions. Furthermore, the sedimentary microfacies can be further divided into distributary river channels and inter-distributary bays. In addition, the lithology of the target layer is feldspar sandstone, the porosity is mainly distributed in 5–10%, and the permeability is mainly distributed in 0.01–5 mD. The thickness of the sand bodies in Chang 6 and Chang 8 Members in the study area varies greatly, and the thickness of the strongly heterogeneous sand bodies is usually 0–25 m.
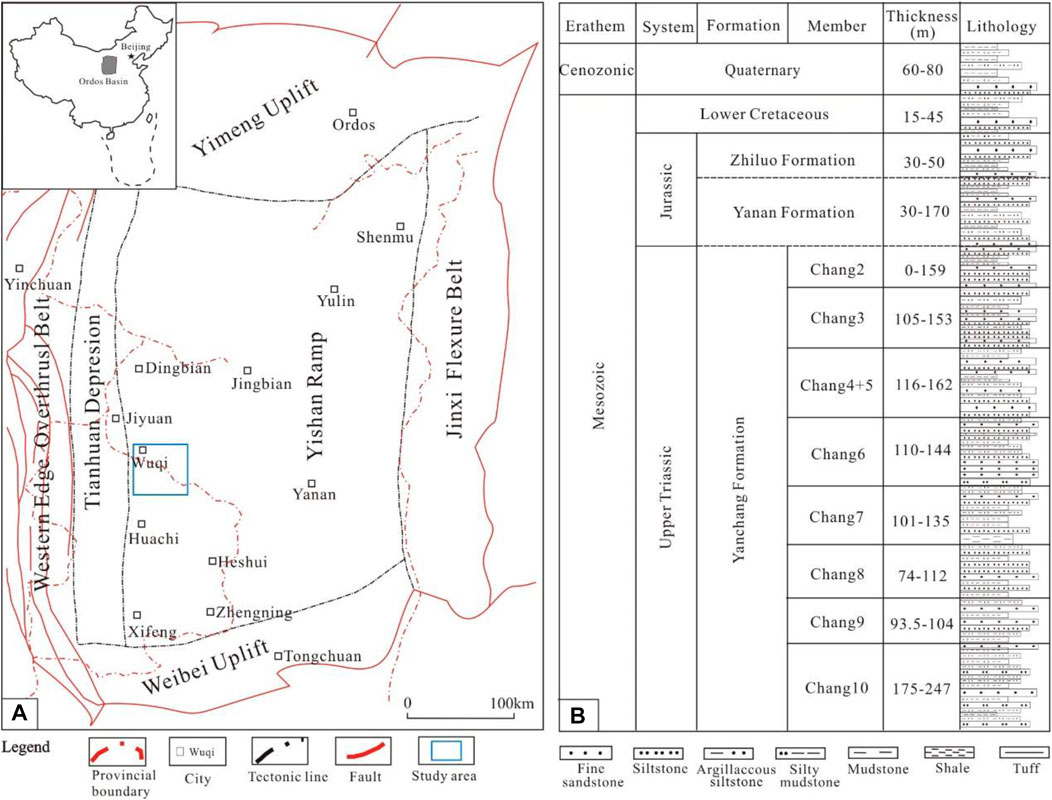
FIGURE 1. Location of the study area and division of stratigraphic units of the Upper Triassic Yanchang Formation. (A) The study area is located in Block J in the west part of the Yishan Slope, Ordos Basin; (B) The target layer is the Chang 6 and Chang 8 Members of the Upper Triassic Yanchang Formation.
The Yanchang Formation in the study area has the characteristics of multi-layer oil-bearing, wide sand body distribution and complex hydrocarbon accumulation. The Chang 6 and Chang 8 Members are the main layers of hydrocarbon accumulation. Figure 2 shows a well-connected section of the formation from Chang 6 to Chang 8 of the Yanchang Formation in the study area. It can be seen that the continental sediments of the Yanchang Formation are characterized by frequently interbeded sandstones and mudstones, and it is an important reason for the strong heterogeneity of hydrocarbon distribution. The areas with good lateral sand body connectivity represent distributary river channels, while in the areas on both sides of a certain main river channel, the sand bodies gradually become poorly connected (Figure 2). For the interdistributary bay areas, the proportion of mudstone is usually much greater than 60%. Thus, the lenticular sandstone is encased in thick mudstone (Figure 2).
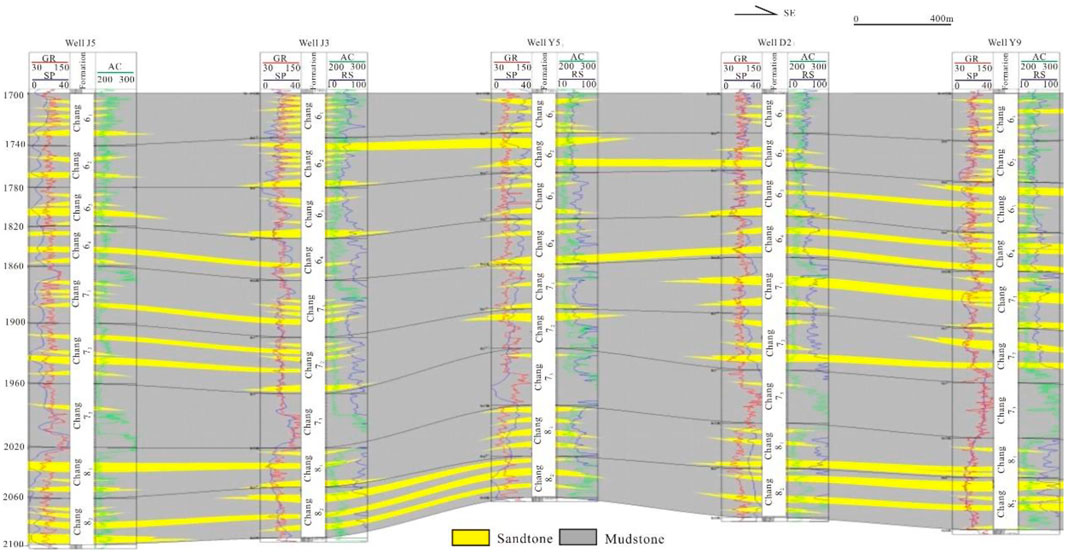
FIGURE 2. The stratigraphic well-connected profile of the Chang 6 to Chang 8 Members of the Yanchang Formation through the J5-Y9 wells in the study area.
The Chang 6 oil layer group in the study area is divided into four subgroups, Chang 61, Chang 62, Chang 63 and Chang 64 from top to bottom; while the Chang 8 oil layer group is divided into two sub-groups, Chang 81 and Chang 82, from top to bottom. The average porosity, permeability, oil saturation, and effective oil layer thickness of the target sandstone are 12%, 2.4 mD, 58%, and 6.5 m, respectively.
The target layer belongs to the delta front facies deposition, and the sand bodies have a wide distribution range and good spatial continuity. In addition, the maturity of the clastic grain composition in the sandstone is generally low, and the structural maturity is medium to good. For the interstitial component, it is mainly composed of clay minerals, carbonate minerals and matrix. The pore types of Chang 6 and Chang 8 sandstone reservoirs are mainly intergranular pores and secondary dissolved pores, which are typical low-porosity and low-permeability sandstone reservoirs.
There are a total of 150 wells in the study area, all of which have complete conventional logging. Fractures were observed in cores of 196 m target layer in 10 wells. Moreover, micro-resistivity imaging logging was conducted in 4 wells.
The essence of fracture identification based on fractal principle is to identify fractures by reducing the dimension of well logging data. The ratio (R/S) of the range (R) to the standard deviation (S) of the logging data was used to analyze the fluctuation of the data, and to determine the intervals where there may be fractures. The expressions of R and S are shown in formula (1) and formula (2) (Pang and North, 1996):
In the formula, R (t, n) is the distance of the sampling point sequence used for calculation; S (t,n) is the variance of the sampling points used for calculation; n is the number of intervals between sampling points, n < M; t is the serial number of the first sampling point in the sampling point; x (t + i) is the calculated sampling point data.
In double logarithmic coordinates, R(n)/S(n) has a linear relationship with n, and its slope H is called the Hurst exponent. H is related to the fractal dimension D, and has H = 2-D. Generally, the larger the value of fractal dimension D, the more developed the fractures (Barton et al., 2009; Camac and Hunt., 2009; Anders et al., 2014). The log curves that reflect the fractures significantly are selected to calculate the fractal dimension and weighted, and then the fractal index (FI) is obtained:
In the formula, FI is the indicator parameter of the rate of change of the arithmetically weighted curve; n is the number of characteristic parameters reflecting the rate of change of the curve; di is the weighting coefficient of the fractal dimension of the ith curve; Di is the fractal dimension of the ith curve.
The FI is calibrated by imaging data, and the lower fracture limit is set to 1. In turn, FI was used to further screen the fractured segments. Through the construction of the fracture index (FI) based on the fractal calculation of the log curves, the fine logging identification of the fracture development segment can be realized. The input parameters of this model are all conventional logging parameters, and the fusion and gradual elimination of multi-conventional logging information is realized. The technical route of this study based on the conventional logging fracture identification model is shown in Figure 3.

FIGURE 3. Workflow of fracture identification model based on coupling of multiple conventional logging parameters.
According to the statistical results of fracture observations in field outcrops and 196 m cores from 10 wells in the study area, high-angle, vertical and bedding fractures are mainly developed in the Chang 6 and Chang 8 tight sandstones of the Yanchang Formation in the western Ordos Basin (Figure 4). These fractures generally have shearing properties. The shear fractures are formed by the deformation of the rock mass under the action of strong compressive stresses, so they are tectonic fractures. The fracture surfaces of the shear fractures are very straight and scratches are common, and the dead ends between the fractures can be seen as folded tails. However, bedding fractures are formed by the dislocation of bedding or weak planes in the rock mass (Xu et al., 2006; Chen., 2020; Cheng et al., 2020).
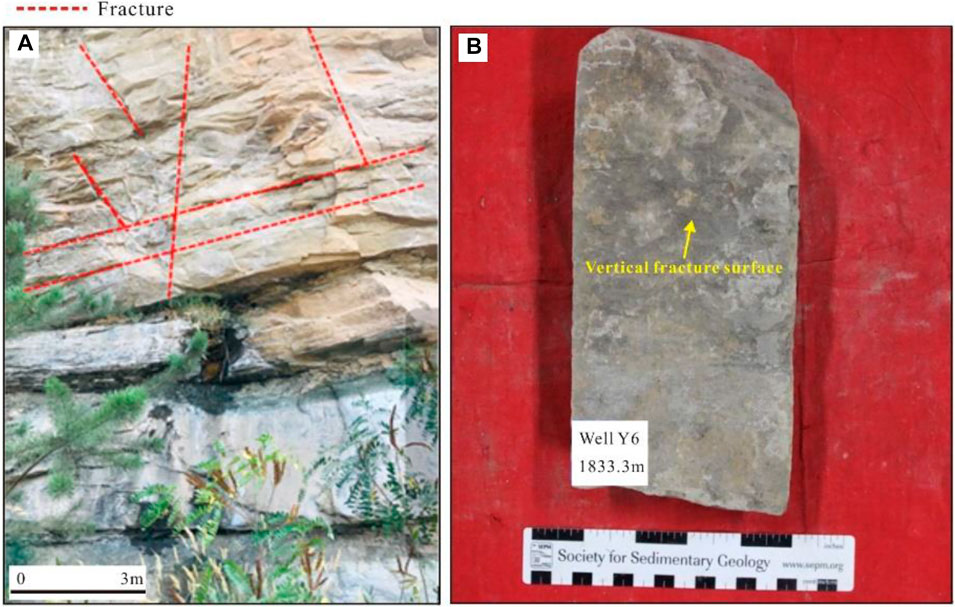
FIGURE 4. Development characteristics of fractures in the Yanchang Formation sandstone in the study area. (A) Yanhe Profile, Chang 6 Member outcrop; (B) High angle fracture, Well Y6, Chang 6 Member, 1,833.3 m.
The fracture surfaces found in core observation are mostly straight and smooth, and the ends of the fractures have folded tails, rhombus knot rings and rhombus bifurcations. The fractures in Figure 5A have been divided into four categories: horizontal, low-angle, high-angle, and vertical fractures, and the fracture dip angles are <5°, 5°–45°, 45°–85°, and >85°, respectively. Statistics show that vertical fractures account for 81.4%, low-angle, high -angle and horizontal fractures account for 6.2, 5.4 and 7%, respectively (Figure 5A). Vertical and oblique fractures (low-angle and high-angle fractures) are mainly formed by regional tectonic shearing; bedding fractures are mainly formed by the sliding of parallel bedding with peeling lines under the combined action of sedimentary and tectonic stresses (Dcrshowitz and Einstein., 1988; Du et al., 2019). There is also a close relationship between fractures and lithology. According to the statistical results, fractures are mainly developed in fine and ultrafine sandstones in distributary river channels and mouth bars, while fractures in far sand bars, sheet sand and mudstones are relatively underdeveloped (Figure 5B). Fracture linear density is often used to indicate the degree of fracture development in cores. The fracture linear density in the Yanchang Formation cores in the study area is usually within 0.2/m, and is concentrated at 0.04–0.16/m.
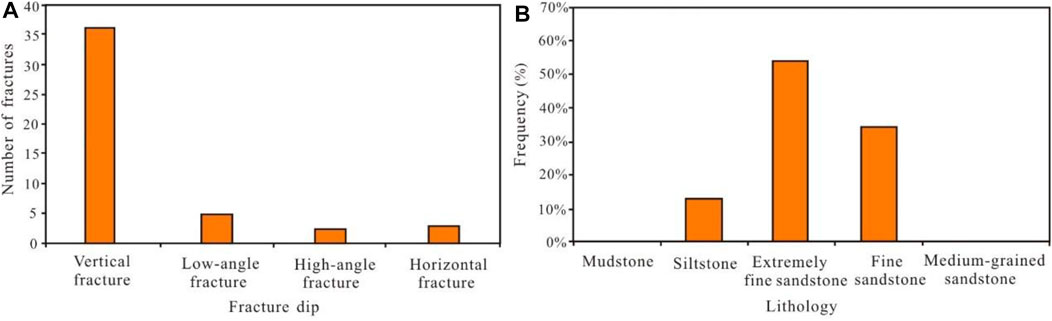
FIGURE 5. Histogram of fracture parameter distribution. (A) Classification of fracture types based on fracture dip angle; (B) Classification of lithological types of sandstone.
Figure 6 is the statistical results of the relationship between fracture linear density and sandstone thickness according to imaging logging. It can be seen from Figure 6 that with the increase of sandstone thickness, the thickness of fracture development gradually decreases. Specifically, when the thickness of the sandstone single layer is small (generally less than 5 m), the thickness of the sandstone is positively related to the thickness of the sandstone with developed fractures. When the thickness of the sandstone is large (generally greater than 20 m), the fractures in the sandstone are not developed. The stress concentration of local sand bodies is an important reason for the formation of fractures.
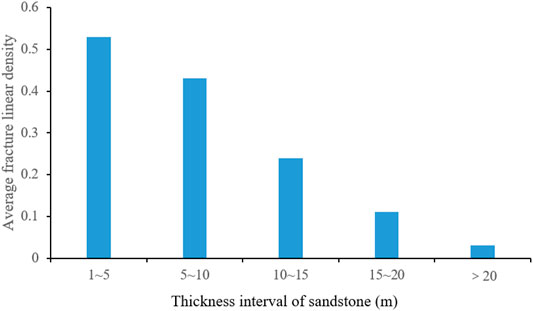
FIGURE 6. Relationship between the thickness of fractured sand bodies and the thickness of single-layer sandstone in the Chang 6 and Chang 8 oil layer groups in the study area.
Open fractures typically appear as dark sinusoids on imaging logs, while vertical fractures appear as symmetrical dark lines (Figure 7). When the formation fractures are half-filled or completely filled, the color of the sinusoidal curve displayed on the electro-imaging and acoustic imaging maps is different, depending on the filling degree and filling material. It is worth noting that in the identification of fractures in imaging logging, wellbore scratches, borehole collapse, and fractures induced by drilling tools due to engineering factors will interfere with the identification of normal fractures. Artificial fractures caused by these engineering factors have been excluded in this study.
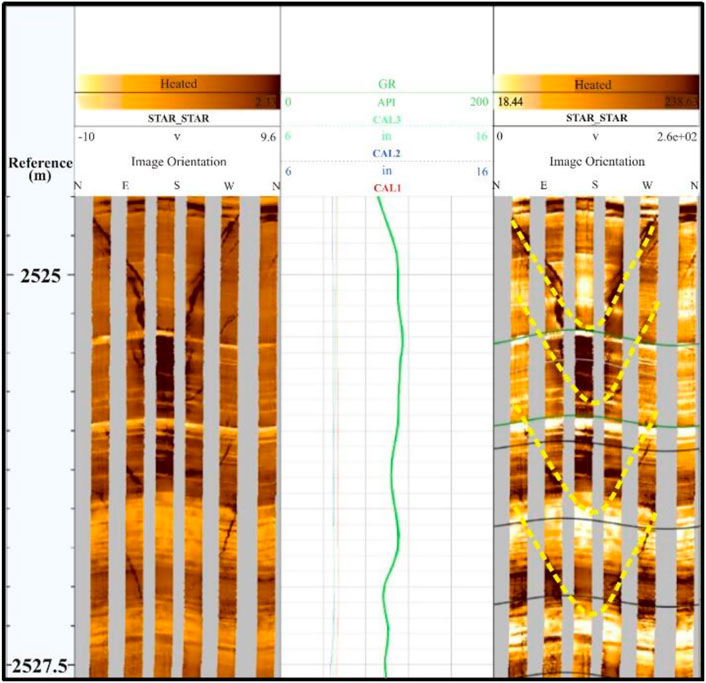
FIGURE 7. Imaging log response of fractures in Yanchang Formation in Well D41. GR - natural gamma; CAL1∼CAL3 - three well diameters measured by the six-wall dip tool.
The response of fractures on logging is mainly reflected in the series of lithology, resistivity and porosity. Lithology logging series includes natural gamma (GR), well diameter (CAL) and spontaneous potential (SP). Fractures always act as the migration channels and accumulation sites of underground fluids, and the migration and accumulation of fluids may lead to the precipitation of radioactive substances and then lead to radioactivity enhancement. However, the increase in the natural gamma value is generally weak, and it usually appears as a relative increase on a background of relatively low values of the natural gamma curves (Fan et al., 2020c; Fan et al., 2019).
In tight sandstone formations, due to the small porosity and strong brittleness of the formation, the formation is easily broken under the action of drilling torque force. This phenomenon is particularly prominent in fracture-developed areas, which can easily lead to expansion of well diameter. Therefore, the variation of well diameter can be used to predict the development intervals of fractures. Generally, when high-angle fractures are developed in the formation, the direction of well diameter expansion is consistent with the minimum horizontal principal stress of the formation, which indicates the development direction of the fractures (Laubach et al., 2009; Jiang et al., 2016; Huang et al., 2021). In fact, there are many factors that cause the change of well diameter. Lithology changes and their combined characteristics can cause well diameter changes. The well diameter of Chang 6 and Chang 8 reservoirs in the study area is affected by the scale of fracture development. In the low fracture development zone, the size of the wellbore drilled is basically unchanged. However, in the relatively developed area of vertical fractures, the well diameter of some wells has changed slightly (Mardia et al., 2007; Kang., 2021; Liu et al., 2021). For the natural potential, the fracture-developed intervals have better infiltration, and the natural potential curve shows a slight negative anomaly.
During the drilling process, the drilling fluid will invade the formation along the fractures in the formation, thereby changing the resistivity value of the rock. In the fracture development section, the resistivity appears abnormally low. It tends to appear as a needle-like sudden jump in low resistivity against a background of deep or shallow lateral resistivities (RD or RS). Where there are fractures, there are usually obvious abnormally low values of microlateral resistivity. For open, horizontal or low-angle fracture development sites, the octagonal resistivity (RFOC) typically exhibits low values.
Microelectrode resistivity logging has a small detection range and high vertical resolution. When the water-based drilling fluid is used to drill to the fracture-developed intervals, the micro-potential and micro-gradient curve values of the micro-electrode will decrease to a certain extent (Nelson., 1985; Ortega et al., 2006; Mizoguchi and Ueta., 2013). However, in formations with higher shale content, the relative magnitude of resistivity reduction will be attenuated due to the low resistivity background value. The Chang 6 and Chang 8 members in the study area are dominated by sandstone, mudstone and shale, with high shale content. Well sections with developed fractures generally show a small positive difference or insignificant amplitude difference between deep and shallow resistivity.
Fractures will form an obvious acoustic impedance interface in the rock, and this characteristic becomes the theoretical basis for the application of acoustic wave detection technology (Paiaman and Ghanbarian., 2021; Pang and North., 1996). When horizontal or low-angle fractures exist in the formation, the acoustic wave time difference (AC) often increases or periodically jumps. The more fractures are developed, the greater the amplitude of the increase of the acoustic wave time difference. Moreover, fractures with different occurrences have different logging responses. The smaller the fracture dip angle, the greater the increase of the acoustic wave time difference. Since the Chang 6 and Chang 8 reservoirs in the study area mainly develop high-angle and vertical fractures, the increase of acoustic wave time difference caused by fractures is not obvious.
Density logging (DEN) is the bulk density of a formation irradiated with radiation emitted by a gamma source and measured according to the Compton effect. When the density logging electrode comes into contact with the natural fractures invaded by the mud, the porosity increases accordingly, and the density value decreases accordingly (Robinson et al., 1998; Qie et al., 2021).
Conventional logging curves are comprehensive responses to the characteristics of the wellbore and surrounding formation objects such as rocks, pores, fluids, fractures, and drilling fluids around the wellbore. Fractures in rock formations have special response characteristics in log data (Xue et al., 2021; Yang, et al., 2021; Zhao, et al., 2021). According to the statistical results, the porosity series logging has a better response to fractures. The response of resistivity logging to fractures is complex because of the different types of fracture fillers and the degree of filling (Sapin et al., 2012; Yin and Wu., 2020; Yin, et al., 2018). Lithologic logging has relatively poor response to fractures. According to statistics, in the fracture-developed segment of the target layer, the natural gamma value is mostly higher than 72 API, the shallow detection resistivity is generally less than 72 Ω m, the rock bulk density is less than 2.42 g/cm3, the neutron porosity is greater than 26%, and the acoustic wave time difference is greater than 245 μs/m (Figure 8).

FIGURE 8. Sensitivity analysis of fractures to conventional logging parameters of target sandstone. (A) Relationship between RS and GR of fractured and non-fractured sandstones; (B) Relationship between AC and GR of fractured and non-fractured sandstones. GR-natural gamma; RS-shallow lateral resistivity; AC-longitudinal wave time difference.
In this study, the sensitivity of each single conventional logging curve to fractures is analyzed, and then the curve variation range, variation rate and fractal principle are used to predict fractures. Finally, a comprehensive fracture index is constructed by synthesizing relevant sensitive logging parameters. In order to facilitate the comprehensive analysis of the response of various parameters to fractures, the conventional logging series is first normalized. The existence of fractures will cause the increase of acoustic wave time difference and natural gamma, and cause the decrease of resistivity and rock density (Yoshida and Santosh., 2020; Zhang, et al., 2020; Zheng, et al., 2020). Therefore, Eqs 4, 5 are adopted to normalize the logging data respectively. The shallow lateral resistivity and rock density are normalized by formula 5, and the acoustic wave time difference and natural gamma are normalized by formula 6 (Pang and North, 1996).
In the formula, Xmax and Xmin are the maximum and minimum values of sandstone logging values in the target interval of a certain conventional logging curve, respectively; S is the log data reading; X1and X2 are the abnormal change indexes of the curves.
Standardized processing of raw logging data can effectively avoid the influence of different dimensions and magnitudes of data in different logging series. The distribution range of each logging parameter after processing is shown in Figure 9. It can be seen that all logging parameters are in the same dimension and magnitude range, and the comparability between different series of logging data is significantly enhanced.
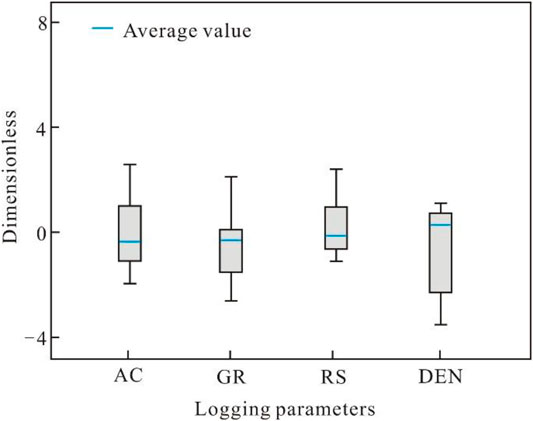
FIGURE 9. Normalization of raw logging data. AC-longitudinal wave time difference; GR-natural gamma; RS-shallow lateral resistivity; DEN-rock density.
From the correlation analysis between R/S and N of different fracture-sensitive logging parameters, it can be seen that fractures can reduce the slope of the R/S curve to a certain extent (Figure 10). However, not all the slope-decreasing segments of the R/S curve are fracture-developed segments (Figure 10). In addition, a single logging curve cannot effectively identify fractures, and only the combination of multiple fracture sensitive logging parameters can improve the accuracy of fracture identification.
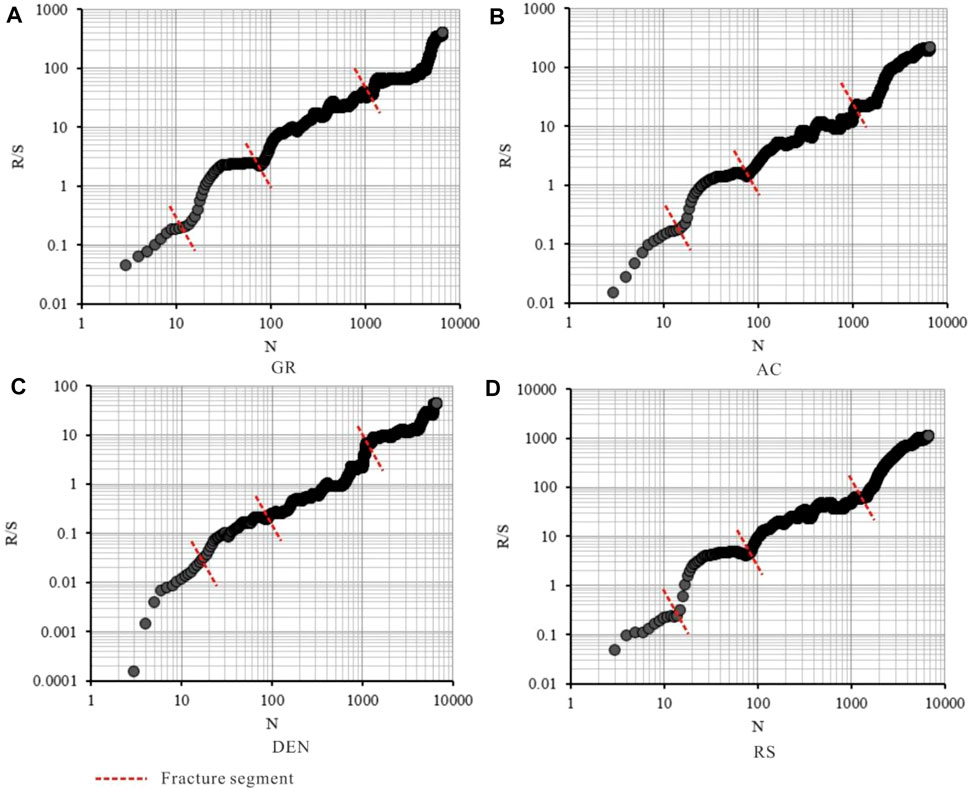
FIGURE 10. Correlation between R/S and N of different fracture-sensitive logging parameters and their coupling relationship with fracture segment. (A) GR logging series; (B) AC logging series; (C) DEN logging series; (D) RS logging series. GR-natural gamma; AC-longitudinal wave time difference; DEN-rock density; RS-shallow lateral resistivity.
In this study, a fractal-based fracture index (FI) was constructed, which was used to identify fractured segments in sandstone formations. Figure 11 shows the processing results of the 2,295–2,310 m segment of Well D2. Imaging logging results show that fractures are mainly developed in the top Chang 6 oil layer group, while fractures in other oil layer groups are not developed (Figure 11). The thickness of sandstone with fractures is mainly distributed in 2–2.5 m. It can be seen that the fractal model in this study can well identify the fracture development segment. In this study, the number of wells interpreted by logging fractures is 8 wells, the number of segments interpreted by fractures is 96, and the number of segments consistent with the actual situation is 80. In the case of poor fracture identification, it mainly occurs in thick sand bodies, especially when the thickness of a single sand body is greater than 20 m. It is mainly due to the low degree of fracture development in thick sand bodies, so it is very difficult to extract effective fracture information. Overall, the coincidence rate of fracture logging identification using the model constructed in this paper is 83.3%. Therefore, this method can effectively identify fractures in tight oil reservoirs.
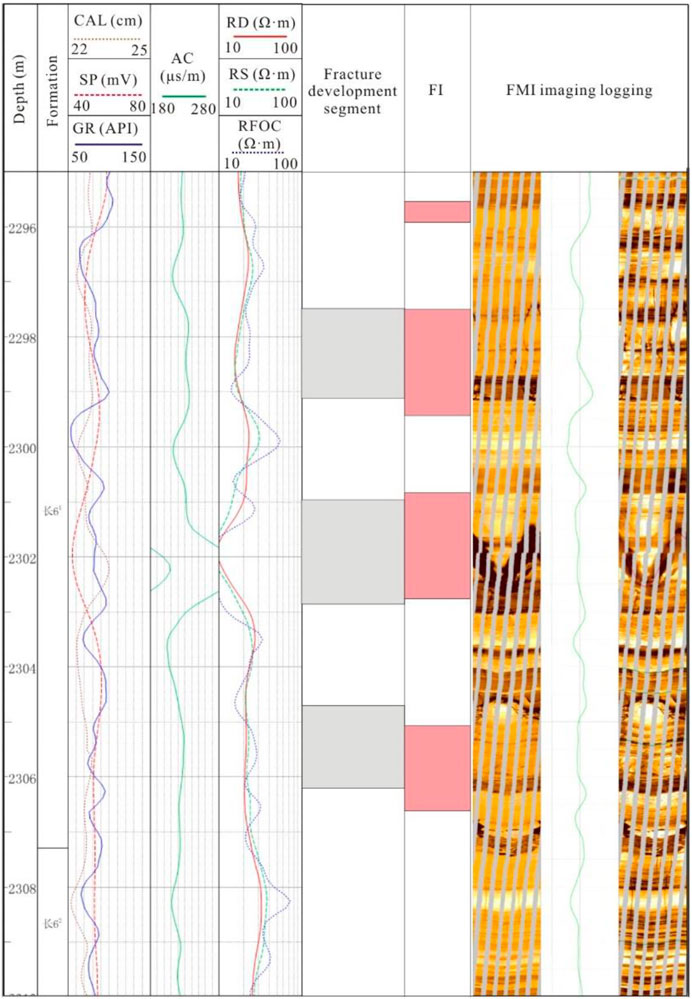
FIGURE 11. Logging identification results of the fracture development segment in the sandstone at 2,295–2,310 m in Well D2. CAL-well diameter; SP-spontaneous potential; GR-natural gamma; AC- longitudinal wave time difference; RD-deep lateral resistivity; RS-shallow lateral resistivity; RFOC-eight lateral resistivity; FI-fracture index.
The calculated fracture FI index was compared with the brittleness index of sandstone, and the results are shown in Figure 12. On the whole, fractures are mainly developed in the high brittle sandstone segments with brittleness index of 60–92% (Figure 12). The values of rock brittleness index and fracture index FI of mudstone are relatively low. The fracture index FI is lower than the threshold value of 1, indicating that the fractures are relatively underdeveloped; and the brittleness index of mudstone is usually lower than 60% (Figure 12).
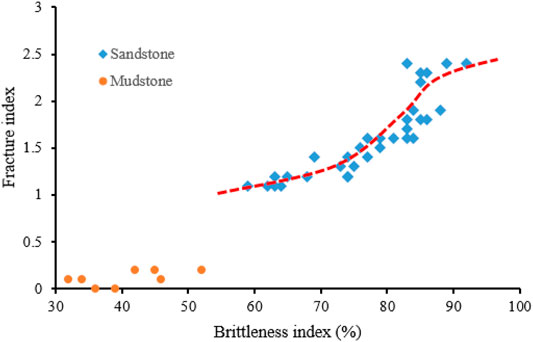
FIGURE 12. Relationship between fracture index FI and rock brittleness index.
Moreover, with the increase of the sandstone brittleness index, the fracture FI index has a “S” shape increasing trend. Before the brittleness index reaches 75%, the increasing trend of the fracture FI index is slow; when the brittleness index is in the range of 75–83%, the increasing trend of the fracture FI index increases slightly; when the brittleness index is greater than 83%, the increasing trend of the FI index gradually slowed down again (Figure 12). Therefore, the content of brittle mineral components in sandstone is an important factor affecting the development degree of natural fractures, and high brittle, thin sand bodies are more likely to develop fractures. In addition, highly brittle framework minerals have strong stress-supporting capacity, which can keep fractures open by resisting high overlying loads (Zhao, et al., 2020; Zhang, et al., 2006).
1) High-angle, vertical and bedding fractures are mainly developed in the Yanchang Formation tight sandstones in the study area. There is a negative correlation between sand body thickness and fracture development degree.
2) The fracture sensitivity parameters were used to construct a coupled fractal fracture index FI. The fractal model incorporates logging information from natural gamma, acoustic wave time difference, rock density, and shallow lateral resistivity. Moreover, the FI is calibrated by imaging data, and the lower fracture limit is set to 1.
3) The constructed fracture fractal index realizes the functions of multi-conventional logging information fusion and gradual elimination, which can effectively identify fracture development segments in sandstone. The fracture identification rate is 83.3%.
4) The study also found that with the increase of sandstone brittleness index, the fracture index has a “S” shape increasing trend. Therefore, the content of brittle mineral components in sandstone is an important factor affecting the development degree of natural fractures, and fractures are more likely to occur in high brittle, thin sand bodies. The highly brittle framework minerals have strong stress-supporting capacity, which can keep fractures open by resisting high overlying loads.
The original contributions presented in the study are included in the article/supplementary material, further inquiries can be directed to the corresponding author.
ZC is responsible for the methodology and writing of this paper, AJ and YY are responsible for the logging interpretation of this paper.
This manuscript was supported by the National Natural Science Foundation of China Regional Science Foundation Project (42162015), Natural Science Foundation of Gansu Provincial Department of Science and Technology, China (Grant No. 20JR5RA48) and Innovation Capability Improvement Project of Gansu Provincial Department of Education, China (Grant No. 2020B-223).
The authors declare that the research was conducted in the absence of any commercial or financial relationships that could be construed as a potential conflict of interest.
All claims expressed in this article are solely those of the authors and do not necessarily represent those of their affiliated organizations, or those of the publisher, the editors and the reviewers. Any product that may be evaluated in this article, or claim that may be made by its manufacturer, is not guaranteed or endorsed by the publisher.
Anders, M. H., Laubach, S. E., and Scholz, C. H. (2014). Microfractures: a Review. J. Struct. Geology. 69 (B), 377–394. doi:10.1016/j.jsg.2014.05.011
Barton, C., Moos, D., and Tezuka, K. (2009). Geomechanical Wellbore Imaging: Implications for Reservoir Fracture Permeability. Bulletin 93 (11), 1551–1569. doi:10.1306/06180909030
Bhatti, A., Ismail, A., Raza, A., Gholami, R., Rezaee, R., Nagarajan, R., et al. (2020). Permeability Prediction Using Hydraulic Flow Units and Electrofacies Analysis. Energ. Geosci. 1 (1–2), 81–91. doi:10.1016/j.engeos.2020.04.003
Bukar, M., Worden, R. H., Bukar, S., and Shell, P. (2021). Diagenesis and its Controls on Reservoir Quality of the Tambar Oil Field, Norwegian North Sea. Energ. Geosci. 2 (1), 10–31. doi:10.1016/j.engeos.2020.07.002
Camac, B. A., and Hunt, S. P. (2009). Predicting the Regional Distribution of Fracture Networks Using the Distinct Element Numerical Method. Bulletin 93 (11), 1571–1583. doi:10.1306/07230909040
Cao, L., Yao, Y., Cui, C., and Sun, Q. (2020). Characteristics of In-Situ Stress and its Controls on Coalbed Methane Development in the southeastern Qinshui Basin, North China. Energ. Geosci. 1 (1–2), 69–80. doi:10.1016/j.engeos.2020.05.003
Casini, U., Hunt, D. W., Monsen, E., and Bounaim, A. (2016). Fracture Characterization and Modeling from Virtual Outcrops. AAPG Bull. 100 (1), 41–61. doi:10.1306/09141514228
Chen, G. B., Li, T., Yang, L., Zhang, G. H., Li, J. W., and Dong, H. J. (2021). Mechanical Properties and Failure Mechanism of Combined Bodies with Different Coal-Rock Ratios and Combinations. J. Mining Strata Control. Eng. 3 (2), 023522. doi:10.13532/j.jmsce.cn10-1638/td.20210108.001
Chen, J. W. (2020). Analysis of Roadheader’s Rotary Table Onvibration Modal Based on Finite Element Method and Tested Data. J. Mining Strata Control. Eng. 2 (2), 026032. doi:10.13532/j.jmsce.cn10-1638/td.20191209.001
Cheng, J. W., Zhao, G., Sa, Z. Y., Zheng, W. C., Wang, Y. G., and Liu, J. (2020). Overlying Strata Movement and Deformation Calculationprediction Models for Underground Coal Mines. J. Mining Strata Control. Eng. 2 (4), 043523. doi:10.13532/j.jmsce.cn10-1638/td.20200716.001
Dcrshowitz, W. S., and Einstein, H. H. (1988). Characterizing Rock Ioint Geometry with Joint System Models. Rock Mech. Rock Eng. 21 (1), 21
Dong, S., Zeng, L., Dowd, P., Xu, C., and Cao, H. (2018). A Fast Method for Fracture Intersection Detection in Discrete Fracture Networks. Comput. Geotechnics 98, 205–216. doi:10.1016/j.compgeo.2018.02.005
Du, Q. X., Han, Z. Z., Shen, X. L., Han, C., Song, Z. G., Gao, L. H., et al. (2019). Geochronology and Geochemistry of Permo-Triassic Sandstones in Eastern Jilin Province (NE China): Implications for Final Closure of the Paleo-Asian Ocean. Geosci. Front. 10, 685–706. doi:10.1016/j.gsf.2018.03.014
Fan, C. H., Zhong, C., Zhang, Y., Qin, Q. R., and He, S. (2019). Geological Factors Controlling the Accumulation and High Yield of Marine-Facies Shale Gas: Case Study of the Wufeng-Longmaxi Formation in the Dingshan Area of Southeast Sichuan, China. Acta Geol. Sin. Engl. 93 (3), 530–560. doi:10.1111/1755-6724.13857
Fan, C., Li, H., Qin, Q., He, S., and Zhong, C. (2020a). Geological Conditions and Exploration Potential of Shale Gas Reservoir in Wufeng and Longmaxi Formation of southeastern Sichuan Basin, China. J. Pet. Sci. Eng. 191, 107138. doi:10.1016/j.petrol.2020.107138
Fan, C., Li, H., Qin, Q., Shang, L., Yuan, Y., and Li, Z. (2020c). Formation Mechanisms and Distribution of Weathered Volcanic Reservoirs: A Case Study of the Carboniferous Volcanic Rocks in Northwest Junggar Basin, China. Energy Sci. Eng. 8 (8), 2841–2858. doi:10.1002/ese3.702
Fan, C., Li, H., Zhao, S., Qin, Q., Fan, Y., Wu, J., et al. (2020b). Formation Stages and Evolution Patterns of Structural Fractures in Marine Shale: Case Study of the Lower Silurian Longmaxi Formation in the Changning Area of the Southern Sichuan Basin, China. Energy Fuels 34 (8), 9524–9539. doi:10.1021/acs.energyfuels.0c01748
Fan, K. (2020). Sudden Deformation Characteristic and Cuttingroofsupport Technology for Double-Used Roadways in Longtan Mine. J. Mining Strata Control. Eng. 2 (3), 033032. doi:10.13532/j.jmsce.cn10-1638/td.20191227.001
Fu, X., and Wang, R. F. (2020). Cooperative Self-Adaptive Control Modelof Fluid Feeding System and Hydraulic Supports in Workingface. J. Mining Strata Control. Eng. 2 (3), 036031. doi:10.13532/j.jmsce.cn10-1638/td.20191203.001
Gao, F. Q. (2019). Use of Numerical Modeling for Analyzing Rockmechanic Problems in Underground Coal Mine Practices. J. Mining Strata Control. Eng. 1 (1), 013004. doi:10.13532/j.jmsce.cn10-1638/td.2019.02.009
Guo, L. L., Zhou, D. W., Zhang, D. M., and Zhou, B. H. (2021). Deformation and Failure of Surrounding Rock of a Roadway Subjected to Mining-Induced Stresses. J. Mining Strata Control. Eng. 3 (2), 023038. doi:10.13532/j.jmsce.cn10-1638/td.20200727.001
Han, L., Shen, J., Qu, J., and Ji, C. (2021). Characteristics of a Multi-Scale Fracture Network and its Contributions to Flow Properties in Anthracite. Energy Fuels 35 (14), 11319–11332. doi:10.1021/acs.energyfuels.1c01465
He, S., Li, H., Qin, Q., and Long, S. (2021). Influence of Mineral Compositions on Shale Pore Development of Longmaxi Formation in the Dingshan Area, Southeastern Sichuan Basin, China. Energy Fuels 35 (13), 10551–10561. doi:10.1021/acs.energyfuels.1c01026
Hong, D., Cao, J., Wu, T., Dang, S., Hu, W., and Yao, S. (2020). Authigenic clay Minerals and Calcite Dissolution Influence Reservoir Quality in Tight Sandstones: Insights from the central Junggar Basin, NW China. Energ. Geosci. 1 (1–2), 8–19. doi:10.1016/j.engeos.2020.03.001
Hu, Q. F., Cui, X. M., Liu, W. K., Ma, T. J., and Geng, H. R. (2020). Law of Overburden and Surface Movement and Deformation Dueto Mining Super Thick Coal Seam. J. Mining Strata Control. Eng. 2 (2), 023021. doi:10.13532/j.jmsce.cn10-1638/td.20191113.001
Huang, F. R., Yan, S. X., Wang, X. L., Jiang, P. C., and Zhan, S. B. (2021). Experimental Study on Infrared Radiation Characteristics Ofgneiss under Uniaxial Compression. J. Mining Strata Control. Eng. 3 (1), 013011. doi:10.13532/j.jmsce.cn10-1638/td.20200730.001
Jiang, L., Qiu, Z., Wang, Q., Guo, Y., Wu, C., Wu, Z., et al. (2016). Joint Development and Tectonic Stress Field Evolution in the southeastern Mesozoic Ordos Basin, West Part of north China. J. Asian Earth Sci. 127, 47–62. doi:10.1016/j.jseaes.2016.06.017
Kang, H. P. (2021). Temporal Scale Analysis on Coal Mining and Strata Control Technologies. J. Mining Strata Control. Eng. 3 (1), 013538. doi:10.13532/j.jmsce.cn10-1638/td.20200814.001
Lai, J., Wang, G., Wang, S., Cao, J., Li, M., Pang, X., et al. (2018). Review of Diagenetic Facies in Tight Sandstones: Diagenesis, Diagenetic Minerals, and Prediction via Well Logs. Earth-Science Rev. 185, 234–258. doi:10.1016/j.earscirev.2018.06.009
Laubach, S. E., Olson, J. E., and Gross, M. R. (2009). Mechanical and Fracture Stratigraphy. Bulletin 93, 1413–1426. doi:10.1306/07270909094
Li, Y. (2021). Mechanics and Fracturing Techniques of Deep Shale from the Sichuan Basin, SW China. Energ. Geosci. 2 (1), 1–9. doi:10.1016/j.engeos.2020.06.002
Li, Y., Zhou, D., Wang, W., Jiang, T., and Xue, Z. (2020). Development of Unconventional Gas and Technologies Adopted in China. Energ. Geosci. 1 (1–2), 55–68. doi:10.1016/j.engeos.2020.04.004
Liu, B., He, S., Meng, L., Fu, X., Gong, L., and Wang, H. (2021). Sealing Mechanisms in Volcanic Faulted Reservoirs in Xujiaweizi Extension, Northern Songliao Basin, Northeastern China. Bulletin 105, 1721–1743. doi:10.1306/03122119048
Mardia, K. V., Nyirongo, V. B., Walder, A. N., Xu, C., Dowd, P. A., Fowell, R. J., et al. (2007). Markov Chain Monte Carlo Implementation of Rock Fracture Modelling. Math. Geol. 39 (4), 355–381. doi:10.1007/s11004-007-9099-3
Mirzaei-Paiaman, A., and Ghanbarian, B. (2021). A New Methodology for Grouping and Averaging Capillary Pressure Curves for Reservoir Models. Energ. Geosci. 2 (1), 52–62. doi:10.1016/j.engeos.2020.09.001
Mizoguchi, K., and Ueta, K. (2013). Microfractures within the Fault Damage Zone Recordthe History of Fault Activity. Geophys. Res. Lett. 40 (8), 2023–2027. doi:10.1002/grl.50469
Nakaya, S., and Nakamura, K. (2007). Percolation Conditions in Fractured Hard Rocks: A Numerical Approach Using Thethree Dimensional Binary Fractal Fracture Network (3D-BFFN) Model. J. Geophys. Res. 112 (B12), 1–15. doi:10.1029/2006jb004670
Nelson, R. A. (1985). Geological Analysis of Naturally Fractured Reservoirs. Texas: Gulf Publishing Company, 8–26.
Olson, J. E., laubach, S. E., and lander, R. H. (2009). Natural Fracture Characterization in Tight Gas Sandstones: Integrating Mechanics and Diagenesis. Bulletin 93 (11), 1535–1549. doi:10.1306/08110909100
Ortega, O. J., Marrett, R. A., and Laubach, S. E. (2006). A Scale-independent Approach to Fracture Intensity and Average Spacing Measurement. Bulletin 90 (2), 193–208. doi:10.1306/08250505059
Pang, J., and North, C. P. (1996). Fractals and Their Applicability in Geological Wireline Log Analysis. J. Pet. Geol 19 (3), 339–350. doi:10.1111/j.1747-5457.1996.tb00438.x
Peacock, D. C. P., Sanderson, D. J., and Rotevatn, A. (2018). Relationships between Fractures. J. Struct. Geology. 106, 41–53. doi:10.1016/j.jsg.2017.11.010
Qie, L., Shi, Y. N., and Liu, J. S. (2021). Experimental Study on Grouting Diffusion of Gangue Solid Filling Bulk Materials. J. Mining Strata Control. Eng. 3 (2), 023011. doi:10.13532/j.jmsce.cn10-1638/td.20201111.001
Robinson, N. I., Sharp, J. M., and Krciscl, I. (1998). Contaminant Transport in Sets of Parallel Finite Fractures with Fray Turc Skins. J. Contaminant Hydrol. 31 (1-2), 83–109. doi:10.1016/s0169-7722(97)00055-7
Santosh, M., and Feng, Z. Q. (2020). New Horizons in Energy Geoscience. Energ. Geosci. 1 (1–2), 1. doi:10.1016/j.engeos.2020.05.005
Sapin, F., Ringenbach, J.-C., Rives, T., and Pubellier, M. (2012). Counter-regional normal Faults in Shale-Dominated Deltas: Origin, Mechanism and Evolution. Mar. Pet. Geology. 37, 121–128. doi:10.1016/j.marpetgeo.2012.05.001
Wang, J., and Wang, X. L. (2021). Seepage Characteristic and Fracture Development of Protected Seam Caused by Mining Protecting Strata. J. Mining Strata Control. Eng. 3 (3), 033511. doi:10.13532/j.jmsce.cn10-1638/td.20201215.001
Xu, C., and Dowd, P. (2010). A New Computer Code for Discrete Fracture Network Modelling. Comput. Geosciences 36 (3), 292–301. doi:10.1016/j.cageo.2009.05.012
Xu, C., Dowd, P. A., Mardia, K. V., and Fowell, R. J. (2006). A Flexible True Plurigaussian Code for Spatial Facies Simulations. Comput. Geosciences 32 (10), 1629–1645. doi:10.1016/j.cageo.2006.03.002
Xue, F., Liu, X. X., and Wang, T. Z. (2021). Research on Anchoring Effect of Jointed Rock Mass Based on 3D Printing and Digital Speckle Technology. J. Mining Strata Control. Eng. 3 (2), 023013. doi:10.13532/j.jmsce.cn10-1638/td.20201020.001
Yang, J. X., Luo, M. K., Zhang, X. W., Huang, N., and Hou, S. J. (2021). Mechanical Properties and Fatigue Damage Evolution of Granite under Cyclic Loading and Unloading Conditions. J. Mining Strata Control. Eng. 3 (3), 033016. doi:10.13532/j.jmsce.cn10-1638/td.20210510.001
Yin, S., Lv, D., and Ding, W. (2018). New Method for Assessing Microfracture Stress Sensitivity in Tight sandstone Reservoirs Based on Acoustic Experiments. Int. J. Geomechanics 18 (4), 1–10. doi:10.1061/(asce)gm.1943-5622.0001100
Yin, S., and Wu, Z. (2020). Geomechanical Simulation of Low-Order Fracture of Tight sandstone. Mar. Pet. Geology. 100, 1–10. doi:10.1016/j.marpetgeo.2020.104359
Yoshida, M., and Santosh, M. (2020). Energetics of the Solid Earth: An Integrated Perspective. Energ. Geosci. 1 (1–2), 28–35. doi:10.1016/j.engeos.2020.04.001
Zhang, B., Shen, B., and Zhang, J. (2020). Experimental Study of Edge-Opened Cracks Propagation in Rock-like Materials. J. Mining Strata Control. Eng. 2 (3), 033035. doi:10.13532/j.jmsce.cn10-1638/td.20200313.001
Zhang, T., Switzer, P., and Journel, A. (2006). Filter-based Classification of Training Image Patterns for Spatial Simulation. Math. Geol. 38 (1), 63–80. doi:10.1007/s11004-005-9004-x
Zhao, K. K., Jiang, P. F., Feng, Y. J., Sun, X. D., Cheng, L. X., and Zheng, J. W. (2021). Investigation of the Characteristics of Hydraulic Fracture Initiation by Using Maximum Tangential Stress Criterion. J. Mining Strata Control. Eng. 3 (2), 023520. doi:10.13532/j.jmsce.cn10-1638/td.20201217.001
Zhao, Z., Wu, K., Fan, Y., Guo, J., Zeng, B., and Yue, W. (2020). An Optimization Model for Conductivity of Hydraulic Fracture Networks in the Longmaxi Shale, Sichuan basin, Southwest China. Energ. Geosci. 1 (1–2), 47–54. doi:10.1016/j.engeos.2020.05.001
Keywords: ordos basin, yanchang formation, tight oil reservoirs, fractures, logging evaluation
Citation: Chen Z, Ji A and Yuan Y (2022) Fine Logging Evaluation of Fractures in Continental Tight Oil Sandstone Reservoirs of Yanchang Formation in the Ordos Basin. Front. Earth Sci. 10:860473. doi: 10.3389/feart.2022.860473
Received: 23 January 2022; Accepted: 31 January 2022;
Published: 15 February 2022.
Edited by:
Shuai Yin, Xi’an Shiyou University, ChinaCopyright © 2022 Chen, Ji and Yuan. This is an open-access article distributed under the terms of the Creative Commons Attribution License (CC BY). The use, distribution or reproduction in other forums is permitted, provided the original author(s) and the copyright owner(s) are credited and that the original publication in this journal is cited, in accordance with accepted academic practice. No use, distribution or reproduction is permitted which does not comply with these terms.
*Correspondence: Zhanjun Chen, Y2hlbnpqMTQ2QDE2My5jb20=
Disclaimer: All claims expressed in this article are solely those of the authors and do not necessarily represent those of their affiliated organizations, or those of the publisher, the editors and the reviewers. Any product that may be evaluated in this article or claim that may be made by its manufacturer is not guaranteed or endorsed by the publisher.
Research integrity at Frontiers
Learn more about the work of our research integrity team to safeguard the quality of each article we publish.