 Chunshan Zhou
 Xiong He
 Runnan Wu1
- 1School of Geography and Planning, Sun Yat-sen University, Guangzhou, China
- 2School of Finance, Guangdong University of Finance and Economics, Guangzhou, China
It is an important task for planners and decision makers to determine whether a certain region is urban or rural since the accurate identification of these areas is of considerable significance to further study differences in urbanization development and balance contradictions between them. However, at present, there are problems of low efficiency and considerable subjectivity in the identification of urban and rural areas based on nighttime light data. Therefore, this study proposes a new method to identify urban and rural areas based on the differences between them. Taking Guangzhou as an example, this study simulated food delivery scenarios to identify urban and rural areas in Guangzhou. The findings indicated that using food delivery data to identify urban and rural areas is highly precise, with an accuracy rate of 92.4% and Kappa value of 0.79. This study provides a new method to identify urban and rural areas accurately and objectively, contributes to the study of urban-rural differences in urbanization and providing a feasible method for subsequent urban and rural planning.
Introduction
In the process of rapid urbanization, urban and rural areas have gradually been distinguished in terms of systems and lifestyles owing to varying policies and resource inclinations (Yu et al., 2015). Through the expansion of urbanized areas, rural areas have been decreasing (Nicolau and Cavaco, 2018). Although urban expansion is an inevitable consequence of urbanization and urban development, as well as an important manifestation of urban city’s vitality, urban city is not only composed of urban development space, but also more agricultural space and ecological space (Abudu et al., 2021). Only when the urban development space, agricultural space and ecological space maintain a relative balance can promote the sustainable development of urban city. On the contrary, the blind and continuous expansion of cities is bound to occupy agricultural space and ecological space, which is often irreversible and destructive occupation (Chen et al., 2020). Therefore, in order to make the reasonable and orderly expansion of urban city and protect the agricultural space and ecological space, it is necessary to accurately identify the urban space and accurately delineate the boundary between urban and rural space, so as to promote the sustainable and harmonious development of the three spaces (Chen et al., 2020).
This, in turn has hindered the accurate assessment of differences between urban and rural areas due to traditional administrative boundaries (Tayyebi et al., 2011). Exponential urban growth has led to encroachments on rural areas surrounding cities, consequently, affecting rural spatial functions and social structures significantly (Tian et al., 2014; Yang et al., 2018). The continuous spread of urban space damages rural functions (Liang et al., 2017; Tan et al., 2017). The development and promotion of China’s rural revitalization strategy and territorial development plan has increased the importance of rural areas (Aubrecht et al., 2016). Therefore, identifying urban and rural areas is imperative because it has tremendous practical significance in identifying the distinct boundaries to limit the unorganized expansion of urban areas and promote the harmonious sustainable development of both areas (Cao et al., 2021; Chen et al., 2020).
The identification of urban and rural areas has experienced from the earliest qualitative division to quantitative division by using population size and density, employment index, the scope of urban built-up areas, and urban-rural boundaries, which focus on the physical form of urban and rural areas and have not considered the regional functions of urban and rural differentiation characteristics (Chakraborti et al., 2018; He et al., 2020; Zhong et al., 2018). This research gap is evidently observed in metropolitan areas experiencing a high degree of urbanization where rural areas are gradually showing the spatial characteristics of urban areas (Ge et al., 2020). Thus, identifying urban and rural areas only through a physical perspective can cause distortion, which necessitates further analysis to determine differences between urban and rural areas to ensure their accurate identification (Peng et al., 2018).
As a kind of remote sensing satellite, sensors carried by nighttime light satellites can detect weak infrared radiation, including urban lights, small residential areas, or traffic flow owing to the intensity of light in urban areas being different from that of rural areas. Therefore, nighttime light data has been widely used to detect urban spatial patterns, urbanization processes, human activities, and their impact on the ecological environment (Bagan et al., 2019; Fragkias et al., 2017; Imhoff et al., 1997). The nighttime light data can directly reflect the light difference between urban and rural areas, which can be used as a distinguishing feature. Additionally, the nighttime light data overcomes the problem of poor data continuity, breaking away from the traditional administrative boundary and statistical unit. However, nighttime light data still has some practical problems such as low resolution and an obvious light spillover effect (Gomes Wille and Da Costa Bento, 2021).
The process of food delivery, which is a city-scale non-dine-in catering industry (Shi et al., 2021), includes network screening, platform ordering, food delivery, and order completion, all of which directly reflect the development gap in the urban catering industry, lack of service resource allocation, and imbalance of the flow of urban and rural elements (Enoch et al., 2021; Long et al., 2021; Zikirya et al., 2021). Thus, the scope of food delivery service can be used to identify urban and rural areas (Zikirya et al., 2021). Such an identification process not only avoids geographical and spatial constraints but also eliminates the dependence on other delineation criteria, such as population density or impermeable ground characteristics.
Since China’s reform and market liberalization, Guangzhou has developed rapidly, and the urban-rural spatial pattern has been constantly reconstructed. Thus, it is of considerable significance to accurately identify urban and rural areas in Guangzhou to define spatial patterns and further study urban-rural differences and harmonization. Therefore, taking Guangzhou as an example, this study firstly identifies urban and rural areas based on nighttime light data and a multi-resolution segmentation method; then, food delivery data and two-stage fast heuristic algorithm are used to identify urban and rural areas. Finally, the identification accuracy of the two methods in identifying urban and rural areas are compared. To the best of our knowledge, this study is the first to use food delivery data to identify urban and rural areas, which provides a new research approach for the identification of these areas.
Materials and Methods
Study Area
Located at 112° 57′–114° 3′E and 22° 26′–23° 56′N, with a total area of 7,434.4 km2 Guangzhou is not only the capital city of Guangdong Province, ranking among the top four megacity cities, Guangzhou is also one of the core cities of the Guangdong-Hong Kong-Macao Greater Bay Area urban agglomeration (Figure 1). In 2020, the urbanization rate of Guangzhou reached 85%. Rapid urbanization in Guangdong has intensified urban space expansion, which in turn has led to encroachments on rural areas, thus making the division between urban and rural areas increasingly prominent (He et al., 2021a). The study area of Guangzhou is shown in Figure 1.
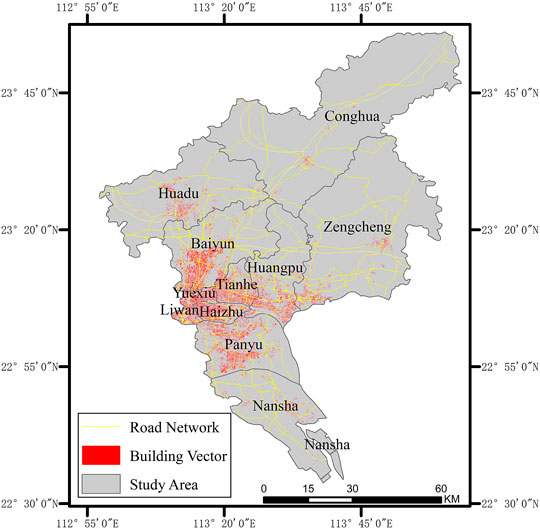
FIGURE 1. Study Area (The study area is Guangzhou China, including 11 districts such as Haizhu district, Tianhe district and Yuexiu district. The data involved in the figure includes road network data and building vector data of Guangzhou).
Sources of Data
NTL, food delivery distribution data, and high-resolution images acquired through Google Maps and building vector and road network data of Guangzhou were used in this study. Among which, food delivery distribution data refers to the information of all businesses that can provide food delivery services within urban city, with which, the deliverable range of food can be determined by combining with the simulation of delivery distribution path. On the other hand, food delivery requires relatively dense distribution of food delivery merchants and accessible road network within a certain period of time. Therefore, most of the residents who use delivery services are residents in urban cities, while in the vast rural areas, delivery services are rare due to the distribution of delivery merchants and sparse road network. Therefore, it is possible to determine whether the area is urban or rural based on the range of food delivery.
Luojia-01 NTL data, with a spatial resolution of 130 m and a width of 260 km, are widely used to identify urban spatial distribution. In this study, the NTL data for 2018–2021 were obtained from the Luojia-01 NTL data website. The raw data were subjected to further radiation correction, luminance conversion, and average processing for final use in this study.
Food delivery data were obtained from the network platform of all business information, including the name, geographic coordinates, categories, and other basic attributes, of the food delivery systems. There is a significant gap between infrastructure and service industry in cities with different development conditions. It has been shown in studies that the better the infrastructure and services, the more competitive the city will be (Ghahremani et al., 2021; Rovai et al., 2020). The gap between urban infrastructure and service industry in different cities could be determined by the number of food delivery services. Using mainstream food delivery platforms, such as Meituan and Eleme, the location information of 90,491 businesses was obtained. Moreover, as some merchants provided services on multiple platforms, 69,331 food delivery data in Guangzhou were finally obtained after re-screening and cleaning the acquired data.
High-resolution Google Earth image data included full-color high-resolution satellite images, which were downloaded without any costs. Satellite images of Guangzhou having a spatial resolution of 4.78 m were used in this study (Mullissa et al., 2021). Furthermore, building vector data were expressed in GIS and were obtained from the electronic maps of physical buildings. Compared with POI data, building vector data not only includes the building geographic coordinates, but also the building height. The building vector data of Guangzhou in October 2021 were obtained through the Application Programming Interface of Amap. Further, road network data comprised complete road information of Guangzhou, including information on both main roads and secondary roads, which were obtained through Open Street Map (Galle et al., 2021).
The sources and spatiotemporal resolutions of the data are listed in Table 1.
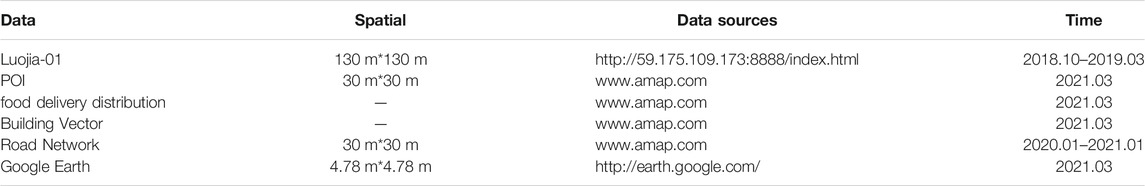
TABLE 1. Characteristics of the data used in this study (There are seven kinds of data used in this study, among which the sources, acquisition methods and access time of different data are shown in the table).
Multi-Resolution Segmentation
Multi-resolution segmentation, an object-oriented algorithm, is also one of the most widely used methods in image classification and feature extraction (Luo et al., 2021). As a top-down algorithm, it can extract image feature information more accurately while ensuring homogeneity and heterogeneity of data images. Multi-resolution segmentation can be calculated as follows:
Where,
The principle of multi-resolution segmentation is as follows: first, the scales of the data images are continuously tested to determine the most suitable three proportion parameters (shape, scale, and compactness) through Estimation of Scale Parameters; the number of images after segmentation and the mean value of objects can then be obtained; finally, the weighted mean variance is calculated to verify whether feature extraction and image segmentation can produce optimum results.
Two-Stage Fast Heuristic Algorithm for Food Delivery Service
Food delivery applies the operational optimization algorithm, in which path planning is the most basic and important link during food delivery because it directly determines the furthest distance where food can be delivered. Previous studies on delivery and route planning have mainly focused on pickup and delivery problems with time-windows, which consider the optimization of the objective function to complete the delivery task. Several algorithms, including column generation, branch-and-cut, branch-and-cut-and-price, serpent-based heuristic, and variable-depth search, are used to solve these problems (Alkasem and Menai, 2021; Behnke et al., 2021; Carrabs et al., 2021). However, these algorithms cannot resolve the issues of delivery scenarios. Therefore, the two-stage fast heuristic algorithm, which can simulate delivery scenarios more realistically than other algorithms, was introduced in this study. The food delivery scenario is shown in Figure 2.
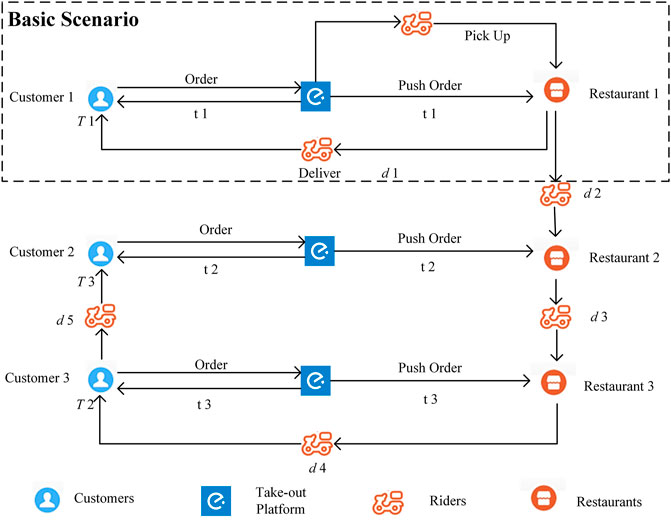
FIGURE 2. The food delivery scenario (There are four links in the food delivery process, namely customers, takeout platform, deliverers and stores. Different delivery scenarios and links during the delivery process are shown in the figure).
In this study, the food delivery scenario was simplified and modeled as a single vehicle pickup and delivery problem with time-windows, that is, the maximum delivery path that a single delivery person can reach when the delivery conditions are satisfied, and the delivery time is not exceeded. In the delivery scenario,
The objective function is calculated as follows:
There are two stages for the fast heuristic algorithm. The first stage includes acceleration based on the geographical area, while the second stage includes a domain search of the destination (Cosma et al., 2020). In general, order delivery is completed only when the maximum time-out order does not exceed the minimum time-out order delivery time. The maximum time-out order is the farthest order delivered by the merchant when the delivery time exceeds
The geographic information of merchants and customers indicated that the distance between the merchants might be close. For example, merchants at 5 km in the central urban area accounted for more than 50% of the total merchants. Additionally, the distance between the customers may also be close, with multiple customers located in the same or adjacent community. These factors indicated that if the delivery locations are in different clusters through the hierarchical clustering method, the delivery distance could be appropriately extended only if the delivery time is not exceeded. The clustering process is as follows: If
Accuracy Assessment
In order to assess the accuracy of traditional NTL data and food delivery data in identifying urban and rural spatial space, this study adopted the verification method of random pixel confusion matrix to verify the identification accuracy of different data. Referring to existing studies, it can be found that the random pixel verification of single city is generally 1,000, and that of urban agglomeration is 3,000 (He et al., 2021b; Zhang et al., 2021). Therefore, in order to assess the identification of urban and rural spatial space more accurately in this study, ArcGIS was used to create 1,000–5,000 random pixel verification points within the spatial space of Guangzhou, in which the ratio of training data to verification data was 1:1. The confusion matrix formula is as follows:
Where:
The study framework is shown in Figure 3.
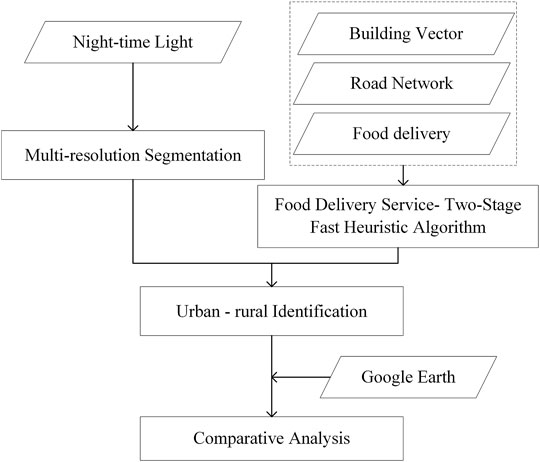
FIGURE 3. Study framework (The study framework flow chart of this study includes study data, content and study sequence).
Results
Identifying Urban and Rural Areas by NTL Data
As shown in Figure 4A, the nighttime light intensity of Guangzhou presents an overall downward trend from urban to rural areas. There is a large range of high-value areas in downtown Guangzhou, mainly covering the Haizhu district, Liwan district, Tianhe district, and Huangpu district. While the light intensity in the Conghua district and Zengcheng district gradually weakened at night. In general, the spatial pattern of light intensity at night is obvious.
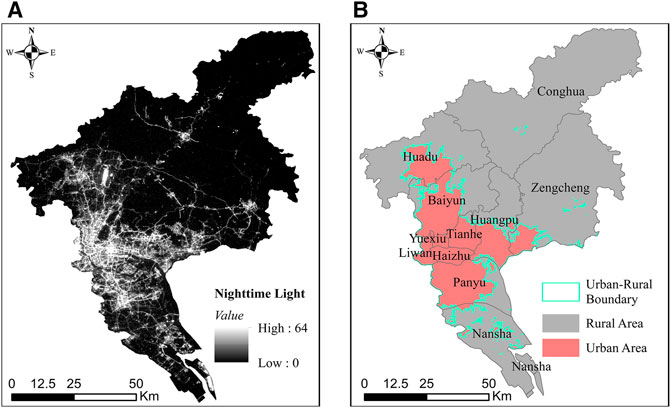
FIGURE 4. (A) Spatial Distribution of NTL Data; (B) Urban and Rural Areas Identified by NTL Data (The urban and rural spatial area identified by NTL data is shown in the figure, among which, (A) is NTL data and (B) is the identified urban and rural spatial area).
The weighted mean variances of scale, shape, and compactness of multi-scale segmentation as determined by the Estimation of Scale Parameters were 17, 0.5, and 0.4, respectively. The urban (1,585.53 km2) and rural areas (5,848.87 km2) of Guangzhou identified according to the determined proportion parameters is shown in Figure 4B. The urban areas were concentrated in Baiyun, Huangpu, Haizhu, Tianhe, and Liwan districts, while the rural areas were mainly concentrated in Conghua, Zengcheng, and Nansha districts and most areas of the Panyu district. Therefore, we can conclude that the urban areas are relatively more concentrated; additionally, the boundaries between the urban and rural areas were distinctly identified.
Identifying Urban and Rural Areas Using Food Delivery Data
A significant difference between urban and rural industrial development and the construction of basic public service amenities is the reason for the issues in the urban-rural differences. As a service behavior based on the catering industry, food delivery mainly relies on the highly developed road network in urban areas (Aryal et al., 2021). Theoretically, closer the food delivery to the urban center, more are the food types that can be delivered and shorter is the delivery time, and vice versa. When comparing the proportion of delivery service that can be received at any one point in the city to the delivery area, vitality decreases from the urban centers to the suburbs in the rural areas, thus, suggesting that food delivery data can be used to distinguish urban and rural areas (Lim and Kang, 2021). In this view, this study used the two-stage rapid heuristic algorithm to simulate the food delivery scenario to find the furthest delivery distance that can be reached while ensuring that the maximum replenishable overtime order does not exceed. This was achieved under the premise that the single delivery person meets the distribution condition of delivering more than one quantity (according to the actual situation, when the delivery quantity is only one, food will not be delivered).
The range of food that can be delivered by all businesses is shown in Figure 5A. When the food delivered by all businesses met the furthest path as obtained by the objective function, the urban area was identified using the food delivery data obtained by connecting the ends of the furthest path. The corresponding identification results are shown in Figure 5B. The area included under urban and rural areas as identified using the food delivery data was 1,420.21 km2 and 6,014.19 km2, respectively. The urban areas were concentrated in Baiyun, Huangpu, Haizhu, Tianhe, Liwan, and Panyu districts and in parts of the Nansha district; additionally, some cities were identified in Conghua and Zengcheng districts. The rural areas were mainly concentrated in Huadu, Zengcheng, and most of Conghua districts. These results were similar to those identified by NTL data, but the urban scope is relatively smaller, and more evident city clusters were identified in Zengcheng and Conghua districts.
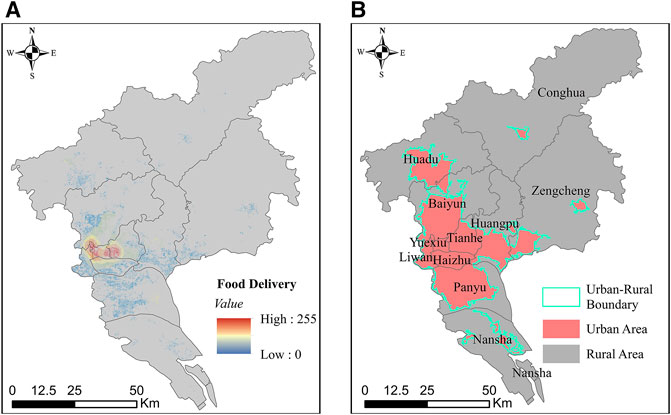
FIGURE 5. (A) The urban and rural spatial range to which food can be delivered; (B) Urban and rural areas identified by food delivery data (The urban and rural spatial area identified by food delivery data is shown in the figure, among which, (A) is the range of deliverable food and (B) is the identified urban and rural spatial area).
Comparison and Assessment of Identification Results
The urban and rural areas identified by NTL data was compared with that identified using the food delivery data and the corresponding results are shown in Figure 6. Urban areas as identified by NTL data and food delivery data comprised 1,585.53 km2 and 1,420.21 km2, respectively. Therefore, based on only the identified geographic area of urban and rural areas, no significant difference was observed in the identification results by the two methods.
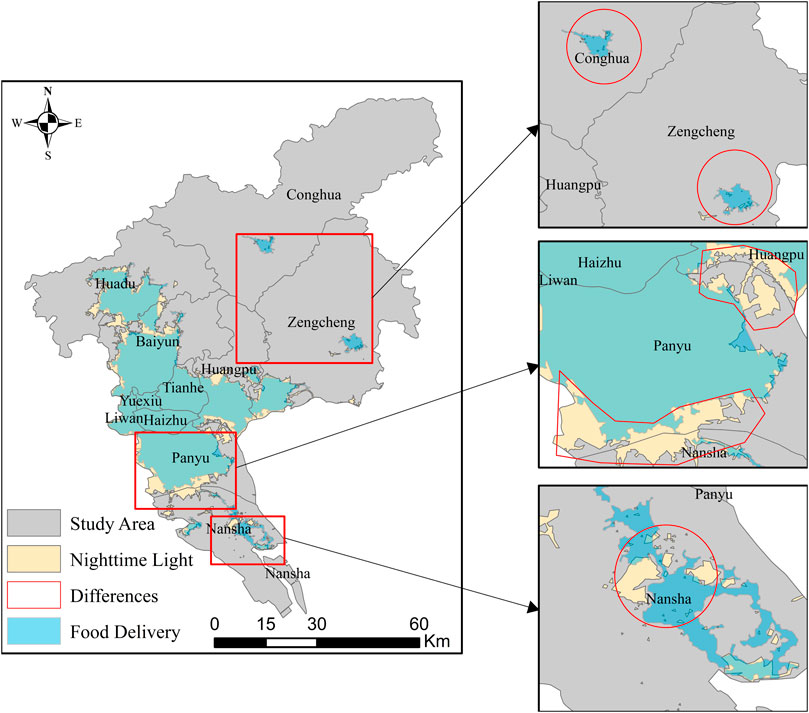
FIGURE 6. Comparison of identification results (The differences in urban and rural spatial areas identified by NTL data and food delivery data are shown in the figure, including significant differences in central urban area, urban and rural fringe and rural-urban fringe zone).
Further, the comparison of identification results using different methods indicated that the NTL data results showed the following characteristics: First, the urban area identified by the data fusion method was larger, which was mainly reflected in Huadu, Baiyun, Huangpu districts and the peripheral boundaries of the Panyu district. Second, the urban areas identified in central urban regions (Tianhe, Haizhu, and Yuexiu districts) covered the entire administrative region because the NTL data considered both urban development and infrastructure construction. Finally, the urban-rural fringes were more distinctly identified because the urban areas in this region were developed by the expansion and construction of peripheral urban cities from the central city, especially in urban-rural fringes.
Conversely, the urban areas identified by the food delivery data showed the following characteristics: First, the peripheral boundaries were smaller than those identified by NTL data, with boundaries mainly concentrated in Huadu, Huangpu, and Panyu districts. Although the urban expansion of these three districts was relatively more evident and the prototype of urban space was established in the rural-urban fringe, the lifestyle of the residents in these districts was more inclined to rural areas; therefore, these areas were identified as rural areas through the food delivery data. Second, the central urban areas in Liwan and Tianhe districts did not cover the entire administrative region because the western region of the Liwan district was close to the administrative edge of Guangzhou, and food was generally not delivered to the administrative edges, which was also consistent with the logic of food delivery. Finally, cities were also identified by the food delivery data in Conghua and Zengcheng districts; however, these city groups were not included in the urban areas that were identified by NTL data. This is because compared with other districts, urban development and infrastructure constructions of these two districts were less advanced; therefore, NTL data identified these areas as rural areas. Further, although urban development in the central areas of Conghua and Zengcheng districts is not advanced, most residents showed a lifestyle similar to that of the urban areas. Therefore, these regions were identified as urban areas by the food delivery data.
In order to verify the results of urban and rural spatial area identified by the two methods and further compare and analyze the differences between NTL data identification results and the food delivery identification results in this study, 1,000–5,000-pixel assessment points were randomly selected. Subsequently, the number of random assessment points located in the urban areas and rural areas along with the confusion matrix determined by the random pixel assessment points were determined after confirming the data using high-resolution Google Earth image data (Table 2). Identification accuracy was calculated using the percentage of the pixel assessment points, while the Kappa coefficient represented the consistency of test results, with a value closer to 1, indicating better assessment results.
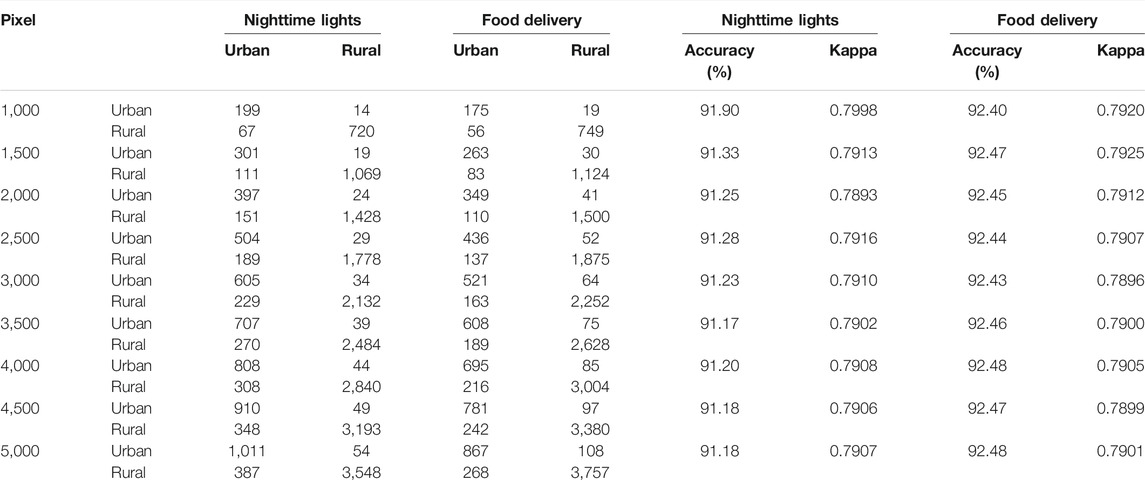
TABLE 2. Accuracy assessment of the confusion matrix (Random verification points are used to verify the results of urban and rural spatial area of NTL data and food delivery data identification. Among them, the accuracy of the selected 1,000–5,000 random verification points show an obvious upward and downward trend, and the specific results are shown in the table).
The identification accuracy of the urban and rural areas identified by NTL Data method was above 91% (Table 2), while the Kappa coefficient was above 0.79, which is close to the identification results of existing studies. The accuracy of urban and rural areas identified by the food delivery data was above 92.4%, and the Kappa coefficient was above 0.79. In general, the accuracy of the urban and rural areas identified by NTL Data was close to that determined in previous studies. Additionally, urban and rural areas identified by food delivery have achieved higher accuracy and have slight advantages compared with those identified by NTL data.
The comparison of the identification accuracies of the urban and rural areas by 1,000–5,000 random pixel assessment points indicated that the percentage of the different assessment points in the two areas was not consistent, which was also reflected by the urban and rural areas identified by NTL data. The increase in the random pixel assessment points increased and decreased the percentage of successful assessment points in urban and rural areas, respectively. Conversely, the increase in the random pixel assessment points decreased and increased the percentage of successful assessment points in the urban and rural areas that were identified by the food delivery data. Figure 7 shows that NTL data is advantageous for identifying urban areas, while the food delivery data is useful for identifying rural areas.
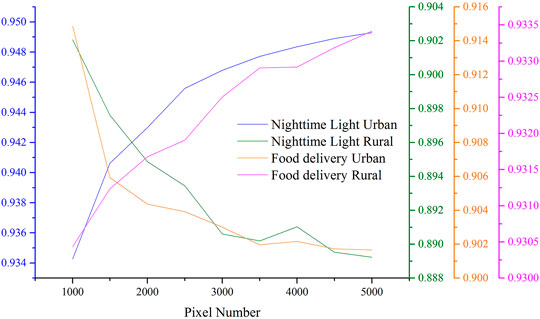
FIGURE 7. Percentage of different random assessment points in the urban and rural areas (The accuracy of results verified by 1,000–5,000 random verification points is shown in the figure, in which the accuracy of NTL data identification in urban areas and food delivery identification in rural areas shows an increasing trend, while the accuracy of NTL data identification in rural areas and food delivery data identification in urban areas shows a decreasing trend).
Discussion
This study determined the geographical characteristics of the economic problems of the urban-rural regional differences by highlighting the urban-rural gap in development and infrastructure construction involved in the food delivery process. Additionally, the two-stage fast heuristic algorithm was used to simulate the food delivery process to identify the urban and rural areas. Finally, the results of identifying urban and rural areas by NTL data proposed a new and reliable approach for urban and rural area identification.
Rapid development in urban expansion is gradually diminishing the boundaries between urban and rural areas. Particularly, the expansion of urban areas and the modernization of rural areas have increased the appearance of urban characteristics in rural areas ((Chakraborty et al., 2021; Wang et al., 2020). Therefore, identifying the urban and rural areas through practical methods and approaches is important for harmonious urban-rural development (Yang et al., 2021). However, most current studies have mainly reflected urban and rural spatial differences using NTL data, with an identification accuracy of approximately 85% (Peng et al., 2020). Moreover, this accuracy cannot be further improved due to data oversaturation. The identification accuracy of the urban and rural areas was 91% by multi-resolution segmentation based on NTL data, and was close to the research results of other scholars who proposed this method. Compared with the research accuracy obtained using global artificial impervious areas, the identification accuracy determined in this study strongly verifies the significance of using NTL data in urban and rural area applications (Yu et al., 2015). In addition, started with the urban and rural areas catering industry development gap, lack of service resource allocation, element flow imbalance and other differences the two-stage fast heuristic algorithm was also used to simulate food delivery scenario, and the places that can be delivered were identified as urban areas, and places that cannot be delivered were identified as rural areas. In this way, the accuracy of urban and rural spatial identification can reach more than 92.4%, which was slightly improved compared with the identification result of NTL data. All these indicate that urban and rural spatial identification through food delivery data has a high credibility.
Previous studies on urban and rural spatial identification mainly established administrative district indicators or used socio-economic and geospatial data to identify urban and rural areas (Lichter and Brown, 2011). Starting with qualitative analysis to quantitative analysis, this developmental process has played an important role in promoting the studies of urban and rural areas (Imhoff et al., 1997; Shen et al., 1997). However, although the existing studies accurately identify urban and rural areas, identification is focused on the well-developed urban areas, thus, indicating that this identification method is more beneficial for urban areas with continuous validation development. The study findings were further validated by NTL data results of random pixels (Fragkias et al., 2017). In contrast to NTL data and other research methods that focus on urban area, the food delivery data objectively analyzes the accessibility of urban and rural spatial food delivery, which marginally improves the identification accuracy. In addition, compared with existing studies, this study, for the first time, focused on the expression of rural areas, which have rarely been considered in previous studies (Lawton, 2020). As a unique expression form of the urban-rural regional differences based on urban development and infrastructure construction, the food delivery service greatly considers the urban-rural element flow, especially population and consumption patterns. This difference in preference to living space can play a huge role in identifying urban and rural areas and accurately depict rural space.
The identification of urban and rural areas from a new research perspective based on food delivery data has practical significance. However, this study still has some limitations. First, the simulation of the food delivery scenarios was based on a simplified delivery path of a single deliverer under specific conditions, not considering the possibility of multiple deliverers and orders with more complex delivery situations. Second, food delivery services may not be used by the elderly and children in urban areas, which can result in negative feedback for urban area identification (Zhao and Hu, 2019). In this study, the urban and rural spatial space of Guangzhou were identified by NTL data and food delivery data respectively, and the advantages of the two data in identifying urban areas and rural areas were obtained. This advantage makes NTL data have a good application in urban expansion and urbanization discrimination, while the advantage of food delivery makes it more valuable in the study of rural space, such as rural revitalization and urban-rural integration.
This study delineates the urban and rural areas of Guangzhou through food delivery, which is a bold attempt in urban geography and other disciplines, and a unique innovation in the application of big data in urban and rural planning. It not only accurately identifies urban and rural areas, but also supplements the relevant theories of urban and rural differences. Based on the study on the identification of urban and rural areas of food delivery, the next step will be in-depth analysis of the impact of different delivery environments and delivery modes on urban and rural differences so as to provide a better reference for urban and rural policy making.
Conclusion
Accurately identifying urban and rural areas is an important prerequisite for the implementation of urban and rural plans and forms the basis for formulating development strategies. Focusing on urban and rural differences, this study proposes a new approach to identify urban and rural areas based on food delivery data comprehensively considering urban-rural catering, service resource allocation, elements flow, and other factors. Through the identification of urban and rural areas, although the level of accuracy is similar to that of nighttime light data, the results of food delivery data were found to be more favorable to rural areas, to express rural functions. Different from previous studies, the identification of urban and rural areas from the perspective of food delivery focuses more on the flow of population, consumption, and other factors between the two areas, making their identification more reliable. Based on the accurate identification of urban and rural areas of food delivery, this study provides a basis for the study of urban and rural differences, which is of great value to the formulation of urban and rural plans for alleviating urban and rural contradictions, and promoting their harmonious development.
Data Availability Statement
The raw data supporting the conclusions of this article will be made available by the authors, without undue reservation.
Author Contributions
XH and CZ: Conceptualization; RW: Methodology; CZ: Software; XH and GZ: Validation; RW: Formal analysis; CZ and GZ: Investigation; CZ: Resources; XH: Data curation; XH and CZ: Writing—original draft preparation; XH and GZ: Writing—review and editing.
Funding
This research was funded by the National Natural Science Foundation of China (42171188).
Conflict of Interest
The authors declare that the research was conducted in the absence of any commercial or financial relationships that could be construed as a potential conflict of interest.
Publisher’s Note
All claims expressed in this article are solely those of the authors and do not necessarily represent those of their affiliated organizations, or those of the publisher, the editors and the reviewers. Any product that may be evaluated in this article, or claim that may be made by its manufacturer, is not guaranteed or endorsed by the publisher.
References
Abudu, D., Echima, R. A., and Andogah, G. (2021). Spatial assessment of urban sprawl in Arua Municipality, Uganda. Egypt J. Remote Sens. Space Sci. 22, 315.
Alkasem, H. H., and Menai, M. E. B. (2021). A Stochastic Local Search Algorithm for the Partial Max-SAT Problem Based on Adaptive Tuning and Variable Depth Neighborhood Search. IEEE ACCESS 9, 49806–49843. doi:10.1109/access.2021.3068824
Aryal, G. R., Mann, J., Loveridge, S., and Joshi, S. (2021). Drivers of Differences in Inventiveness across Urban and Rural Regions. JOURNAL URBAN AFFAIRS 43 (5SI), 640–657. doi:10.1080/07352166.2020.1712151
Aubrecht, C., Gunasekera, R., Ungar, J., and Ishizawa, O. (2016). Consistent yet Adaptive Global Geospatial Identification of Urban-Rural Patterns: The iURBAN Model. REMOTE SENSING ENVIRONMENT 187, 230–240. doi:10.1016/j.rse.2016.10.031
Bagan, H., Borjigin, H., and Yamagata, Y. (2019). Assessing Nighttime Lights for Mapping the Urban Areas of 50 Cities across the globe. Environ. Plann. B: Urban Analytics City Sci. 46 (6), 1097–1114. doi:10.1177/2399808317752926
Behnke, M., Kirschstein, T., and Bierwirth, C. (2021). A Column Generation Approach for an Emission-Oriented Vehicle Routing Problem on a Multigraph. EUROPEAN JOURNAL OPERATIONAL RESEARCH 288 (3), 794–809. doi:10.1016/j.ejor.2020.06.035
Cao, W., Zhou, S., and Zhou, M. (2021). Operational Pattern of Urban-Rural Integration Regulated by Land Use in Metropolitan Fringe of China. LAND 10 (5), 515. doi:10.3390/land10050515
Carrabs, F., Cerulli, R., Pentangelo, R., and Raiconi, A. (2021). Minimum Spanning Tree with Conflicting Edge Pairs: a branch-and-cut Approach. ANNALS OPERATIONS RESEARCH 298 (1-2SI), 65–78. doi:10.1007/s10479-018-2895-y
Chakraborti, S., Das, D. N., Mondal, B., Shafizadeh-Moghadam, H., and Feng, Y. (2018). A Neural Network and Landscape Metrics to Propose a Flexible Urban Growth Boundary: A Case Study. ECOLOGICAL INDICATORS 93, 952–965. doi:10.1016/j.ecolind.2018.05.036
Chakraborty, S., Maity, I., Patel, P. P., Dadashpoor, H., Pramanik, S., Follmann, A., et al. (2021). Spatio-temporal Patterns of Urbanization in the Kolkata Urban Agglomeration: A Dynamic Spatial Territory-Based Approach. SUSTAINABLE CITIES SOCIETY 67, 102715. doi:10.1016/j.scs.2021.102715
Chen, K., Long, H., Liao, L., Tu, S., and Li, T. (2020). Land Use Transitions and Urban-Rural Integrated Development: Theoretical Framework and China's Evidence. LAND USE POLICY 92, 104465. doi:10.1016/j.landusepol.2020.104465
Cosma, O., Pop, P. C., and Danciulescu, D. (2020). A Parallel Algorithm for Solving a Two-Stage Fixed-Charge Transportation Problem. INFORMATICA 31 (4), 681–706. doi:10.15388/20-infor432
Enoch, M., Monsuur, F., Palaiologou, G., Quddus, M. A., Ellis-Chadwick, F., Morton, C., et al. (2021). When COVID-19 Came to Town: Measuring the Impact of the Coronavirus Pandemic on Footfall on Six High Streets in England. ENVIRONMENT PLANNING B-URBAN ANALYTICS CITY SCIENCE 49, 1091–1111.
Fragkias, M., Lobo, J., and Seto, K. C. (2017). A Comparison of Nighttime Lights Data for Urban Energy Research: Insights from Scaling Analysis in the US System of Cities. Environ. Plann. B: Urban Analytics City Sci. 44 (6), 1077–1096. doi:10.1177/0265813516658477
Galle, N. J., Halpern, D., Nitoslawski, S., Duarte, F., Ratti, C., and Pilla, F. (2021). Mapping the Diversity of Street Tree Inventories across Eight Cities Internationally Using Open Data. URBAN FORESTRY URBAN GREENING 61, 127099. doi:10.1016/j.ufug.2021.127099
Ge, D., Zhou, G., Qiao, W., and Yang, M. (2020). Land Use Transition and Rural Spatial Governance: Mechanism, Framework and Perspectives. J. Geogr. Sci. 30 (8), 1325–1340. doi:10.1007/s11442-020-1784-x
Ghahremani, H., Afsari Bajestani, S., McCarthy, L., and Jalalianhosseini, M. (2021). Transformation of Urban Spaces within Cities in the Context of Globalization and Urban CompetitivenessJOURNAL OF URBAN PLANNING AND DEVELOPMENT 147. J. Urban Plan. Dev. 147.
He, X., Cao, Y., and Zhou, C. (2021a). Evaluation of Polycentric Spatial Structure in the Urban Agglomeration of the Pearl River Delta (PRD) Based on Multi-Source Big Data Fusion. REMOTE SENSING 13 (18), 3639. doi:10.3390/rs13183639
He, X., Yuan, X., Zhang, D., Zhang, R., Li, M., and Zhou, C. (2021b). Delineation of Urban Agglomeration Boundary Based on Multisource Big Data Fusion-A Case Study of Guangdong-Hong Kong-Macao Greater Bay Area (GBA). REMOTE SENSING 13 (9), 1801. doi:10.3390/rs13091801
He, X., Zhou, C., Zhang, J., and Yuan, X. (2020). Using Wavelet Transforms to Fuse Nighttime Light Data and POI Big Data to Extract Urban Built-Up Areas. REMOTE SENSING 12 (23), 3887. doi:10.3390/rs12233887
Lawton, P. (2020). Unbounding Gentrification Theory: Multidimensional Space, Networks and Relational Approaches. REGIONAL STUDIES 54 (2SI), 268–279. doi:10.1080/00343404.2019.1646902
Liang, F., Liu, S., and Liu, L. (2017). Identification of Rural Landscape Functional Conflicts Based on Land Use Competitiveness in Southern Fujian. Trans. Chin. Soc. Agric. Eng. 33 (9), 260–267.
Lichter, D. T., and Brown, D. L. (2011). Rural America in an Urban Society: Changing Spatial and Social Boundaries. Annu. Rev. Sociol. 37, 565–592. doi:10.1146/annurev-soc-081309-150208
Lim, J., and Kang, M. (2021). The Relationship between Site Planning and Electricity Consumption: An Empirical Analysis of Multi-Unit Residential Complexes in Seoul, Korea. ENVIRONMENT PLANNING B-URBAN ANALYTICS CITY SCIENCE 49, 971–986. doi:10.1177/23998083211039855
L.Imhoff, M., Lawrence, W. T., Stutzer, D. C., and Elvidge, C. D. (1997). A Technique for Using Composite DMSP/OLS "city Lights" Satellite Data to Map Urban Area. Remote Sensing Environ. 61 (3), 361–370. doi:10.1016/s0034-4257(97)00046-1
Long, Y., Song, Y., and Chen, L. (2021). Identifying Subcenters with a Nonparametric Method and Ubiquitous point-of-interest Data: A Case Study of 284 Chinese Cities. ENVIRONMENT PLANNING B-URBAN ANALYTICS CITY SCIENCE 49, 58–75. doi:10.1177/2399808321996705
Luo, X., Tong, X., and Pan, H. (2021). Integrating Multiresolution and Multitemporal Sentinel-2 Imagery for Land-Cover Mapping in the Xiongan New Area, China. IEEE Trans. Geosci. Remote Sensing 59 (2), 1029–1040. doi:10.1109/tgrs.2020.2999558
Mullissa, A., Vollrath, A., Odongo-Braun, C., Slagter, B., Balling, J., Gou, Y., et al. (2021). Sentinel-1 SAR Backscatter Analysis Ready Data Preparation in Google Earth Engine. REMOTE SENSING 13 (10), 1954. doi:10.3390/rs13101954
Nicolau, R., and Cavaco, C. (2018). Automated Delimitation of Urban Areas Comprising Small-Sized Towns - Comparison of Two Methodologies Applied to mainland Portugal. Environ. Plann. B: Urban Analytics City Sci. 45 (1), 180–201. doi:10.1177/0265813516668856
Peng, J., Hu, Y. n., Liu, Y., Ma, J., and Zhao, S. (2018). A New Approach for Urban-Rural Fringe Identification: Integrating Impervious Surface Area and Spatial Continuous Wavelet Transform. LANDSCAPE URBAN PLANNING 175, 72–79. doi:10.1016/j.landurbplan.2018.03.008
Peng, J., Lin, H., Chen, Y., Blaschke, T., Luo, L., Xu, Z., et al. (2020). Spatiotemporal Evolution of Urban Agglomerations in China during 2000-2012: a Nighttime Light Approach. Landscape Ecol. 35 (2), 421–434. doi:10.1007/s10980-019-00956-y
Rovai, M., Zetti, I., Lucchesi, F., Rossi, M., and Andreoli, M. (2020). Peri-urban open spaces and sustainable urban development between value and consumption. (Springer Verlag) pp 249-265.
Shen, H., Huang, L., Zhang, L., Wu, P., and Zeng, C. (2016). Long-term and fine-scale Satellite Monitoring of the Urban Heat Island Effect by the Fusion of Multi-Temporal and Multi-Sensor Remote Sensed Data: A 26-year Case Study of the City of Wuhan in China. REMOTE SENSING ENVIRONMENT 172, 109–125. doi:10.1016/j.rse.2015.11.005
Shi, Y., Tao, T., Cao, X., and Pei, X. (2021). The Association between Spatial Attributes and Neighborhood Characteristics Based on Meituan Take-Out Data: Evidence from Shanghai Business Circles. JOURNAL RETAILING CONSUMER SERVICES 58, 102302. doi:10.1016/j.jretconser.2020.102302
Tan, X., Ouyang, Q., Yu, S., An, Y., and Zhou, G. (2017). Knowledge Structure of Rural Function in China: An Analysis Based on CiteSpace Map. Econ. Geogr. 37 (10), 181–187. doi:10.3390/su12010066
Tayyebi, A., Pijanowski, B. C., and Tayyebi, A. H. (2011). An Urban Growth Boundary Model Using Neural Networks, GIS and Radial Parameterization: An Application to Tehran, Iran. LANDSCAPE URBAN PLANNING 100 (1-2), 35–44. doi:10.1016/j.landurbplan.2010.10.007
Tian, G., Qiao, Z., and Gao, X. (2014). Rural Settlement Land Dynamic Modes and Policy Implications in Beijing Metropolitan Region, China. HABITAT INTERNATIONAL 44, 237–246. doi:10.1016/j.habitatint.2014.06.010
Wang, Y., Zang, L., and Su, Y. (2020). Prospects for Chinas Agricultural Modernization in 2035. Res. Agric. Modernization 41 (1), 16–23. doi:10.13872/j.1000-0275.2019.0109
Wille, E. C. G., and Bento, C. R. C. (2021). Filamentous Fungi Growth as Metaphor for Mobile Communication Networks Routing. Adv. Electr. Comp. Eng. 21 (2), 59–66. doi:10.4316/aece.2021.02007
Yang, Y., Liu, Y., Li, Y., and Du, G. (2018). Quantifying Spatio-Temporal Patterns of Urban Expansion in Beijing during 1985-2013 with Rural-Urban Development Transformation. LAND USE POLICY 74, 220–230. doi:10.1016/j.landusepol.2017.07.004
Yang, Z., Chen, Y., Guo, G., Zheng, Z., and Wu, Z. (2021). Using Nighttime Light Data to Identify the Structure of Polycentric Cities and Evaluate Urban Centers. SCIENCE TOTAL ENVIRONMENT 780, 146586. doi:10.1016/j.scitotenv.2021.146586
Yu, A. T. W., Wu, Y., Shen, J., Zhang, X., Shen, L., and Shan, L. (2015). The Key Causes of Urban-Rural Conflict in China. HABITAT INTERNATIONAL 49, 65–73. doi:10.1016/j.habitatint.2015.05.009
Zhang, J., Yuan, X., Tan, X., and Zhang, X. (2021). Delineation of the Urban-Rural Boundary through Data Fusion: Applications to Improve Urban and Rural Environments and Promote Intensive and Healthy Urban Development. Int. J. Environ. Res. Publ. Health 18, 7180.
Zhao, P., and Hu, H. (2019). Geographical Patterns of Traffic Congestion in Growing Megacities: Big Data Analytics from Beijing. CITIES 92, 164–174. doi:10.1016/j.cities.2019.03.022
Zhong, S., Zhao, X., Guo, X., Ye, Y., and Li, W. (2018). Delimitation of Urban Growth Boundary Based on Spatial Suitability Evaluation and Population Carrying Capacity in Guixi County. J. Nat. Resour. 33 (5), 801–812.
Keywords: spatial planning, nighttime light data (NTL), food delivery, rrban-rural boundary, urban expansion
Citation: Zhou C, He X, Wu R and Zhang G (2022) Using Food Delivery Data to Identify Urban -Rural Areas: A Case Study of Guangzhou, China. Front. Earth Sci. 10:860361. doi: 10.3389/feart.2022.860361
Received: 22 January 2022; Accepted: 04 March 2022;
Published: 23 March 2022.
Edited by:
Juergen Pilz, University of Klagenfurt, AustriaReviewed by:
Nophea Sasaki, Asian Institute of Technology, ThailandPingping Luo, Chang’an University, China
Copyright © 2022 Zhou, He, Wu and Zhang. This is an open-access article distributed under the terms of the Creative Commons Attribution License (CC BY). The use, distribution or reproduction in other forums is permitted, provided the original author(s) and the copyright owner(s) are credited and that the original publication in this journal is cited, in accordance with accepted academic practice. No use, distribution or reproduction is permitted which does not comply with these terms.
*Correspondence: Guojun Zhang, Z3VvanVuekBnZHVmZS5lZHUuY24=
†These authors have contributed equally to this work and share first authorship