
95% of researchers rate our articles as excellent or good
Learn more about the work of our research integrity team to safeguard the quality of each article we publish.
Find out more
ORIGINAL RESEARCH article
Front. Earth Sci. , 04 May 2022
Sec. Environmental Informatics and Remote Sensing
Volume 10 - 2022 | https://doi.org/10.3389/feart.2022.860234
This article is part of the Research Topic Near-earth Electromagnetic Environment and Natural Hazards Disturbances View all 10 articles
 Rui Yan1,2*
 Chao Xiong3,4*
 Zeren Zhima1
 Xuhui Shen1
 Dapeng Liu1
 Chao Liu5
 Yibing Guan5
 Keying Zhu1
 Lin Zheng2
 Fangxian Lv1
In this study, we have performed a detailed analysis for the correlation between electron density (Ne) and temperature (Te) at the topside ionosphere. In situ measurements from four satellites have been utilized, including the China Seismo-Electromagnetic Satellite (CSES), Swarm A and B, as well as the earlier Challenging Minisatellite Payload (CHAMP) satellite. To make a fair comparison, only simultaneous observations between CSES and Swarm A/B have been considered; while for CHAMP, as it doesn’t have overlaps with CSES period, the observations during similar low solar activity years are considered. Our study has been confined to the dayside around 14:00 local time (LT), due to the fixed LT coverage of CSES. Observations from the four satellites show generally consistent relationship between the Ne and Te at the topside ionosphere. When Ne is low, the Te is negative correlated with Ne, while the slop of negative relation becomes shallower or even reverses to a positive relation after Ne exceeds a certain threshold. The slope of Ne/Te relation shows also dependence on season and magnetic latitude (MLat), as the ionospheric Ne and Te themselves are seasonal and MLat dependent. Interestingly, we find two abnormal features of the Swarm Te measurements: 1) when Ne is lower than 1×10¹¹ m−3, Te sometimes becomes very scatter at low and middle latitudes; 2) when Ne is larger than 1×10¹¹ m−3, Te is grouped into two branches at the equatorial and low latitudes. Further analysis reveals that the flags used in the Swarm Level-1 B plasma density product cannot well distinguish the two abnormal features of Te, implying further efforts are needed for the Swarm Te data calibration.
The topside ionosphere is a highly dynamic region that varies significantly with latitude, longitude, altitude, local time, season, and solar cycle. These variations have been explored for decades using electron density (Ne) and temperature (Te) observed by different ground-based and satellite instruments (Hargreaves, 1992; Schunk and Nagy, 1978). Due to high thermal conductivity along the magnetic field lines, significant energy can be transferred by electrons from the sources to the sinks (Rother et al., 2010). Therefore, investigation on the variation of ionospheric Te as well as its relation with Ne can greatly advance our understanding of the ionosphere-thermosphere dynamics and interaction (e.g., Bilitza, 1975).
It has been widely reported by earlier studies (Brace and Theis, 1978; Bailey et al., 2000; Schunk and Nagy, 1978) that at topside ionosphere the Ne is generally anti-correlated with Te during daytime. Above 200 km, the dominant electron cooling process is Coulomb collision between the electrons and the ambient ions and the cooling rate is proportional to Ne2, while the heating rate by photoelectrons is proportional to Ne (Schunk and Nagy, 1978; Kakinami et al., 2011a; Su et al., 2015).
With the increment of data and research, positive correlation between the Te and Ne has also been identified (Zhang and Holt, 2004; Ren et al., 2008; Kakinami et al., 2011a; Zhang et al., 2014). By using over 30-years data from the incoherent scatter radar at Millstone Hill and Arecibo, Lei et al. (2007) found that the correlation between daytime Te and Ne at the F2 peak height sometimes can be positive, especially under high solar activity years. They explained that the Ne is usually sufficiently high under high solar activity condition, which leads to a rapid energy transfer from the electrons to the ions and from the ions to the neutrals. These processes result in small temperature differences between electrons, ions, and neutrals. Therefore, electron, ion, and neutral temperatures increase with higher solar flux because the neutral temperature increase as the solar flux increases, leading to a positive correlation between Ne and Te as Ne increases also with higher solar flux. However, such an explanation can’t be applied to the findings of Kakinami et al. (2011a), as they found that positive correlation between Ne and Te occurs when Ne is larger than a threshold (1012 m−3) but regardless of solar flux. They suggested that additional heat should be involved for the positive correlation between Ne and Te, e.g., possible sources contributing to the integrated Ne along the magnetic field lines.
Similar positive relation between daytime Ne and Te has latter been confirmed from the Detection of Electro-Magnetic Emissions Transmitted from Earthquake Regions (DEMETER) observations, but such a feature was not seen from the nighttime data (Kakinami et al., 2013). Zhang et al. (2014) performed a comprehensive study focused on the relationship between Ne and Te detected by DEMETER from 2005 to 2010. They found that during daytime the Ne and Te showed strong negative correlation at equator and low latitudes, but during the solar minimum year (e.g., in March 2009) their correlation changed to be positive at 25°–30° magnetic latitudes. Su et al. (2015) investigated the relationship between Ne and Te from the perspective of seasonal and latitudinal dependences, and the negative correlation between daytime Ne and Te was found in most seasons except at high latitudes in the northern winter, where a positive correlation occurred. They further explained that the F region electron density is quite low at high latitude during northern winter, therefore, the collision between the electrons and the ions is low and thus leads to a weaker coupling between Te and Ne.
In addition, the relationship of Ne and Te in some specified areas, or under special conditions has also been investigated. For example, at the Weddle Sea Anomaly (WSA) region, Liu et al. (2015) found that the Ne is anti-correlated with the Te in both day and night times, by using concurrent measurements at 660–830 km altitude observed by Tatiana-2, DEMETER and Formosa Satellite 3/Constellation Observing System for Meteorology, Ionosphere and Climate (COSMIC). Shen et al. (2015) investigated the correlation of Ne and Te before and after large earthquakes, using DEMETER observations in nighttime. They found that over the seismic regions, the negative correlation between Ne and Te is increased at middle and low latitudes comparing with their normal background. Using 8 years of Challenging Minisatellite Payload (CHAMP) satellite observations, Stolle et al. (2011) found a significant negative correlation between Ne and Te during morning overshoot in equinoxes and June solstice (R < −0.9), while the correlation is much weaker during December solstice. The negative correlation between Ne and Te during morning overshoot hours has been further confirmed by the Swarm observations (Yang et al., 2020).
The relationship between Ne and Te has been discussed and included in the International Reference Ionosphere (IRI) model (Bilitza, 1975; Bilitza, 1985; Bilitza et al., 1993). Based on 4 years data from the radar at Millstone Hill, Bilitza (1975) constructed an empirical relation between Ne and Te. They further used the measurements from the radar at Arecibo to derive altitude-dependent correlation parameters (Bilitza, 1985; Bilizta et al., 1993). Considering the complex relation between Ne and Te, it was recommended in the IRI model to establish independent models for the Ne and Te, and then use the relation between the two parameters for adjusting relevant processes (Bilizta et al., 1993).
As discussed above, though many studies have been conducted on the relationship between Ne and Te at the topside ionosphere, there is no conclusion for explaining the positive correlation between them. A possible reason is that the variation of F region Te depends on several parameters, e.g., Ne, ion density (Ni), neutral density, neutral temperature and also neutral composition etc., while the solar activity, season, latitude, longitude and altitude affect the distributions of all these parameters. In addition, most of the above-mentioned studies used Ne/Te data from only one satellite, therefore, their results might be applied to a certain condition, for example, a relative fixed altitude range or local time, depending on the satellite orbits and mission period. To learn more about their physical mechanisms, it is necessary to perform further comprehensive investigation on the correlation of Ne and Te by including several satellites. Such a study is also helpful for inter-satellite measurements comparison, which is especially important for the recently-launched satellite, such as CSES.
In this study we performed a detailed analysis of Ne and Te probed by four different satellites, CSES, Swarm A and B, and CHAMP. Comparison between them will not only help us to reveal the controlling parameter of Ne/Te correlation, but can also be regarded as an inter-satellite validation for reflecting the data quality, especially for measurements from the most recently launched CSES. To simplify the comparison, for all three satellites we focus only on the dayside data around 14:00 LT. In Satellite Missions and Data Source Selection part, we provide the descriptions of the satellites as well as their onboard Langmuir probe. Seasonal and latitudinal dependences of Ne/Te correlation are presented and compared in Result part. Discussions are provided in Discussion part. The final summary is drawn.
CSES is the first satellite of Chinese space-based geophysical field observation system, which is aimed for the application prospects in earthquake and near-space science. It was launched into an altitude of about 507 km, with a nearly Sun-synchronous orbit of 98° inclination, and the ascending/descending node is at about 02:00/14:00 LT (Shen et al., 2018). The Langmuir probe (LAP) provides in situ Ne covering a range from 5×10²–1×107 cm−3, and Te from 500 k to 10,000 K. Previous studies have confirmed the reliability of CSES measured Ne and Te, that show generally consistent global distributions with earlier satellites, e.g., DEMTER and Swarm (e.g., Liu et al., 2018; Yan et al., 2020; Yan et al., 2022).
The Swarm mission, consisting of three identical satellites (A, B, C), was launched on 22 November 2013 into nearly polar, circular orbits, in altitude of approximately 490 km. In the final constellation, the Swarm A and C are flying side-by-side (longitudinal separation of 1.4°) at about 460 km, while the Swarm B is flying by about 50 km higher (Lühr et al., 2015; Xiong et al., 2016a). One key instrument of Swarm satellites is the Electric Field Instrument (EFI) (Knudsen et al., 2017), consisting of a pair of Thermal Ion Imagers (TIIs), and a pair of LPs. The LPs provide the Ne and Te with a time resolution of 2 Hz. Quite good agreements have been found between Swarm measured Ne/Te and other techniques/model predictions, suggesting a good reliability of the Swarm plasma dataset (Lomidze et al., 2018; Palin et al., 2015; Pedatella et al., 2015). As the Swarm C is at the same altitude of Swarm A and their Ne measurements are very consistent with each other (Xiong et al., 2016b), the results from Swarm C are not shown in this study. In addition, only the data with good quality are selected, with the flags are satellite potential (Vs.), Ne and Te being set to 20, and flag of LPs being set to 1.
The CHAMP satellite was launched on 15 July 2000 into a nearly-polar (inclination = 87.3°), circular orbit with an initial altitude of about 450 km (Reigber et al., 2002). When the mission ended with the reentry into the atmosphere on 19 September 2010, its altitude decayed to about 150 km. The onboard Planar Langmuir Probe (PLP) provided the in situ Ne and Te measurements for every 15 s. In-flight calibration of the PLP instrument has been performed and CHAMP has been confirmed to provide reliable plasma data. The details of the calibration and the retrieval of electron density and temperature from the PLP observations are given by McNamara et al. (2007).
Figure 1A shows the variation of altitude, local time from CSES and Swarm A/B satellites in 2019 and 2020. As there is no overlap between the CSES and CHAMP missions, we considered only the CHAMP data in 2008 and 2009 with low solar activity (Figure 1B), which is similar to the solar activity during CSES operation period. The solar flux in 2008–2009 and 2019–2020 are depicted in the first subpanel in Figures 1A, B. In order to reduce the influence of magnetic storm all data are selected under magnetically quiet conditions with Kp < 3.
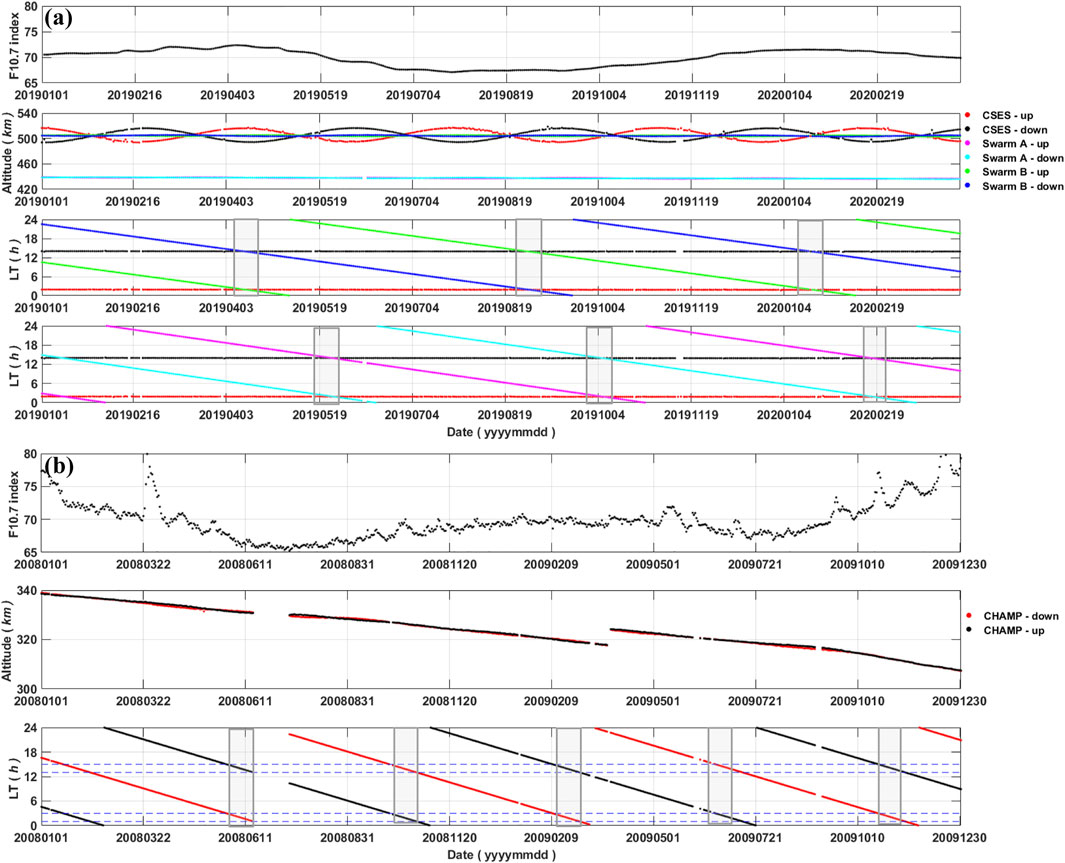
FIGURE 1. The temporal variation of altitude, local time from four satellites and their corresponding solar flux. (a) for CSES, Swarm B, and Swarm A; (b) For CHAMP.
For a fair comparison, we selected the simultaneous measurements from the CSES and Swarm satellites when they are close in both time and space. Three conjunction periods around 14:00 LT (marked with light-grey rectangles in the lower two panels of Figure 1A) are found between the two satellites, which are: Apr. 5–19, 2019, Aug. 22–31, 2019 and Jan. 10–23, 2020 for Swarm B and CSES, while Sep. 25- Oct. 10, 2019, May. 15- Jun. 4, 2019 and Feb. 5–22, 2020 for Swarm A and CSES, reflecting the periods at equinoxes, June solstice and December solstice (Figure 1A).
Considering CHAMP data gaps around 14:00 LT, data for the same season and local time in 2008 and 2009 were analyzed together so that sufficient data can be used for our comparison. To focus on 14:00 LT, the CHAMP data during Oct.5–21, 2008 are used for representing the situations of equinoxes; May. 28 - Jun. 18, 2008 and Jul. 1–11, 2009, as well as Feb. 25–28 & Nov. 11–14, 2009 are corresponding to June solstice and December solstice, respectively. These five conjunction periods between CSES and CHAMP have also been marked with light-grey rectangles (see Figure 1B) The CHAMP altitude in 2008 and 2009 is around 330 km (Stolle et al., 2011).
To sum up, we researched the correlation of Ne and Te at around LT 14:00 using satellites with different altitude (∼330km, ∼480 and ∼500 km separately). And at around 500 km, we can get the data at closest time and distance from two satellites (CSES and Swarm B) for mutual authentication.
Figure 2 presents the Ne/Te MLat profiles of CSES, Swarm B, Swarm A and CHAMP from top to bottom. Data have been separated into equinoxes, June solstice, and December solstice, as shown in three columns from left to right. For each satellite, the Ne/Te profiles during conjunction period are presented as black lines, and the red lines represent the average profile of each season. A common feature between all four satellites is the Ne peaks at the magnetic equator, corresponding to the well-known equatorial ionization anomaly (EIA), while the Te shows a clear valley above the magnetic equator, suggesting a negative relation between the Ne and Te.
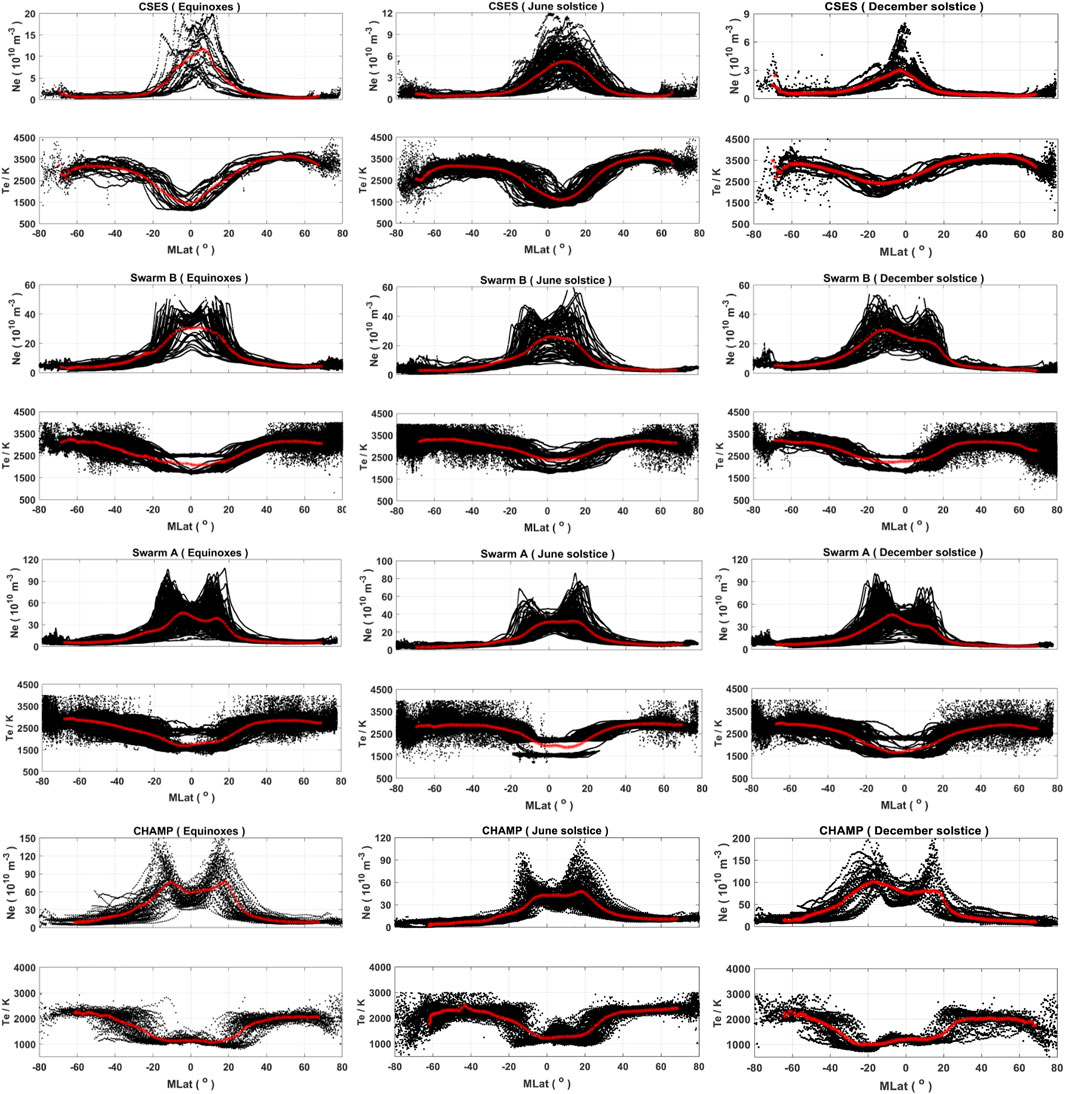
FIGURE 2. The MLat distributions of Ne/Te profiles of CSES, Swarm B, Swarm A and CHAMP (from top to bottom). The equinoxes, June solstice, and December solstice are shown in columns from left to right. The red lines represent the average profile of each season.
Slight differences are also seen between the four satellites. For example, the double crests of EIA are more prominent from the Ne profiles of Swarm A and CHAMP, as they fly at a relative lower altitude; while for Swarm B and CSES, which fly at a similar altitude, the double crests are more evidenced from Swarm B. Such difference of Ne between CSES and Swarm B has been earlier reported by Yan et al. (2020), which might be caused by the lower absolute Ne values measured by CSES and different data inversion method. The EIA crests show similar seasonal variations from Swarm B, Swarm A and CHAMP, with the same magnitude in the two hemispheres during equinoxes but with stronger crest in the local summer hemisphere during two solstices. Such a seasonal variation of the inter-hemispheric asymmetry of EIA crests is caused by the trans-equatorial plasma flue along magnetic fluxtube, which has been well discussed by Xiong et al. (2013). Another interesting feature seen in Figure 2 is that the Te profiles from Swarm A and B seem to form two branches at the equatorial and low latitudes regardless of seasons, while such a feature cannot be seen from the CSES and CHAMP Te profiles.
Figure 3 repeats the average profiles of Ne/Te from the four satellites by comparing variations along MLat between CSES with another satellite. To better show the comparison, the average profiles of CSES are repeated as black lines in each subpanels, while the profiles from the other three satellites are shown as blue lines. They are shown in dual coordinate axis so that we better compare their trend along MLat although the different absolute values of Ne/Te. Similar to Figure 2, the subpanels from left to right depict the results in three different seasons. Very similar variations of Ne/Te are seen between CSES and the other three satellites, except the single or double crests of EIA that being attributed to satellite probing altitude. In addition, a feature seen from CHAMP is that the Te exhibits two minima at latitudes corresponding well to the EIA crests.
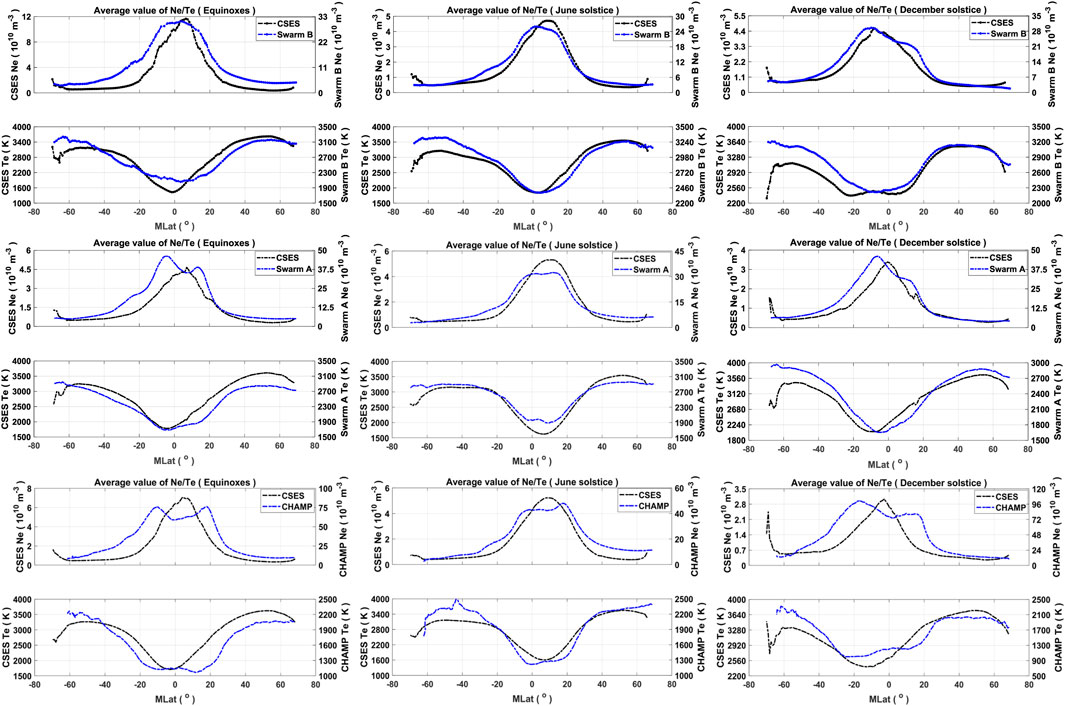
FIGURE 3. The average profiles comparison of Ne/Te between CSES & Swarm B, CSES and Swarm A and CSES and CHAMP. The average profiles of CSES are shown as black lines, while the profiles from the other three satellites are shown as blue lines.
Figure 4 show the scatter distribution of Ne and Te around 14:00 LT from the four satellites (from top to bottom, CSES, Swarm B, Swarm A and CHAMP). The subpanels from left to right depict the results in equinoxes, June solstice, and December solstice. We have limited our analysis to the low and middle latitudes (±50° MLat) to avoid the much more complicate Ne/Te relation at auroral latitudes. The colors from blue to red represent the measurements at different MLat range. A general negative relation is found between the Ne and Te at 14:00 LT from all four satellites. However, the slope of the negative relation reduces and even becomes positive when the Ne becomes larger.
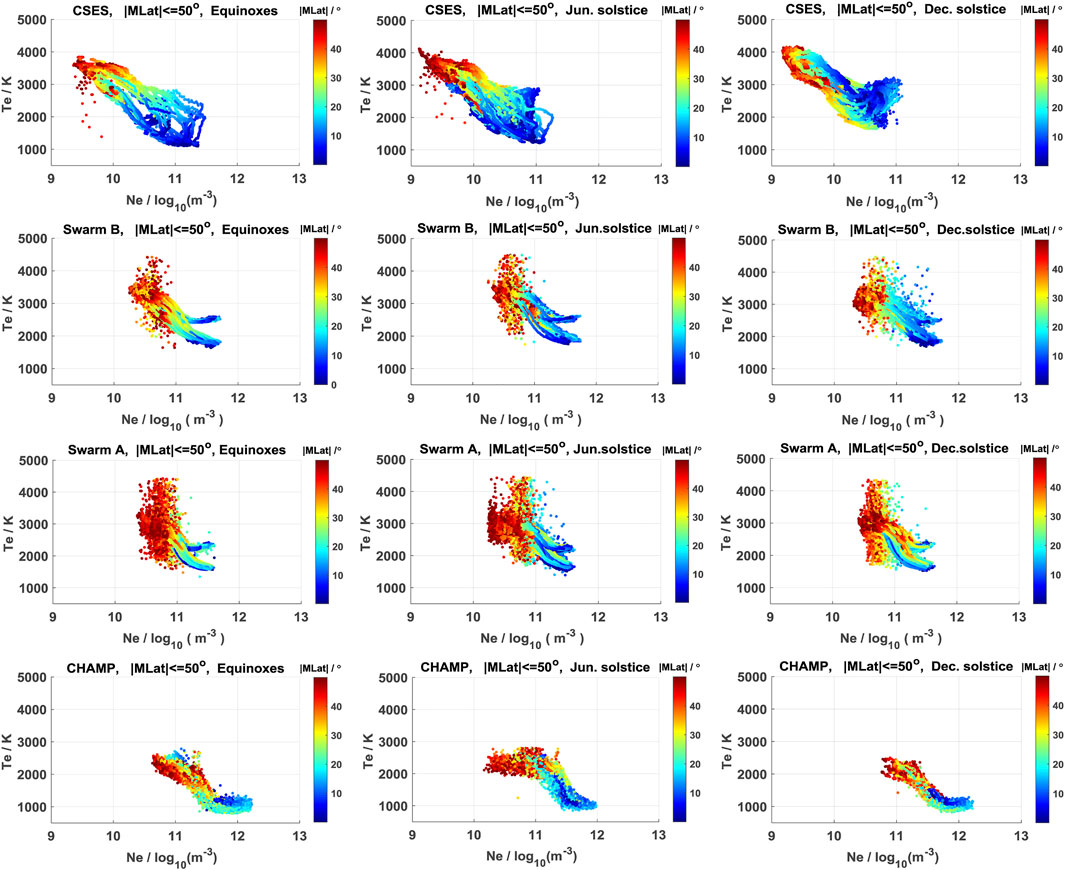
FIGURE 4. The scatter distributions of Ne and Te around 14:00 LT from CSES, Swarm B, Swarm A and CHAMP are shown from top to bottom. The equinoxes, June solstice, and December solstice are shown in columns from left to right. The colors from blue to red represent the measurements at different MLat range (±50°).
A feature for the two Swarm satellites is that the relation between Ne and Te is quite scatter when the Ne is low (less than 1×10¹¹ m−3). For Ne at a fixed level, the Te can vary from 2000 K to over 4000 K. Similar wild variation of Te is also seen from the CSES observation, with less data points which are confined to equinoxes and June solstice seasons. However, such wild variation of Te can’t be seen from the CHAMP observations. In addition, when the Ne is larger than 1×10¹¹ m−3, the relation between Ne and Te forms two branches for Swarm A and B irrespective of seasons, which should be caused by the two groups of Swarm Te profiles at the equatorial and low latitudes as shown in Figure 2.
For CHAMP, we see similar Ne/Te relation as that observed by CSES. Slight difference is that instead of the positive relation between Ne and Te, a saturation of Te is observed (or Te keeps at a same level) when Ne continues increases from 1×1011.5 m−3. Such a saturation of Te is also evidenced when Ne is very low, especially during June solstice.
To check if there is a latitudinal and seasonal dependence of the Ne/Te relation, the data in different MLat ranges are presented separately, and the results from the four satellites are presented in Figures 5–8. For each satellite, the observations are further divided into three seasons.
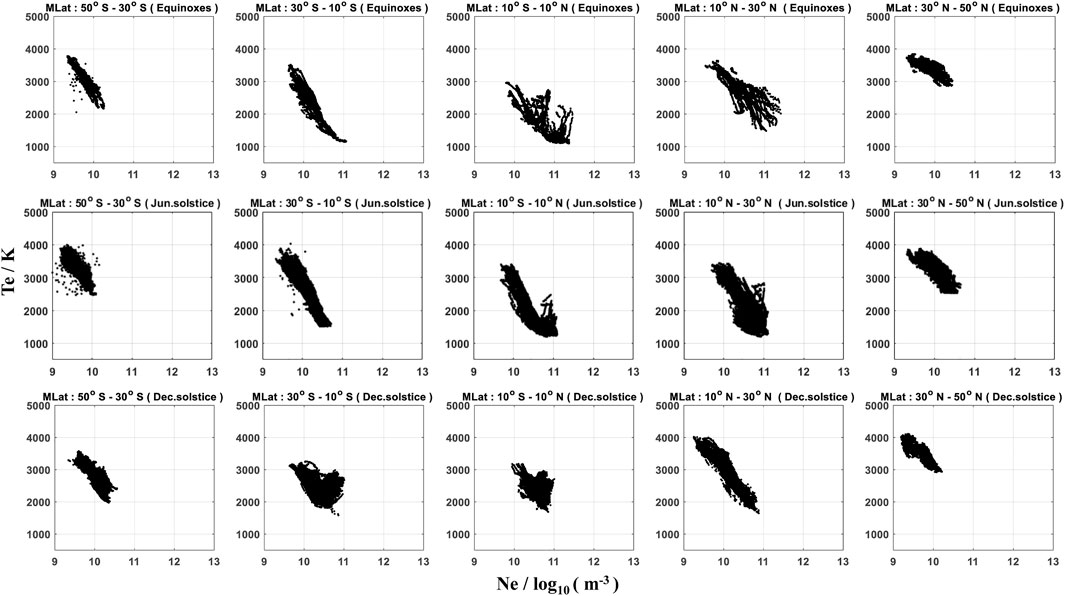
FIGURE 5. Correlation of Ne and Te from CSES during different MLat ranges. From top to bottom, correspond to Equinoxes, June solstice, and December solstice. From left to right, the MLat range corresponds to 50° S - 30° S, 30° S - 10° S, 10° S - 10° N, 10° N - 30° N, 30° N- 50° N respectively.
It is obvious that the correlation of Ne and Te at middle MLat (30°N -50°N and 30°S-50°S) are mainly negative, while at low and equatorial latitudes (from 30°S to 50°N), both negative and positive relation between Ne and Te are found. The reduced negative or even positive relation between Ne and Te is only found when Ne is larger. Around 14:00 LT, the Ne at middle latitudes is usually lower than the values at low and equatorial latitudes, especially when the EIA structure is well developed.
In addition, seasonal influence can also be seen. In equinoxes the correlation of Ne and Te are symmetric with respect to the geomagnetic equator. In solstice seasons, the correlation of Ne and Te vary with seasons and has similar characteristics when in same season hemisphere. For example, at MLat range 10°S-30°S, the Ne and Te measured from CSES show positive correlation only during December solstice hemisphere. This is because the southern hemisphere is in summer during December solstice, and the Ne is larger in southern hemisphere due to large solar illumination. Similar trend between Ne and Te is found in the northern hemisphere (10°N-30°N), though with no clear positive relation observed, the slope of the negative Ne/Te relation becomes spread during local summer (June solstice). From this perspective, whether the Ne is negatively and positively correlated with Te, depends largely on the absolute value of Ne.
The relation between Ne and Te from Swarm satellites (Figures 6, 7) shows very similar latitudinal and seasonal dependences as that observed by CSES. However, additional two features need to be mentioned. First, the scatter of Ne/Te relation mainly happens at the low and middle latitudes (|MLat|>30°), as well as at MLat range 10°N-30°N in December solstice and 10°S-30°S in June solstice. Second, the two branches of Ne/Te relation happens mainly at equatorial and low latitudes (|MLat|<30°) when Ne is larger than 1×10¹¹ m−3. From the latitudinal and seasonal distributions, we see the scatter of Ne/Te relation is dominated by MLat, while forming two branches of Ne/Te relation is dominated by the magnitude of Te.
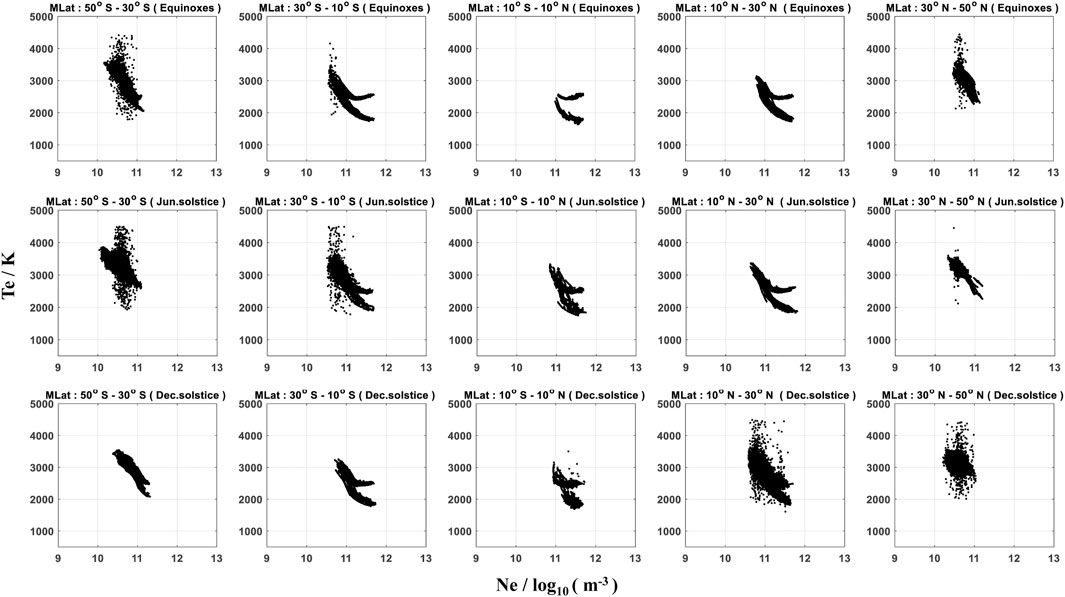
FIGURE 6. As same as Figure 5, but for Swarm B
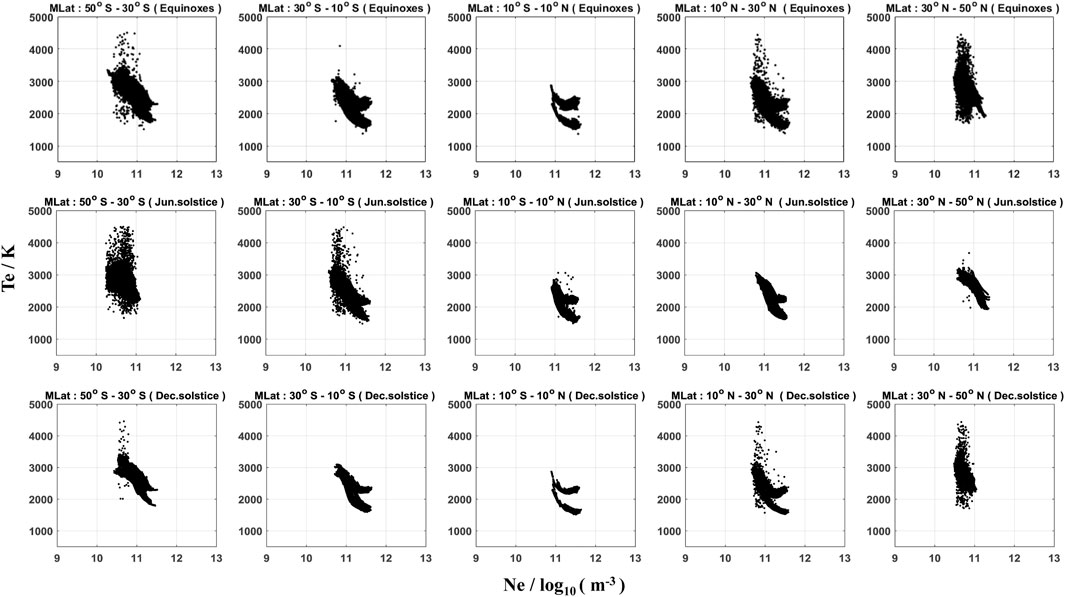
FIGURE 7. As same as for Figure 5, but for Swarm A.
For CHAMP (Figure 8), we see similar seasonal and MLat dependences of Ne/Te relation as that observed by CSES. In addition, a saturation of Te is observed (or Te keeps at a same level) at equatorial and low latitudes (|MLat|<30°), and also in the southern middle latitude (30°S -50°S) during June solstice.
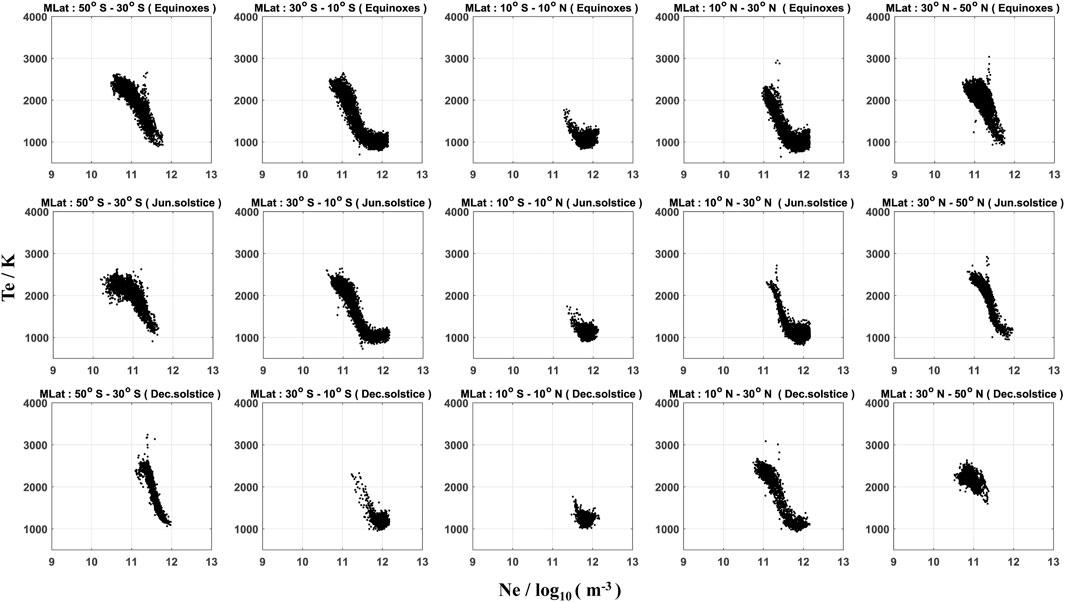
FIGURE 8. As same as for Figure 5, but for CHAMP.
The intensity of Ne and Te shows clear seasonal and magnetic latitudinal dependences from the measurements of all four satellites. For example, the Ne is symmetric about the magnetic equator in the equinoxes, while with larger values shifted towards the summer hemisphere in solstice seasons (seen Figures 2, 3). Such seasonal and latitudinal variation of topside Ne is also consistent with pervious findings observed by other low earth orbiting satellites, e.g., the Gravity Recovery and Climate Experiment (GRACE) and DEMETER (Xiong et al., 2013; Zhang et al., 2014), as well as the total electron content (TEC) derived from the ground receivers of global navigation satellite system (GNSS) (e.g., Yeh et al., 2001). In addition, considering the altitude dependences, the Ne shows larger values and the two EIA crests are much more prominent from the satellites fly at lower altitude. This is well to be understood, as the EIA crests have stronger intensity at the F2 peak, and the four satellites fly above the F2 peak during almost all the time.
The Te in the low-latitude topside ionosphere is mainly controlled by the photoelectron heating and cooling through Coulomb collisions with ions that are both related to the integrated Ne. As shown in Figures 5–8, the Te in the same Ne range increases with increasing MLat. On the dayside around 14:00 LT, a clear negative correlation between Te and Ne is seen at low and middle latitudes; especially for the lower altitudes where Swarm A and CHAMP fly, two Te minima are observed right at the latitudes of EIA crests (Figure 2). As shown in Figure 4, no scatter distribution between Ne and Te is observed from the CHAMP satellite. Even though, for a fixed Ne value, the Te can vary with a range over 500 K. One possible reason could be that the Ne considered here is the in situ measurement along the satellite track. As pointed out by Kakinami et al. (2011a), Te is more closely related to the integrated Ne along magnetic fluxtube, and the in situ Ne does not completely correlate with the integrated Ne, for example, the meridional wind can transport the plasma from one hemisphere to the other (Kelley, 2009).
In addition, due to influences from the lower atmospheric tidal and waves forcing, the topside ionospheric exhibit different longitudinal patterns in different seasons. The most prominent patterns are the longitudinal wave-4 and wave-3 structures during August and December solstice, which is considered to be dominated by the non-migrating tidal component of DE3 and DE2, respectively (e.g., Immel et al., 2006; Wan et al., 2010; Lühr et al., 2012). These results suggest that even at a fixed local time, the Ne can vary with quite a large range at different longitudes during different seasons, so it will further affect the seasonal dependence of Ne and Te relation as shown in Figure 4.
One interesting feature seen from CHAMP is that the Te keeps almost at a constant level when Ne is very low (in the southern middle latitude, 30°S -50°S, during June solstice). Kakinami et al. (2011a) reported an “inverted U shape” of the relation between Ne and Te during 06:00–08:00 LT from the Hinotori satellite observations The inverted U shape shown in their Figure 1 arises from the positive correlation for lower Ne and a negative correlation for higher Ne, which looks very similar to the CHAMP results as shown in our Figure 8. And for both satellites, such low Ne values appear at middle latitudes.
Two prominent features of the Ne/Te relation observed by Swarm satellites are: 1) when Ne is larger than 1×10¹¹ m−3, Te are grouped into two branches at equatorial and low latitudes; 2) when Ne is lower than 1×10¹¹ m−3, Te sometimes becomes very scatter at the low and middle latitudes.
For the first feature, we repeated the Ne/Te relation from Swarm B, shown in Figure 9. In Figure 9A the observations during equinoxes, June solstice and December solstice are marked with green, red and blue. Te has been grouped into two branches when Ne is larger than 1×10¹¹ m−3, but no clear seasonal dependence of the two-branch feature of Te dependencies observed. For a fixed Ne level, the difference between the two Te branches is about 600 K. In addition, we checked further if the two branches of Swarm Te have geographical dependence, e.g. on longitude. As shown in Figure 9B, data have been divided into four geographic longitude bins: 180°– -90°, -90° 0°, 0° 90°, 90° 180° marked separately with red, green, blue and yellow. However, no clear longitude dependence is found of the two-branch feature.

FIGURE 9. Scatter plot of Ne and Te as measured by Swarm B. Each data point is confined into within the |MLAT|≤ 50° at around 14:00LT. (A) The observations during equinoxes, June solstice and December solstice are marked with green, red and blue. (B) The observations in different longitude regions including -180° ∼ -90°, -90° ∼ 0°, 0° ∼ 90°, 90°∼ 180° are marked with red, green, blue and yellow.
From Figures 4, 9, the Ne value of 1×10¹¹ m−3 seems to be the threshold when the two branches of Te occur. However, as seen from Figures 4, 8, the Ne observed by CHAMP are sometimes also greater than 1×10¹¹ m−3, but the two branches of Te were not observed in the CHAMP data. So, it seems that the two branches of Swarm Te data are not directly related to the absolute value of Ne.
To have a further look at the two Te branches, we selected two orbits data both from Swarm B and CSES as examples, illustrated in Figure 10. Figures 10A, C show two latitudinal profile of Ne (first panel) and Te (second panel) from Swarm B marked as blue, while the Ne and Te measurements from CSES during this conjunction orbit are shown as black lines. The values of Ne/Te from Swarm B and CSES are depicted by the left and right y-axis, respectively. The CSES orbits are quite close to Swarm, and the near-simultaneous footprints are presented also as black lines and blue lines (Figures 10B, D). Among them, in the first example (Figures 10A, B), Ne and Te profiles from CSES and Swarm B agree quite well with each other, except the difference of absolute value of Ne. The Te measurements from both satellites are basically at the same range, and the Te keeps at a lower value of about 2000 K at the low and equatorial latitudes, corresponding to the lower Te branch in Figure 9. From the second example (Figures 10C, D), we can see another characteristic, the Te from Swarm B keeps almost a constant value of about 2500 K at low and equatorial latitudes, representing the upper branch in Figure 9. For both examples, we see clearly that the Te from CSES keeps a value of about 1700 K at the low and equatorial latitudes. We checked also the quality flag of Te from Swarm B (third panel in Figures 10A, C), and the parameter “Flag-Te” is always marked as 20 for both orbits, suggesting no obvious disturbances during the two orbits. Such a direct comparison suggests that the upper branch of Swarm Te might be biased by a value of 600 K, though we don’t know what causes the bias of the Swarm Te. The two-branch feature of Te seems exists in both hemispheres during all seasons, therefore, it might not be simply attributed to the illumination of the sunlight.
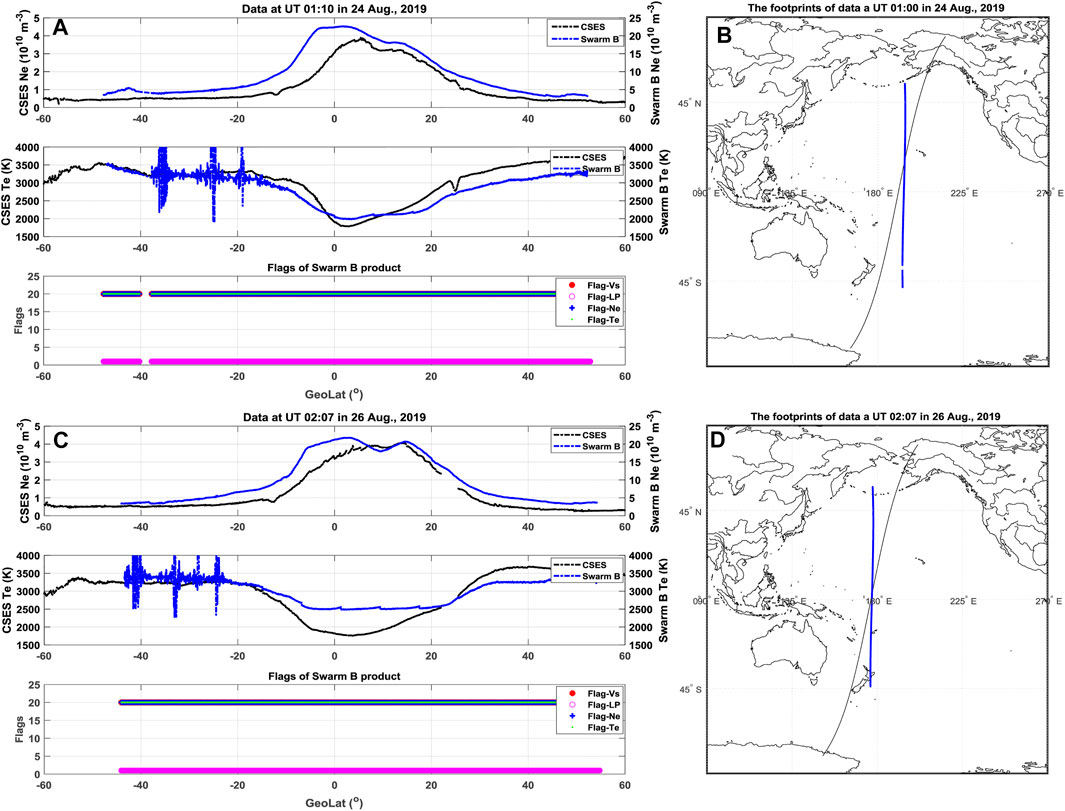
FIGURE 10. (A,C) are the latitudinal profiles of Ne/Te from the CSES (black) and Swarm B (blue) when they are close in time and space. In addition, the flags of Swarm LP product are shown in the bottom panels of (A,C). The two examples are taken on 24 and 26 August 2019, and their footprints of the two satellites are shown in Figure (B,D).
For the second feature, we see that the Te from Swarm B satellite shows clear fluctuations at the southern low and middle latitudes (15°S - 38°S), shown in Figures 10A, C. We also checked the flags of Swarm LP product, and the parameter “Flag-Te” is marked with a value of 20 during the Te fluctuations, indicating no abnormal behavior of Te data. However, we think such kind of Te fluctuations should not be related to natural geophysical structures, as the Te profile from CSES is quite smooth, especially considering their orbits are really close. Figure 9B shows also that there is no geophysical longitude dependence. In addition, we have further checked the Swarm orbits when such kind of Te fluctuations are observed and the parameter “Flag-Te” are also marked with a value of 20. When looking at the seasonal and latitudinal distributions of Ne/Te relation in Figures 6, 7, for both Swarm B and A, the scatter of Te mainly happens at low and middle latitudes during equinoxes and local winter, while they are almost absent during local summer.
As the scatter of Te mainly happens at the upper-middle latitudes, where is close to the subauroral ionosphere. At this region, the Te varies often in a quite wide range, as it can be fed by the heat conduction from the outer plasmasphere (Fok et al., 1991). Though we only considered the data during geomagnetically quiet condition (Kp < 3), shorter time-scale processes or disturbances in the solar wind and magnetosphere can trigger heat flow to the ionosphere. Another possible reason to alter Te variations could be the Subauroral Ion Drifts (SAID) driven by large polarization electric fields from the auroral oval towards lower latitude (Moffett et al., 1998). Further dedicated study is encouraged for resolving this feature in details.
Ne in the ionosphere is mainly produced by the solar EUV radiation, since the solar photons have significant energy to ionize the neutral atmosphere. Photoelectrons produce heat for the local electrons as well as remote electrons along the magnetic field line. Te is governed by the heating of photoelectron, cooling caused by collisions among ions and neutral species, and heat conduction in the ionosphere (e.g., Watanabe et al., 1995). In the topside ionosphere (above the F2 peak), the heat conduction becomes a dominant factor because of the reduced collision between charged particles and neutrals. Therefore, Te is not controlled by the local variation of Ne but rather by the integrated Ne along the magnetic field line below the F2 peak (Kakinami et al., 2011b). Above the magnetic equator, the plasma is transported upward by the E×B drift at the magnetic equator, so that the plasma for the EIA when diffusing poleward along the magnetic field line (e.g. Appleton, 1946). In addition, thermospheric winds also transport the plasma in the topside ionosphere upward/downward along the magnetic field line (Watanabe and Oyama, 1996; Kakinami et al., 2011b). Therefore, the positive dependence of Ne/Te at the EIA region is controlled mainly by the plasma dynamics. When the plasma is uplifted from below to the altitudes of interest, Ne increases, but Te is remains lower. When plasma is transported from higher altitudes, Te is higher while Ne is lower. In both cases the plasma transport results in negative Te/Ne dependence. The only case when we could expect a positive tendency is the uplifting of neutral gas along with the plasma. Then the photoionization will produce fresh photoelectrons which will heat the electron gas and increase Te.
In this study, we investigated the characteristic of the correlation between Ne and Te around 14:00 LT using observations from four satellites, CSES, Swarm B, Swarm A and CHAMP during very low solar activity years. The Seasonal and MLat dependence of the correlation between Ne and Te are also discussed in this work. In addition, we also analyzed the two branches of Ne/Te correlation from Swarm. The main results can be summarized as follows:
(1) Observations from the four satellites show generally consistent relation between the Ne and Te. A general negative relation is found between the Ne and Te at 14:00 LT from all four satellites, while the slope of the negative relation reduces and even becomes positive when the Ne becomes larger.
(2) The correlation of Ne and Te shows dependences on season and magnetic latitude, as the Ne and Te themselves are seasonal and MLat dependent. By considering the in situ measurements from four satellites at different latitudes, the relation between ionospheric topside Ne and Te seems to be dominated by the absolute value of Ne.
(3) Two prominent features of the Ne/Te relation observed by Swarm satellites are: a) when Ne is lower than 1×10¹¹ m−3, Te sometimes becomes very scatter at low and middle latitudes; b) when Ne is larger than 1×10¹¹ m−3, Te are grouped into two branches at equatorial and low latitudes. Detailed analysis reveals that the flags used in the Swarm Level-1B plasma density product cannot well distinguish the two abnormal features of Te, implying further efforts are needed for the Swarm Te data calibration.
The original contributions presented in the study are included in the article/Supplementary Materials, further inquiries can be directed to the corresponding authors.
RY, CX, ZZ, and XS contributed to conception and design of the study. RY, CX, and DL organized the database. KZ, LZ, and FL performed the statistical analysis. RY wrote the first draft of the manuscript. RY, CX, CL, and YG wrote sections of the manuscript. All authors contributed to manuscript revision, read, and approved the submitted version.
This work was supported by National Key R & D Program of China (Grant No. 2018YFC1503502-06), the Dragon five cooperation (Grant No. 59236), the Fundamental Research Funds for NINH (Grant No. ZDJ2019-22), the APSCO earthquake Project Phase II, the Stable-Support Scientific Project of CRIRP (Grant No. A132001W07) and ISSI-BJ project.
The authors declare that the research was conducted in the absence of any commercial or financial relationships that could be construed as a potential conflict of interest.
All claims expressed in this article are solely those of the authors and do not necessarily represent those of their affiliated organizations, or those of the publisher, the editors and the reviewers. Any product that may be evaluated in this article, or claim that may be made by its manufacturer, is not guaranteed or endorsed by the publisher.
CX acknowledges the support from the Special Fund of Hubei Luojia Laboratory (220100011). This work used the data from the CSES mission (http://www.leos.ac.cn), a project funded by China National Space Administration (CNSA) and China Earthquake Administration (CEA). We acknowledge further the teams of Swarm and CHAMP, for providing the data at https://diss.eo.esa.int and https://isdc.gfz-potsdam.de/champ-isdc/access-to-the-champ-data/.
Bailey, G. J., Su, Y. Z., and Oyama, K.-I. (2000). Yearly Variations in the Low-Latitude Topside Ionosphere. Ann. Geophys. 18, 789–798. doi:10.1007/s00585-000-0789-0
Bilitza, D. (1985). Implementation of the New Electron Temperature Model in IRI. Adv. Space Res. 5 (10), 117–121. doi:10.1016/0273-1177(85)90193-0
Bilitza, D. (1975). Models for the Relationship between Electron Density and Temperature in the Upper Ionosphere. J. Atmos. Terrestrial Phys. 37, 1219–1222. doi:10.1016/0021-9169(75)90193-2
Bilitza, D., Rawer, K., Bossy, L., and Gulyaeva, T. (1993). International Reference Ionosphere - Past, Present, and Future: II. Plasma Temperatures, Ion Composition and Ion Drift. Adv. Space Res. 13 (3), 15–23. doi:10.1016/0273-1177(93)90241-3
Brace, L. H., and Theis, R. F. (1978). An Empirical Model of the Interrelationship of Electron Temperature and Density in the Daytime Thermosphere at Solar Minimum. Geophys. Res. Lett. 5, 275–278. doi:10.1029/GL005i004p00275
Fok, M.-C., Kozyra, J. U., Warren, M. F., and Brace, L. H. (1991). Seasonal Variations in the Subauroral Electron Temperature Enhancement. J. Geophys. Res. 96 (A6), 9773–9780. doi:10.1029/91ja00791
Hargreaves, J. K. (1992). The Solar-Terrestrial Environment an Introduction to Geospace-The Science of the Terrestrial Upper Atmosphere, Ionosphere, and Magnetosphere. Cambridge, UK, and New York: Cambridge University Press.
Immel, T. J., Sagawa, E., England, S. L., Henderson, S. B., Hagan, M. E., Mende, S. B., et al. (2006). Control of Equatorial Ionospheric Morphology by Atmospheric Tides. Geophys. Res. Lett. 33, L15108. doi:10.1029/2006GL026161
Kakinami, Y., Kamogawa, M., Onishi, T., Mochizuki, K., Lebreton, J.-P., Watanabe, S., et al. (2013). Validation of Electron Density and Temperature Observed by DEMETER. Adv. Space Res. 52, 1267–1273. doi:10.1016/j.asr.2013.07.003
Kakinami, Y., Lin, C. H., Liu, J. Y., KamogawaWatanabe, M., Watanabe, S., and Parrot, M. (2011b). Daytime Longitudinal Structures of Electron Density and Temperature in the Topside Ionosphere Observed by the Hinotori and DEMETER Satellites. J. Geophys. Res. 116, A05316. doi:10.1029/2010JA015632
Kakinami, Y., Watanabe, S., Liu, J.-Y., and Balan, N. (2011a). Correlation between Electron Density and Temperature in the Topside Ionosphere. J. Geophys. Res. 116, a–n. doi:10.1029/2011JA016905
Kelley, M. C. (2009). The Earth’s Ionosphere, Plasma Physics and Electrodynamics. 2nd Edn. San Diego Calif: Academic.
Knudsen, D. J., Burchill, J. K., Buchert, S. C., Eriksson, A. I., Gill, R., Wahlund, J. E., et al. (2017). Thermal Ion Imagers and Langmuir Probes in the Swarm Electric Field Instruments. J. Geophys. Res. Space Phys. 122, 2655–2673. doi:10.1002/2016JA022571
Lei, J., Roble, R. G., Wang, W., Emery, B. A., and Zhang, S.-R. (2007). Electron Temperature Climatology at Millstone Hill and Arecibo. J. Geophys. Res. 112, a–n. doi:10.1029/2006JA012041
Liu, C., Guan, Y., Zheng, X., Zhang, A., Piero, D., and Sun, Y. (2018). The Technology of Space Plasma In-Situ Measurement on the China Seismo-Electromagnetic Satellite. Sci. China Technol. Sci. 62, 829–838. doi:10.1007/s11431-018-9345-8
Liu, J. Y., Chang, F. Y., Oyama, K. I., Kakinami, Y., Yeh, H. C., Yeh, T. L., et al. (2015). Topside Ionospheric Electron Temperature and Density along the Weddell Sea Latitude. J. Geophys. Res. Space Phys. 120, 609–614. doi:10.1002/2014ja020227
Lomidze, L., Knudsen, D. J., Burchill, J., Kouznetsov, A., and Buchert, S. C. (2018). Calibration and Validation of Swarm Plasma Densities and Electron Temperatures Using Ground-Based Radars and Satellite Radio Occultation Measurements. Radio Sci. 53, 15–36. doi:10.1002/2017rs006415
Lühr, H., Park, J., Gjerloev, J. W., Rauberg, J., Michaelis, J. M. G., and Brauer, P. (2015). Field-Alignedcurrents’ Scale Analysis Per-Formed With the Swarm Constellation. Geophys. Res. 42, 1–8. doi:10.1002/2014GL062453
Lühr, H., Rother, M., Häusler, K., Fejer, B., and Alken, P. (2012). Direct Comparison of Nonmigrating Tidal Signatures in the Electrojet, Vertical Plasma Drift and Equatorial Ionization Anomaly. J. Atmos. Solar-Terrestrial Phys. 75-76, 31–43. doi:10.1016/j.jastp.2011.07.009
McNamara, L. F., Cooke, D. L., Valladares, C. E., and Reinisch, B. W. (2007). Comparison of CHAMP and Digisonde Plasma Frequencies at Jicamarca, Peru. Radio Sci. 42, a–n. doi:10.1029/2006RS003491
Moffett, R. J., Ennis, A. E., Bailey, G. J., Heelis, R. A., and Brace, L. H. (1998). Electron Temperatures during Rapid Subauroral Ion Drift Events. Ann. Geophys. 16 (4), 450–459. doi:10.1007/s00585-998-0450-x
Palin, L., Opgenoorth, H., Buchert, S., Knudsen, D., Archer, W., Erickson, P., et al. (2015). Comparison of Plasma Density and Temperature by In-Situ Langmuir Probes and by Incoherent Scatter Radars, 26th IUGG General Assembly. Prague, Czech Republic.
Pedatella, N. M., Yue, X., and Schreiner, W. S. (2015). Comparison between GPS Radio Occultation Electron Densities and In Situ Satellite Observations. Radio Sci. 50, 518–525. doi:10.1002/2015rs005677
Reigber, C., Lühr, H., and Schwintzer, P. (2002). CHAMP mission Status. Adv. Space Res. 30, 129–134. doi:10.1016/s0273-1177(02)00276-4
Ren, Z., Wan, W., Liu, L., Zhao, B., Wei, Y., Yue, X., et al. (2008). Longitudinal Variations of Eletron Temperature and Total Ion Density in the sunset Equatorail Topside Ionosphere. Geophys. Res. Lett. 35, L15108. doi:10.1029/2007gl032998
Rother, M., Schlegel, K., Lühr, H., and Cooke, D. (2010). Validation of CHAMP Electron Temperature Measurements by Incoherent Scatter Radar Data. Radio Sci. 45, a–n. doi:10.1029/2010RS004445
Schunk, R. W., and Nagy, A. F. (1978). Electron Temperatures in theFregion of the Ionosphere: Theory and Observations. Rev. Geophys. 16, 355–399. doi:10.1029/RG016i003p00355
Shen, X. H., Zhang, X., Liu, J., Zhao, S. F., and Yuan, G. P. (2015). Analysis of the Enhanced Negative Correlation between Electron Density and Electron Temperature Related to Earthquakes. Ann. Geophys. 33, 471–479. doi:10.5194/angeo-33-471-2015
Shen, X. H., Zhang, X. M., Yuan, S. G., Wang, L. W., Cao, J. B., Huang, J. P., et al. (2018). The State-Of-The-Art of the China Seismo-Electromagnetic Satellite mission. Sci. China, Technol. Sci. 61, 634. doi:10.1007/s11431-018-9242-02018
Stolle, C., Liu, H., Truhlik, V., Luhr, H., and Richards, P. G. (2011). Solar Flux Variation of the Electron Temperature Morning Overshoot in the Equatorial F Region. J. Geophys. Res. 116, A04308. doi:10.1029/2020JA01623510.1029/2010ja016235
Su, F., Wang, W., Burns, A. G., Yue, X., and Zhu, F. (2015). The Correlation between Electron Temperature and Density in the Topside Ionosphere during 2006-2009. J. Geophys. Res. Space Phys. 120 (10), 724739–724810. doi:10.1002/2015JA021303
Wan, W., Xiong, J., Ren, Z., Liu, L., Zhang, M.-L., Ding, F., et al. (2010). Correlation between the Ionospheric WN4 Signature and the Upper Atmospheric DE3 Tide. J. Geophys. Res. 115, a–n. doi:10.1029/2010JA015527
Watanabe, S., Oyama, K.-I., and Abdu, M. A. (1995). Computer Simulation of Electron and Ion Densities and Temperatures in the equatorialFregion and Comparison with Hinotori Results. J. Geophys. Res. 100 (14), 14581–14590. doi:10.1029/95JA01356
Watanabe, S., and Oyama, K.-I. (1996). Effects of Neutral Wind on the Electron Temperature at a Height of 600 Km in the Low Latitude Region. Ann. Geophys. 14, 290–296. doi:10.1007/s00585-996-0290-5
Xiong, C., Lühr, H., and Ma, S. Y. (2013). The Magnitude and Inter-hemispheric Asymmetry of Equatorial Ionization Anomaly-Based on CHAMP and GRACE Observations. J. Atmos. Solar-Terrestrial Phys. 105-106, 160–169. doi:10.1016/j.jastp.2013.09.010
Xiong, C., Stolle, C., Lühr, H., Park, J., Fejer, B. G., and Kervalishvili, G. N. (2016a). Scale Analysis of Equatorial Plasma Irregularities Derived from Swarm Constellation. Earth, Planets and Space 68 (1). doi:10.1186/s40623-016-0502-5
Xiong, C., Zhou, Y. L., Lühr, H., and Ma, S. Y. (2016b). Diurnal Evolution of the F Region Electron Density Local Time Gradient at Low and Middle Latitudes Resolved by the Swarm Constellation. J. Geophys. Res. Space Phys. 121, 9075–9089. doi:10.1002/2016JA023034
Yan, R., Guan, Y., Miao, Y., Zhima, Z., Xiong, C., Zhu, X., et al. (2022). The Regular Features Recorded by the Langmuir Probe Onboard the Low Earth Polar Orbit Satellite CSES. J. Geophys. Res. Space Phys. 127, e2021JA029289. doi:10.1029/2021ja029289
Yan, R., Zhima, Z., Xiong, C., Shen, X., Huang, J., Guan, Y., et al. (2020). Comparison of Electron Density and Temperature from the CSES Satellite with Other Space‐Borne and Ground‐Based Observations. J. Geophys. Res. Space Phys. 125, e2019JA027747. doi:10.1029/2019JA027747
Yang, T. Y., Park, J., Kwak, Y. S., Oyama, K. I., Minow, J. I., and Lee, J. (2020). Morning Overshoot of Electron Temperature as Observed by the Swarm Constellation and the International Space Station. J. Geophys. Res. Space Phys. 125, e2019JA027299. doi:10.1029/2019JA027299
Yeh, K. C., Franke, S. J., Andreeva, E. S., and Kunitsyn, V. E. (2001). An Investigation of Motions of the Equatorial Anomaly Crest. Geophys. Res. Lett. 28 (24), 4517–4520. doi:10.1029/2001gl013897
Zhang, S.-R., and Holt, J. M. (2004). Ionospheric Plasma Temperatures during 1976-2001 over Millstone Hill. Adv. Space Res. 33, 963–969. doi:10.1016/j.asr.2003.07.012
Keywords: China seismo-electromagnetic satellite (CSES), electron density (Ne), electron temperature (Te), correlation of Ne and Te, abnormal features
Citation: Yan R, Xiong C, Zhima Z, Shen X, Liu D, Liu C, Guan Y, Zhu K, Zheng L and Lv F (2022) Correlation Between Ne and Te Around 14:00 LT in the Topside Ionosphere Observed by CSES, Swarm and CHAMP Satellites. Front. Earth Sci. 10:860234. doi: 10.3389/feart.2022.860234
Received: 22 January 2022; Accepted: 04 April 2022;
Published: 04 May 2022.
Edited by:
Stelios M. Potirakis, University of West Attica, GreeceReviewed by:
Ivan Kutiev, Bulgarian Academy of Sciences (BAS), BulgariaCopyright © 2022 Yan, Xiong, Zhima, Shen, Liu, Liu, Guan, Zhu, Zheng and Lv. This is an open-access article distributed under the terms of the Creative Commons Attribution License (CC BY). The use, distribution or reproduction in other forums is permitted, provided the original author(s) and the copyright owner(s) are credited and that the original publication in this journal is cited, in accordance with accepted academic practice. No use, distribution or reproduction is permitted which does not comply with these terms.
*Correspondence: Rui Yan, cnVpeWFuQG5pbmhtLmFjLmNu; Chao Xiong, eGlvbmdjaGFvQHdodS5lZHUuY24=
Disclaimer: All claims expressed in this article are solely those of the authors and do not necessarily represent those of their affiliated organizations, or those of the publisher, the editors and the reviewers. Any product that may be evaluated in this article or claim that may be made by its manufacturer is not guaranteed or endorsed by the publisher.
Research integrity at Frontiers

Learn more about the work of our research integrity team to safeguard the quality of each article we publish.