 Martin A. Harris
 James K. Russell
95% of researchers rate our articles as excellent or good
Learn more about the work of our research integrity team to safeguard the quality of each article we publish.
Find out more
ORIGINAL RESEARCH article
Front. Earth Sci. , 24 March 2022
Sec. Volcanology
Volume 10 - 2022 | https://doi.org/10.3389/feart.2022.859794
This article is part of the Research Topic From Magma Generation to Surface Processes in Monogenetic Volcanism View all 8 articles
Monogenetic volcanoes are characterized as having no temporal break in eruptive activity and are often assumed to have a simple (singular) magmatic plumbing system. However, recent studies on monogenetic systems have started to recover evidence of complexities within the magma-crustal dynamics. Here we investigate Cracked Mountain (CM), a 401 ± 38 ka glaciovolcanic basaltic landform in southwest, British Columbia, Canada. The volcano covers an area of ∼1.5 km2, has an eruptive volume of ∼0.18 km3, and comprises lapilli tuff, breccia, peperite, pillow and sheet lava, and dykes with no erosional surfaces present between the stratigraphic successions. The paleomagnetic signature of all volcanic lithofacies records a single-pole direction and, in conjunction with stratigraphic evidence, implies a monogenetic eruption. We establish that the Cracked Mountain volcano was fed by two separate crustally-stored magmas (i.e., polymagmatic), each characterized by a unique phenocryst assemblage indicative of different pre-eruptive storage conditions. The first mineral assemblage is an olivine-and-plagioclase phyric (OP) suite, and the second is an olivine-plagioclase-and-augite phyric (OPA) suite. The major-element geochemical compositions of the two petrographic suites vary slightly, with OPA samples higher in SiO2 and total-alkali contents than OP. The two magmas have similar rare earth (REE) trace element signatures, suggesting the same mantle source. We use thermodynamic modeling (Rhyolite-MELTS) to show that the OP suite derives from magma stored at depths <6 km (< 2 kbar) and temperatures of 1240–1155°C. In contrast, the OPA magmas crystallized at depths between 7–9 km (∼2–2.5 kbar) at 1,250–1,150°C prior to eruption. Both magmas are shown to be nearly “dry” having less than 0.5 H2O wt% in their respective systems. We use Pearce Element Ratios (PER) to show that the chemical variations within and between the two CM magmas are controlled solely by the crystal fractionation of two phenocryst assemblages that underwent syn-eruptive mixing. This study concludes that the polymagmatic plumbing system at Cracked Mountain shows similar complexities to other global investigations of monogenetic volcanoes. Lastly, we propose a causal link between the crustal dynamics of magma systems and the impact of crustal loading and unloading during cycles of glaciation.
Monogenetic volcanoes are present globally and they can be a result of, both, tectonic processes (i.e., convergent and divergent plate margins) or mantle plumes within intraplate settings (i.e., hot spots). The abundance and pervasive distribution of monogenetic volcanoes and their petrological properties make them useful probes for a wide range of “source to the surface” processes. Examples include informing on magma plumbing and feeder systems, eruption mechanics, volcanic hazards, surface processes, and landscape evolution (Kereszturi and Németh, 2012).
The Garibaldi Volcanic Belt (GVB) is the northern segment of the Cascade Volcanic Arc (Roddick and Souther, 1987; Green et al., 1988; Hildreth, 2007). GVB volcanic deposits range from Pleistocene to Holocene in age and result from subduction of the Juan de Fuca plate beneath the North American plate (Roddick and Souther, 1987; Green et al., 1988; Hildreth, 2007). Approximately 75% of GVB eruptive material is felsic (dacite and rhyodacite) (Hildreth, 2007). However, mafic vents (predominantly monogenetic) and flows are present on the peripheral margins of all five major GVB centres (e.g., Mount Baker, Glacier Peak, Mount Garibaldi, Mount Cayley, and Mount Meager) (Lawrence et al., 1984; Stasiuk and Russell, 1989; Green and Sinha, 2005; Hildreth, 2007).
One such occurrence of mafic volcanism is Cracked Mountain (CM); a ∼0.18 km3 basaltic, glaciovolcanic landform situated on the southern flank of the Mount Meager volcanic complex MMVC (Figure 1) (Wilson and Russell, 2018; Harris et al., 2022). The CM edifice was mapped and described by Read (1979, 1990) who assigned it, with other olivine-porphyritic basalts, to the Mosaic Assemblage. Wilson and Russell (2018), Harris et al. (2022) established that CM is built of predominantly subaqueous lithofacies within an alpine environment. The stratigraphic relations and paleomagnetic signatures of all lithofacies indicate the volcano erupted continuously (i.e., monogenetic), and the lack of any surrounding physical barriers (i.e., mountains or ridges) requires that the eruption took place within a shallow englacial lake enclosed by a mid-Pleistocene phase of the Cordilleran ice sheet (Harris et al., 2022). We use chemical and thermodynamic models to establish the pre-eruptive, pressure-temperature-H2O conditions for the two phenocrystic suites. Our models suggest the CM eruption tapped separate magma bodies stored at different crustal depths, thereby, informing on the ascent, transport, and storage of monogenetic systems in volcanic arcs. Lastly, we speculate on the role paleo-ice sheet dynamics (crustal loading and unloading) may have played on modulating eruptions from crustally-stored basaltic magmas in volcanic arcs.
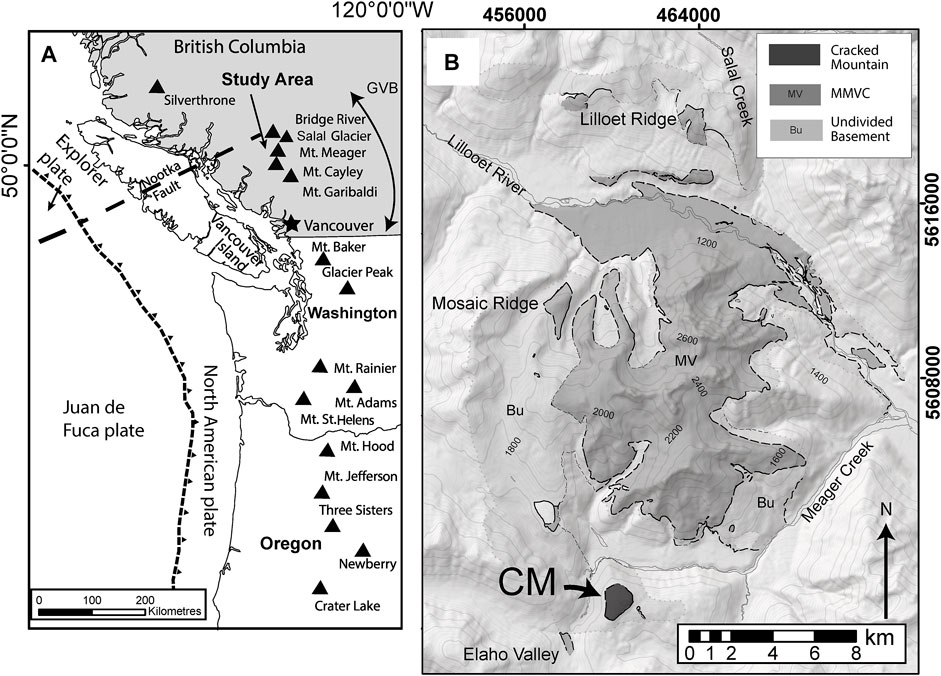
FIGURE 1. Geologic setting of Cracked Mountain volcano. (A) Map of the Cascade volcanic arc in the USA and Canada [i.e., Garibaldi volcanic belt (GVB)] (modified from Wilson and Russell, 2017; Harris et al., 2022). (B) Undivided geological map of Mount Meager volcanic complex showing the distribution of volcanic deposits (MV), basement (Bu) (Woodsworth, 1977; Read, 1979; Harris and Russell, 2021). Cracked Mountain (CM) is situated south of the main MMVC (Wilson and Russell, 2018; Harris and Russell, 2021). The map uses Universal Transverse Mercator Projection (UTM) zone 10U North American Datum 1983.
The Mount Meager volcanic complex is situated 160 km north of Vancouver in SW British Columbia (Figure 1) and is one of eight major volcanic centres or fields comprising the GVB (Figure 1A). Recent geochemical and petrological studies of GVB centres show increases in melt alkalinity and a decrease in slab-derived signatures moving northward in the GVB (Green and Sinha, 2005; Mullen and Weis, 2013). In particular, the MMVC, Salal Glacier volcanic complex, and Bridge River volcanic field (Figure 1A) show a heightened primitive signature compared to the more southern GVB and the High Cascade volcanoes. These findings suggest that the Nootka Fault, located Northwest of the Bridge River cones (Figure 1A), may mark the terminus of the Juan de Fuca subduction where a window between the Juan de Fuca and the Explorer plates allows upwelling of asthenospheric melts under the northernmost GVB centres (Green and Sinha, 2005; Mullen and Weis, 2013, 2015).
The MMVC contains Pleistocene to Holocene basalt to rhyolite overlying basement igneous and metamorphic rocks of the Coastal Plutonic complex (Figure 1B) (Woodsworth, 1977; Read, 1979; Green et al., 1988). The MMVC is also host to the youngest GVB eruptive deposits, namely the 2350 B.P. Pebble Creek formation (Clague et al., 1995; Hickson et al., 1999; Stewart et al., 2008). Intermediate to felsic lavas are dominant within the Mount Meager Massif; however, localized mafic centres are present in the north (Lillooet Ridge and River), west (Mosaic Ridge), and southwest (Cracked Mountain and Elaho Valley) regions of the volcanic complex (Read, 1979, 1990; Harris and Russell, 2021). The whole-rock, K-Ar ages of the Mosaic Ridge basalts and Elaho Valley basaltic andesites are ∼90 and 140 ka respectively (Woodsworth, 1977; Green et al., 1988).
Cracked Mountain has a 40Ar/39Ar age of 401 ± 38 ka. The paleomagnetic poles recorded by all volcanic lithofacies (including sets of cross-cutting dykes) based on 9 sample sites (57 cores in total) overlap to within experimental error (Harris et al., 2022). This indicates that the entire edifice was constructed over a very short time (i.e., a paleomagnetic moment, ∼1–5 ka; Turner, 1987; Barletta et al., 2010; Lisé-Pronovost et al., 2013), with no apparent break in time. Given that “a monogenetic volcano is one which erupts only once within a defined time period that is, recognized as being one in which there is no clear evidence of a temporal break in eruptive activity” (Smith and Németh, 2017), we assert that CM is a monogenetic volcano.
The volcanic edifice is comprised of massive to poorly stratified, moderately to pervasively palagonitized lapilli tuffs, coherent to disaggregated lobes of peperitic intrusions, stacked pillow lavas, sheet lavas, debris flow tuff breccias, and over 50 E-NE and W-NW trending subvertical dykes (Harris and Russell, 2021; Harris et al., 2022). Stratigraphically, the lapilli tuffs are the oldest, followed by peperitic intrusions, pillow lavas, sheet lavas, tuff breccias, and dykes. Subaqueous lithofacies (palagonitzed tephra, peperites, and pillows) requiring a substantial standing body of water are volumetrically dominant, and only minor (> 5%) remnant portions of the upper edifice comprise subaerial sheet lavas. Harris et al. (2022) argued for a glaciovolcanic origin (e.g., Kelman et al., 2002; Smellie, 2007; Edwards et al., 2009) wherein eruption within, and melting of, an ancestral Cordilleran ice sheet (CIS) created a syn-eruptive 250 m deep paleo-englacial lake (Wilson and Russell, 2018; Harris et al., 2022).
Cracked Mountain edifice was mapped at 1:7,000 scale, with detailed stratigraphic logs and lithofacies sampling done to characterize the entire eruptive sequence (e.g., Harris et al., 2022). Hand samples were catalogued in the field with mineral and textural descriptions. Each sample was given a unique identification code linked to their precise sample coordinates and elevation. Fresh, unaltered geologic samples were cut into 25 mm × 15 mm × 5 mm billets and sent out to Precision Petrographics Ltd., Langley British Columbia, Canada, for thin-section construction. Fifty grams of each volcanic sample was separated into clean, labeled containers, and sent to Acme Analytical Labs Ltd., Vancouver, BC, Canada, for powdering and whole-rock geochemical analyses.
Whole-rock major geochemical compositions were measured for 26 samples by Acme Analytical Labs Ltd., Vancouver, BC, Canada. X-ray fluorescence analyses were conducted with an ARL SMS-3500 Automated XRF using lithium borate fused discs. Trace element contents were measured by inductively coupled plasma-mass spectrometry on acid digested aliquots with an Agilent 7900 ICP-MS. Compositions of whole rocks and glass major element (wt%) compositions are reported in Table 1 and trace element contents (ppm) in Table 2; analytical uncertainties are based on replicate analyses performed by Acme Analytical Labs Ltd. Ferrous iron was measured directly for a subset of samples by volumetric analysis (i.e., titration) by ALS Canada Ltd., North Vancouver, BC, Canada. Supplementary Appendix SA contains six additional sample data and analytical uncertainties for whole-rock geochemistry conducted at the Peter Hooper Lab, Washington State University, USA. X-ray fluorescence analyses were conducted with a ThermoARL Advant’XP+ spectrometer using lithium tetraborate fused beads. Trace element contents were measured by inductively coupled plasma-mass spectrometry on acid digested aliquots with an Agilent 7700 ICP-MS.
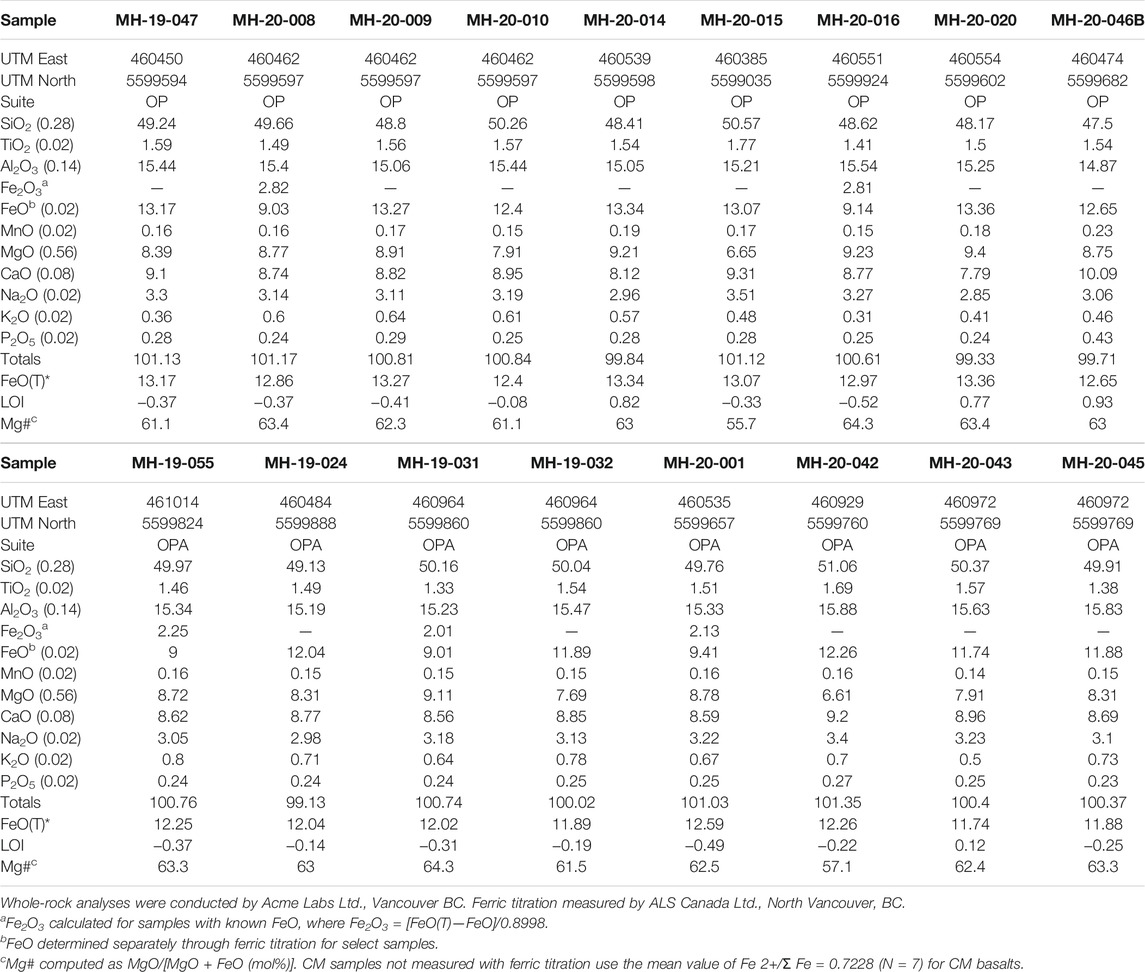
TABLE 1. Whole-rock major (wt%) element compositions of Cracked Mountain volcanic rocks analysed by X-ray fluorescence; analytical precision (2s) based on replicates (in brackets).
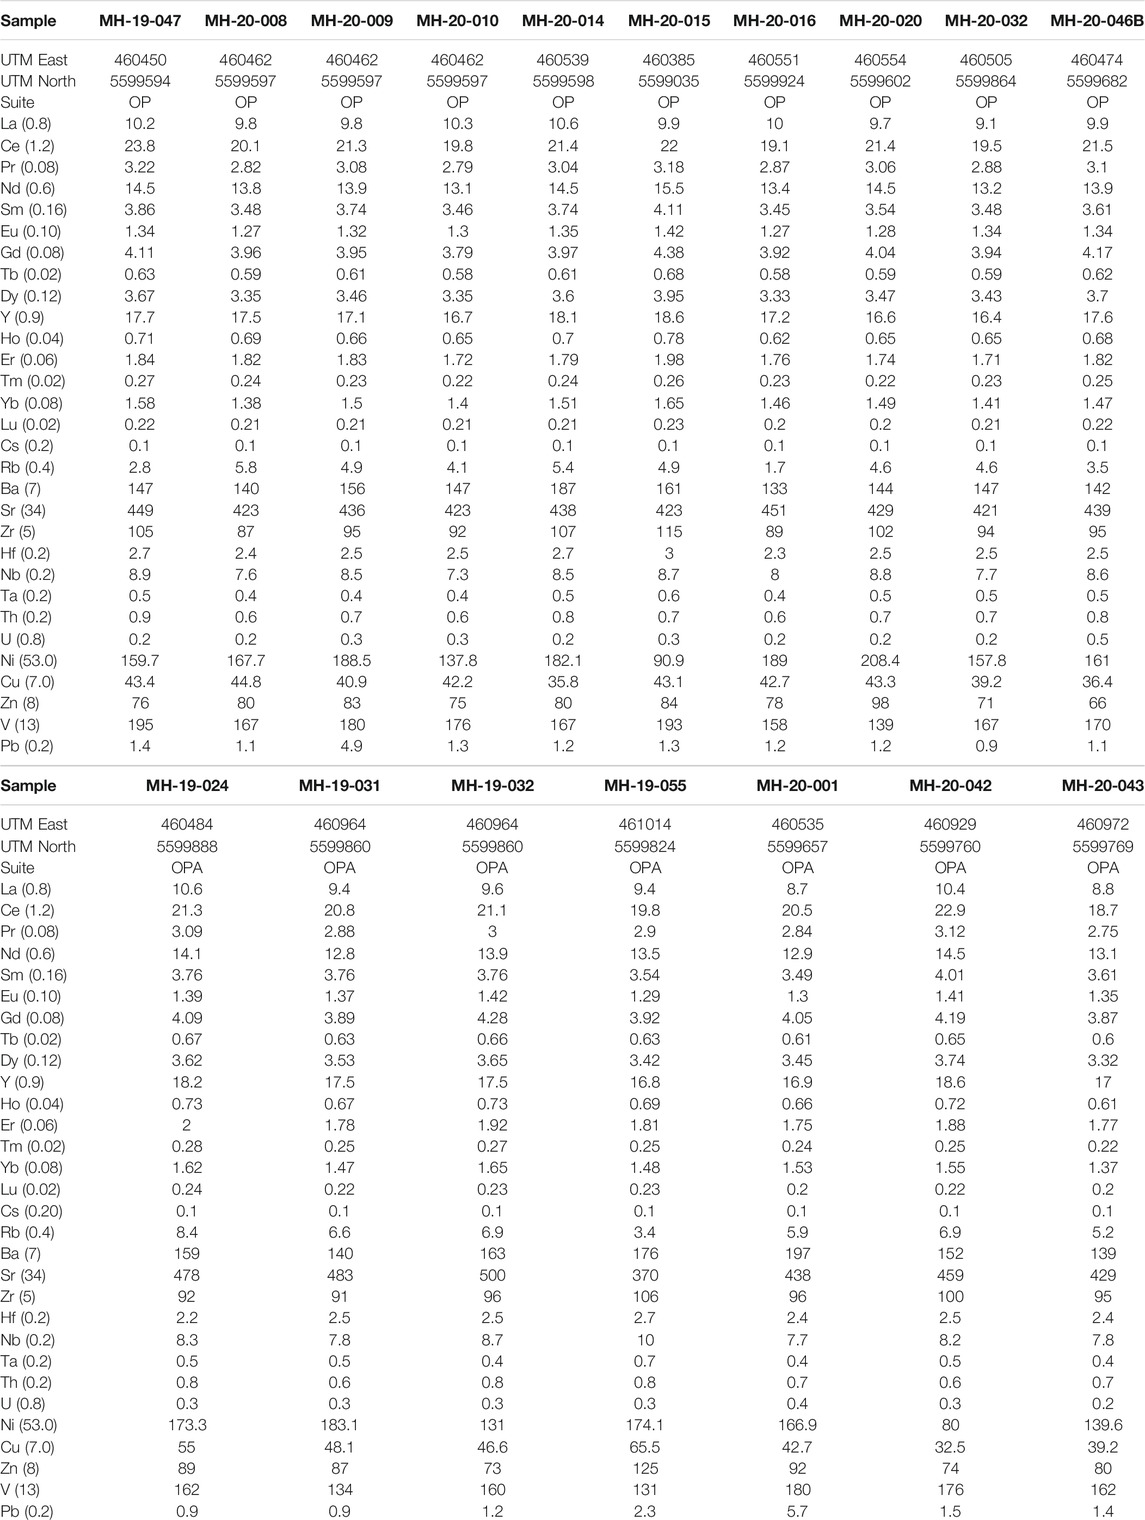
TABLE 2. Whole-rock rare earth and trace element (ppm) compositions of Cracked Mountain volcanic rocks analysed ICP-MS; analytical precision (2s) based on replicates (in brackets).
Major element concentrations of phenocryst and groundmass phases were determined with a Cameca Sx50 scanning electron microprobe (EMP) at the University of British Columbia, Vancouver, Canada. Polished thin sections were carbon-coated before analyses. EMP conditions include an acceleration voltage of 15 keV, a beam current of 20 nA, and a beam diameter of 30 µm. A full compilation of EMP mineral data is presented in Supplementary Appendix SB.
We used the thermodynamic model Rhyolite-MELTS _v1.0 (Gualda et al., 2012; Gualda and Ghiorso, 2015) to constrain the pre-eruptive storage depths of crystallization for CM magmas. Rhyolite-MELTS is a macro-enabled excel program that has been recalibrated to better capture the evolution of silicic systems while still maintaining the effective calibration for mafic and alkalic systems found in the original MELTS program (Gualda and Ghiorso, 2015). Additionally, Rhyolite-MELTS can be readily used with Windows operating systems. Similar petrochemical studies on the mafic occurrences of Mt. Etna (e.g., Giacomoni et al., 2021) and the Lillooet Glacier basalts of the GVB (e.g., Wilson and Russell, 2017) have also successfully implemented rhyolite-MELTS in their thermodynamic investigation of crustal storage conditions. The version of Rhyolite-MELTS we selected was based on our presumed magma systematics, as we are not dealing with high-pressure mantle melting (e.g., pMELTS) nor saturated quartz phases (e.g., Rhyolite-MELTS_v.1.1).
Compositions were normalized anhydrously and values were stored in a separate file for use in subsequent simulations. We used measured values of FeO and values of Fe2O3 calculated from total FeO to constrain oxygen fugacity (fO2) based on the models of Ghiorso and Sack (1995). These values of fO2 (ΔQFM 0.6-1.3) were then used for each sample simulation. For samples where FeO was not measured directly (i.e., ferric titration) total FeO was input into MELTS and the compute redox function was used to calculate FeO and Fe2O3, respectively. Samples without known FeO were modeled assuming fO2 was buffered at QFM.
Sixty-three isobaric crystallization simulations using Rhyolite-MELTS were performed on ten whole-rock compositions from Cracked Mountain. Each isobaric simulation ran from liquidus conditions (< 1,300°C) to a temperature where the system was ∼95% crystallized (∼950°C). The pressure range explored was from surface pressures (0.1 kbar) to 4 kbar (∼15 km depth) over increments of 0.5 kbar. Volatile content was also varied by changing the H2O wt% (0–1.5) in steps of 0.25%. The crystallization assemblage was manually restricted to olivine, plagioclase, and clinopyroxene to match the petrographic properties of CM rocks. The resulting outputs were then used to create mineral stability phase diagrams of the system at 10% crystallization. The value of 10% crystallinity was chosen based on petrographic inspection of the CM holocrystalline glomeroporphyritic clots (see below).
We utilize Pearce element ratios (PERs), first devised by Pearce (1968) to investigate the origin of chemical diversity in Cracked Mountain samples. The basis for PERs uses whole-rock oxide weight percentages, converted to stoichiometric ratios containing cations of crystallizing minerals normalized to a conserved element in a magmatic system (Pearce, 1968; Russell and Nicholls, 1988; Nicholls and Russell, 2016). The advantage of PERs is that you can produce geochemical plots that model mineral accumulation and loss (i.e., fractionation), and test petrologic hypotheses such as multiple magma sources, or magma contamination, without the distortions arising from closure (Pearce, 1968; Russell and Nicholls, 1988).
To effectively implement PERs, you must choose appropriate conserved elements for the denominator. In our case, we have used either titanium (Ti) or zirconium (Zr). Ti was chosen for plots involving major elements since it is effectively conserved during the early crystallization of most basaltic systems (Nicholls and Russell, 1991). We chose Zr as the conserved element for plots of trace elements because of its low analytical uncertainty (Nicholls and Russell, 2016).
Detailed mineral abundances were determined with standard polarizing light and scanning electron microscopy (Philips XL30) for all CM volcanic coherent lithofacies. The petrographic study of CM volcanic samples established two distinct groups 1) an olivine and plagioclase-phyric population (OP) (i.e., Figures 2A,C,E) and 2) olivine, plagioclase, and augite-phyric population (OPA) (i.e., Figures 2B,D,F). OP samples are texturally holo-to hypocrystalline, with glomeroporphyritic clots containing plagioclase (10–15%, 0.5–3 mm) and olivine (5–10%, 0.1–1 mm). OPA samples are texturally holo-to hypocrystalline, with glomeroporphyritic clots containing plagioclase (10–15%, 0.5–3 mm), olivine (10%, 0.1–1 mm), and augite (2–5%, 0.1–1 mm). The prevalence or lack of phenocrystic augite (< 3% volume) is the basis for our segregation. The OP phenocrystic suite includes pyroclasts separated from volcaniclastic deposits, pillow lavas, sheet lavas, and peperitic and non-peperitic intrusions. The OPA phenocryst suite is restricted to pillow lavas and late-stage dykes.
FIGURE 2. Photomicrographs of thin sections illustrating porphyritic textures of CM samples. All images are at 4x magnification with a black 2 mm scale. (A,C,E), display examples of the olivine-plagioclase phenocryst suite (i.e., OP), while (B,D,F) display examples of the olivine-plagioclase-augite porphyritic sample suite (i.e., OPA). Labels indicate volcanic lithofacies.
Olivine phenocrysts are subhedral and weakly zoned (see below). Plagioclase phenocrysts are tabular-shaped and petrographic study shows moderate zoning under cross-polarized light; a minor percentage (< 5%) are sieve textured. When present, augite crystals in glomerocrysts are subhedral (Figures 2B,D) and in rare cases, individual augite crystals have rounded edges suggesting partial resorption (Figure 2E).
Figure 3A illustrates the chemical diversity of CM samples after Le Bas et al., 1986 classification of volcanic rocks. All CM samples are subalkaline basalts (Irvine and Baragar, 1971) and display moderate spread in SiO2 (∼47–51 wt%) and Na2O-K2O (∼3–4 wt%). CM OP samples are predominantly lower in SiO2 wt% and Na2O-K2O wt% than OPA samples. All samples are hypersthene normative, although all samples lack Ca-poor pyroxenes (Figure 4C).
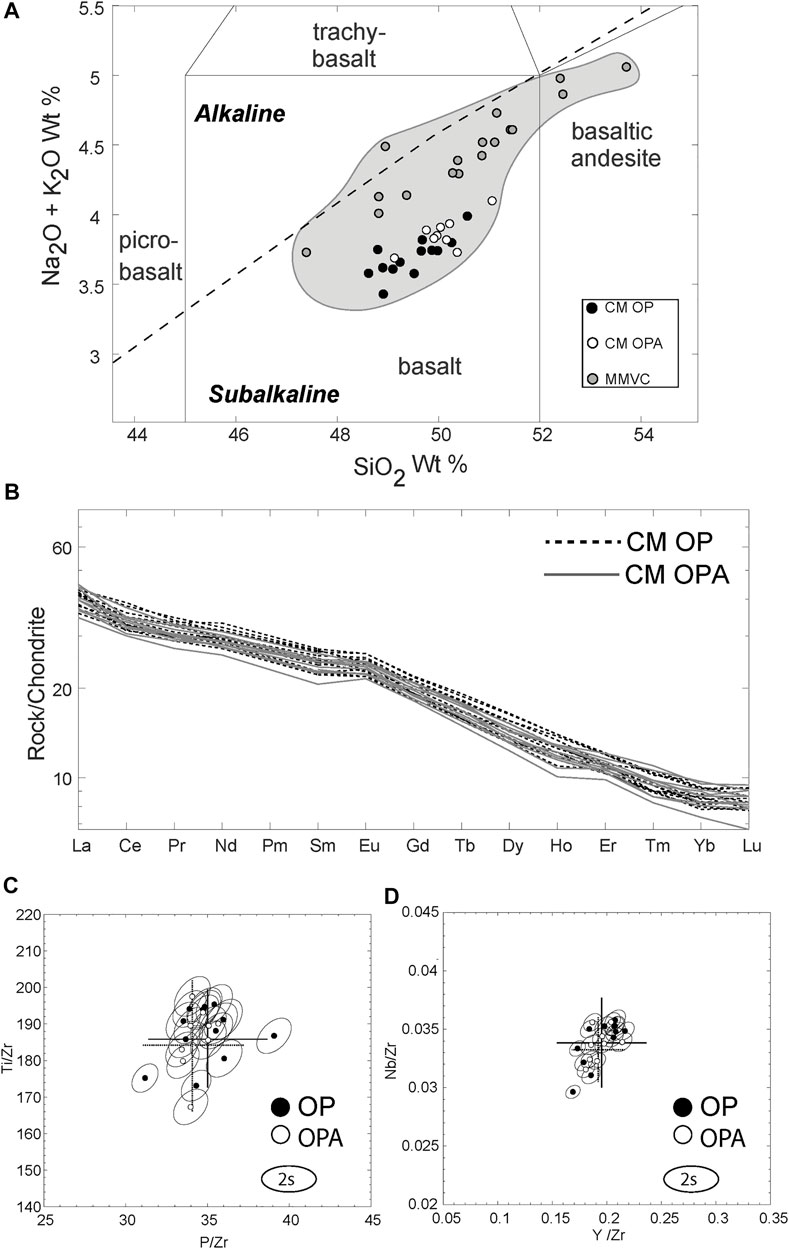
FIGURE 3. Major and trace element compositions of whole-rock samples from Cracked Mountain. OP samples are in black, OPA samples are shown in white. Reference MMVC mafic data is shown in grey (Harris and Russell, 2021). (A) Total alkali (Na2O + K2O) vs. Silica (SiO2) wt% (TAS) with the classification of Le Bas et al. (1986), Irvine and Baragar (1971). (B) Rare Earth Trace Element (REE) compositions of Cracked Mountain volcanic deposits, normalized to a Chondrite after Sun and McDonough (1989). (C) Incompatible element ratios (Ti/Zr vs. P/Zr) showing no significant variation between two phenocryst suites (i.e., OP and OPA). Ellipses denote 2σ uncertainty for each data point. Also shown is the 2-standard-deviation on the mean for each suite (dashed and solid bars respectively). (D) Trace incompatible element ratios (Nb/Zr vs. Y/Zr) showing no significant variation between two phenocryst suites (i.e., OP and OPA). Same symbology as in 3C.
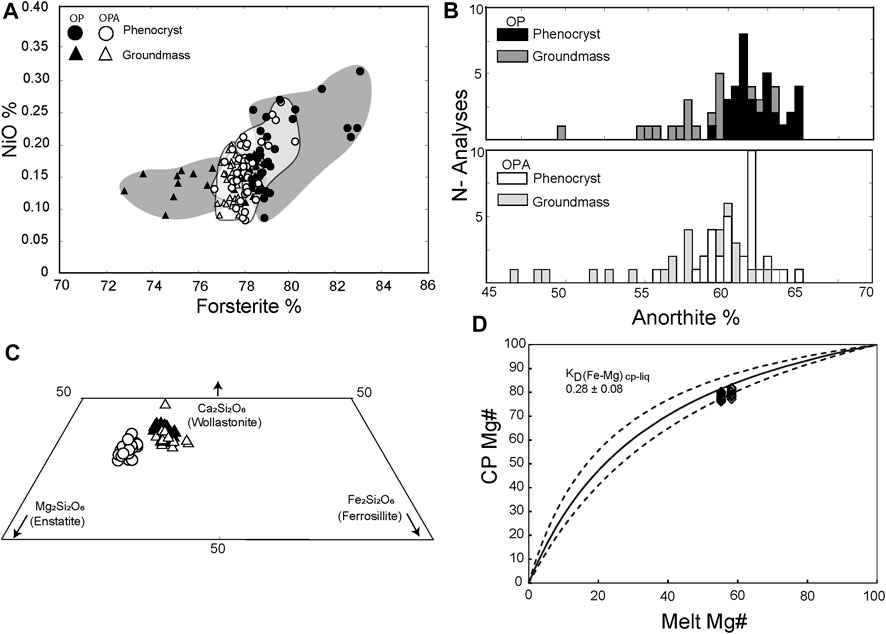
FIGURE 4. Electron microprobe analyses of CM mineral compositions. OP phenocryst phases are shown in black (circles) and groundmass phases in black (triangles). OPA phenocryst phases are shown in white (circles) and groundmass phases in white (triangles). (A) Olivine forsterite compositions (Fo%) versus NiO wt% for OP and OPA phenocryst and groundmass phases. (B) Plagioclase Anorthite (An%) compositions for OP and OPA samples. The frequency of An% is shown on the vertical axis of the bar charts. (C) Clinopyroxene classifications (after Morimoto, 1988) for OPA phenocrysts and OP and OPA groundmass phases. OPA phenocrysts are all high-Ca augite, and both OPA and OP groundmass phases plot along the augite-diopside boundary. (D) Equilibrium constants (KD) calculated from Putirka (2008) for OPA clinopyroxene and plotted against the predicted range for crystals formed under equilibrium conditions (0.28). Dashed lines indicate the 2s uncertainty on the mean KD value (i.e., ± 0.08).
CM rare earth elements (REE) are normalized to a Chondrite (Sun and McDonough, 1989) and shown in Figure 3B. All CM samples (e.g., OP, OPA) show similar anomalies. Little variations in trace element concentrations are observed between samples, suggesting a similar mantle source for all CM eruptive deposits.
Furthermore, Figures 3C,D shows incompatible element ratio diagrams for minor elements (i.e., titanium and phosphorus) and trace elements [i.e., niobium (Nb) and yttrium (Y)] normalized to zirconium (Zr). In both plots, all CM samples (i.e., OP and OPA) overlap within 2σ of the mean of each respective data set (dashed and solid bars). These results correlate with the trends seen within the normalized REE diagram (Figure 3B) and indicate that all samples from CM likely originated from a single mantle melt.
Forsterite contents (Fo%) of olivine phenocryst and groundmass olivine are plotted vs. NiO in Figure 4A. OP phenocrysts have higher forsterite (Fo79-83) and NiO contents (0.1–0.32%) than OPA phenocrysts (Fo77-80 and 0.1–0.26% respectively). Olivine groundmass phases for OP samples range from Fo73-79 while OPA has a tighter spread of Fo77-78. Both OP and OPA groundmass olivine have lower NiO% than the phenocryst phases (0.1–0.2%).
Anorthite contents (An%) of plagioclase phenocryst and groundmass plagioclase are displayed in Figure 4B. Both OP and OPA phenocrysts overlap in anorthite content (OP: An60-65) (OPA: An56-65). Similarly, OP and OPA groundmass phases overlap in anorthite ranges (OP: An49-63) (OPA: An47-62).
Clinopyroxene phenocryst and groundmass phase compositions (after Morimoto, 1988) are Ca-rich (Figure 4C). The OPA phenocrysts are chromian augite (i.e., Cr3+ > 0.01 cation) while groundmass phases in both OP and OPA samples are aluminian augite (i.e., Al3+ > 0.1 cation) (Morimoto, 1988). We also tested whether the clinopyroxene phenocryst compositions were compatible with crystallization from their host basaltic magmas (i.e., versus a xenocrystic origin) using the equilibrium model of Putirka (2008). We adopted his range of equilibrium constant values (KD = 0.28 ± 0.08) for Fe-Mg partitioning between clinopyroxene and the melt (i.e., samples 19-045; 15-168). Based on the model KD values the augite compositions (see Supplementary Appendix Table SB1 for microprobe analyses) are consistent with crystallization from melt compositions roughly approximated by the bulk rock compositions (Figure 4D) reflecting the low modal abundance of phenocrysts.
Lastly, none of the three phenocryst types (e.g., olivine, plagioclase, and augite) show strong chemical zonation nor is there evidence for pronounced discontinuities between the core phenocryst compositions and their rims. In contrast, the compositions of the phenocryst rims partially overlap the range of core compositions (Figure 4; Supplementary Appendix Table SB1) suggesting stable, near-equilibrium crystallization conditions prior to eruption. The overall trends in mineral compositions between the two Cracked Mountain phenocryst suites are that OP phenocrysts are slightly elevated in Fo% and An% when compared to OPA phenocrysts. This difference in mineral chemistry and phenocryst assemblage (i.e., +/− augite) suggests disparate fractionation dynamics for the two respective mineral systems (OP and OPA). This topic is explored in detail throughout the discussion below.
Phenocryst assemblages in volcanic rocks can provide critical quantitative information on pre-eruptive temperatures, H2O contents, and pressures (i.e., depth) of magmas. Different minerals (i.e., olivine, plagioclase, and pyroxene) are stable at different P-T conditions (Gualda and Ghiorso, 2015). Thermodynamic models, in conjunction with the knowledge of true phenocryst proportions and estimates of magma composition, can uniquely constrain these conditions in the magma chamber before the eruption.
Our modeling presumes equilibrium magma chamber conditions which are strongly supported by the following evidence. Firstly, glomeroporphyritic clots are observed to be 10% or less in modal abundance in all CM samples. Texturally, these clots display minerals locked together, indicating cognate growth of all phases present (i.e., olivine and plagioclase or olivine with plagioclase and augite; Figure 2). Secondly, the weak normal, chemical zoning recorded by the phenocrysts is consistent with a static closed magma system. Lastly, the phenocryst phase that distinguishes the two suites (i.e., augite) has compositions that are entirely consistent with equilibrium crystallization (Figure 4D) and a cognate origin. This is in contrast to many other basaltic systems (cf. Coote and Shane, 2018; Coote et al., 2018, 2019) where the crystal cargo is at least partially antecrystic or xenocrystic in origin. In summary, we assume the glomerocrysts originated during static, pre-eruptive magma crystallization (e.g., within the magma chamber) while smaller, isolated (micro-) phenocrysts are less constrained in origin and could result from cooling during ascent, or syn/post-eruptive cooling.
In the case of the OP samples (Figures 5A,B), the stable phases for only olivine and plagioclase crystallization range from <2 to 0 kbar (∼5.5–0 km depth), and 0–1.5% H20 wt% (see dashed fields). For OPA samples, (Figures 5C,D), the stability fields for olivine, plagioclase, and clinopyroxenes are restricted to pressures between 2.5 and 1 kbar (∼10–4 km depth), and 0–1% H2O wt% (see dashed fields).

FIGURE 5. Phase portraits for CM volcanic samples, displaying mineral stability fields as a function of pressure and H2O (wt%) resulting from crystallization simulations using Rhyolite-MELTS (Gualda and Ghiorso, 2015). Individual simulations were run at isobaric conditions ranging from 4 to 0 kbar. At each pressure interval, simulations were modeled with varying H2O wt%, ranging from 0.1 to 1.5% (A,B) Phase portraits for two OP samples (20-008 and 20-016); (C,D) Phase portraits for two OPA samples (15-168 and 19-031). Dashed fields show stable mineral fields for OP and OPA samples respectively. Conditions at which water became an exsolved phase are indicated in each plot (blue shaded field).
Thermodynamic modeling places constraints on the pre-eruptive history of the two suites of volcanic rocks comprising Cracked Mountain. Here we use the major and trace element chemistry to constrain the differentiation processes that have generated moderate variations in SiO2 content and the differences in mineral chemistry. Our approach is to use the whole rock chemistries to constrain the nature of magmatic differentiation through the use of Pearce element ratios (PER).
Assemblage test diagrams (Stanley and Russell, 1989) for crystal sorting of olivine alone are shown in Figures 6A,B. If olivine fractionation was responsible for the observed chemical variation seen in CM samples, then the data would fall along the model line with a slope of 1. A comparison of the data to the model line allows us to reject these hypotheses for both OP and OPA suites. The data plot above the model line, indicating that SiO2 decreases more than the prescribed stoichiometric MgO + FeO in a single-phase olivine fractionation system.
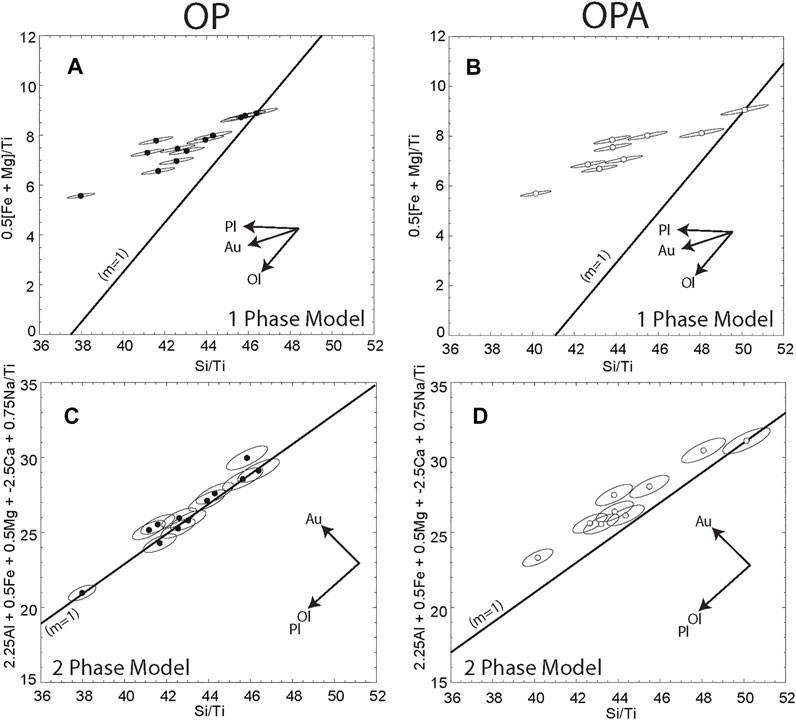
FIGURE 6. Chemical variations for Cracked Mountain samples illustrated with Pearce Element Ratio (PERs) assemblage test diagrams (Stanley and Russell, 1989). Symbols include OP suite (black circles) and OPA suite (white circles). Ellipses denote 2s analytical uncertainty for each data point. In each plot, a model line with a slope of 1 is projected through the data set’s most primitive point. Mineral response vectors are shown for olivine (Ol), plagioclase (Pl), and Augite (Au) (A) Single-phase (olivine) assemblage test for OP and (B) OPA samples, respectively. Both suites fall off the model line and therefore chemical variations cannot be explained by the crystal sorting of olivine alone (C) Two-phase (olivine-plagioclase) assemblage test for CM OP samples. Nearly all samples fall within 2s uncertainty of the model line, indicating the chemical variation within OP samples can be attributed to the crystal sorting of olivine and plagioclase. (D) Same assemblage test as shown in plot C, now with CM OPA samples. Here the OPA samples fall above the model line, indicating the chemical variation cannot be explained by crystal sorting of olivine and plagioclase alone.
A two-phase assemblage test for crystal sorting of olivine and plagioclase is shown in Figures 6C,D. In this case, nearly all OP samples fall within 2σ of the model slope line (Figure 6C) while the OPA samples fall slightly above the model slope line (Figure 6D). These models indicate that for the samples containing olivine and plagioclase only (i.e., OP), the observed chemical variations can be closely attributed to the crystal fractionation of the two-mineral system. However, the samples containing augite (i.e., OPA) reject the two-phase hypothesis as the data do not fall within the uncertainty of the model line and plot systematically above the model line. This suggests SiO2 decreases greater than the prescribed stoichiometric CaO + Na2O and MgO + FeO for the two-phase plagioclase and olivine fractionation system.
Finally, a combined three-phase assemblage test for crystal sorting of olivine, plagioclase, and augite, is shown in Figure 7. In this diagram, two model lines are drawn through the most primitive sample of each respective phenocryst assemblage, and the results show that all CM data fall within the upper (OP) and lower (OPA) limits of self-mixing (e.g., Russell and Stanley, 1990). These findings show that the CM samples preserve signatures of two discrete fractionation systems but reflect a degree of internal mixing. The differences in equilibrium pressures in the two mineral systems (e.g., Figure 5) suggest mixing of the two systems attended ascent and eruption (e.g., Perugini et al., 2015).
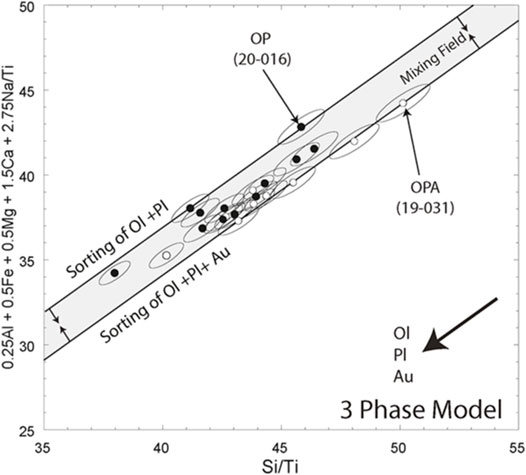
FIGURE 7. Assemblage test diagram for the phenocryst assemblage of olivine + plagioclase + clinopyroxene (the same symbols as in Figure 6). A model line with a slope of 1 is projected through each data set’s most primitive point. Here the most primitive samples of each assemblage suite (20-016, OP) (19-031, OPA) define upper and lower trend boundaries where all other CM samples fall between. The trend in data suggests sorting of phenocrysts combined with syn-eruptive mixing (field shown in grey) between the two distinct petrographic suites.
The results from the thermodynamic models of stable mineral phases allowed for a wide range of possible H2O contents, particularly in stable olivine-plagioclase crystallization conditions (e.g., Figure 5). Through combined methods of PERs and MELTS simulations, we can further constrain the temperatures at which pre-eruptive crystallization would have occurred and bracket the maximum amount of water (H2O wt%) in the system at the time of crystallization. Figure 8 shows chemical plots with axes designed for PERs as seen in Figures 6, 7. Major element oxide data were extracted from the outputs of MELTS simulations for the two most primitive samples in each petrographic suite (20-016 and 19-031) at varying water contents (0.1–1 H2O wt%) and transposed onto the PERs as dashed vectors. Figures 8A–D show that the chemical trends for both OP and OPA samples mimic that of a system modeled with ≤0.5 H2O wt%. Furthermore, the simulations for the two respective primitive samples containing 0.5 H2O wt% are labeled for temperature (°C). These labels illustrate the range of magmatic temperatures for each phenocryst suite; all OP samples fit within the temperature interval ∼1,240–1,155°C whereas the OPA samples fit within the interval 1,250–1,150°C (Figure 8E). A summary of predicted mineral saturation temperatures for representative CM compositions is given in Table 3.
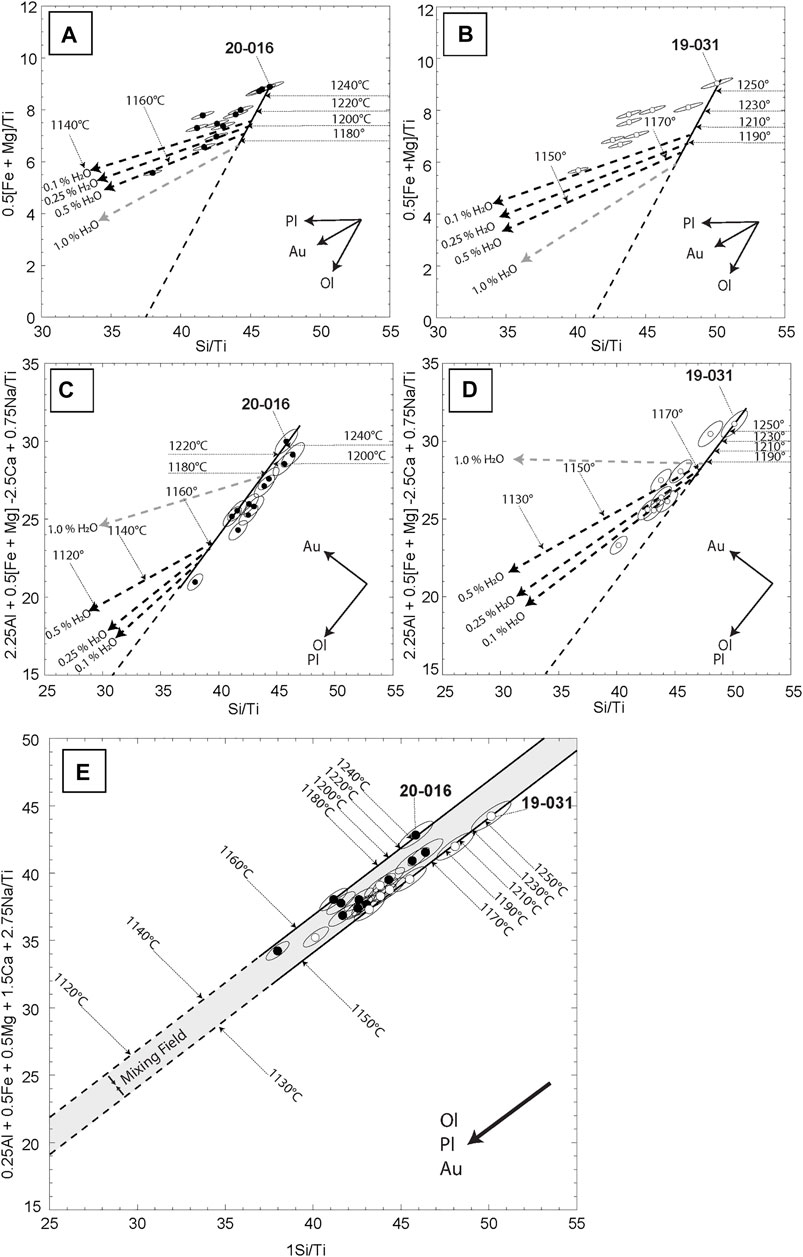
FIGURE 8. Thermodynamic conditions for magmatic differentiation at CM illustrated with PERs and modeled with Rhyolite-MELTS (same symbology as in Figures 6, 7). Sample 20-016 was chosen as a proxy for OP samples and MELT simulations were run at 1.5 kbar from 1 to 0.1% H2O. Sample 19-031 was chosen as a proxy for OPA samples, and MELT simulations were run at 2 kbar from 1 to 0.1% H2O. Diagrams are formatted as PERs, with axes designed to test for sorting processes involving olivine (Ol) (A,B), Ol and plagioclase (Pl) (C,D), and Ol and Pl and augite (Au) (E). Liquidus lines of ascent are shown for various H2O% conditions plotted at 20°C intervals. Models run at 0.5% H2O have temperature intervals labeled in the PER space. Simulations indicate that for both phenocryst assemblages (i.e., OP and OPA) less than 0.5% H2O is required to follow the cotectic (inflection-points) trends of fractional crystallization modeled by the PERs.
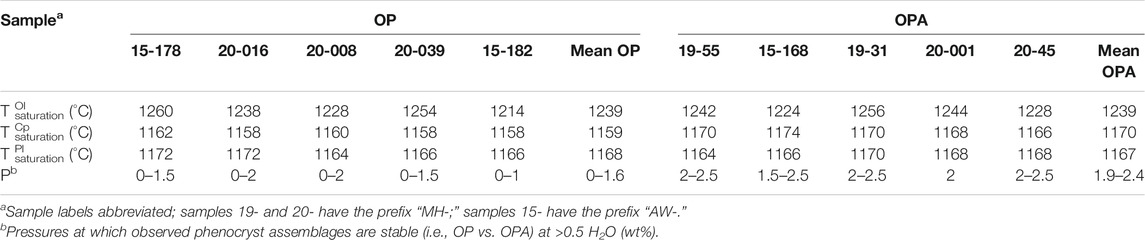
TABLE 3. Results of thermodynamic modelling of mineral saturation conditions for Cracked Mountain magma suites, including olivine (Ol), clinopyroxene (Cp), and plagioclase (Pl) mineral saturation temperatures and maximum pressure limits based on simulations with Rhyolite_MELTS.
Given these findings, both OP and OPA samples crystallized in a nearly “dry” system with less than 0.5 H2O wt%. Higher water (wt%) is shown to suppress the crystallization of plagioclase in favour of olivine and olivine with clinopyroxene at higher pressures (e.g., Figure 5). Only with low water contents (∼0.5%), are we able to simulate the plagioclase fractionation coinciding with olivine, or olivine with clinopyroxene in the OP and OPA samples respectively. These findings differ from the typical subduction-related basaltic water content. The global average (H2O%) for volcanic arcs is 3.9% and 3.2% for the Cascade arc (Wallace et al., 2015). However, recent studies within the Garibaldi belt (GVB) have shown evidence of low-water basalts, with some melt inclusions containing as little as 0.1% H2O (Venugopal et al., 2020), further supporting our findings of “dry” magmas at Cracked Mountain.
These model constraints on magmatic water content further restrict the optimal storage pressure conditions for the two rock suites (i.e., OP vs. OPA; Figure 5). The OP samples must have been stored at pressures ≤2 kbar, with a mean upper pressure of 1.6 kbar (N = 5) (Figure 5; Table 3). The OPA samples are restricted to pressures 1.5 ≥ 2.5 kbar, with the mean conditions falling within 1.9 ≥ 2.4 kbar (N = 5) (Figure 5; Table 3).
Based on our multifaceted petrochemical investigation, we propose the following model for the magma bodies that fed the eruption and growth of the Cracked Mountain volcano (e.g., Figure 9):
• A common mantle melt, as evidenced by identical REE signatures, ascended from the lower crust and either had very low initial H2O content or became dehydrated (∼dry melt). The magma lacks a conventional arc-like chemical signature (i.e., trace element composition and low volatile content) but mirrors other mafic magmas in the northern GVB which show limited subducted slab input (Mullen and Weis, 2013, 2015; Mullen et al., 2017; Venugopal et al., 2020). The single melt source is further attested to by the indistinguishable conserved major and trace (REE) element signatures of all CM samples (e.g., Figures 3B–D), while the “dehydrated conditions” are supported through the modelled chemical trends observed in Figure 8.
• As pulses of magma reached the upper crust, it segregated, stalling at two discrete depths corresponding to pressures that resulted in two unique phenocryst assemblages (i.e., OP and OPA). These textural differences are irrefutable under petrographic inspection (Figure 2) and strongly indicate crystallization at different pressures (i.e., depth) (Figure 5). Through repeated thermodynamic simulations we show that the OPA magmas were restricted to storage depths of ∼7–9 km within the upper crust, while OP magmas crystallized at depths likely 6 km or less in the upper crust (Figures 5, 9).
• The two suites (OP and OPA) have compositions that indicate a small but significant amount of differentiation is tied to their respective phenocryst assemblages (Figure 6) and that mixing processes likely occurred during ascent-related transport and eruption. We find evidence of these mixing signatures in the major element chemical models (PERs) that define a field that encompasses all CM samples and their fractionation trends (Figure 7). Additionally, some augite phenocrysts are slightly corroded with rounded rims, suggesting disequilibrium resorption reactions (e.g., Figure 2F). These findings imply that the time of mixing was very closely related to the eruption time. Lastly, although shown to be stable at different crustal depths, the OP and OPA magmas were probably stored close together and stacked vertically given that they both erupted at the same location (i.e., area of 1.5 km2) to build a single edifice. Given a near synchronous eruption of the two systems, it is improbable that the two magma did not come in contact with one another during ascent and eruption (Perugini et al., 2015).
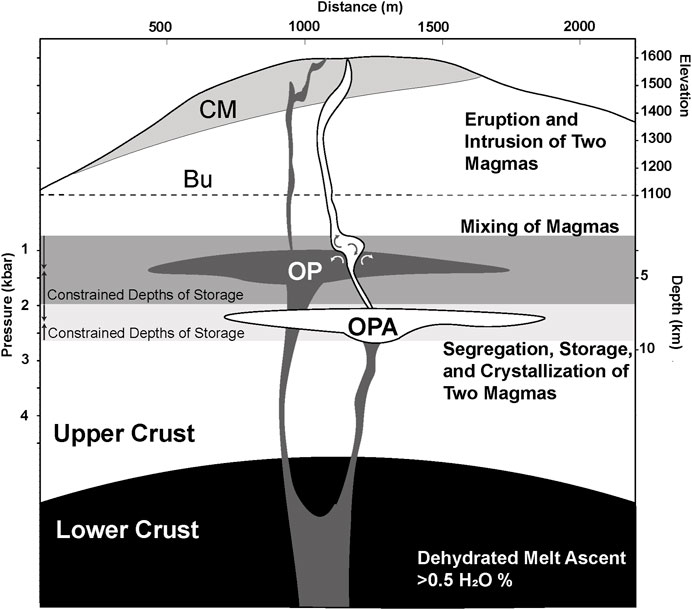
FIGURE 9. Schematic depiction of crustal storage conditions for the CM volcano. The volcanic profile above the dashed line is shown with no vertical exaggeration (VE). Regions below the dashed line are not shown to scale. Results of chemical and thermodynamic models indicate dry melts (> 0.5 H2O%) ascended into the upper crust, where two batches segregated and crystalized different pressure conditions (i.e., depth). The OPA batch (white) crystalized at ∼2 kbar while the OP batch (dark grey) was at <1.5 kbar. Mixing of the two magmas is depicted as the lower OPA erupted concurrently with OP during the monogenetic eruption of CM.
The two magmas erupted concurrently in geologic time (monogenetic) producing a small basaltic edifice with two unique phenocryst assemblages (i.e., OP and OPA). The evidence of short-lived and coeval timing for the two magmas is supported by the field evidence which shows no break-in time in volcanic stratigraphy and is bolstered by the paleomagnetic signatures of all deposits overlapping within one magnetic moment (Harris and Russell, 2021; Harris et al., 2022).
Monogenetic volcanoes are found globally within all major tectonic environments. These short-lived eruptive centres have garnered increasing interest, in part, due to their threat as natural hazards (Smith and Németh, 2017). A variety of methods have been used in support of their study, including seismic tomography, geochemistry, petrography, and experimental and numerical modeling. These studies have elucidated greater complexity in their magmatic underpinning that belies their apparent single eruptive histories.
The best line of evidence for understanding the past CM volcanic plumbing comes from our petrographic observations in conjunction with geochemical measurements. Our findings of two unique petrographic suites (i.e., OP and OPA) guide our subsequent chemical and thermodynamic models that we use to constrain the pre-eruptive crystallization conditions. These results require that magmas were stored in two discrete pressure fields (i.e., crustal depths) to erupt materials containing two unique mineral assemblages, indicating tapping of a poly-chamber system during the eruption of the CM volcano. Our schematic interpretation of the shape and interconnectivity of the OP and OPA magmas (e.g., Figure 9) is supported by a diverse range of other studies of monogenetic eruptions.
The presence of polymagmatic crustal magma chambers beneath active monogenetic systems has been shown seismically for volcanoes in Kamchatka, Russia (Kugaenko and Volynets, 2019), Jeju, Korea (Song et al., 2018), and Grímsvötn, Iceland (Reverso et al., 2014). Additionally, geochemical variations in erupted materials in Jeju, Korea (Brenna et al., 2011), Mt. Gambier, Australia (Van Otterloo et al., 2014), and Bahariya, Egypt (Khalaf and Sano, 2020) have led to speculation that these small-volume monogenetic volcanoes were connected to polymagmatic systems. The Icelandic Eyjafjallajökull (2010) eruption is another example of a heavily studied volcano that displayed polymagmatic activity, with an initial flank eruption fed by a deep-seated mafic magma followed by a summit eruption fed from a shallowly stored silicic magma (Keiding and Sigmarsson, 2012). Even within the mafic magmas at Eyjafjallajökull (2010), binary chemical signatures are recovered from melt inclusions (e.g., Moune et al., 2012), suggesting a mixing of two end-member sources and further highlighting the complexities of magmatic plumbing systems.
Furthermore, real-time seismic monitoring of the volcanic activity beneath the Eyjafjallajökull (2010) eruption suggested that the observed subsurface deformation was due to “hydrostatic” interconnectivity of vertically separated sills (Sigmundsson et al., 2010). Field-based studies of eroded volcanic regions in the McMurdo Dry valleys of Antarctica have also revealed networks of interconnected high-aspect-ratio sills (Marsh, 2004), further supporting our geometric depiction of the magma chamber dynamics beneath Cracked Mountain volcano in Figure 9.
Similar petrochemical methods to those used here have been conducted at other monogenetic volcanoes in Undirhlíðar (Iceland), Kaikohe-Bay of Islands (New Zealand), and Ma’anshan (China), and have provided insight into magma chamber dynamics (Pollock et al., 2014; Coote et al., 2018, 2019; Coote and Shane, 2018; Liu et al., 2021). Forensic studies of monogenetic basaltic volcanoes relying solely on chemical signatures may lack the capacity to recover the specifics concerning crustal magma storage conditions. As Annen et al. (2006) suggest, the chemical signature of magma is dictated by deep-crustal processes, while texture and mineralogy for magma are defined by the transport and ascent processes governing the magmas’ transit through the shallow crust.
As the study of monogenetic systems advances, so do the insights into their eruptive complexities. Monogenetic volcanoes commonly feature two or more eruptive stages (Kereszturi and Németh, 2012) reflecting combinations of internal (e.g., volatiles) and external (e.g., groundwater or fluids) factors that influence eruptive styles (i.e., explosive or effusive) and the resulting volcanic morphologies (e.g., maar/scoria cone) (Kereszturi and Németh, 2012). As a monogenetic edifice, Cracked Mountain most closely classifies as a “Surtseyan” tuff cone associated with spatter and lava flows (Kereszturi and Németh, 2012). Its glaciovolcanic origin would also classify as a transitional, tephra-dominated, tuya (Russell et al., 2014; Harris et al., 2022). The transitional classification is given because Cracked Mountain’s onset was explosive, followed by intrusive and effusive activity. Additionally, the bulk of the edifice is built of tephra (rather than lava-dominant or pillow-dominant), with the term “tuya” used to describe a positive relief volcano whose morphology and lithofacies directly result from ice confinement and/or meltwater interactions (Russell et al., 2014).
The presence of an impounding ice sheet at the time of the Cracked Mountain eruption represents an external factor that played a major role in its style of eruption, the lithofacies diversity, and the volcano’s unique morphology (Harris et al., 2022). However, the presence of ice covering SW British Colombia at the time of the CM eruption may have impacted magma-crustal dynamics as well. Recent studies have proposed causal linkages between volcanism and glacial cycles wherein the loading and unloading of the crust by glaciers causes lithostatic compression and decompression (Jellinek et al., 2004; Rawson et al., 2016; Wilson and Russell, 2020; Guillot and Ponce, 2021; Russell et al., 2021). In particular, the “glacial pumping” models of Wilson and Russell (2020) show that periods of glacial loading facilitate magma charging and entrapment within the upper crust, and during periods of deglaciation those stored magmas are released. Similarly, an investigation of Chile’s Mocho-Choshuenco volcanic system found that during peak glaciation eruption rates are low and magma storage times are high and imply extended periods of magma fluxing into the crust (Rawson et al., 2016). Conversely, the period of deglaciation was attended by efficient evacuation of crustally-stored magmas and a rise in eruption rate.
Glaciovolcanic edifices provide a powerful means to study paleo ice sheets (e.g., Kelman et al., 2002; Smellie, 2007; Wilson et al., 2020). Cracked Mountain erupted during the mid-Pleistocene at the waning of a global ice period, marine isotope stage (MIS) 12, and the onset of rapid global warming during, period MIS 11 (Lisiecki and Raymo, 2005; Harris et al., 2022) (Figure 10A). We propose that the storage of CM magmas in the upper crustal magma chambers may have resulted from the loading of the lithosphere by the paleo-cordilleran ice sheet. During this time, the glacially loaded lithosphere underwent magma ponding within the crust but compressional forces inhibited eruptive activity (e.g., Figure 10B). After a period of magma-crustal accumulation (in MIS 12), there was a period of relatively rapid deglaciation (in MIS 11) which led to decompression of the crust supporting the eruption of the crustally stored magmas beneath Cracked Mountain (Figure 10C).
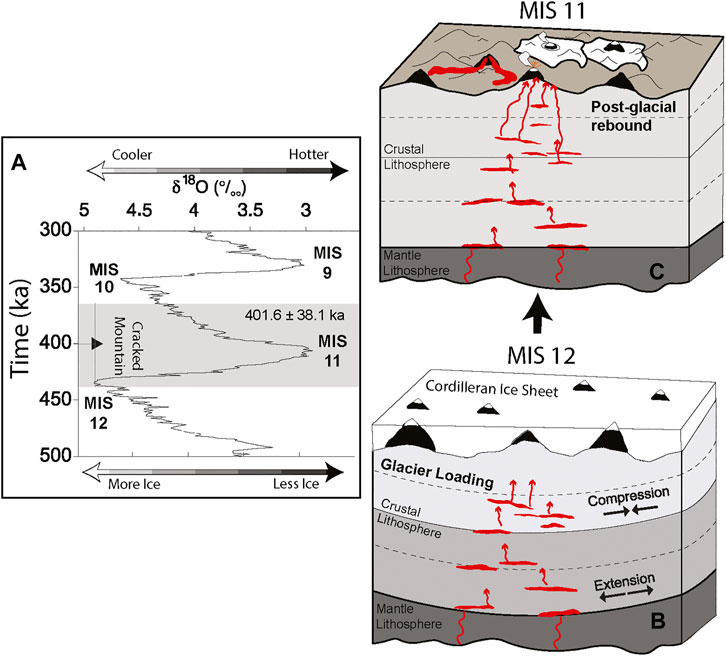
FIGURE 10. A causal relationship between magma-crustal dynamics and glaciation for the Cracked Mountain eruption. (A) Mid Pleistocene Marine δ18O (o/oo) isotope record (MIS), modified from Lisiecki and Raymo (2005); Harris et al., 2022, showing fluctuations (and numbered stages) in global ice from, where higher δ18O represents periods of more global ice and lower δ18O represents periods of lower global ice. The vertical axis is a record of time (ka) with magnetic pole orientations shown through the Pleistocene. The Cracked Mountain plateau age of 401.6 ± 38.1 ka is plotted (grey shaded) on the blow-up MIS portion, representing times from the waning of MIS 12 through MIS 11 (B, C). Schematic magma ascent dynamics are depicted for crustal loading (B) and unloading (C) during cycles of glaciation, modified from Wilson and Russell (2020).
The causal linkages between glacial events and volcanic eruptions are relevant to the long-term forecasting of future volcanic eruptions across the planet. With ice caps shrinking globally across regions with well-documented volcanism (e.g., Antarctica, British Columbia, Iceland, and South America) (Peltier et al., 2015), there will be an increased opportunity and need to further understand the role in which glaciers may impact magmatic crustal dynamics.
Cracked Mountain is a monogenetic basaltic landform in Southwest, British Columbia, Canada (i.e., Garibaldi Volcanic Belt). We identify two unique CM petrographic suites, an olivine-and-plagioclase phyric assemblage (OP) and an olivine-plagioclase-and-augite phyric assemblage (OPA). Major and minor conserved elements, as well as rare earth (REE) signatures, show no difference between the two petrographic suites, indicating a singular melt source. However, variations in major element compositions are modeled with Pearce Element Ratios (PER) and suggest that the two distinct petrographic assemblages (OP and OPA) can be explained by crystal fractionation in two different systems that underwent minor mixing. We further show through thermodynamic modeling that the differences in CM phenocryst assemblage require distinct storage conditions before the eruption. Our results show OP magmas must have been stored at depths less than 6 km depth (< 2 kbar), at temperatures between 1,240–1,155°C. In contrast, the OPA magmas crystallized at depths between 7–9 km (∼2–2.5 kbar) between 1,250–1,150°C. Both magmas are shown to be nearly “dry” with less than 0.5 H2O wt% in their respective systems. This study concludes that the magmatic plumbing system at Cracked Mountain mirrors the complexities seen elsewhere in global studies of monogenetic systems. We propose that the specific magma-crustal dynamics recovered at Cracked Mountain are coupled with the paleoenvironmental conditions of glacial loading and unloading during the mid-Pleistocene.
The original contributions presented in the study are included in the article/Supplementary Material, further inquiries can be directed to the corresponding author.
MH: Conceptualization, Investigation, Formal Analysis, Writing-Original Draft, Writing-Review and Editing, Visualization. JR: Conceptualization, Writing-Review, and Editing, Supervision.
This research was supported by the Geological Survey of Canada with funding through NRCan’s Emerging Renewable Power Program and GeoScience BC. Additional funding from the Government of Canada was provided to MH through the Research Affiliate Program Bursaries (RAP). Lastly, this work was supported by Natural Sciences and Engineering Research Council of Canada (NSERC) Discovery grants to JR.
The authors declare that the research was conducted in the absence of any commercial or financial relationships that could be construed as a potential conflict of interest.
All claims expressed in this article are solely those of the authors and do not necessarily represent those of their affiliated organizations, or those of the publisher, the editors and the reviewers. Any product that may be evaluated in this article, or claim that may be made by its manufacturer, is not guaranteed or endorsed by the publisher.
Special thanks to Steve Grasby of NRCan for all his help organizing field campaigns and funding analytical methods. We thank Sophie Leiter, Lindsey Abdale, Annie Borch, Mahmud Mohammad, Lucy Porritt, and Rene Barendregt for their assistance in the field. Thanks to Genna Chiaro for her insights into thermodynamic models. Lastly, we thank two reviewers and editorial feedback from Drs. Alison Graettinger and Valerio Acocella, all of whom provided positive and constructive comments that greatly improved this manuscript.
The Supplementary Material for this article can be found online at: https://www.frontiersin.org/articles/10.3389/feart.2022.859794/full#supplementary-material
Annen, C., Blundy, J. D., and Sparks, R. S. J. (2006). The Genesis of Intermediate and Silicic Magmas in Deep Crustal Hot Zones. J. Petrol. 47, 505–539. doi:10.1093/petrology/egi084
Barletta, F., St-onge, G., Channell, J. E. T., and Rochon, A. (2010). Dating of Holocene Western Canadian Arctic Sediments by Matching Paleomagnetic Secular Variation to a Geomagnetic Field Model. Quat. Sci. Rev. 29, 2315–2324. doi:10.1016/j.quascirev.2010.05.035
Bas, M. J. L., Maitre, R. W. L., Streckeisen, A., and Zanettin, B. (1986). A Chemical Classification of Volcanic Rocks Based on the Total Alkali-Silica Diagram. J. Petrol. 27, 745–750. doi:10.1093/petrology/27.3.745
Clague, J. J., Evans, S. G., Rampton, V. N., and Woodsworth, G. J. (1995). Improved Age Estimates for the White River and Bridge River Tephras, Western Canada. Can. J. Earth Sci. 32, 1172–1179. doi:10.1139/e95-096
Coote, A., Shane, P., and Fu, B. (2019). Olivine Phenocryst Origins and Mantle Magma Sources for Monogenetic basalt Volcanoes in Northern New Zealand from Textural, Geochemical and δ18O Isotope Data. LITHOS 344-345, 232–246. doi:10.1016/j.lithos.2019.06.026
Coote, A., and Shane, P. (2018). Open-system Magmatic Behaviour beneath Monogenetic Volcanoes Revealed by the Geochemistry, Texture and Thermobarometry of Clinopyroxene, Kaikohe-Bay of Islands Volcanic Field (New Zealand). J. Volcanology Geothermal Res. 368, 51–62. doi:10.1016/j.jvolgeores.2018.11.006
Coote, A., Shane, P., Stirling, C., and Reid, M. (2018). The Origin of Plagioclase Phenocrysts in Basalts from continental Monogenetic Volcanoes of the Kaikohe-Bay of Islands Field, New Zealand: Implications for Magmatic Assembly and Ascent. Contrib. Mineral. Petrol. 173. doi:10.1007/s00410-018-1440-y
Edwards, B. R., Tuffen, H., Skilling, I. P., and Wilson, L. (2009). Introduction to Special Issue on Volcano-Ice Interactions on Earth and Mars: The State of the Science. J. Volcanology Geothermal Res. 185, 247–250. doi:10.1016/j.jvolgeores.2009.06.003
Ghiorso, M. S., and Sack, R. O. (1995). Chemical Mass Transfer in Magmatic Processes IV. A Revised and Internally Consistent Thermodynamic Model for the Interpolation and Extrapolation of Liquid-Solid Equilibria in Magmatic Systems at Elevated Temperatures and Pressures. Contr. Mineral. Petrol. 119, 197–212. doi:10.1007/BF00307281
Giacomoni, P. P., Casetta, F., Valenti, V., Ferlito, C., Lanzafame, G., Nazzari, M., et al. (2021). Thermo-barometric Constraints on the Mt. Etna 2015 Eruptive Event. Contrib. Mineral. Petrol. 176, 1–15. doi:10.1007/s00410-021-01848-8
González Guillot, M., and Ponce, J. F. (2021). Change of Eruptive Style during Pliocene Deglaciation: from Scoria Cones to Lava Shields in Southern Extra-andean Patagonia, Argentina. Bull. Volcanol 83, 1–19. doi:10.1007/s00445-021-01466-z
Green, N. L., Harakal, J. E., Souther, J. G., and Read, P. B. (1988). Eruptive History and K-Ar Geochronology of the Late Cenozoic Garibaldi Volcanic belt, Southwestern British Columbia. Geological Society of America Bulletin, 100, 563–579.
Green, N. L., and Sinha, A. K. (2005). Consequences of Varied Slab Age and thermal Structure on Enrichment Processes in the Sub-arc Mantle of the Northern Cascadia Subduction System. J. Volcanology Geothermal Res. 140, 107–132. doi:10.1016/j.jvolgeores.2004.07.017
Gualda, G. A. R., Ghiorso, M. S., Lemons, R. V., and Carley, T. L. (2012). Rhyolite-MELTS: A Modified Calibration of MELTS Optimized for Silica-Rich, Fluid-Bearing Magmatic Systems. J. Petrol. 53, 875–890. doi:10.1093/petrology/egr080
Gualda, G. A. R., and Ghiorso, M. S. (2015). MELTS_Excel: AMicrosoft Excel-based MELTS Interface for Research and Teaching of Magma Properties and Evolution. Geochem. Geophys. Geosyst. 16, 315–324. doi:10.1002/2014GC005545
Harris, M. A., Russell, J. K., Barendregt, R., Porritt, L. A., and Wilson, A. (2022). Explosive Glaciovolcanism at Cracked Mountain Volcano, Garibaldi Volcanic Belt, Canada. J. Volcanology Geothermal Res. 423, 107477. doi:10.1016/j.jvolgeores.2022.107477
Harris, M., and Russell, J. K. (2021). Bedrock Mapping Results for the Mount Meager Geothermal Research Initiative. Vancouver, Canada: Geoscience BC.
Hickson, C. J., Russell, J. K., Stasiuk, M. V., and Swanson, D. A. (1999). Volcanology of the 2350 B.P. Eruption of Mount Meager Volcanic Complex, British Columbia, Canada: Implications for Hazards from Eruptions in Topographically Complex Terrain. Bull. Volcanology 60, 489–507. doi:10.1007/s004450050247
Hildreth, W. (2007). Quaternary Magmatism in the Cascades-Geologic Perspectives. U.S Geol. Surv. 1744, 1–123. doi:10.3133/pp1744
Irvine, T. N., and Baragar, W. R. A. (1971). A Guide to the Chemical Classification of the Common Volcanic Rocks. Can. J. Earth Sci. 8, 523–548. doi:10.1139/e71-055
Jellinek, A. M., Manga, M., and Saar, M. O. (2004). Did Melting Glaciers Cause Volcanic Eruptions in Eastern California? Probing the Mechanics of dike Formation. J. Geophys. Res. 109, a–n. doi:10.1029/2004JB002978
Keiding, J. K., and Sigmarsson, O. (2012). Geothermobarometry of the 2010 Eyjafjallajökull Eruption: New Constraints on Icelandic Magma Plumbing Systems. J. Geophys. Res. 117, 1–15. doi:10.1029/2011JB008829
Kelman, M. C., Russell, J. K., and Hickson, C. J. (2002). Effusive Intermediate Glaciovolcanism in the Garibaldi Volcanic Belt, Southwestern British Columbia, Canada, 202. Canada: Geological Society, London, Special Publications, 195–211. doi:10.1144/GSL.SP.2002.202.01.10
Kereszturi, G., and Nmeth, K. (2012). “Monogenetic Basaltic Volcanoes: Genetic Classification, Growth, Geomorphology and Degradation,” in Updates in Volcanology - New Advances in Understanding Volcanic Systems, 16–17. doi:10.5772/51387
Khalaf, E. E. D. A. H., and Sano, T. (2020). Petrogenesis of Neogene Polymagmatic Suites at a Monogenetic Low-Volume Volcanic Province, Bahariya Depression, Western Desert, Egypt. Int. J. Earth Sci. (Geol Rundsch) 109, 995–1027. doi:10.1007/s00531-020-01849-1
Kugaenko, Y., and Volynets, A. O. (2019). Magmatic Plumbing Systems of the Monogenetic Volcanic fields: A Case Study of Tolbachinsky Dol, Kamchatka. J. Volcanology Geothermal Res. 383, 63–76. doi:10.1016/j.jvolgeores.2018.03.015
Lawrence, R. B., Lee Armstrong, R., and Berman, R. G. (1984). Garibaldi Group Volcanic Rocks of the Salal Creek Area, Southwestern British Columbia: Alkaline Lavas on the Fringe of the Predominantly Calc-Alkaline Garibaldi (Cascade) Volcanic Arc. J. Volcanology Geothermal Res. 21, 255–276. doi:10.1016/0377-0273(84)90025-8
Lisé-Pronovost, A., St-onge, G., Gogorza, C., Haberzettl, T., Preda, M., Kliem, P., et al. (2013). High-resolution Paleomagnetic Secular Variations and Relative Paleointensity since the Late Pleistocene in Southern South America. Quat. Sci. Rev. 71, 91–108. doi:10.1016/j.quascirev.2012.05.012
Lisiecki, L. E., and Raymo, M. E. (2005). A Pliocene-Pleistocene Stack of 57 Globally Distributed Benthic δ18O Records. Paleoceanography 20, a–n. doi:10.1029/2004PA001071
Liu, J.-Q., Erdmann, S., Chen, L.-H., Zhang, H.-L., Wu, B., Zeng, G., et al. (2021). Petrological Evidence for Magma Recharge and Mixing beneath the Ma'anshan Monogenetic Volcano of Xiaogulihe in Northeast China. Lithos 382-383, 105928383. doi:10.1016/j.lithos.2020.105928
Marsh, B. (2004). A Magmatic Mush Column Rosetta Stone: The McMurdo Dry Valleys of Antarctica. Eos Trans. AGU 85, 497. doi:10.1029/2004EO470001
Morimoto, N. (1988). Nomenclature of Pyroxenes. Mineralogy Petrol. 39, 55–76. doi:10.1007/BF01226262
Moune, S., Sigmarsson, O., Schiano, P., Thordarson, T., and Keiding, J. K. (2012). Melt Inclusion Constraints on the Magma Source of Eyjafjallajökull 2010 Flank Eruption. J. Geophys. Res. 117, 718. doi:10.1029/2011JB008718
Mullen, E. K., and Weis, D. (2015). Evidence for Trench-Parallel Mantle Flow in the Northern Cascade Arc from basalt Geochemistry. Earth Planet. Sci. Lett. 414, 100–107. doi:10.1016/j.epsl.2015.01.010
Mullen, E. K., Weis, D., Marsh, N. B., and Martindale, M. (2017). Primitive Arc Magma Diversity: New Geochemical Insights in the Cascade Arc. Chem. Geology. 448, 43–70. doi:10.1016/j.chemgeo.2016.11.006
Mullen, E. K., and Weis, D. (2013). Sr-Nd-Hf-Pb Isotope and Trace Element Evidence for the Origin of Alkalic Basalts in the Garibaldi Belt, Northern Cascade Arc. Geochem. Geophys. Geosyst. 14, 3126–3155. doi:10.1002/ggge.20191
Nicholls, J., and Russell, J. K. (2016). Igneous Rock Associations 20. Pearce Element Ratio Diagrams: Linking Geochemical Data to Magmatic Processes. Gs 43, 133–146. doi:10.12789/geocanj.2016.43.095
Nicholls, J., and Russell, J. K. (1991). Major-element Chemical Discrimination of Magma-Batches in Lavas from Kilauea Volcano, Hawaii, 1954-1971 Eruptions. Can. Mineral. 29, 981–993. Available at: http://canmin.geoscienceworld.org/cgi/content/abstract/29/4/981.
Pearce, T. H. (1968). A Contribution to the Theory of Variation Diagrams. Contr. Mineral. Petrol. 19, 142–157. doi:10.1007/bf00635485
Peltier, W. R., Argus, D. F., and Drummond, R. (2015). Space Geodesy Constrains Ice Age Terminal Deglaciation: The Global ICE-6G_C (VM5a) Model. J. Geophys. Res. Solid Earth 120, 450–487. doi:10.1002/2014JB011176
Perugini, D., De Campos, C. P., Petrelli, M., and Dingwell, D. B. (2015). Concentration Variance Decay during Magma Mixing: A Volcanic Chronometer. Sci. Rep. 5, 1–10. doi:10.1038/srep14225
Pollock, M., Edwards, B., Hauksdóttir, S., Alcorn, R., and Bowman, L. (2014). Geochemical and Lithostratigraphic Constraints on the Formation of Pillow-Dominated Tindars from Undirhlíðar Quarry, Reykjanes Peninsula, Southwest Iceland. Lithos 200-201, 317–333. doi:10.1016/j.lithos.2014.04.023
Putirka, K. D. (2008). Thermometers and Barometers for Volcanic Systems. Rev. Mineralogy Geochem. 69, 61–120. doi:10.2138/rmg.2008.69.3
Rawson, H., Pyle, D. M., Mather, T. A., Smith, V. C., Fontijn, K., Lachowycz, S. M., et al. (2016). The Magmatic and Eruptive Response of Arc Volcanoes to Deglaciation: Insights from Southern Chile. Geology 44, 251–254. doi:10.1130/G37504.1
Read, P. B. (1979). Geology, Meager Creek Geothermal Area, British Columbia. Ottawa, Canada: Geological Survey of Canada. doi:10.4095/129507
Reverso, T., Vandemeulebrouck, J., Jouanne, F., Pinel, V., Villemin, T., Sturkell, E., et al. (2014). A Two-Magma Chamber Model as a Source of Deformation at Grímsvötn Volcano, Iceland. J. Geophys. Res. Solid Earth 119, 4666–4683. doi:10.1002/2013JB010569
Roddick, J. C., and Souther, J. G. (1987). Geochronology of Neogene Volcanic Rocks in the Northern Garibaldi Belt, 87–2. British Columbia: Geological Survey of Canada, 21–24
Russell, J. K., Edwards, B. R., Porritt, L., and Ryane, C. (2014). Tuyas: A Descriptive Genetic Classification. Quat. Sci. Rev. 87, 70–81. doi:10.1016/j.quascirev.2014.01.001
Russell, J. K., Edwards, B. R., Turnbull, M., and Porritt, L. A. (2021). Englacial lake Dynamics within a Pleistocene Cordilleran Ice Sheet at Kima' Kho Tuya (British Columbia, Canada). Quat. Sci. Rev. 273, 107247. doi:10.1016/j.quascirev.2021.107247
Russell, J. K., and Nicholls, J. (1988). Analysis of Petrologic Hypotheses with Pearce Element Ratios. Contr. Mineral. Petrol. 99, 25–35. doi:10.1007/bf00399362
Russell, J. K., and Stanley, C. R. (1990). Origins of the 1954-1960 Lavas, Kilauea Volcano, Hawaii: Major Element Constraints on Shallow Reservoir Magmatic Processes. J. Geophys. Res. 95, 5021–5047. doi:10.1029/JB095iB04p05021
Sigmundsson, F., Hreinsdóttir, S., Hooper, A., Árnadóttir, T., Pedersen, R., Roberts, M. J., et al. (2010). Intrusion Triggering of the 2010 Eyjafjallajökull Explosive Eruption. Nature 468, 426–430. doi:10.1038/nature09558
Smellie, J. L., 2007, Glacial Landforms Quaternary Vulcanism, Subglacial Landforms. Encyclopedia of Quaternary Science. Amsterdam, Netherlands: Elsevier B.V, 784–798, doi:10.1016/B0-44-452747-8/00101-0
Smith, I. E. M., and Németh, K. (2017). Source to Surface Model of Monogenetic Volcanism: a Critical Review. Geol. Soc. Lond. Spec. Publications 446, 1–28. doi:10.1144/SP446.14
Song, J.-H., Kim, S., Rhie, J., Lee, S.-H., Kim, Y., and Kang, T.-S. (2018). Imaging of Lithospheric Structure beneath Jeju Volcanic Island by Teleseismic Traveltime Tomography. J. Geophys. Res. Solid Earth 123, 6784–6801. doi:10.1029/2018JB015979
Stanley, C. R., and Russell, J. K. (1989). Petrologic Hypothesis Testing with Pearce Element Ratio Diagrams: Derivation of Diagram Axes. Contr. Mineral. Petrol. 103, 78–89. doi:10.1007/bf00371366
Stasiuk, M., and Russell, J. K. (1989). Petrography and Chemistry of the Meager Mountain Volcanic Complex, Southwestern British Columbia. Ottawa, Canada: Geological Survey of Canada, 189–196
Stewart, M. L., Russell, J. K., and Hickson, C. J. (2008). Geology, Pebble Creek Formation. British Columbia: Geological Survey of Canada. doi:10.4095/225582
Sun, S.-s., and McDonough, W. F. (1989). Chemical and Isotopic Systematics of Oceanic Basalts: Implications for Mantle Composition and Processes. Geol. Soc. Lond. Spec. Publications 42, 313–345. doi:10.1144/GSL.SP.1989.042.01.19
Turner, G. M. (1987). A 5000 Year Geomagnetic Palaeosecular Variation Record from Western Canada. Geophys. J. Int., 91, 103–121. doi:10.1111/j.1365-246x.1987.tb05215.x
Van Otterloo, J., Raveggi, M., Cas, R. A. F., and Maas, R. (2014). Polymagmatic Activity at the Monogenetic Mt Gambier Volcanic Complex in the Newer Volcanics Province, SE Australia: New Insights into the Occurrence of Intraplate Volcanic Activity in Australia. J. Petrol. 55, 1317–1351. doi:10.1093/petrology/egu026
Venugopal, S., Moune, S., Williams-Jones, G., Druitt, T., Vigouroux, N., Wilson, A., et al. (2020). Two Distinct Mantle Sources beneath the Garibaldi Volcanic Belt: Insight from Olivine-Hosted Melt Inclusions. Chem. Geology. 532, 119346. doi:10.1016/j.chemgeo.2019.119346
Wallace, P. J., Plank, T., Edmonds, M., and Hauri, E. H. (2015). Volatiles in Magmas. Elsevier, 163–183. doi:10.1016/b978-0-12-385938-9.00007-9
Wilson, A. M., and Russell, J. K. (2018). Quaternary Glaciovolcanism in the Canadian Cascade Volcanic Arc—Paleoenvironmental Implications. Special Paper - Geological Society of America, 538, 133–157. doi:10.1130/2018.2538(06)
Wilson, A. M., and Russell, J. K. (2020). Glacial Pumping of a Magma-Charged Lithosphere: A Model for Glaciovolcanic Causality in Magmatic Arcs. Earth Planet. Sci. Lett. 548, 116500. doi:10.1016/j.epsl.2020.116500
Wilson, A. M., and Russell, J. K. (2017). Lillooet Glacier Basalts, Southwestern British Columbia, Canada: Products of Quaternary Glaciovolcanism. Can. J. Earth Sci. 54, 639–653. doi:10.1139/cjes-2016-0201
Wilson, A. M., Russell, J. K., and Ward, B. C. (2019). Paleo-glacier Reconstruction in Southwestern British Columbia, Canada: A Glaciovolcanic Model. Quat. Sci. Rev. 218, 178–188. doi:10.1016/j.quascirev.2019.06.024
Keywords: monogenetic, tuya, magma crustal dynamics, rhyolite-MELTS, Garibaldi volcanic belt
Citation: Harris MA and Russell JK (2022) Polymagmatic Glaciovolcanism: Cracked Mountain Tuya, Canadian Cascades. Front. Earth Sci. 10:859794. doi: 10.3389/feart.2022.859794
Received: 21 January 2022; Accepted: 28 February 2022;
Published: 24 March 2022.
Edited by:
Alison Hollomon Graettinger, University of Missouri–Kansas City, United StatesReviewed by:
Ian Ernest Masterman Smith, The University of Auckland, New ZealandCopyright © 2022 Harris and Russell. This is an open-access article distributed under the terms of the Creative Commons Attribution License (CC BY). The use, distribution or reproduction in other forums is permitted, provided the original author(s) and the copyright owner(s) are credited and that the original publication in this journal is cited, in accordance with accepted academic practice. No use, distribution or reproduction is permitted which does not comply with these terms.
*Correspondence: Martin A. Harris, bWhhcnJpc0Blb2FzLnViYy5jYQ==
Disclaimer: All claims expressed in this article are solely those of the authors and do not necessarily represent those of their affiliated organizations, or those of the publisher, the editors and the reviewers. Any product that may be evaluated in this article or claim that may be made by its manufacturer is not guaranteed or endorsed by the publisher.
Research integrity at Frontiers
Learn more about the work of our research integrity team to safeguard the quality of each article we publish.