 Shouding Li
 Yiming Sun
 Cheng Lu
 Weichang Chen1,2,3
 Shimin Liu
- 1Key Laboratory of Shale Gas and Geoengineering, Institute of Geology and Geophysics, Chinese Academy of Sciences, Beijing, China
- 2Innovation Academy for Earth Science, Chinese Academy of Sciences, Beijing, China
- 3College of Earth and Planetary Sciences, University of Chinese Academy of Sciences, Beijing, China
- 4Guangzhou Marine Geological Survey, China Geological Survey, Guangzhou, China
- 5Center of Oil and Natural Gas Resource Exploration, China Geological Survey, Beijing, China
- 6Department of Energy and Mineral Engineering, G3 Center and Energy Institute, The Pennsylvania State University, University Park, State College, PA, United States
- 7Institute of Engineering Thermophysics, Chinese Academy of Sciences, Beijing, China
- 8School of Aeronautics and Astronautics, University of Chinese Academy of Sciences, Beijing, China
Free gas saturation is one of the key factors that affect the overall production behaviors of hydrate reservoirs. For example, different free gas contents could alter the thermal response of hydrate reservoirs to the artificial stimulation and hence change the gas production performance. To investigate whether and how much the hydrate reservoir contains free gas, we proposed a thermodynamic method to calculate the total heat consumption of hydrate dissociation throughout gas production and assess the free gas proportion. Based on the monitoring data of the first offshore hydrate production in Japan, we calculated the total heat consumption and analyzed the contributions of heat convection, heat conduction, and sensible heat during the entire test. The calculation results showed that there is likely to be a certain amount of free gas in the hydrate reservoir in the Eastern Nankai Trough. In addition, the analysis of different heat sources revealed the critical thermodynamic phenomenon in which the reservoir sensible heat was the main source for enthalpy of hydrate dissociation, which consistently contributed more than 95% of the total heat supply during the 6-day production test. The results of this work may help upgrade the production strategy for natural gas hydrates.
1 Introduction
Natural gas hydrates (NGHs), found in permafrost regions and marine continental margin sediments, are crystalline compounds formed by water and natural gas molecules (mainly methane) (Kvenvolden 1988; Sloan 2003; Boswell and Collett 2011). In an ideally saturated methane hydrate, the molar ratio of methane to water is nearly 1:6, that is, equal to a volumetric ratio of about 164 (Kvenvolden 1988). The methane concentration in hydrates is comparable to that of a highly compressed gas (Sloan 2003). Therefore, hydrates need to form in the condition in which hydrate-forming gas is sufficient and both pressure and temperature are conducive to hydrate stability. Otherwise, the hydrate crystal may break down and release methane into the surrounding water. Whether the gas resource is sufficient or not directly affects the formation of NGH and the volume percentage of gas hydrate in hydrate-bearing sediments (HBSs). The presence of methane within the pressure–temperature stability field for methane gas hydrate is not sufficient to ensure the occurrence of gas hydrate, which tends to form when the mass fraction of methane dissolved in liquid exceeds methane solubility in seawater (Xu and Ruppel 1999) and there is free methane gas in the fluid system (Ben Clennell et al., 1999; Waite et al., 2009; Lu et al., 2019). Accordingly, fluid containing methane must rise to the depth at which the local solubility limit is less than the methane content in order for hydrate to precipitate (Waite et al., 2009).
NGH reservoirs can be divided into three main classes on the basis of geological features and initial conditions (Moridis et al., 2009), in which NGH indeed generally coexists with free gas (Makogon and Omelchenko 2013; Miyakawa et al., 2014; Li et al., 2016; Ye et al., 2020). Free gas saturation is a key factor that affects the overall production behaviors of marine hydrate deposit, for example, influencing the thermal response of hydrate reservoir to the artificial stimulation and hence altering the gas production performance (Moridis et al., 2007). Generally, when the gas content is lower than the local solubility, the gas dissolves in the pore water and migrates with it. If the gas exceeds the solubility and the amount is small, a small number of bubbles will migrate with the pore fluid in a discrete form. Accordingly, there are two main sources of free gas in the hydrate reservoir. In one case, methane is transported to the hydrate stability zone by dissolving in pore water. In the rising process, due to the gradual decrease of methane solubility, methane precipitates from water. In another case, methane is directly provided by the fluid containing saturated methane and free gas (Lu et al., 2019). These imply that there is supposed to be a certain proportion of free gas in the hydrate reservoir. Understanding the free gas content of a reservoir will help to establish a hydrate accumulation model and formulate the corresponding production strategy, such as heat-supply strategy and depressurization strategy. However, the evidence of whether and how much the hydrate reservoir contains free gas is scarce, and the method to assess the overall free gas content in a hydrate reservoir is deficient and needs to be developed.
In this article, we proposed a thermodynamic method using real-world production data to calculate the heat consumption of hydrate dissociation in gas production and ultimately evaluate the free gas content in a hydrate reservoir. Taking the first offshore hydrate production of Japan as an example, we conducted the estimation and analyses of free gas proportion in the test reservoir using the on-site monitoring data. Based on this work, we also analyzed the thermal responses of the reservoir and revealed the contributions of different thermal processes. This work will not only conduce to understanding the phase composition of methane gas in hydrate reservoirs but also help us better comprehend the effect of different heat sources in hydrate reservoirs to hydrate dissociation, all of which will better guide future hydrate production.
2 Principle and Method
The dissociation of methane hydrate is an endothermic process and can significantly change the temperature field in the reservoir (Song et al., 2015; Yamamoto et al., 2017). In contrast, the thermodynamic effect of the release of free gas originally existing in the hydrate reservoir can be ignored. Based on this, we can estimate the heat consumption during gas production according to the thermal response of the formation and then obtain the amount of hydrate-released gas by converting the heat consumption into gas volume. Furthermore, we can calculate the proportion of free gas in the total gas yield.
In the process of gas production, artificial stimulation, such as depressurization, triggers the dissociation, and immediately the hydrate dissociation will absorb heat from the surrounding environment. As the dissociation goes on, a disturbed zone, which can be defined as the zone in which the temperature diverges from the initial state, will expand over time. Consequently, convective water driven by the pressure gradient will be cooled due to heat transfer to the disturbed zone, heat conduction due to the temperature gradient will occur, and sensible heat of the disturbed zone will be released due to formation cooling. In the aforementioned processes, the heat consumption of hydrate dissociation
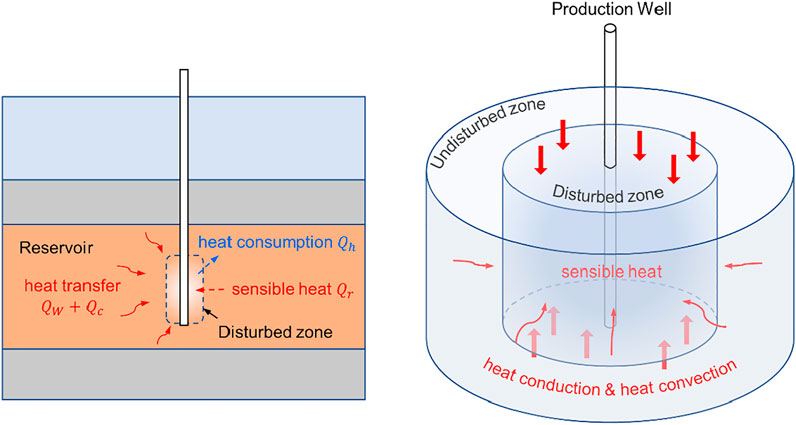
FIGURE 1. Schematic diagram of the thermodynamic processes during hydrate production.
From this point of view, to estimate the free gas content, the first step is to calculate the right-hand members in Eq. 1 and then convert the results into an equivalent volume of hydrate-released gas according to the enthalpy of hydrate dissociation.
In this work, the heat contributed by formation water convection (
where
The heat conduction through the disturbed zone (
where
where
The sensible heat released by the disturbed zone (
where
With heat consumption calculated, we can estimate the hydrate-released gas by attributing all the heat consumption to the hydrate dissociation. The enthalpy of methane hydrate dissociation
The estimated hydrate-released gas according to Eqs 1,6 is supposed to be less than the gross gas production because of the free gas in the reservoir. Comparing the hydrate-released gas with the gross gas production, we can determine the free gas content in the hydrate deposit. The values and calculations of physical parameters, especially the thermophysical properties will be detailed in the following section.
3 Calculation and Discussion
3.1 Data Acquisition and Processing
In March 2013, the world’s first field trial of gas production from marine hydrate deposits was conducted in the Daini Atsumi Knoll area of the Eastern Nankai Trough off the Pacific coast of Japan (Yamamoto et al., 2014). One production well AT1-P with two monitoring boreholes, AT1-MC and AT1-MT1, was drilled in the test site. During the entire 6-day flow test, the gas production rate was stable at about 2.0 × 10⁴ m3 d−1, with the highest rate of 2.5 × 10⁴ m3 d−1. The water production rate was about 200 m3 d−1. The cumulative gas production was 11.9 × 10⁴ m3, and water production was 1,250 m3 (Konno et al., 2017; Yamamoto et al., 2017). Along with the flow test, the intensive data acquisition program was implemented. DTS and RTD temperature sensors installed along the production and two observation boreholes detected temperature variations caused by the endothermic dissociation process and heat transfer around the boreholes during gas production.
As the first offshore hydrate production test of Japan provided an integral dataset that recorded the production behavior and reservoir response during the entire depressurization production, in this work, we attempted to take this pilot production as an example and assess the free gas content in the test reservoir. To conduct the calculation in a unified geometry of the model, we simplified the temperature profile in the reservoir via average temperature in our calculations, which should be acceptable given the linear relationship between the heat items and temperature variation and the thermal independence of other parameters. According to the temperature monitoring data, we chose the data gathered by the sensor installed 10 m below the top of the methane hydrate-concentrated zone, which could typify the temperature variation of different formation intervals, as the average temperature to conduct the calculation. According to the timeline of the major events (Yamamoto et al., 2017), the calculated span was set at 138 h, i.e., from 5 to 143 h after the start of depressurization, when the downhole P-T state reached the phase equilibrium curve of methane hydrate and the depressurization operation terminated, respectively.
The fundamental calculation data, namely, temperature variation and water production, were gathered from the literature of Yamamoto et al. (2017) and processed by overall smoothing and hourly homogenizing, as shown in Figure 2.
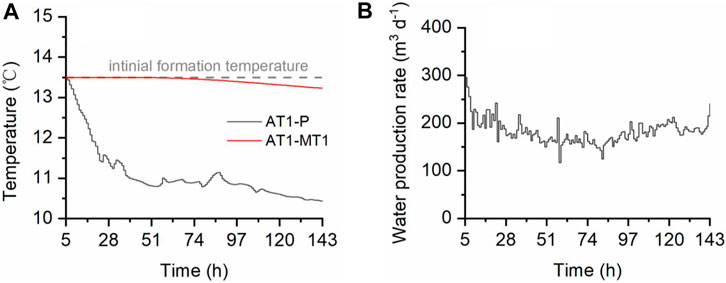
FIGURE 2. Data used for calculation. (A) Processed downhole temperature data of production well AT1-P and monitoring well AT1-MT1 from the sensor installed 10 m below the top of the methane hydrate-concentrated zone. (B) Processed water production data from production well AT1-P.
3.2 Heat Consumption Calculation
3.2.1 Heat From Formation Water
In the process of hydrate production, hydrate dissociation will absorb heat from the surrounding environment. Therefore, the temperature of the final produced water, that is, the downhole monitoring temperature of the production well was lower than the initial formation temperature. According to energy conservation, the heat loss of produced water constituted a part of heat sources for hydrate dissociation. The produced water was composed of decomposed hydrate water, in situ formation water, and inflow formation water. We assume that the extracted hydrate water and in situ water will be replaced by the inflow water, so it can be equivalently considered that they are stationary, and the produced water is equivalent to the inflow water. The heat convection calculation of this part only considers the heat loss of produced water, while the heat loss of hydrate water and in situ water is classified into the following sensible heat calculation.
Based on the real-time temperature difference (Figure 2A) and Eq. 2, the heat contributed by formation water can be calculated. The specific heat capacity of seawater was taken as 4.1 kJ kg−1 K−1 (Sharqawy et al., 2012; Haynes 2016). Figure 3 gives the temperature variation quantity
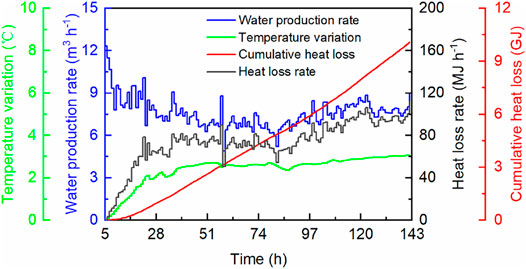
FIGURE 3. Calculation results of the heat loss from produced formation water contributing to hydrate dissociation.
Given the discrepancy between the water flux through the boundary of the disturbed zone and the water production rate, for example, the production rate would be bigger than the influx at the beginning in order to decrease the downhole pressure, we carried out the following examination to determine the influence of this issue. Our calculation interval spanned from 5 to 143 h after the start of depressurization, in which the downhole pressure basically hovered between 4.5–5 MPa. The biggest pressure drop of about 6 MPa occurred in the period of 5–12 h. Taking the well diameter as 21.5 cm (8–1/2″ drill bit) (Yamamoto et al., 2014), the total introduced error of water volume is about 22 m3. Given the temperature drop during this period was less than 1 K, the total corresponding energy error is believed to be about 0.1 GJ, which is 1% of the current calculation results. This shows that the error introduced by the altering of downhole pressure is minor and negligible.
3.2.2 Heat From Formation Conduction
The dissociation of hydrates can change the temperature field around the production well, and thus the heat conduction in formation will occur. In this work, the heat conduction through the disturbed zone was simply divided into two parts, that is, the heat from lateral conduction and vertical conduction. The lateral heat conduction was considered a one-dimension steady heat conduction problem in each hourly interval. According to numerical simulations of the short-term hydrate production employing the vertical production well (Yamamoto et al., 2017; Boswell et al., 2019; Feng et al., 2019; Yu et al., 2019), we assumed a cylindrical disturbed zone during the production to calculate the corresponding heat (
Although the calculation model has been simplified, the direct application of Fourier’s law is still not feasible because the temperature and position of the internal and external heat conduction boundaries are needed. In the calculation, the temperature at the inner and outer boundaries is known. The former is the temperature data from the production well, and the latter is the initial formation temperature of 13.5°C. The location of the inner boundary, that is, the wellbore radius, is also known, which is 0.1 m (Yamamoto et al., 2017). The biggest obstacle to the calculation lies in the real-time position of the outer conduction boundary. In this hydrate production trial, no instrument could keep track of the boundary of the disturbed zone, that is,
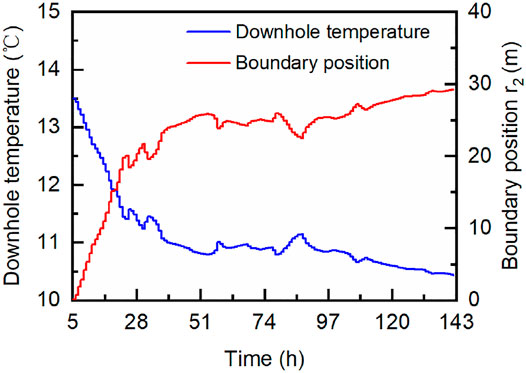
FIGURE 4. Downhole temperature of the production well and corresponding extrapolated position of the lateral heat conduction boundary.
Having the position of the heat conduction boundary in each temporal interval, we can conduct the calculations of lateral conduction and vertical conduction. In Eq. 3, the height
where
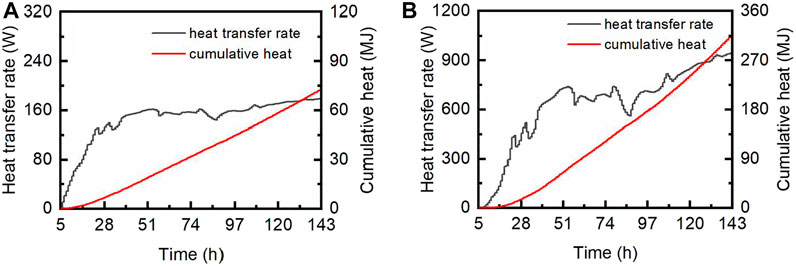
FIGURE 5. Heat transfer rate and cumulative heat of lateral heat conduction (A) and vertical heat conduction (B).
It should be noted that the calculations of this part were simplified. For instance, the actual temperature profile in the reservoir is bound to be different from the one adopted in the calculation, and the actual geometry of the boundary must not be a simple cylinder. These deficiencies should be overcome in the further study via numerical calculation. But fortunately, the magnitude of the result indicates that the role of heat conduction in the hydrate production is astonishingly insignificant, as the equivalent gas volume of this amount of heat is merely 161 m3 according to Eq. 6.
3.2.3 Sensible Heat Released by the Disturbed Zone
As defined previously and illustrated in Figure 1, the disturbed zone in this work refers to a cylindrical zone in which the temperature diverges from the initial state due to hydrate dissociation and related thermal effect. Figure 4 shows the boundary position of the disturbed zone and the downhole temperature of the production well, whereby the sensible heat associated with the temperature decrease of formation can be calculated based on Eq. 5. As in Eq. 3, the height
where
based on which the cumulative sensible heats by the end of each temporal interval were calculated. Figure 6 shows the upper bound, average, and lower bound of the sensible heat released by the disturbed zone. The ultimate sensible heat was 226.64 GJ on average, and the upper and lower bounds were 251.25 and 201.75 GJ, respectively.
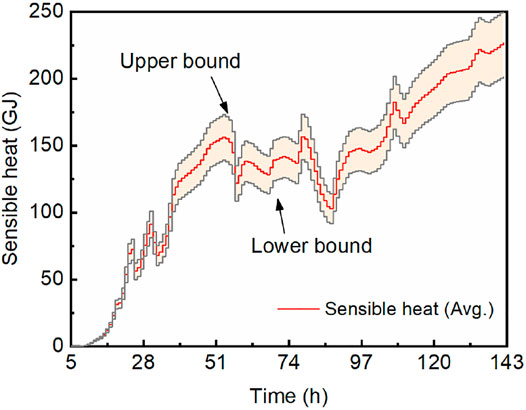
FIGURE 6. Cumulative sensible heat by the end of each temporal interval, with upper and lower bounds.
3.3 Free Gas Proportion and Implication
Figure 7 summarizes the calculation results, based on which we can estimate the free gas proportion in the test reservoir using Eqs 1,6. The heat from formation water in total is 10.08 GJ. The heat derived from lateral and vertical heat conduction through the formation adds up to 72.55 and 314.96 MJ, respectively, with a total value of 387.51 MJ. The ultimate sensible heat released by the disturbed zone was 226.64 GJ. Corresponding to these heat items, the equivalent gas volumes are 4,181 m3, 161 m3, and 94014 m3, respectively. These results mean that in 138-h gas production interval, 98356 m3 of methane gas was generated due to hydrate dissociation. As the total extracted gas was 119000 m3, the proportion of free gas in the gross gas yield, or in the test reservoir, was estimated as 17.35%. Considering the variation range of cumulative sensible heat, the maximum and minimum volumes of the total hydrate-released gas would be 108565 m3 and 88031 m3, respectively. The corresponding free gas proportion will be 8.77% and 26.02%, respectively. According to the results, there is likely to be a certain amount of free gas in the NGH deposit in the Eastern Nankai Trough.
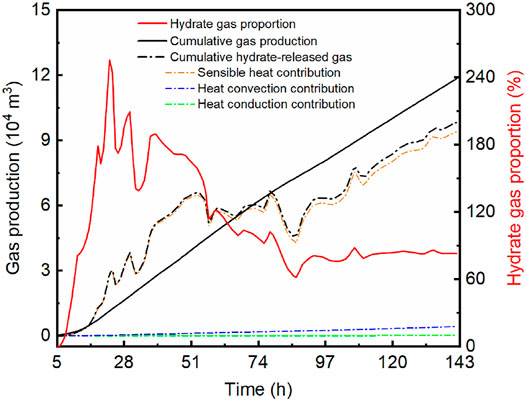
FIGURE 7. Comparison of the total gas production (black solid line) and the calculated hydrate-released gas production (dashed-dotted lines) and the real-time ratio of hydrate-released gas to gas production (red solid line).
In Figure 7 the hydrate gas proportion, namely, the ratio of hydrate-released gas to actual extracted gas, indicates that free gas was first extracted in the beginning of few hours, and then the hydrate dissociation sprang up as the hydrate gas proportion surged in the following hours. The proportion exceeding 100% indicates a delay of gas extraction caused by the sluggish gas migration in low-permeability formation. However, after the delay period, the hydrate gas production represents a declining trend, which may imply a pause of hydrate dissociation and even a reformation phenomenon of hydrates. As the gas extraction went on, the hydrate gas proportion decreased continuously until it converged to a basically stable value of 82.65%.
As an endothermic process, hydrate dissociation will absorb heat from various sources. Our calculation demonstrated that hydrate gas generation was mainly contributed by sensible heat associated with the temperature decrease of formation. As shown in Figure 7, the gas production related to sensible heat accounts for 95.6% of the total hydrate-released gas. Figure 8 shows the contributions of the three heat items to hydrate dissociation. In the first few hours, both the sensible heat and heat convection constituted the main heat source to hydrate dissociation, but then they evolved toward opposite directions. In the rest of the production time, the sensible heat consistently contributed more than 95% of the total heat supplement, while that proportion of heat convection was less than 5%. Meanwhile, the contribution of heat conduction was negligible because the proportion was not more than 0.2% in the entire production test. After a 24-h gas production, a noteworthy change occurred, and the heat proportion of sensible heat began to decline, while the heat convection and heat conduction exhibited an upward trend. As the hydrate dissociation absorbs heat immediately from the HBS, a moderate hydrate dissociation will bring about a moderate release of sensible heat. So, the change might result from the continuous temperature decline, which made hydrates dissociated less intensively (Kim et al., 1987; Song et al., 2015). This explanation is in agreement with the temperature records, which presented a rapid temperature decrease before 24 h and then had a relatively temperate descending trend.
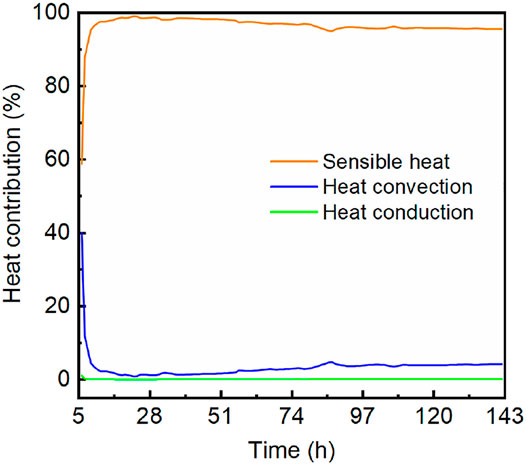
FIGURE 8. Contributions of sensible heat, heat convection, and heat convection to hydrate dissociation.
To sum up, hydrate dissociation will mainly count on sensible heat of formation in a relatively long term; therefore, a hydrate reservoir with a high initial temperature is preferable for production. But with the formation temperature gradually declining to the equilibrium temperature, the spontaneous hydrate dissociation and corresponding heat absorption from HBS will become feeble. In this stage, heat convection may play an increasingly important role. As for the production strategy, these perceptions suggest that the formation temperature is the primary factor in terms of thermodynamics. It is reasonable to choose a reservoir with a higher temperature, even to artificially supply heat into the reservoir to facilitate and maintain hydrate dissociation. In addition, it is also a measure worthy of consideration to enhance heat convection in a certain stage to boost the hydrate dissociation and compensate for the degradation of formation heat release. There has been plenty of research investigating the techniques or schemes by implementing heat injection and hydraulic fracturing in the hydrate reservoir (Li X.-S. et al., 2012; Chen et al., 2014; Konno et al., 2016; Chen et al., 2017; Sun et al., 2021), by which we can carry out the enhanced recovery of hydrates. It is foreseeable that novel comprehensive and sophisticated production strategies or methods will emerge and come into play in the upcoming hydrate production.
4 Conclusion
In this study, we proposed a thermodynamic method for the estimation of free gas proportion in a hydrate reservoir using the field production and monitoring data. Based on this, we managed to approximately estimate the free gas content in the first test reservoir in the Nankai Trough. Considering the main contributing thermal processes for hydrate dissociation, namely, heat convection of formation water, heat conduction in formation, and sensible heat releasing of the thermal disturbed zone, we calculated the total heat consumption due to hydrate dissociation during the entire production period. We converted this heat consumption into equivalent hydrate-released gas according to the enthalpy of hydrate dissociation and obtained the estimated gas volume of 98356 m3, which means the proportion of free gas in total produced gas, or in total reservoir-trapped gas, may be 17.35%, as the actual total gas production was 119000 m3. Given the variation range of sensible heat, the lower and upper free gas proportions were estimated as 8.77% and 26.02%, respectively.
Based on the calculation results, the hydrate gas proportion varying with time indicates that free gas accounted for a major part of gas generation in the first few hours, and then the hydrate dissociation sprang up. The proportion exceeding 100% implies a delay of gas extraction due to sluggish gas migration in low-permeability formation. The subsequent decline of hydrate gas proportion and generation may imply a pause of hydrate dissociation and even reformation of hydrates.
The heat analyses demonstrated that hydrate dissociation was mainly contributed by the sensible heat of the disturbed zone at least in this 6-day production. Gas production related to sensible heat accounted for 95% or so of the total hydrate-released gas, while that of heat convection was less than 5% and not more than 0.2% for heat conduction.
Through thermodynamic analysis and calculation, we revealed the gas composition in a hydrate reservoir, which is essential for understanding and predicting the gas production behavior of the hydrate reservoir. The analysis of thermal response unraveled the energy contribution of different heat sources to hydrate dissociation, which will guide the development of the production strategy in the future.
Data Availability Statement
The raw data supporting the conclusion of this article will be made available by the authors, without undue reservation.
Author Contributions
SL: conceptualization, methodology, formal analysis, investigation, supervision, project administration, and funding acquisition. YS: conceptualization, methodology, formal analysis, investigation, data curation, writing–original draft, and visualization. CL: investigation, review and editing, and funding acquisition. WC: formal analysis, investigation, and review and editing. LC: review and editing. SML: formal analysis and review and editing. XL: supervision, project administration, and funding acquisition. All authors contributed to manuscript revision and read and approved the submitted version.
Funding
This study was funded by the Guangdong Major Project of Basic and Applied Basic Research (No. 2020B0301030003), the National Natural Science Foundation of China (42090023 and 51991365), China Geological Survey Project (No. DD20211350), the IGGCAS Key Deployment Project (Nos. IGGCAS-201903 and SZJJ201901), the Key Deployment Program of Chinese Academy of Sciences (Nos. YJKYYQ20190043, ZDBS-LY-DQC003, XDA14040401, KFZD-SW-422, and ZDRW-ZS-2021-3-1), and the CAS Key Technology Talent Program.
Conflict of Interest
The authors declare that the research was conducted in the absence of any commercial or financial relationships that could be construed as a potential conflict of interest.
Publisher’s Note
All claims expressed in this article are solely those of the authors and do not necessarily represent those of their affiliated organizations, or those of the publisher, the editors and the reviewers. Any product that may be evaluated in this article, or claim that may be made by its manufacturer, is not guaranteed or endorsed by the publisher.
References
Boswell, R., and Collett, T. S. (2011). Current Perspectives on Gas Hydrate Resources. Energy Environ. Sci. 4 (4), 1206–1215. doi:10.1039/c0ee00203h
Boswell, R., Myshakin, E., Moridis, G., Konno, Y., Collett, T. S., Reagan, M., et al. (2019). India National Gas Hydrate Program Expedition 02 Summary of Scientific Results: Numerical Simulation of Reservoir Response to Depressurization. Mar. Pet. Geology. 108, 154–166. doi:10.1016/j.marpetgeo.2018.09.026
Chen, L., Feng, Y., Okajima, J., Komiya, A., and Maruyama, S. (2018). Production Behavior and Numerical Analysis for 2017 Methane Hydrate Extraction Test of Shenhu, South China Sea. J. Nat. Gas Sci. Eng. 53 (53), 55–66. doi:10.1016/j.jngse.2018.02.029
Chen, L., Sasaki, H., Watanabe, T., Okajima, J., Komiya, A., and Maruyama, S. (2017). Production Strategy for Oceanic Methane Hydrate Extraction and Power Generation with Carbon Capture and Storage (CCS). Energy 126, 256–272. doi:10.1016/j.energy.2017.03.029
Chen, Z., Feng, J., Li, X., Zhang, Y., Li, B., and Lv, Q. (2014). Preparation of Warm Brine In Situ Seafloor Based on the Hydrate Process for Marine Gas Hydrate Thermal Stimulation. Ind. Eng. Chem. Res. 53 (36), 14142–14157. doi:10.1021/ie501181r
Clennell, M. B., Hovland, M., Booth, J. S., Henry, P., and Winters, W. J. (1999). Formation of Natural Gas Hydrates in marine Sediments: 1. Conceptual Model of Gas Hydrate Growth Conditioned by Host Sediment Properties. J. Geophys. Res. 104 (B10), 22985–23003. doi:10.1029/1999jb900175
Cortes, D. D., Martin, A. I., Yun, T. S., Francisca, F. M., Santamarina, J. C., and Ruppel, C. (2009). Thermal Conductivity of Hydrate-Bearing Sediments. J. Geophys. Res. 114 (B11). doi:10.1029/2008jb006235
Feng, Y., Chen, L., Suzuki, A., Kogawa, T., Okajima, J., Komiya, A., et al. (2019). Enhancement of Gas Production from Methane Hydrate Reservoirs by the Combination of Hydraulic Fracturing and Depressurization Method. Energ. Convers. Management 184, 194–204. doi:10.1016/j.enconman.2019.01.050
Fujii, T., Suzuki, K., Takayama, T., Tamaki, M., Komatsu, Y., Konno, Y., et al. (2015). Geological Setting and Characterization of a Methane Hydrate Reservoir Distributed at the First Offshore Production Test Site on the Daini-Atsumi Knoll in the Eastern Nankai Trough, Japan. Mar. Pet. Geology. 66, 310–322. doi:10.1016/j.marpetgeo.2015.02.037
Handa, Y. P. (1986). Compositions, Enthalpies of Dissociation, and Heat Capacities in the Range 85 to 270 K for Clathrate Hydrates of Methane, Ethane, and Propane, and Enthalpy of Dissociation of Isobutane Hydrate, as Determined by a Heat-Flow Calorimeter. The J. Chem. Thermodynamics 18 (10), 915–921. doi:10.1016/0021-9614(86)90149-7
Haynes, W. M. (2016). CRC Handbook of Chemistry and Physics. 97th Edition. Boca Raton: Taylor and Francis;CRC Press.
Kim, H. C., Bishnoi, P. R., Heidemann, R. A., and Rizvi, S. S. H. (1987). Kinetics of Methane Hydrate Decomposition. Chem. Eng. Sci. 42 (7), 1645–1653. doi:10.1016/0009-2509(87)80169-0
Konno, Y., Fujii, T., Sato, A., Akamine, K., Naiki, M., Masuda, Y., et al. (2017). Key Findings of the World's First Offshore Methane Hydrate Production Test off the Coast of Japan: Toward Future Commercial Production. Energy Fuels 31 (3), 2607–2616. doi:10.1021/acs.energyfuels.6b03143
Konno, Y., Jin, Y., Yoneda, J., Uchiumi, T., Shinjou, K., and Nagao, J. (2016). Hydraulic Fracturing in Methane-Hydrate-Bearing Sand. RSC Adv. 6 (77), 73148–73155. doi:10.1039/c6ra15520k
Konno, Y., Masuda, Y., Hariguchi, Y., Kurihara, M., and Ouchi, H. (2010). Key Factors for Depressurization-Induced Gas Production from Oceanic Methane Hydrates. Energy Fuels 24 (3), 1736–1744. doi:10.1021/ef901115h
Kvenvolden, K. A. (1988). Methane Hydrate — A Major Reservoir of Carbon in the Shallow Geosphere? Chem. Geology. 71 (1), 41–51. doi:10.1016/0009-2541(88)90104-0
Li, G., Li, B., Li, X.-S., Zhang, Y., and Wang, Y. (2012a). Experimental and Numerical Studies on Gas Production from Methane Hydrate in Porous Media by Depressurization in Pilot-Scale Hydrate Simulator. Energy Fuels 26 (10), 6300–6310. doi:10.1021/ef301229k
Li, X.-S., Wang, Y., Duan, L.-P., Li, G., Zhang, Y., Huang, N.-S., et al. (2012b). Experimental Investigation into Methane Hydrate Production during Three-Dimensional thermal Huff and Puff. Appl. Energ. 94, 48–57. doi:10.1016/j.apenergy.2012.01.024
Li, X.-S., Xu, C.-G., Zhang, Y., Ruan, X.-K., Li, G., and Wang, Y. (2016). Investigation into Gas Production from Natural Gas Hydrate: A Review. Appl. Energ. 172, 286–322. doi:10.1016/j.apenergy.2016.03.101
Lu, X., Zhang, X., Wang, P., and Liang, Q. (2019). Advances of Formation Dynamics of Natural Gas Hydrate. Sci. Sin.-Phys. Mech. Astron. 49 (3), 034605. doi:10.1360/sspma2018-00362
Makogon, Y. F., and Omelchenko, R. Y. (2013). Commercial Gas Production from Messoyakha deposit in Hydrate Conditions. J. Nat. Gas Sci. Eng. 11, 1–6. doi:10.1016/j.jngse.2012.08.002
Miyakawa, A., Saito, S., Yamada, Y., Tomaru, H., Kinoshita, M., and Tsuji, T. (2014). Gas Hydrate Saturation at S Ite C 0002, IODP E Xpeditions 314 and 315, in the K Umano B Asin, N Ankai Trough. Isl. Arc 23 (2), 142–156. doi:10.1111/iar.12064
Moridis, G. J., Collett, T. S., Boswell, R., Kurihara, M., Reagan, M. T., Koh, C., et al. (2009). Toward Production from Gas Hydrates: Current Status, Assessment of Resources, and Simulation-Based Evaluation of Technology and Potential. Spe Reservoir Eval. Eng. 12 (5), 745–771. doi:10.2118/114163-pa
Moridis, G. J., Kowalsky, M. B., Pruess, K., and Lawrence Berkeley Nat, L. (2005). Depressurization-Induced Gas Production from Class-1 Hydrate Deposits. Spe Reservoir Eval. Eng. 10 (5), 458–481. doi:10.2118/97266-MS
Muraoka, M., Ohtake, M., Susuki, N., Yamamoto, Y., Suzuki, K., and Tsuji, T. (2014). Thermal Properties of Methane Hydrate-Bearing Sediments and Surrounding Mud Recovered from Nankai Trough wells. J. Geophys. Res. Solid Earth 119 (11), 8021–8033. doi:10.1002/2014jb011324
Sharqawy, M. H., Lienhard, J. H., and Zubair, S. M. (2012). Thermophysical Properties of Seawater: a Review of Existing Correlations and Data. Desalination Water Treat. 16 (1-3), 354–380. doi:10.5004/dwt.2010.1079
Sloan, E. D. (2003). Fundamental Principles and Applications of Natural Gas Hydrates. Nature 426 (6964), 353–359. doi:10.1038/nature02135
Song, Y., Cheng, C., Zhao, J., Zhu, Z., Liu, W., Yang, M., et al. (2015). Evaluation of Gas Production from Methane Hydrates Using Depressurization, thermal Stimulation and Combined Methods. Appl. Energ. 145, 265–277. doi:10.1016/j.apenergy.2015.02.040
Sun, Y., Li, S., Lu, C., Liu, S., Chen, W., and Li, X. (2021). The Characteristics and its Implications of Hydraulic Fracturing in Hydrate-Bearing Clayey silt. J. Nat. Gas Sci. Eng. 95, 104189. doi:10.1016/j.jngse.2021.104189
Waite, W. F., Santamarina, J. C., Cortes, D. D., Dugan, B., Espinoza, D. N., Germaine, J., et al. (2009). Physical Properties of Hydrate-Bearing Sediments. Rev. Geophys. 47 (4). doi:10.1029/2008rg000279
Waite, W. F., Stern, L. A., Kirby, S. H., Winters, W. J., and Mason, D. H. (2007). Simultaneous Determination of thermal Conductivity, thermal Diffusivity and Specific Heat in sI Methane Hydrate. Geophys. J. Int. 169 (2), 767–774. doi:10.1111/j.1365-246X.2007.03382.x
Xu, T., Zhang, Z., Li, S., Li, X., and Lu, C. (2021). Numerical Evaluation of Gas Hydrate Production Performance of the Depressurization and Backfilling with an In Situ Supplemental Heat Method. ACS Omega 6 (18), 12274–12286. doi:10.1021/acsomega.1c01143
Xu, W., and Ruppel, C. (1999). Predicting the Occurrence, Distribution, and Evolution of Methane Gas Hydrate in Porous marine Sediments. J. Geophys. Res. 104 (B3), 5081–5095. doi:10.1029/1998jb900092
Yamamoto, K., Kanno, T., Wang, X.-X., Tamaki, M., Fujii, T., Chee, S.-S., et al. (2017). Thermal Responses of a Gas Hydrate-Bearing Sediment to a Depressurization Operation. RSC Adv. 7 (10), 5554–5577. doi:10.1039/C6RA26487E
Yamamoto, K., Terao, Y., Fujii, T., Ikawa, T., and Seki, M. (2014). “Operational Overview of the First Offshore Production Test of Methane Hydrates in the Eastern Nankai Trough,” in Offshore Technology Conference 2014 (Houston, Texas, USA: OnePetro). doi:10.4043/25243-ms
Yang, L., Zhao, J., Liu, W., Yang, M., and Song, Y. (2015). Experimental Study on the Effective thermal Conductivity of Hydrate-Bearing Sediments. Energy 79, 203–211. doi:10.1016/j.energy.2014.11.008
Yang, L., Zhao, J., Wang, B., Liu, W., Yang, M., and Song, Y. (2016). Effective thermal Conductivity of Methane Hydrate-Bearing Sediments: Experiments and Correlations. Fuel 179, 87–96. doi:10.1016/j.fuel.2016.03.075
Ye, J.-l., Qin, X.-w., Xie, W.-w., Lu, H.-l., Ma, B.-j., Qiu, H.-j., et al. (2020). The Second Natural Gas Hydrate Production Test in the South China Sea. China Geology. 3, 197–209. doi:10.31035/cg2020043
Keywords: natural gas hydrate, free gas proportion, thermodynamic analysis, heat transfer, hydrate production
Citation: Li S, Sun Y, Lu C, Chen W, Liu S, Chen L and Li X (2022) A Thermodynamic Method for the Estimation of Free Gas Proportion in Depressurization Production of Natural Gas Hydrate. Front. Earth Sci. 10:859111. doi: 10.3389/feart.2022.859111
Received: 20 January 2022; Accepted: 07 March 2022;
Published: 30 March 2022.
Edited by:
Jinan Guan, Guangzhou Institute of Energy Conversion (CAS), ChinaReviewed by:
Lele Liu, Qingdao Institute of Marine Geology (QIMG), ChinaZhichao Liu, China University of Geosciences Wuhan, China
Guangrong Jin, Guangzhou Institute of Energy Conversion (CAS), China
Copyright © 2022 Li, Sun, Lu, Chen, Liu, Chen and Li. This is an open-access article distributed under the terms of the Creative Commons Attribution License (CC BY). The use, distribution or reproduction in other forums is permitted, provided the original author(s) and the copyright owner(s) are credited and that the original publication in this journal is cited, in accordance with accepted academic practice. No use, distribution or reproduction is permitted which does not comply with these terms.
*Correspondence: Shouding Li, bHNkbHloQG1haWwuaWdnY2FzLmFjLmNu