 Gui Zhao
 Yanguang Liu
 Longhua Hu4
 Kai Bian
 Feng Liu
94% of researchers rate our articles as excellent or good
Learn more about the work of our research integrity team to safeguard the quality of each article we publish.
Find out more
ORIGINAL RESEARCH article
Front. Earth Sci. , 18 May 2022
Sec. Solid Earth Geophysics
Volume 10 - 2022 | https://doi.org/10.3389/feart.2022.858748
This article is part of the Research Topic Fluid and Heat Transfer in Unconventional Reservoirs View all 15 articles
The detection of the depth and temperature of deep geothermal reservoirs suffers great uncertainty if it is completed using the simple combination of traditional geophysical and geochemical methods. Given this, this study investigated the combined utilization of multiple methods including the multi-information joint detection using the controlled source audio frequency magnetotellurics (CSAMT) method and geothermometers in the Qutan geothermal field. First, the reservoir temperature and the depth of geothermal water circulation in the geothermal field were estimated using the geochemical method. Afterward, the relationship between the CSAMT resistivity and temperature of strata was explored through borehole temperature measurement. Based on this, the depth and temperature of geothermal reservoirs in the geothermal field were estimated again. According to the comprehensive analysis and comparison of the thermal reservoir temperatures and depths obtained using the two methods, the shallow reservoirs in the Qutan geothermal field have a top burial depth of approximately 423 m, a thickness of about 300 m, a temperature of about 79°C, and a fluid circulation depth of about 1959 m.
Geothermal resources are greatly potential clean energy with zero carbon emissions (Long et al., 2021; Long et al., 2022). Usually, these geothermal reservoirs are buried deep in the ground, and it is difficult to predict their depth, thickness, and temperature. Accurately determining these characteristics of thermal reservoirs in advance can greatly increase the rate of drilling and reduce the extraction costs of geothermal resources. At present, geophysical methods such as CSAMT that are used to detect formation depth and thickness cannot directly reflect the distribution of reservoir temperature (Wu et al., 2012; Hu et al., 2013). Although geothermometers and other geochemical methods can be used to calculate the temperatures of deep geothermal reservoirs through inversion, they are difficult to determine the burial depth of geothermal reservoirs (Zhou et al., 2008; Huang et al., 2017). However, the two different types of methods can be used in combination to detect the depths and temperatures of geothermal reservoirs with improved accuracy (Wang et al., 2020).
CSAMT is a method commonly used in geothermal exploration (Li et al., 2016; Cao et al., 2018; Cui et al., 2018; Dong et al., 2018). It can be used to investigate shallow geothermal reservoirs at depths of less than 2000 m (Aykaç, et al., 2015; Basokur et al., 1997). In comparison with other electromagnetic methods such as high-density resistivity and transient electromagnetics, CSAMT is better suited for identifying deep strata, electrical anomalies, and geothermal reservoir depth (Pellerin et al., 1996; Xiong and Mao 2005; Wu et al., 2014). Remarkable achievements have been made in the relationship between CSAMT and formation temperature. Former Soviet scientist Γ.A. Cheremensky (1982) revised the general variation law between formation temperature and formation resistivity and established a corresponding expression. The study of Meng Yinsheng et al. (2011) indicated that formation resistivity is closely related to groundwater salinity and temperature and that formation resistivity is significantly affected by the changes in temperature when the groundwater salinity is low. Based on these findings, they developed the CSAMT resistivity-temperature method, by which they successively determined the geothermal reservoir temperature of a geothermal field in Beijing through inversion. Meng Yinsheng et al. (2010) used the resistivity-temperature method and obtained the temperature of deep geothermal resources through the inversion using CSAMT resistivity. The obtained temperature was roughly consistent with the measured temperature of geothermal wells. Therefore, the resistivity-temperature method can improve the exploration accuracy of deep geothermal reservoirs.
In actual exploration, the temperature of thermal reservoirs is usually predicted using geophysical detection combined with geothermometers to improve the detection accuracy of geothermal reservoir characteristics (Yan et al., 2018). Geothermometers, generally including cationic geothermometers and silica geothermometers, are widely used in the estimation of geothermal reservoir temperature (Giggenbach et al., 1994; Zhang et al., 2015; Ba et al., 2018). Barcelona et al. (2019) estimated the temperature of the Gollette geothermal field using cation geothermometers, and the estimates were consistent with the results obtained using multiple mineral equilibrium diagrams. Xu et al. (2019) considered silica geothermometers more suitable for the estimation of geothermal reservoir temperature than the silica-enthalpy mixing model and used them to estimate the temperature of the Xi’an geothermal field. Sun et al. (2015) used the SiO2 solubility curve to determine the minerals in a solution that controlled the SiO2 concentration and further effectively estimated the geothermal reservoir temperature. By using the Na-K-Mg ternary diagram, Zhao et al. (2018) demonstrated that the geothermal water in Batang had not reached the ionic equilibrium state and revealed the formation water salinity, both of which play an important role in further study of the relationship between formation resistivity and temperature.
Taking into consideration the findings of previous research on the subject, this study further investigated the formation resistivity-temperature method. Firstly, the geothermal reservoir temperature and the depth of geothermal water circulation were estimated using a geochemical method. Then, the relationship between the CSAMT resistivity and temperature of geothermal reservoirs was explored using the borehole temperature measurement. Finally, the depth and temperature of the geothermal reservoirs in the Qutan geothermal field were estimated. As the results presented in this paper suggest, this method can improve the detection accuracy of geothermal reservoirs.
The Jinggang Mountains are located in the northern part of the South China Fold Belt. They border the Cathaysia and Yangtze plates, are next to the Shaoxing-Jiangshan-Pingxiang fault zone in the north, and are connected to the Ganjiang fault zone in the east (Figure 1). The Qutan geothermal field lies in the southwestern part of the Jinggang Mountains. Over time, the Qutan area has formed a complicated geological structure pattern, which consists of the following four types of structures according to their main distribution directions, namely NE-trending structures, NS-trending structures, NEE-trending structures, and NS-trending structures. Of them, the NE-trending structures are the most developed. They are dominated by the Huang’ao fault, which extends northeastward and is 50–400 m wide. A silicified fractured zone has developed in the Huang’ao fault and constantly narrows from southwest to northeast.
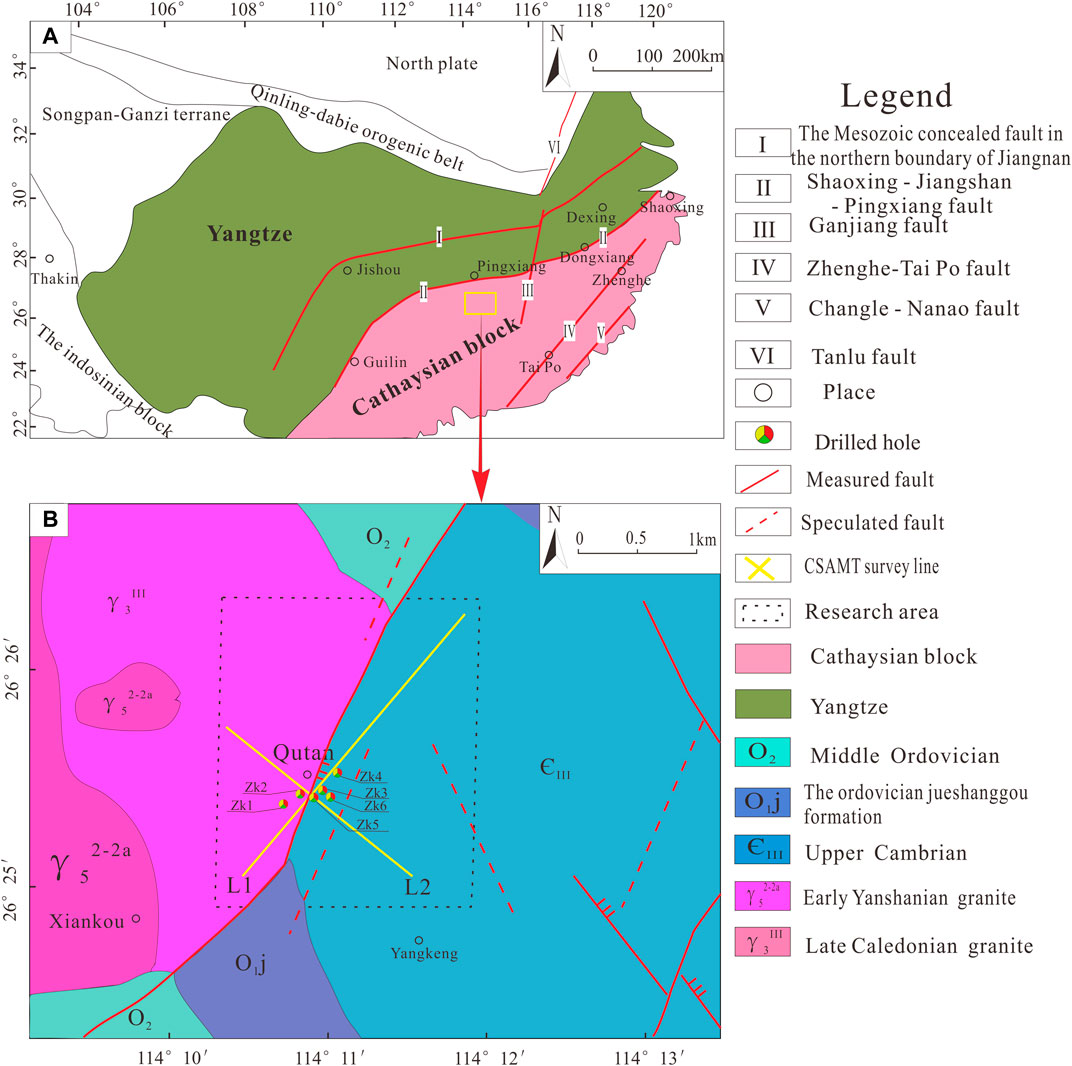
FIGURE 1. Geological sketch and borehole layout of the Qutan area in Jinggangshan. (A) is derived from the literature (Wang et al., 2013). (B) belongs to the local large-scale geological map.
The western part of the study area is composed of Caledonian and Yanshanian granites. Ordovician and Cambrian slates and sandstones mainly comprise the eastern and southern parts. Part of the area is composed of Quaternary clays and sandy gravels. Because of the diversity of lithologic characteristics, the resistivity of rocks in this area greatly differs (Table 1). The Quaternary clays and sandy gravels in the study area have low resistivity, which is about 20–80 Ω m. The Ordovician-Cambrian metamorphic sandstones have average resistivity of about 1,136 Ω m and a the resistivity range of 928–1,345 Ω m. The biotite granites have average resistivity of 4,267 Ω m, which greatly differs from that of metamorphic sandstones. However, their resistivity varies in a wider range of 563–7,971 Ω m. The silicified zone has the highest average resistivity of 16,674 Ω m, and its range of variation is even wider than those of the abovementioned rocks. The resistivity of the various rocks is significantly different from that of the silicified zone. This difference is conducive to the detection of fault structures and provides a basis for determining the geothermal reservoir locations.
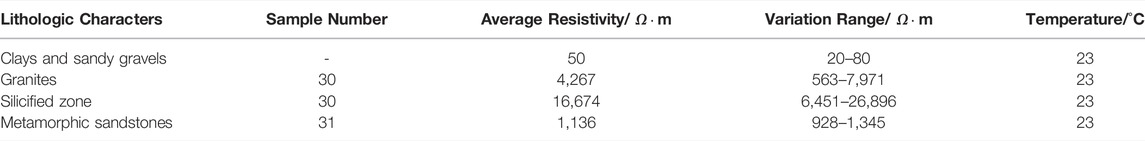
TABLE 1. List of physical properties of rock specimens.
Relevant content has been added according to this comment. Bedrock fissure water is dominant in the Qutan area, with water-bearing rocks consisting of clastic rocks, epimetamorphic rocks, and granites. Bedrock fissure water in this area is primarily recharged by atmospheric precipitation or laterally recharged by bedrock fissures. It is exposed in the form of springs or discharged to the ground surface in the form of undercurrents. The bedrock fissure water has hydrochemical facies of mainly HCO3-K + Na type, pH of less than 7, and salinity of 70–120 mg/L. Therefore, it is freshwater.
Geothermal wells are described as follows (Figure 1). Representative geothermal wells in the study area include ZK2 and ZK5. The two wells are close to each other and slightly differ in strata. The lithology revealed by well ZK2 includes brownish-yellow gravel layer, grayish-white and brownish-yellow coarse-grained biotite granites, gray and light gray siliceous breccias, and grayish-black metamorphic sandstones from top to bottom. The lithology revealed by well ZK2 provides an important scientific basis for the CSAMT results.
No hot spring is exposed in the Jinggangshan area. The complex geological structures in this area create difficulties for the detection of geothermal reservoirs. The geothermal exploration in the Qutan area has also undergone a long process, until wells ZK3, ZK5, and ZK6 at the intersections of the Huangao fault and the NW-trending fault revealed geothermal water with a temperature of 38–42 C (Figure 1). These three wells have a depth of 377.85, 446, and 450.2 m, respectively. This discovery lays a foundation for the geothermal surveys in Qutan and even the Jinggangshan area.
The GDP-32 controllable source audio magnetotelluric acquisition system produced by the ZONGE company of the United States was adopted for CSAMT sounding in this study. It had an effective acquisition frequency of 0.125–8,192 Hz and an exploration depth of 1,500 m. The CSAMT data processing process is shown in Figure 2. First, conduct smoothing and interpolation of mutation data under constraints of adjacent measuring points. Second, conduct static displacement correction and topographic correction based on the known geological data, sections, and topographic relief and establish a primary model using appropriate inversion parameters selected. Finally, adopt a smooth inversion program to reduce the errors caused by initial parameters that were artificially set by referring to one-dimensional resistivity inversion. Since CSAMT is restricted by the transmitting power, near-field effect tends to occur. Therefore, man-machine interaction was adopted in the data processing in this study.

FIGURE 2. CSAMT data processing flow.
Two CSAMT survey lines (i.e., L1 and L2) were deployed in the study area and each of them had a length of 5 km. A total of 102 measuring points were set, with an interval of 50 m. L1, which ran parallel to the Huangao fault, was mainly used to detect the distribution of Yanshanian granites and their surrounding secondary faults. L2, which ran vertically along the Huangao fault, was primarily used to explore the distribution of the Huangao fault and Yanshanian granites and their surrounding secondary faults (Figure 1).
Relevant content has been added according to this comment. Geothermal water samples were obtained from previous literature. They were divided into two groups numbered ZK2 and ZK5. Samples for total chemical analysis were collected using 2.5 L plastic bottles. The total chemical analysis of water samples was completed as per GB/T8538-2008 Methods for Examination of Drinking Natural Mineral Water at the Nanchang Supervision Testing Center for Mineral Resources, the Ministry of Land and Resources.
In terms of lithology, the study area mainly shows the distribution of granites, metamorphic sandstones, and well-developed silicification zones, for each of which at least 30 samples of physical properties were studied (Table 1). The resistivity was measured using instrument Sample Core IP Tester (SCIP) produced by the Canadian manufacturer Instrumentation GDD Inc. The resolution and accuracy were 1 μV and 0.2%, respectively for the voltage measurement, were 1 nA and 0.2%, respectively for the current measurement, and were 1 nV/V and 0.3%, respectively for the polarizability measurement. Spot checks were conducted for 91 samples. The samples that were repeatedly measured in spot checks accounted for 4.8% of the total samples, with a relative error of resistivity of 6.4%. Therefore, the measurement in this study met the requirements of DD 2006-03 Technical Regulations for Physical Property Investigation of Rocks.
The Na-K-Mg ternary diagram is used to determine the equilibrium state of geothermal water, namely fully equilibrated waters, partially equilibrated water, and immature water (Fahrurrozie et al., 2015). It can be used to assess the equilibrium state between geothermal water and its surrounding rock and predict the mixing trend of them. This study adopted the Na-K-Mg ternary diagram to determine the equilibrium state and the salinity of geothermal water, thus laying a foundation for development of the resistivity-temperature method and geothermometers.
The Na-K-Mg ternary diagram is mainly based on two chemical reactions (Shi et al., 2019): namely (1) NaAlSi3O8+K+ = KalSi3O8+Na+ and (2) 2.8 KAlSi3O8+1.6H2O + Mg2+ = 0.8 mica +0.2 chlorite +5.4SiO2+2K+. When the reactions (1) and (2) reach the water-rock equilibrium state, Na+ and K+concentrations remain stable. When the local geothermal water flows upward to the ground surface, the temperature of the geothermal water decreases, the equilibrium state is broken, and Na+ and K+ concentrations enter an equilibrated state. When a new equilibrium state is reached, Na+ and K+ are partially balanced.
Massive previous studies have found that temperature changes have a significant influence on formation resistivity (Du, 2011). The general variation between rock resistivity and rock temperature can be expressed by the following equation.
where ρ0 is the resistivity when the formation temperature is 20 °C, and it is considered the approximate initial value of formation resistivity; ρt is the resistivity when the formation temperature is T°C, and it is the surveyed resistivity; α is the rock temperature coefficient, which is usually set at 0.02 and is actually determined using drilling data.
The expression of the geothermal reservoir temperature can be obtained by transforming Eq. 1 into the following.
Formation resistivity can be obtained through inversion using the CSAMT sounding results. Strata can be divided into multiple areas using existing drilling data. After setting the initial resistivity values of various areas and the rock temperature coefficient, the temperature of geothermal reservoirs can be calculated using Eq. 2.
Geothermometers can be used to assess the temperature of a deep geothermal reservoir using an empirical formula representing the relationship between the contents of some chemical components in geothermal fluids and the deep reservoir temperature. The general principle of a geothermometer is as follows. Some chemical components in deep geothermal fluid reach a dissolution equilibrium state with surrounding rocks. During the upwelling of geothermal water, the temperature of geothermal water decreases but the chemical composition of geothermal water remains almost unchanged (Yan, et al., 2019).
In this study, the Na-K-Mg ternary diagram was used to exclude cation geothermometers. Then, the chalcedony geothermometer was selected according to the SiO2 dissolution curve.
The dissolution of SiO2 is mainly controlled by quartz, chalcedony, and amorphous silica. The SiO2 dissolution curve can be used to determine the minerals that control the SiO2 content of a solution, which serves as a basis for the selection of quartz or chalcedony geothermometers. Using this method, this study concluded that the SiO2 content of the geothermal water in the Qutan area is mainly controlled by chalcedony. Therefore, it is suitable to select chalcedony geothermometers to estimate the geothermal reservoir temperature in the Qutan area. The formula applied in chalcedony geothermometers is Eq. 3.
where T is the estimated geothermal reservoir temperature (°C) and
The formula of SiO2 content is Eq. 4.
where
At present, the commonly used methods for calculating the depth of geothermal fluid circulation include the formula method (Gan et al., 2019) and the isotope method. Since the temperature measurement curves of the study area were collected in this study, the authors used the formula method to calculate the depth of geothermal water circulation. The formula for depth of geothermal water circulation is Eq. 5.
where Z is the depth of geothermal water circulation (m); G is the geothermal degree (i.e., the reciprocal of geothermal gradient;
Two CSAMT survey lines were deployed in the study area, namely L1 and L2 (Figure 1). The two lines are perpendicular to each other, and their intersection is located in the Qutan geothermal field, where four geothermal wells were drilled, namely, ZK1, ZK2, ZK4, and ZK5. Integrated interpretations were carried out for the two survey lines based on the two-dimensional inversion results of resistivity and frequency, as well as existing drilling data. The sections obtained from the two-dimensional integrated interpretation of the two lines are shown in Figures 3, 4. Figures 3, 4 show the NE- and SW-trending underground lithologic distribution and local structures in the Qutan geothermal field, respectively, in order to further reveal the distribution of strata and underground structures in the study area. Overall, the study area shows simple rock masses, and the deep bedrock and surrounding rocks are roughly dominated by granites and metamorphic sandstones. The Huangao fault is noticeably distributed, and the secondary faults are distributed in a staggered manner.
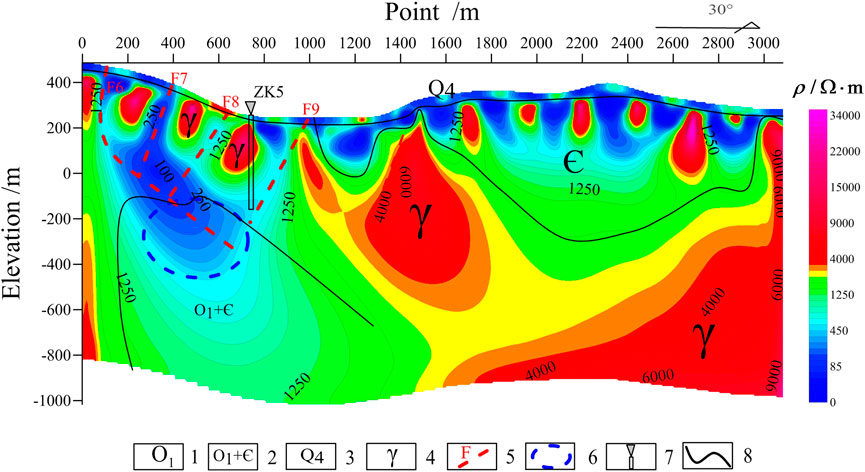
FIGURE 3. CSAMT integrated interpretation section of survey line L1. 1-Ordovician; 2-Lower Ordovician-Cambrian; 3-Quaternary; 4-Granite; 5-inferred secondary fault; 6-inferred geothermal reservoir; 7-borehole; 8-inferred contact zone.
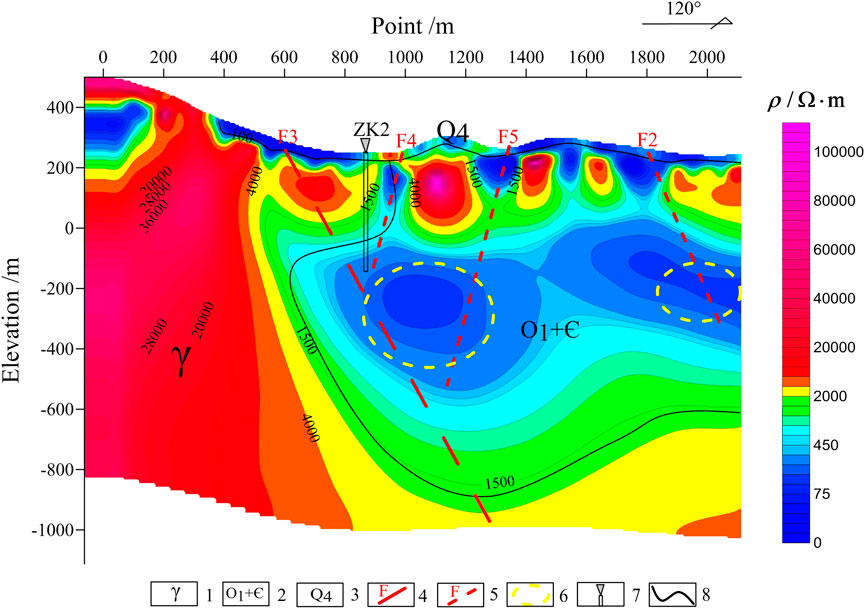
FIGURE 4. CSAMT integrated interpretation section of survey line L2. 1-Granite; 2-Lower Ordovician-Cambrian; 3-Quaternary; 4-inferred Huangao fault; 5-inferred secondary fault; 6-inferred geothermal reservoir; 7-borehole; 8-inferred contact zone.
The CSAMT integrated interpretation section of survey line L1 is a simple two-layer geoelectric structure (Figure 3). The low resistivity bodies on the ground surface along this section are inferred to be the Quaternary overlying layer and weathered layer. In the shallow part, faults are relatively developed and prominent high resistivity strata are distributed in the southwest. The high resistivity strata in the shallow part are inferred to be composed of Ordovician granites. The deep medium-high resistivity of 2,500–30,000 Ω m is induced by complete and dense Cambrian- Ordovician metamorphic sandstones, slates, and granites. In addition, this section shows apparent vertical zoning. The resistivity of points with low numbers (0–100) determined through inversion is greater than 1,500 Ω m, and the corresponding high resistivity bodies are inferred to be granites. The low resistivity areas in the middle part of points with high numbers (100–3,000) are speculated to be composed of carbonaceous slates and metamorphic sandstones. The surrounding areas of points Nos. 50–100, 400–450, 700–750, and 950 show a low resistance zone. The electrical characteristics on both sides of the low resistance zone show a distinct boundary and clear characteristics of an anomaly zone, which is inferred to comprise secondary faults F6, F7, F8, and F9.
Deep rock masses in the study area serve as geothermal sources, and the secondary faults are the rising channels of geothermal water. It can be inferred that the geothermal reservoirs in the study area lie in the low resistance area of points Nos. 350–800, which corresponds to an elevation of −200 to −500 m.
The CSAMT integrated interpretation section of survey line L2 is also a simple two-layer geoelectric structure (Figure 4). The high resistivity bodies at points with small numbers (−50–1,000) are inferred to be composed of granites. The low resistance area of points with high numbers (1,000–2,100) is inferred to consist of carbonaceous slates or metamorphic sandstones. The deep high resistance area is composed of granites, with resistivity of 2,500–100,000 Ω m. Intensive gradient anomaly zones occur near points Nos. 650–700, 1,000, 1,350, and 1,800. They show distinct characteristics and are inferred to be secondary faults F2, F4, F5, and Huangao fault F3. Points Nos. 800–2000 correspond to two low resistance area at the elevation of -100 to -400 m. This area is composed of broken rocks, enjoys favorable aquiferous conditions, and thereby is inferred to be a favorable part of geothermal reservoirs.
The following conclusions can be drawn from the analysis of the above two sections and existing drilling data.
(1) The faults in the study area primarily consist of the Huangao fault and multiple parallel secondary faults.
(2) Low-resistivity traps occur at the intersections of faults, and the overlying metamorphic sandstones and granites provide moderate thermal insulation conditions. The Huangao fault and multiple secondary faults are interlaced, providing water channels for the accumulation of geothermal reservoirs. Therefore, it can be inferred that fault intersections are favorable positions for the accumulation of geothermal reservoirs.
(3) The geothermal reservoirs revealed by the CSAMT integrated interpretation section of L1 have a top burial depth of 430 m and a thickness of about 280 m. The geothermal reservoirs revealed by the CSAMT integrated interpretation section of L2 have a top burial depth of t 415 m and a thickness of about 320 m. The horizontal projection centers of the geothermal reservoirs revealed by the two sections are only 300 m apart. Therefore, the burial depth and thickness of the geothermal reservoirs in the Qutan area can be considered the average depth and thickness of the geothermal reservoirs revealed by the two sections. That is, the shallow geothermal reservoirs in the Qutan area determined by CSAMT have a burial depth of 423 m and a thickness of 300 m.
The salinity of geothermal water is closely related to the water-rock equilibrium state. The water-rock equilibrium state indicates stronger water-rock interactions and higher salinity of geothermal water compared to the non-equilibrium state. The Na-K-Mg ternary diagram is an effective tool for determining the water-rock equilibrium. Table 2 shows the chemical analysis results of geothermal water from wells ZK2 and ZK5 (Yang et al., 2018). The salinity of geothermal water from ZK2 and ZK5 is 233.05 mg/L and 283.57 mg/L, respectively. The Na-K-Mg ternary diagram in Figure 5 shows that the sodium and potassium feldspars in the geothermal water from both wells are in the area of unequilibrated water, indicating that the geothermal water in both wells is in the primary stage of water-rock interactions and has not yet reached an equilibrium state.
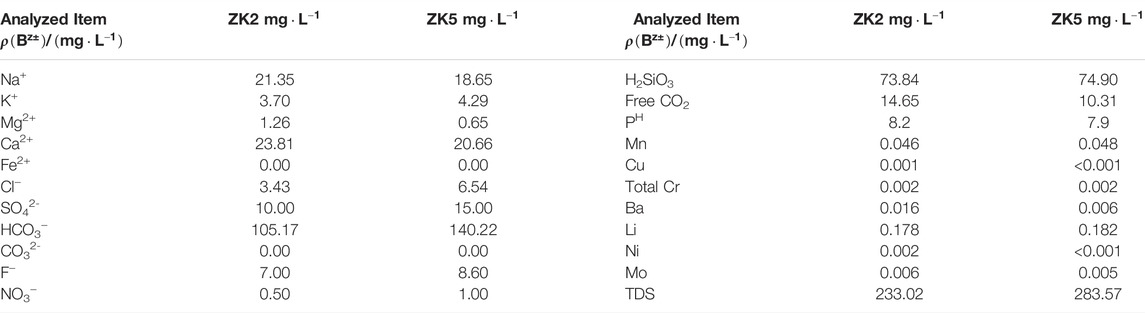
TABLE 2. Results of chemical analysis of the geothermal water in wells ZK2 and ZK5.
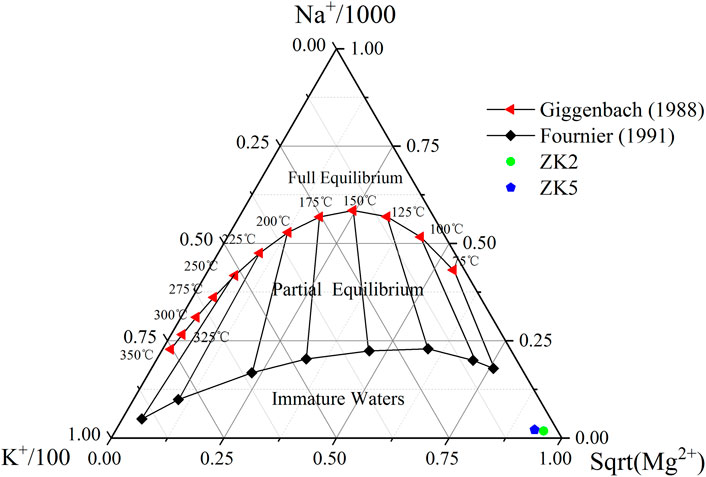
FIGURE 5. Na-K-Mg ternary diagram.
The resistivity of geothermal reservoirs mainly depends on the lithology, porosity, groundwater salinity, and ambient temperature of strata. For a geothermal field with a small exploration scope, it can be assumed that the lithology, porosity, and groundwater salinity of the deep strata remain unchanged. In this case, the resistivity of the geothermal reservoirs is only related to temperature and the broken degree of formation (Zhang et al., 2011). With an increase in temperature, the density and viscosity of groundwater decrease and the solubility of groundwater increases. As a result, the salinity and ionic activity of groundwater increase and the resistivity of groundwater decreases. Therefore, the increasingly high temperature indicates increasingly low resistivity for the same fractured zone. Overall, the resistivity of geothermal reservoirs contains information about the broken degree of formation and the temperature and salinity of groundwater.
The formation resistivity is closely related to groundwater salinity and temperature. Deng et al. (2000) determined the relationships between the resistivity of water-bearing rock samples, temperature, and the salinity of aqueous solution through experiments (Figure 6). According to Figure 6A, under the same temperature, the resistivity of water-bearing rock samples decreases with an increase in the salinity of the aqueous solution. However, when the salinity of the aqueous solution reaches a certain value, the increase in the salinity of the aqueous solution has an increasingly weak influence on the resistivity of water-bearing rock samples. Under the same salinity of the aqueous solution, the resistivity of water-bearing rock samples decreases with an increase in temperature. However, when the temperature reaches a certain value, the increase in the temperature has an increasingly weak influence on the resistivity of water-bearing rock samples.
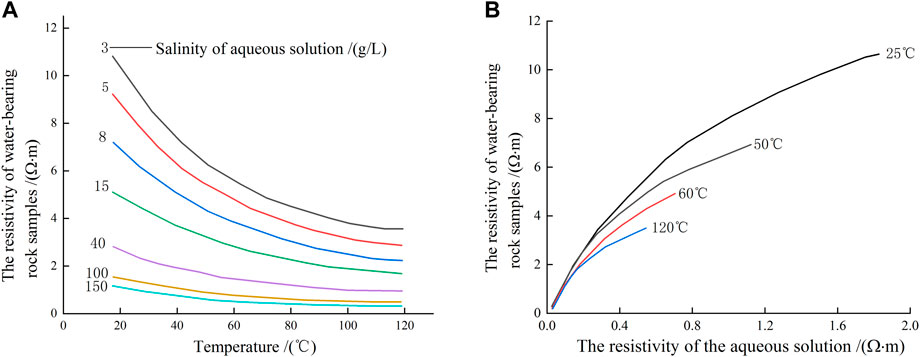
FIGURE 6. Relationship curves of the resistivity of water-bearing rock samples, temperature, and the salinity of aqueous solution. (A) is the relationship curves of temperature and resistivity of water-bearing rock sample under different salinity of aqueous solution. (B) is the relationship curves of the resistivity of aqueous solution and the resistivity of water-bearing rock samples at different temperatures.
As Figure 6B shows, under the same resistivity of the aqueous solution, the resistivity of water-bearing rock samples decreases significantly with an increase in temperature. The Na-K-Mg ternary diagram (Figure 5) and Table 2 indicate unequilibrated geothermal water and low water-rock interactions in the study area. Therefore, the groundwater salinity is also low. The salinity values fall in the area where formation resistivity is sensitive to temperature change. Therefore, the formation resistivity in the study area is significantly affected by temperature change.
The formation lithology and groundwater salinity in different regions show complex changes. Therefore, the resistivity-temperature calculation results are difficult to compare between different regions. To obtain an accurate temperature distribution of a geothermal field, it is necessary to select a small-scale fault zone to conduct the geothermal exploration. Assuming that the study area has the same geological conditions and similar groundwater salinity, the resistivity-temperature calculation method was used for geological interpretation.
For the inversion of geothermal reservoir temperature using resistivity, it is necessary to understand the lithological distribution along sections and the initial and surveyed resistivity of lithological layers. The L1 and L2 sections (Figures 3, 4) reveal that the strata in the study area include the Quaternary and weathered crusts and Cambrian-Ordovician metamorphic sandstones and granites from young to old ages. The L1 and L2 sections can be divided into three regions (I-III) according to lithological differences. Specifically, region I is composed of Quaternary sandy gravels and weathered crusts, weathered crustregion II consists of metamorphic sandstones, and region III is comprised of granites (Figures 7, 8).
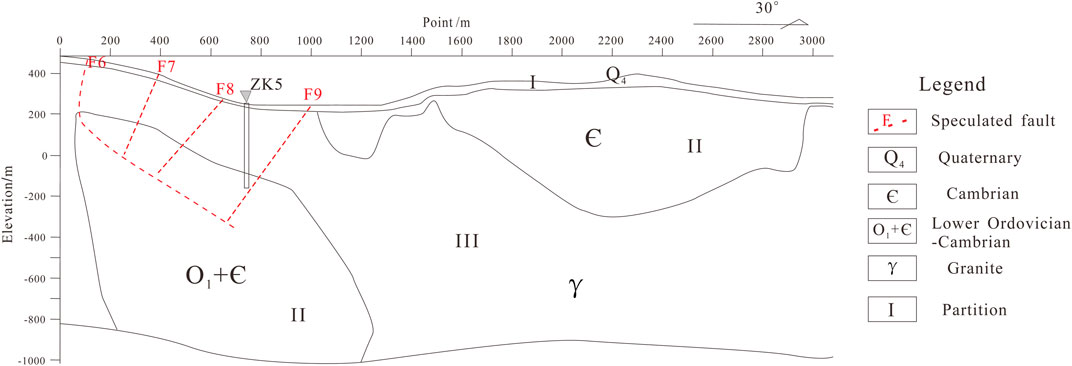
FIGURE 7. CSAMT integrated interpretation section of survey line L1 and its regions.
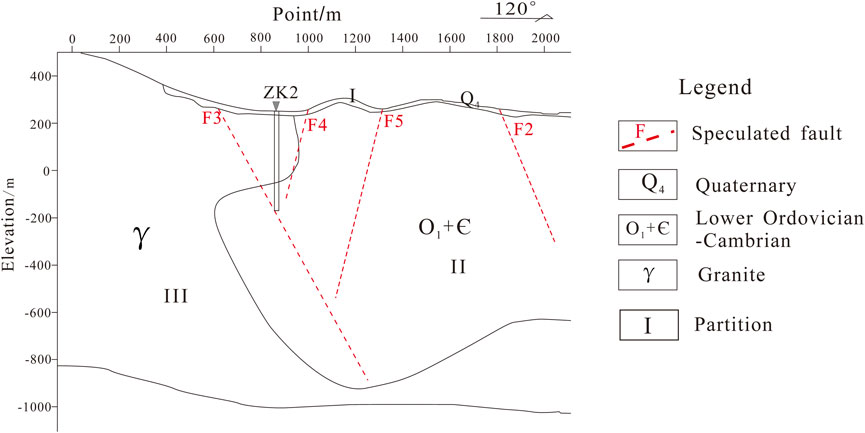
FIGURE 8. CSAMT integrated interpretation section of survey line L2 and its regions.
As shown in the list of the physical properties of rock specimens (Table 1), the initial formation resistivity (ρ0) at 23 °C is as follows: Quaternary and weathered crust: 50 Ω m; metamorphic sandstones: 1,136 Ω m, and granites: 4,267 Ω m. The rock temperature coefficient (α) was set at 0.04 based on available borehole temperature. In practical applications, the initial resistivity of a region tends to be set at the average resistivity of the region’s various partitions. For regions where the resistivity gradually increases with an increase in depth, their initial resistivity at different depths is calculated using the linear interpolation method in order to eliminate the influence of depth change. The initial resistivity of other regions are is at the average resistivity of various portions and is appropriately adjusted based on existing rock resistivity and borehole temperatures. Based on the resistivity obtained through the CSAMT inversion of survey lines L1 and L2, initial resistivity, and temperatures obtained by applying Eq. 2, the temperature sections of L1 and L2 survey lines were obtained using the geology software Surfer (Figures 9, 10).
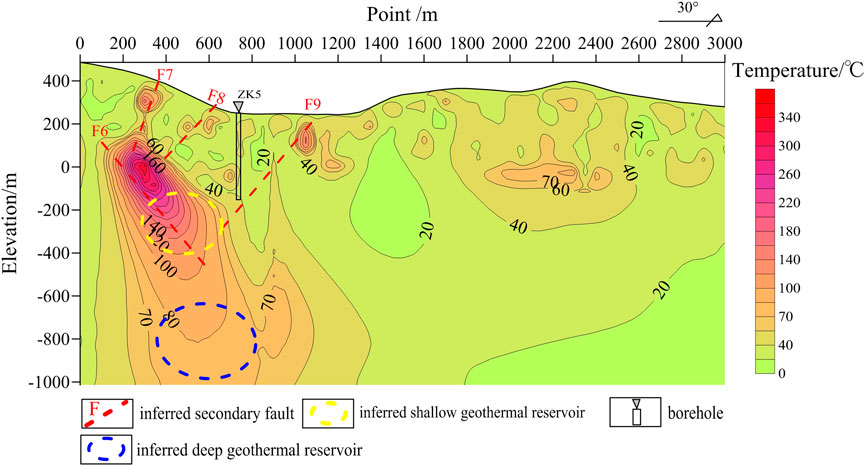
FIGURE 9. Temperature section of survey line L1.
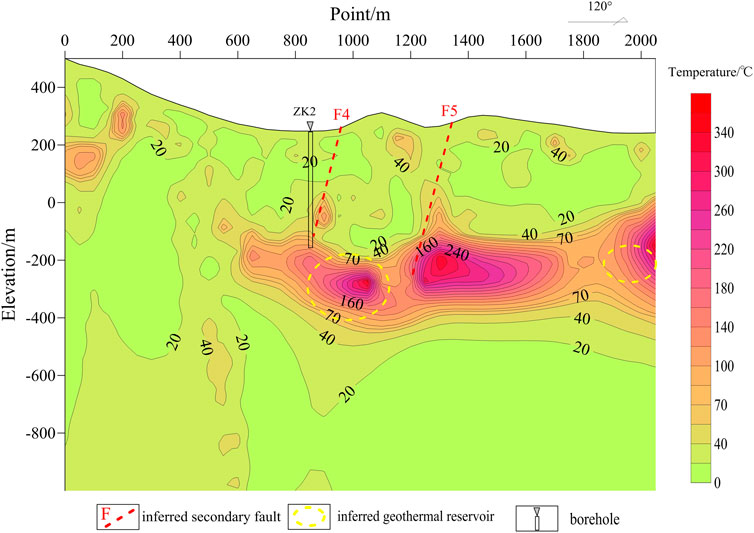
FIGURE 10. Temperature section of survey line L2.
As shown in Figure 9, the shallow surface of the temperature section of L1 shows high temperature, which is caused by the Quaternary and weathered crust according to the CSAMT integrated interpretation section of L1. The temperatures near points Nos. 400, 600, and 1,100 are high and continue deep downward, for which the possible reasons are as follows. These points are located near faults F7, F8, and F9. Therefore, they have broken rocks and high water content. Correspondingly, the resistivity decreases, and the temperature increases at these points, which conforms to the resistivity-temperature method. Two high-temperature zones exist in areas with surface point nos. of 400–800 at elevations of 0–800 m. One zone has a temperature of 120–160°C, which is greatly different from the bottom temperature of well ZK5 (36.7°C). This great difference possibly results from the low resistivity caused by faults and the intense surface water seepage. The other high-temperature zone has a temperature of 70–80°C, which is higher than the bottom temperature of well ZK5. The possible reason for this difference is the relatively low resistivity caused by relatively broken rocks.
As seen in Figure 10, the temperature anomalies reflect a noticeable geothermal reservoir structure, and the temperatures near fault fracture zones show high values. Points Nos. 800–2000, which correspond to an elevation of −200 to −400 m, show high temperatures (160–200°C). This result is consistent with low resistivity revealed by the CSAMT integrated interpretation section of L2. However, this high temperature is quite different from the bottom temperature of well ZK2 (35.6°C), which is likely affected by faults and surface water infiltration. Banded high temperatures are present near Points Nos. 1,000 and 1,400. They are formed by faults F4 and F5 revealed by the CSAMT integrated interpretation section of L2. The deep part of the L2 line temperature profile shows overall temperature of 0–40°C. This occurs because the area is close to the deep granite area, resulting in a higher resistivity of 2000–4,000, which leads to a decrease in the calculated temperatures. Therefore, this section is not suitable for obtaining geothermal reservoir temperatures through the inversion of resistivity.
At present, the most commonly used geothermometers include sodium-potassium geothermometers, quartz geothermometers, and chalcedony geothermometers (Arnórsson et al., 1983). Each type of thermometer is applicable to specific conditions. For example, because the geothermal water in the study area is undersaturated with sodium and potassium feldspars, sodium and potassium geothermometers are not suitable.
SiO2 is generally not affected by the formation and volatile component loss of other ions and complexes. As the heat flow cools, the precipitation rate of SiO2 in the heat flow decreases, but the SiO2 content of the heat flow can still indicate that of deep geothermal fluids (Xu and Guo, 2009).
The solubility curve of SiO2 can qualitatively determine the controlling minerals of SiO2 dissolution in geothermal water, which allows for selecting appropriate geothermometers. Using the solubility curve of SiO2, this study determined that the chalcedony geothermometers are suitable for the Qutan area. The temperatures measured using chalcedony geothermometers were basically consistent with the estimates of geothermal reservoir temperature obtained by resistivity inversion.
The dissolution of SiO2 in water is mainly controlled by quartz, chalcedony, and amorphous SiO2 (Ellis, 1979). Figure 11 reflects the primary minerals that affect the dissolution of SiO2 in geothermal water and thus can be used to estimate the reservoir temperature. According to this figure, the geothermal water is mostly concentrated near the chalcedony line, indicating that chalcedony plays a role in controlling the dissolution of SiO2 in geothermal water. Therefore, chalcedony may be the optimal mineral for assessing the reservoir temperature. According to Table 2, the contents of
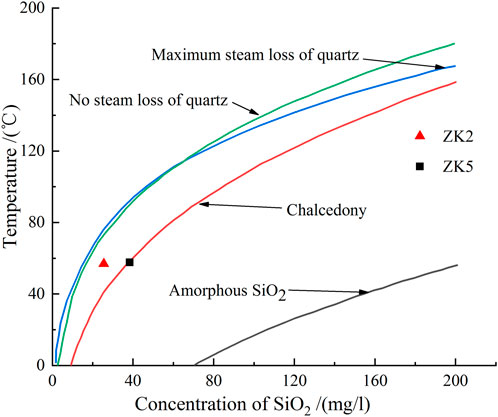
FIGURE 11. Solubility curve of SiO2.
The depth of geothermal water circulation refers to the vertical distance from the ground surface to the bottom plate of the aquiclude of deep geothermal fluids. It reflects the update speed of geothermal resources and can be used as a reference for determining the recharge-runoff-discharge characteristics of groundwater systems. In the Qutan area, the geothermal fluids tend to be warmed by deep heat sources during deep circulation (Long et al., 2019), and the geothermal water temperature is directly proportional to the circulation depth.
At present, the geothermal water circulation formula is commonly used to calculate the depth of geothermal fluid circulation (Mohammadi et al., 2010). The average annual temperature in the study area is 15°C. According to the temperature measurement curves with good linear characteristics of wells ZK1, ZK2, and ZK4 (Figure 12), the Qutan geothermal field has an average geothermal gradient of about 3.3 °C/100 m and an average geothermal degree of 30.3 m/°C. Meanwhile, the depth of the constant temperature zone was set at 20 m (Wang et al., 2015). Based on these data and the abovementioned data such as the geothermal reservoir temperature of 79°C, the depth of geothermal water circulation was determined to be 1959 m. This depth differs greatly from the top burial depth (423 m) of the Qutan shallow geothermal reservoirs obtained by the analysis of CSAMT integrated integration sections. This finding indicates that CSAMT is primarily suitable for the exploration of shallow geothermal reservoirs, while the geothermal water circulation formula can be applied to the exploration of deep geothermal reservoirs in general.

FIGURE 12. Temperature measurement curves of wells ZK1, ZK2, and ZK4.
1) As shown by the geothermal reservoir characteristics revealed by CSAMT and geochemical characteristics of geothermal fluids, the Qutan geothermal field is located at the intersection of multiple faults and has a complex geological structure and intense granite intrusion. As a deep fault, the Huangao fault intersects several secondary faults, resulting in convenient geothermal water migration. Moreover, the geothermal water migration may also be accompanied by the heat flow generated by the decay of radioactive elements in granites. The shallow geothermal reservoirs in the Qutan geothermal field have a top burial depth of 423 m, a thickness of about 300 m, a geothermal reservoir temperature of about 79°C, and a geothermal water circulation depth of 1959 m.
2) In a small-scale fault zone in the geothermal field exploration, the inversion of geothermal reservoir temperature using CSAMT resistivity can better determine the distribution of the formation temperature field. The results of this method are roughly consistent with the borehole temperature measurement results and the estimates of chalcedony geothermometers, indicating that the inversion of geothermal reservoir temperature using resistivity is feasible.
This study further verified the reliability of the inversion of geothermal reservoir temperature using CSAMT resistivity by investigating and analyzing the intrinsic relationships between hydrogeochemical and geophysical explorations and using geothermal well temperature measurements. Geophysical and geochemical explorations have both played an important role in geothermal exploration. However, the limitations of using a single exploration method are increasingly noticeable, and any single exploration method or the simple combination of exploration methods has great uncertainty in the exploration of the temperature and depth of geothermal reservoirs. Exploring the intrinsic connections between various methods and accordingly extracting the implicit stratigraphic information have become important directions for future research.
Formation lithology and groundwater salinity show complex changes and may greatly differ between different regions. It is difficult to conduct correlation and comparative analyses on the resistivity-temperature calculation results of different regions. To obtain the accurate distribution of geothermal field temperature, it is necessary to further study the selection of parameters used in the resistivity-temperature calculation formula under different geological conditions. This will also improve the operability of the resistivity-temperature calculation formula.
The original contributions presented in the study are included in the article/Supplementary Material, further inquiries can be directed to the corresponding authors.
KB: Conceptualization, Methodology. GZ: Data curation, Writing-Original draft preparation. LH: Visualization, Investigation. SQ: Supervision. FL: Project administration. YL: Writing-Reviewing and Editing.
This study was supported by S&T Program of Hebei China (No. 20374201D), Chinese Academy of Geological Sciences Fund (No. SK202104), Natural Science Foundation of Hebei province China (No. D2019330003), and Geological survey project of China (No. DD20190128).
The authors declare that the research was conducted in the absence of any commercial or financial relationships that could be construed as a potential conflict of interest.
All claims expressed in this article are solely those of the authors and do not necessarily represent those of their affiliated organizations, or those of the publisher, the editors and the reviewers. Any product that may be evaluated in this article, or claim that may be made by its manufacturer, is not guaranteed or endorsed by the publisher.
Arnórsson, S., Gunnlaugsson, E., and Svavarsson, H. (1983). The Chemistry of Geothermal Waters in Iceland. III. Chemical Geothermometry in Geothermal Investigations. Geochimica Et Cosmochimica Acta 47, 567–577. doi:10.1016/0016-7037(83)90278-8
Aykaç, S., Timur, E., Sari, C., and Çaylak, Ç. (2015). CSAMT Investigations of the Caferbeyli (Manisa/Turkey) Geothermal Area. J. Earth Syst. Sci. 124, 149–159. doi:10.1007/s12040-014-0521-1
Ba, J., Su, C., Li, Y., and Tu, S. (2018). Characteristics of Heat Flow and Geothermal fields in Ruidian, Western Yunnan Province, China. Ijht 36, 1203–1211. doi:10.18280/ijht.360407
Barcelona, H., Lelli, M., Norelli, F., Peri, G., and Winocur, D. (2019). Hydrochemical and geological model of the Bañitos-Gollete geothermal system in Valle del Cura, main Andes Cordillera of San Juan, Argentina. J. South Am. earth Sci. 96, 1023781–1102378.15. doi:10.1016/j.jsames.2019.102378
Basokur, A. T., Rasmussen, T. M., Kaya, C., Altun, Y., and Aktas, K. (1997). Comparison of Induced Polarization and Controlled‐source Audio‐magnetotellurics Methods for Massive Chalcopyrite Exploration in a Volcanic Area. Geophysics 62, 1087–1096. doi:10.1190/1.1444209
Cao, Y. l., Cheng, G. J., Zhao, C. l., Wang, T., and Jiang, H. Y. (2018). Application of CSAMT in Hydrogeology Exploration in Shandong Province–An Example from Geothermal Exploration in Changdao County (South Four Islands). J. Groundwater Sci. Eng. 6 (1), 58–64. doi:10.19637/j.cnki.2305-7068.2018.01.007
Cheremensky, Γ. A. (1982). Practical Geothermal Science. Beijing: Geological Publishing House, 161–162.
Cui, Y. F., Zhang, J., Yin, T., Shi, M., and Bi, J. X. (2018). Discussion on Distribution of Geothermal Resources and Locating wells Methods of Geothermal Exploration in Eastern Shandong Province. Geol. Surv. China 5 (2), 86–92. (in Chinese with English abstract). doi:10.19388/j.zgdzdc.2018.02.13
Deng, S. G., Bian, R. X., Liu, B. K., and Zhang, L. P. (2000). The Effect of Reservoir Temperature on theParameters of Archie Formula. WLT 24 (2), 88–91. (in Chinese with English abstract). doi:10.3969/j.issn.1004-1338.2000.02.002
Dong, L., Li, D.-q., and Jiang, F.-b. (2018). A Two-Stage CO-PSO Minimum Structure Inversion Using CUDA for Extracting IP Information from MT Data. J. Cent. South. Univ. 25, 1195–1212. doi:10.1007/s11771-018-3818-4
Du, B. R. (2011). M.Sc. thesis in The Study of Electrical Prospecting in the Deep Geothermal Investigation (Chengdu: Chengdu Univerisity of Technology), 3–4. (in Chinese with English abstract)
Ellis, A. J. (1979). Chemical Geothermometry in Geothermal Systems. Chem. Geology. 25 (3), 219–226. doi:10.1016/0009-2541(79)90143-8
Fahrurrozie, A., Saputra, M. P., and Nugraha, T. (2015). The Application of Na-K-Mg, Na-K/Mg-Ca and K-Mg/Quartz Diagrams to Evaluate Water Geochemistry in West Java Geothermal Prospects. Indonesia 8 (2), 102–109.
Fournier, R. O., and Pang, Z. H. (1991). Geothermometer: Analysis of Na-K-Mg Relationship in Geothermal Water. Foreign Geology. (Beijing) (5), 34–37. (in Chinese).
Gan, H. N., Wang, G. L., Wang, X., Lin, W. J., and Yue, G. F. (2019). Research on the Hydrochemistry and Fault Control Mechanism of Geothermal Water in Northwestern Zhangzhou Basin. Geofluids 2019, 1–15. doi:10.1155/2019/3925462
Giggenbach, W. F. (1988). Geothermal Solute Equilibria. Derivation of Na-K-Mg-Ca Geoindicators. Geochimica Et Cosmochimica Acta 52, 2749–2765. doi:10.1016/0016-7037(88)90143-3
Giggenbach, W., Sheppard, D., Robinson, B., Stewart, M., and Lyon, G. (1994). Geochemical Structure and Position of the Waiotapu Geothermal Field, New Zealand. Geothermics 23, 599–644. doi:10.1016/0375-6505(94)90022-1
Hu, X., Peng, R., Wu, G., Wang, W., Huo, G., and Han, B. (2013). Mineral Exploration Using CSAMT Data: Application to Longmen Region Metallogenic belt, Guangdong Province, China. Geophysics 78 (3), B111–B119. doi:10.1190/GEO2012-0115.1
Huang, Y. H., Liu, H. L., Song, S. R., and Chen, H. F. (2018). An Ideal Geothermometer in Slate Formation: A Case from the Chingshui Geothermal Field, Taiwan. Geothermics 74, 319–326. doi:10.1016/j.geothermics.2017.11.002
Li, D. q., Xie, W., Di, Q. y., and Wang, M. y. (2016). Forward Modeling for "Earth-Ionosphere" Mode Electromagnetic Field. J. Cent. South. Univ. 23, 2305–2313. doi:10.1007/s11771-016-3288-5
Long, X., Liu, F., Xie, H., Lin, W., Liu, Y., and Li, C. (2022). Seismic Geothermal Resource Exploration Based on CPU/GPU Collaborative Parallel Prestack Time Migration. Acta Geologica Sinica (Eng). doi:10.1111/1755-6724.14895
Long, X., Xie, H., Deng, X., Wen, X., Ou, J., Ou, R., et al. (2021). Geological and Geochemical Characteristics of the Geothermal Resources in Rucheng. China. Lithosphere. doi:10.2113/2021/1357568
Long, X., Zhang, K., Yuan, R., Zhang, L., and Liu, Z. (2019). Hydrogeochemical and Isotopic Constraints on the Pattern of a Deep Circulation Groundwater Flow System. Energies 12 (3), 404. doi:10.3390/en12030404
Meng, Y. S., Yao, C. L., Liu, R. D., and Huang, L. J. (2011). The Prediction of the Geothermal Field Temperature by Means of Resistivity Inversion. Geophys. Geochemical Exploration 35, 58–57. (in Chinese with English abstract).
Meng, Y. S., Zhang, G. Z., and Liu, R. D. (2010). The Deep Temperature Prediction by Resistivity in Exploration of the Geothermal Field System. Comput. Tech. Geophys. geochemical exploration 32 (1), 31–34. (in Chinese with English abstract). doi:10.3969/j.issn.1001-1749.2010.01.006
Mohammadi, Z., Bagheri, R., and Jahanshahi, R. (2010). Hydrogeochemistry and Geothermometry of Changal thermal Springs, Zagros Region, Iran. Geothermics 39, 242–249. doi:10.1016/j.geothermics.2010.06.007
Pellerin, L., Johnston, J. M., and Hohmann, G. W. (1996). A Numerical Evaluation of Electromagnetic Methods in Geothermal Exploration. Geophysics 61, 121–130. doi:10.1190/1.1443931
Shi, M., Zhang, J., Yin, T., Yang, N., and Jiang, H. Y. (2019). Hydrochemistry Characteristic Analysis of Low-Medium Temperature Convective Geothermal Resources in Jiaodong Peninsula. Acta Geologica Sinica 93 (S1), 138–148. (in Chinese with English abstract). doi:10.19762/j.cnki.dizhixuebao.2019221
Sun, H. l., Ma, F., Lin, W. J., Liu, Z., Wang, G. L., and Nan, D. W. (2015). Geochemical Characteristics and Geothermother Application in High Temperature Geothermal Field in Tibet. Geol. Sci. Technol. Inf. 34 (3), 171–177. (in Chinese with English abstract).
Wang, G. L., Liu, F., and Wang, W. L. (2015). Research on the Spatial Distribution and Law of Shallow Geothermal Field in My Country's Land Area (2). Heat. cooling (3), 60–61. (in Chinese).
Wang, Y., Tong, J., Li, X. L., Fang, J. F., Deng, L. R., and Qi, L. (2020). Geological Characteristics and Generation Mechanism of Qunaihai Hot spring in Qing Hai Province. J. East China Univ. Tech. ( Nat. Science) 43 (3), 248–256. (in Chinese with English abstract). doi:10.3969/jissn.1674-3504.2020.03.006
Wang, Y., Zhang, A., Fan, W., Zhang, Y., and Zhang, Y. (2013). Origin of Paleosubduction-Modified Mantle for Silurian Gabbro in the Cathaysia Block: Geochronological and Geochemical Evidence. Lithos 160-161, 37–54. doi:10.1016/j.lithos.2012.11.004
Wu, C. P., Zhang, X. P., Du, L. Z., and Wang, Y. (2014). Study on the Application of CSAMT in Geothermal Exploration in Jilin Province. Amm 556-562, 2174–2177. doi:10.4028/www.scientific.net/amm.556-562.2174
Wu, G., Hu, X., Huo, G., and Zhou, X. (2012). Geophysical Exploration for Geothermal Resources: An Application of MT and CSAMT in Jiangxia, Wuhan, China. J. Earth Sci. 23, 757–767. doi:10.1007/s12583-012-0282-1
Xiong, B., and Mao, Y.-d. (2005). Some Issues on 2.5-D Transient Electromagnetic Forward. J. Cent. South. Univ. Technol. 12, 177–182. doi:10.1007/s11771-005-0395-0
Xu, P., Li, M., Qian, H., Zhang, Q., Liu, F., and Hou, K. (2019). Hydrochemistry and Geothermometry of Geothermal Water in the central Guanzhong Basin, China: a Case Study in Xi'an. Environ. Earth Sci. 78 (3), 78–87. doi:10.1007/s12665-019-8099-1
Xun, Z., Juan, L., Haiyan, Z., Bin, F., Lan, Y., and Shijun, L. (2008). Increase in thermal Groundwater Due to a Flowing Well Near the Songshan Hot spring in Beijing, China. Environ. Geol. 53, 1405–1411. doi:10.1007/s00254-007-0749-z
Yan, B. Z., Xiao, C. L., Liang, X. J., and Jiang, H. Y. (2018). Characteristics and Genetic Model of the Basin Type Geothermal Water Recourses in Basalt Area of Changbai Mountain. Geol. Rev. 64 (5), 1201–1216. (in Chinese with English abstract). doi:10.16509/j.georeview.2018.05.012
Yan, X. X., Gan, H. N., and Yue, G. F. (2019). Hydrogeochemical Characteristics and Genesis of Typical Geothermal Flleds from Huangshadong to Conghua in Guangdong. Geol. Rev. 65 (3), 743–754 (in Chinese with English abstract). doi:10.16509/j.georeview.2019.03.018
Yang, L. W., Zhou, Y. C., Yu, Y., and Yang, W. G. (2018). Analysis on Genesis and Hydrochemical Characteristics Geothermal Water Qutan Area, Jianggangshan, Jiangxi Province. Sci. Tech. Engieering 18 (23), 8–13 (in Chinese with English abstract). doi:10.3969/j.issn.1671-1815.2018.23.002
Zhang, Q. J., Liu, R. D., and Lu, G. F. (2011). The Method for Forecasting Temperature of the Geothermal Field. Geophys. Geochemical Exploration 35 (3), 325–328. (in Chinese with English abstract).
Zhang, X., Guo, Q., Li, J., Liu, M., Wang, Y., and Yang, Y. (2015). Estimation of Reservoir Temperature Using Silica and Cationic Solutes Geothermometers: a Case Study in the Tengchong Geothermal Area. Chin. J. Geochem. 34 (2), 233–240. doi:10.1007/s11631-015-0037-7
Zhao, J. Y., Zhang, W., Zhang, H. X., Qu, Z. W., Li, M., and Yue, G. F. (2018). Hydrogeochemical Characteristics and Genesis of the Geothermal fields in Batang of Sichuan. Hydrogeology Engineering Geology. 46 (4), 16–23. (in Chinese with English abstract). doi:10.16030/j.cnki.issn.1000-3665.2019.04.11
Keywords: CSAMT, geothermometer, borehole temperature measurement, geothermal reservoir temperature, geothermal reservoir depth
Citation: Zhao G, Liu Y, Hu L, Bian K, Qin S, Liu F and Hu J (2022) Inversion of the Temperature and Depth of Geothermal Reservoirs Using Controlled Source Audio Frequency Magnetotellurics and Hydrogeochemical Method. Front. Earth Sci. 10:858748. doi: 10.3389/feart.2022.858748
Received: 20 January 2022; Accepted: 17 March 2022;
Published: 18 May 2022.
Edited by:
Dawei Hu, Institute of Rock and Soil Mechanics (CAS), ChinaReviewed by:
Xianchun Tang, Chinese Academy of Geological Science, ChinaCopyright © 2022 Zhao, Liu, Hu, Bian, Qin, Liu and Hu. This is an open-access article distributed under the terms of the Creative Commons Attribution License (CC BY). The use, distribution or reproduction in other forums is permitted, provided the original author(s) and the copyright owner(s) are credited and that the original publication in this journal is cited, in accordance with accepted academic practice. No use, distribution or reproduction is permitted which does not comply with these terms.
*Correspondence: Yanguang Liu, Z2FveXVhbnpoaXhpbmdAMTYzLmNvbQ==; Kai Bian, YmlhbmthaUBoZWJldS5lZHUuY24=
Disclaimer: All claims expressed in this article are solely those of the authors and do not necessarily represent those of their affiliated organizations, or those of the publisher, the editors and the reviewers. Any product that may be evaluated in this article or claim that may be made by its manufacturer is not guaranteed or endorsed by the publisher.
Research integrity at Frontiers
Learn more about the work of our research integrity team to safeguard the quality of each article we publish.