- College of Geodesy and Geomatics, Shandong University of Science and Technology, Qingdao, China
Coal resources are the principal energy in China, and the surface subsidence caused by coal mining has a serious impact on the safe production and life of human beings. The traditional observation method of rock movement is slow and laborious, while the accuracy of airborne LiDAR, InSAR and other methods is relatively low. In this paper, aiming at the problem of the low accuracy of deformation monitoring of airborne LiDAR, the data registration of LiDAR point cloud is analyzed by combining theoretical analysis with field experiment. An advanced distribution mode of control points is discussed, and a current method of multi-period point cloud registration using seven-parameter transformation is proposed to obtain a surface subsidence model for mining area with high precision. The results show that the RMSE of airborne LiDAR is decreased from 0.013 m to 0.008 m by using the new method for data registration, and the maximum error value is reduced from 0.022 m to 0.014 m, which effectively enhances the deformation monitoring capability of airborne LiDAR.
1 Introduction
Coal resources have been playing a significant role in China’s energy sector for a long time. Meanwhile, the status of coal as the principal energy in China will not change for a considerable period of time in the future (Xie et al., 2021). With a large amount of coal resources extracted from underground, a series of negative problems caused by mining, such as surface subsidence and deformation, are becoming increasingly prominent, and if these problems are not solved, they are bound to affect the safety of coal production in China, and even the healthy development of coal industry (Wang et al., 2010; Song et al., 2018; Hu, 2019; Hu and Xiao, 2020).
At present, the main means of studying surface subsidence in coal mines is to set up stations in the field and implement monitoring by laying the observation line of strike and tendency. Under conditions of complex geological mining, continuous mining with multiple working faces, “three down” mining, etc., it is necessary to grasp the characteristics of three-dimensional deformation of the entire subsidence basin, which is obviously difficult to achieve by conventional means (Wang, 2017). The traditional studies of surface subsidence laws in mining areas are mainly achieved by deploying mobile monitoring stations to collect surface subsidence data, which are subsequently processed to anticipate surface subsidence trends and analyze their subsidence laws (Chi et al., 2021). Although many classical monitoring methods such as leveling and GPS observation can obtain a certain amount of surface subsidence data, their accuracy also meets the needs of engineering practice. However, these methods are costly for the huge human and material resources required. In addition, it is difficult to protect the monitoring sites, and the economics of long-term monitoring is also poor (Wallace et al., 2016; Sankey et al., 2017). Although InSAR technology has the outstanding advantages of all-weather, strong penetration and high accuracy in acquiring continuous coverage of ground elevation and information in surface deformation monitoring, it still cannot overcome many problems. For example, D-InSAR technology is vulnerable to spatial-temporal decorrelation and atmospheric effects, and its monitoring results are affected by DEM accuracy; the data processing accuracy of PS-InSAR technology depends on the spatial density of the PS points, which is not suitable for areas with very few PS points, such as non-urban areas; SBAS is applicable to all images that show enough high coherence in the coverage, but is less appropriate for areas with complex terrain factors such as river-land interlocking. However, airborne LiDAR technology effectively solves the problem that surface data cannot be quickly obtained in the above method, which can providelandform images with high resolution and high precisions; At the same time, it could dampen the effect of surface vegetation and obtain the real ground elevation data informationthrough multiple echo technology.
To solve the above problems, 3D laser scanning has gradually become the main technical means for surface deformation observation by acquiring 3D dense point clouds on the surface of objects in a high-temporal, non-contact active manner, which saves a lot of human and material costs (Meng et al., 2010; Gu et al., 2017). At this stage, ground-based 3D laser scanning technology has been used to monitor mining subsidence with some success (Dai et al., 2011). Firstly, in the application of mining subsidence in mining area, Li and Zeng et al. applied the 3D laser scanning technology to the monitoring of mining subsidence, and processed the point cloud data by human-computer interaction, indicating that the continuous improvement of the scanner accuracy and effective scanning distance, which provided conditions for the practical application of this technology in mining area (Li et al., 2015; Zeng and Jiang, 2015). According to the experiment of Yu et al., the information extraction of mining subsidence based on the uncertainty analysis of DEM of LiDAR is suitable for large area mining subsidence monitoring, which can quickly determine the location of subsidence area and extract more accurate geospatial information of subsidence area (Yu et al., 2017). Lian et al. combined the advantages of fine scanning of the terrestrial 3D laser with the absolute displacement monitoring of total station and GPS to achieve effective monitoring of landslides, steps, cracks and tilting of high voltage towers in the mining process, and to demonstrate the broad prospect of the combination of the two applied in mining monitorings (Lian and Hu, 2017). In terms of improving the monitoring accuracy, Hu et al. showed that the accuracy of terrestrial 3D laser scanning for subsidence monitoring in mining areas can reach the centimeter level throughGround station scanning experiments (Hu et al., 2013). Liang et al. applied terrestrial 3D laser scanning to areas with maximum deformation at the centimeter level (Liang et al., 2017). Experiments show the effectiveness of the direct comparison method of point cloud to point cloud based on Hausdorff distance to extract surface deformation information. Bai et al. utilized the three-dimensional laser scanning technology to construct the subsidence model. The error between the monitoring results and the measured values at several representative monitoring points can reach the millimeter level (Bai, 2017). This technology can be used for rapid and high-precision monitoring of mining subsidence by 3D laser scanning. With the rapid development of UAV technology, there are new attempts in research on UAV platforms equipped with LiDAR scanning and monitoring technology. However, there are few researches on mining subsidence measurement with high-precision by airborne LiDAR technology.
This paper focuses on three aspects of airborne LiDAR system, point cloud filtering and DEM construction. Firstly, we studies the causes of large errors in airborne LiDAR technology and discusses the reasons for the achievements precision of airborne LiDAR. Secondly, we explores the mechanism to weaken the errors of airborne LiDAR settlement monitoring. The point cloud data is processed by KD-tree filtering method, and the point cloud data reflecting the real surface situation is obtained. Finally, in order to gain surface deformation data with high-precision and the ability of airborne LiDAR to identify small ground deformation, this paper innovatively proposes a method to align multi-period point cloud data by using seven-parameter transformation. When this method is applied to Tingnan Coal Mine, the maximum error value of representative point is 0.014 m, which can meet the monitoring precision requirement of mining subsidence.
This paper is organized as follows. Section 2 describes the experimental sites and data used. Section 3 starts by describing the framework of the proposed method, followed by illustrations of each component of the proposed method and baseline methods used for comparison. The new point cloud registration method and experimental results are presented in Section 4, followed by a discussion in Section 5 and the conclusions of this study in Section 6.
2 Study Area
The designed mining length of 1,102 working face is about 600 m and the inclined length is about 100 m. According to the Design of Mining Scheme for Mining Pressed Coal under Structures in Tingbei Village, the working face adopts gangue filling coal mining technology. The working face of 1,102 is nearly horizontal with a mean thickness of 3.8 m, at a depth of 400 m, which located in the north of a panel and surrounded by solid carbon area. The 1,102 transportation trough is connected with the central filling transportation roadway, and then intersects with the grand lane interchange of the belt conveyor, with a total length of about 1,000 m. The 1,102 track gateway is connected with the concentrated filling return air lane, with a total length of is about 700 m.
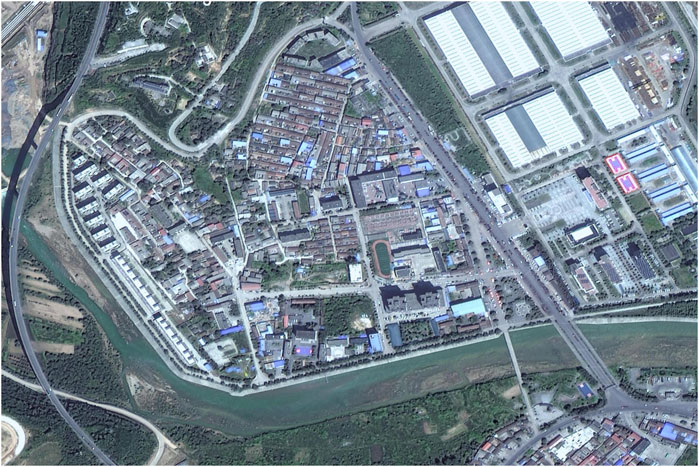
The working face is arranged along the azimuth angle of 325°, and it crosses Tingbei Village along the direction of the working face. Above it is the plain terrain, mainly including buildings (structures) such as Tingbei Village, the old site of Xi Zhongxun’s revolutionary activities, Heihe Bridge, the new residence of immigrants in Anhua Village, Tingkou Junior Middle School, Tingkou Primary School, Central Hospital, People’s Court, town government, Hualong Hotel, and ecological park. Heihe River flows through the south of the working face, as shown in Figure 1.
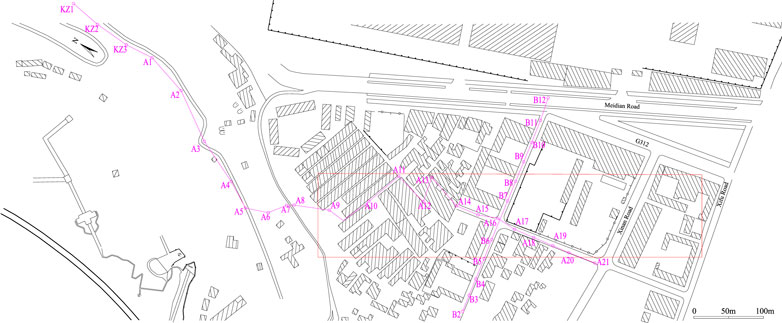
In order to constantly monitor surface deformation, rock movement observation was carried out before mining, and the observation route is shown in Figure 2. After the monitoring stakes were ambushed, the first two comprehensive observations were completed before being affected by mining to obtain the original data of the monitoring station, and monitoring was conducted every month after the first observation. The daily observation is reasonably arranged according to the advance progress of the working face, and the observation density should be appropriately increased in the active period. When the subsidence value does not exceed 30 mm for three consecutive months, it is considered that the monitoring station has reached stability, and the last comprehensive observation can be carried out (Luan et al., 2020).
3 Data
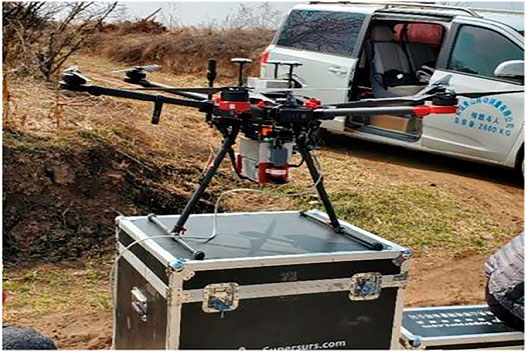
A new light and small airborne LiDAR system launched by Supersurs is used in this paper, which integrates a variety of sensors such as light and small laser scanners (optional Velodyne VLP16 or Riegl mini VUX-1), MEMS integrated navigation and industrial cameras, and carries a variety of UAV carrier platforms such as multirotor, fixed wing and hybrid wing, as shown in Figure 3. It can provide accurate three-dimensional data for transmission line, accident investigation and agricultural census forestry census, and has high operating efficiency.
The main sensors and their performance indicators are shown in Table 1: the technical indicators and the environmental parameters of laser scanner, and industrial cameras are introduced in detail (Yuan, 2020).
3.1 Data Capture
3.1.1 Site Survey
The actual terrain and high-rise buildings in the field acquisition area are investigated to determine the appropriate flight altitude. The fitting flight spectrum is selected as the scanning area. Considering the safety of UAV, scanners and personnel, the proper weather and temperature conditions are selected for field acquisition.
3.1.2 Erection of GPS Reference Station
The base station is set up on the known control points that are relatively empty in the industrial square. The covering radius of the base station is about 15 km, ensuring that the plane accuracy is within 5 mm and the elevation accuracy is within. The GPS reference stations should not be lower than the E-level requirements specified in GB/T 18,314. The GPS receiver with dual-frequency survey is adopted, whose observed sampling interval should not be less than 1 Hz, typically 5 Hz. The site is selected to be the No. 1 site with wide vision in the mining area which is far away from the ground features with multipath effect.
3.1.3 Route Planning
There are few high-rise buildings in the surveyed area, and the terrain is flat. The flight height is set to 100 m, and the flight time is not more than 20 min. The derrick measurement method is used to avoid the fastigium of human and vehicle, reduce the occlusion factor, and conduct a full coverage measurement. After the completion of the route planning, the operator operates the UAV in a wide field of vision for data capture, and the instrument and data inspection are performed after the data acquisition.
3.2 Data Pre-Processing
3.2.1 Integrated Navigation Data Processing
Inertial Explorer post-processing software is used to decompose IMU data and reference station data, and high-precision coordinate information and attitude information are obtained, as Table 2 shows.
3.2.2 Data Analysis of Point Cloud and Image
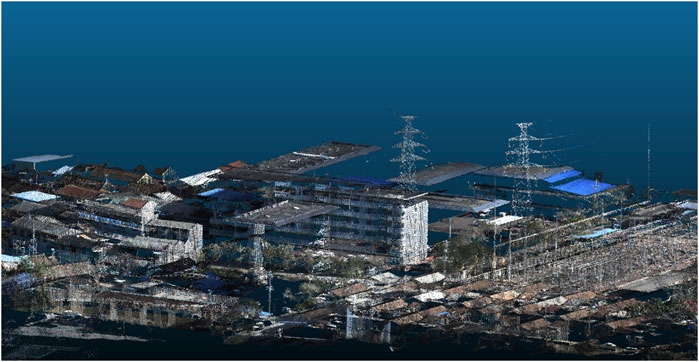
VSursPROCESS software is used to automatically parse point cloud data and image data and generate true-color point cloud by fusion of point cloud and image. Figure 4 shows the true-color point cloud after registration of point cloud data and image date. The data of point cloud obtained after pre-processing are 1.425 million points in December 2019, covering 0.17445 km2, and1.426 million points in November 2020, covering 0.1746 km2.
3.3 Point Cloud Filtering
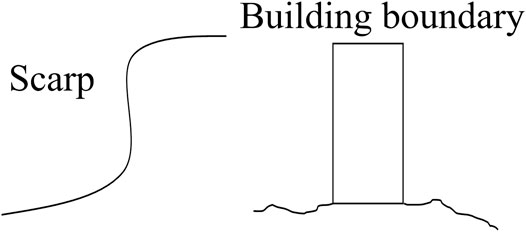
A majority of filtering principles of LiDAR data are considered from elevation mutation. It is generally believed that the reason for the elevation mutation of adjacent laser dots is that the probability caused by the point located on the ground feature with a high elevation is larger, and the probability caused by terrain changes is smaller (Zeybek and Şanlıoğlu, 2019). Usually, the closer the two adjacent points are, the smaller the elevation difference between the two points should be. If the difference of height between the two points is larger, the probability that the point with large height difference is the ground point is smaller (Bayram et al., 2018). Therefore, it is necessary to consider the distance from the point to the reference point on the ground and the distance between the two points when judging whether the point is on the ground. When the distance between the two points increases, the threshold to determine whether it is a ground point should also be relaxed. Even if an elevation mutation occurs, it is not difficult to determine whether it is caused by terrain changes or by the ground feature. The manifestation is different because of the changes in terrain or ground features cause a high difference. For instance, due to the elevation mutation caused by the slope, it will only produce dramatic changes in one direction, while the elevation mutation caused by the house is different, and it will form enormous changes in each boundary of the building, as shown in Figure 5 (Li et al., 2021).
3.3.1 Filtration of Noise Points
In order to detect an isolated noise point, the data structure of the KD-tree is utilized in this paper to search for surrounding laser dots. The number of laser dots around each point cloud is automatically searched within a certain radius. When the number of laser dots is less than a number of threshold, the radius will continue to expand. After increasing the radius several times, if the number of point clouds in this radius is still less than the number of threshold, the point is an isolated noise point.
To find the isolated noisy point cloud, the unclassified LiDAR point cloud is first constructed as a KD-tree (Lu et al., 2021). Second, the search range is defined as 2 times the average pitch. Take all the unclassified points and use them as the search center. If the number of points in the search range is less than 3, the program automatically expands the radius R by 20% and continues to search for points in the range; when the number of points is still less than 3, the radius is expanded by 20% again and the search continues. The above search process is run six times consecutively. If the number of points in each search radius is less than 3, then the center point is considered as an isolated noise point (Hu et al., 2019; Li et al., 2020; Yang and Xue, 2020; Lee et al., 2021).
After filtration of noise points, the denoising effect is shown in Figure 6:
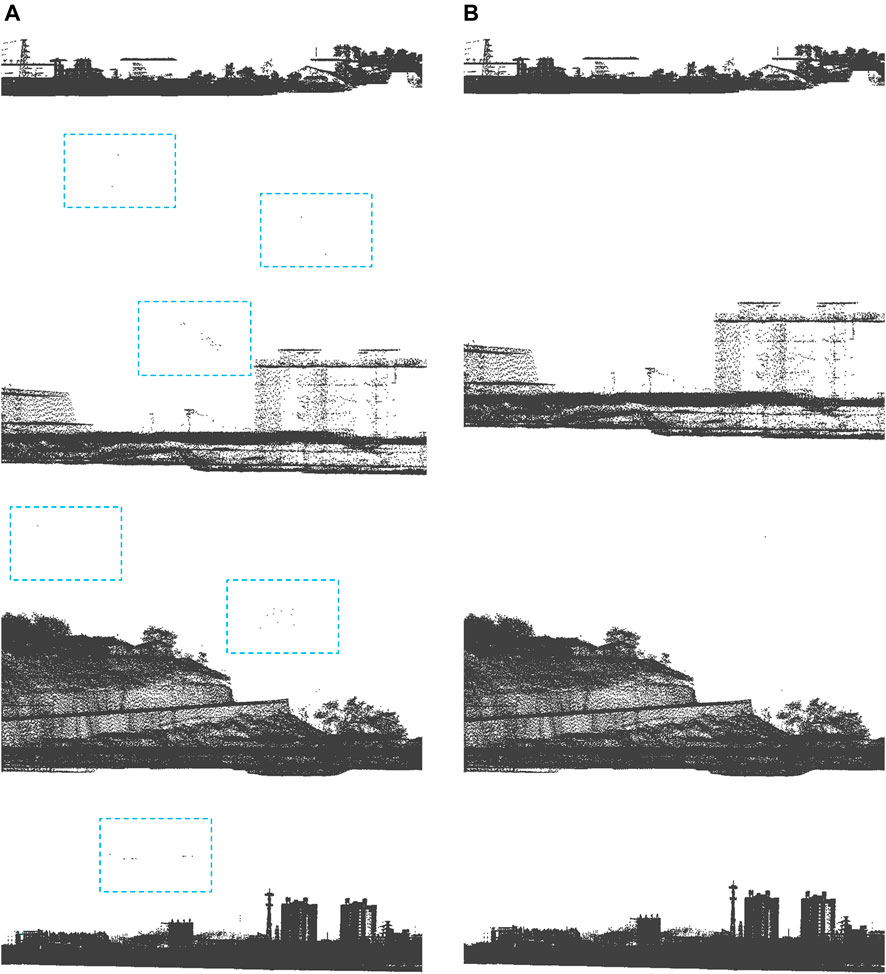
FIGURE 6. Comparison before and after denoising. (A) Original point clouds with noise points; (B) Point clouds after denoising.
3.3.2 Extraction of the Ground Point
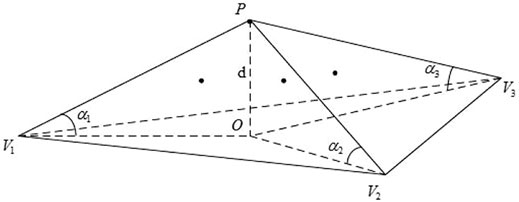
The principle of extracting the ground points in the point cloud by using the improved incremental triangulation encryption algorithm is that the initial triangulated irregular network is constructed by using the initial ground seed points, and the points
In order to detect an isolated noise point, the data structure of the KD-tree is utilized in this paper to search for surrounding laser dots. The number of laser dots around each point cloud is automatically searched within a certain radius. When the number of laser dots is less than a number of threshold, the radius will continue to expand. After increasing the radius several times, if the number of point clouds in this radius is still less than the number of threshold, the point is an isolated noise point.Where
Define
From the mathematical distance formula:
Where
First, the initial TIN is constructed by using the initial seed point. Then iterative encryption is carried out. All the points to be classified are traversed, and the triangles projected onto the horizontal plane of each point are searched. The distance
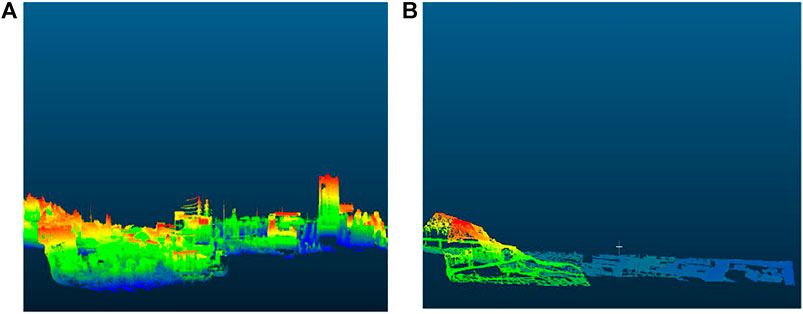
FIGURE 8. Extraction of the Ground Point. (A) Original point clouds; (B) Point clouds on the ground.
3.4 DEM Construction
An algorithm of inverse distance weighted interpolation is used to generate a DEM model of the filtered ground points in this paper, based on the principle that two objects that are closer together are more similar than two objects that are farther apart as a general rule. In practical applications, each sampling point has more or less certain influence on the corresponding interpolation points, which can be regarded as the weight, and the weight is inversely proportional to the distance between the sampling point and the interpolation point. The larger the distance is, the smaller the weight is (Shepard, 1968; van Mierlo et al., 2021). When the distance between the two exceeds a certain range, the weight can almost be regarded as 0. The sum of the weights of each sampling point is the value at the corresponding interpolation point, which expressed as (Zhang et al., 2012; De Mulder et al., 2018):
In the formula,
For the attribute
That is, using the weighted sum of all known points in space to estimate the value of the unknown point, the weight depends on the reciprocal of the distance (or the square of the reciprocal). Then, the closer the distance is, the greater the weight is. The farther the distance, the smaller the weight. In the data processing,
3.5 Initial Results
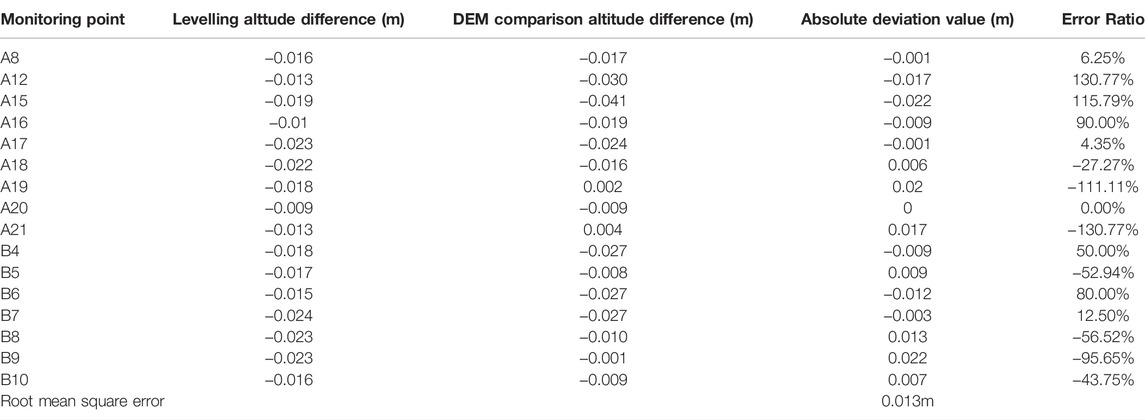
The surface subsidence results were obtained by overlay analysis of the two DEMs using the software stack directly, and the accuracy analysis of the data results was performed using the contemporaneous level measurement data. It is found that the error of surface subsidence value obtained by DEM overlay analysis is large, with the maximum error of 0.022 m, the minimum error of 0 m, the maximum error rate of 130.77%, the minimum error rate of 0, and the RMSE of 0.013 m as shown in Table 3. The accuracy of data results is poor, and it is difficult to reflect the real situation of surface slight deformation. Therefore, when using airborne LiDAR for mining subsidence measurement with high-precision, point cloud data need to be processed.
4 Method
This paper proposes a method to improve the relative accuracy by sacrificing the absolute elevation accuracy of point cloud. Firstly, the probability integral method is used to predict the mining subsidence and determine the maximum influence of mining subsidence. Secondly, six points are selected as the datum point outside the mining subsidence and taken as the center of 0.5 m*0.5 m square respectively. The average elevation of the point cloud data of two phases in the square is regarded as the elevation of datum point, and the three-dimensional coordinates of the two phases’ point cloud data at six points are obtained respectively. Next, the seven-parameter solution for the conversion from the point cloud data in the second phrase to that in the first phrase is obtained by using six pairs of datum point coordinates. Finally, the converted second-phase point cloud data were regenerated into DEM data and superposed with the first-phase DEM data to obtain the subsidence curve.
4.1 Mining Subsidence Prediction
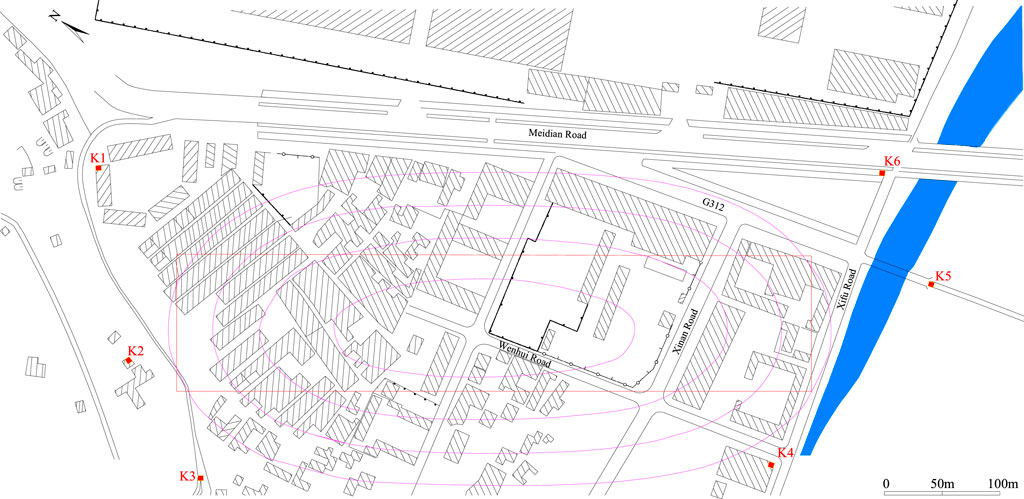
The predicted mining subsidence was estimated using the calculation software of probability integration, and the comprehensive parameters of rock moving provided by the mine for this workface, and the anticipated results are shown in Figure 10 (Gu and Gao, 2011; Wang et al., 2011; Yao et al., 2012; Zheng et al., 2019; Zhu et al., 2019).
4.2 Datum Point Selection
In the flat area outside the mining images of the working face, feature points are selected as datum points, and the distribution of points is shown in Figure 10. As shown in Figure 11, the average elevation of the point cloud data in a square frame of 0.5 m*0.5 m centered on the datum point is the elevation of the datum point, thus obtaining the elevation data of six pairs of datum points for the two phases of point cloud data, and the data are shown in Table 4.
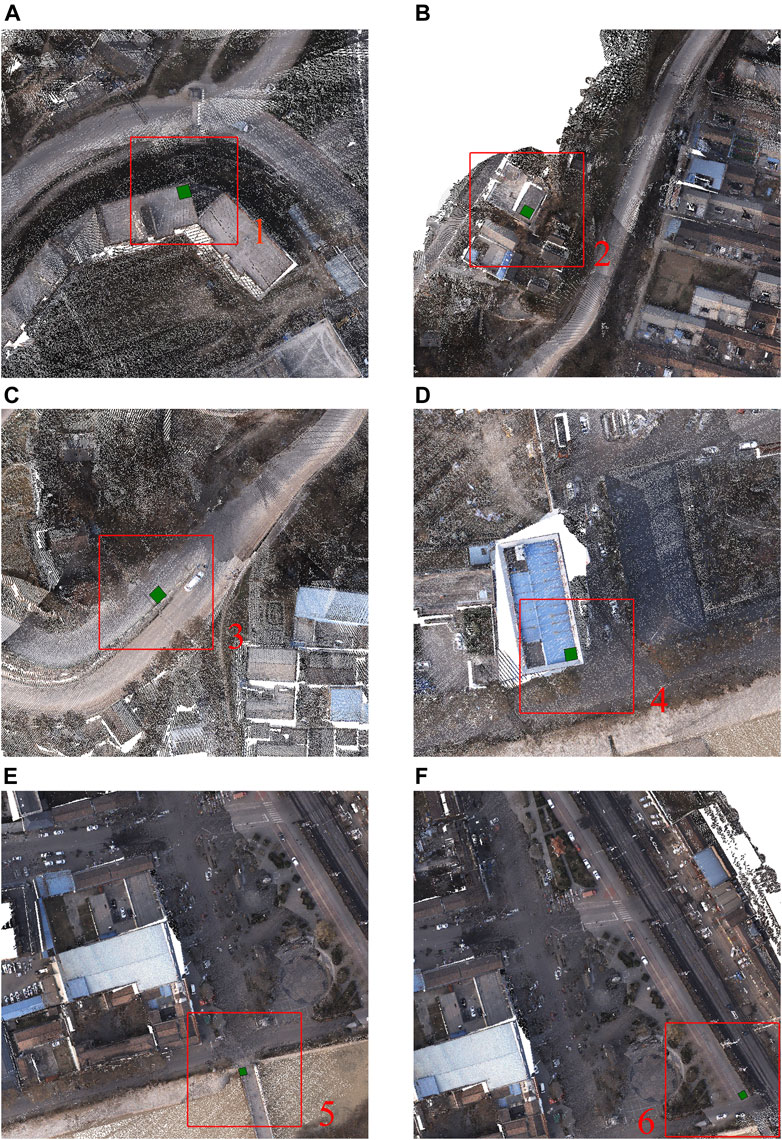
FIGURE 11. Sketch map of datum point. (A), (B), (C), (D), (E), and (F) are schematic locations of datum points 1,2,3,4,5, and 6, respectively.
4.3 Bursa Seven-Parameter Solution
Since the origin of coordinates of the two coordinate systems are different, three translation parameters ΔX, ΔY and ΔZ are generated. The coordinate axes corresponding to each coordinate system are not parallel, three rotation angle parameters W(x), W(y), and W(z) are produced, and another scale parameter K is generated by taking into account the inconsistency scales of the two coordinate systems. Therefore, in view of the translation parameters, the rotation parameters and the scale parameters, formula is obtained. There are seven parameters in the formula, known as the Boerza seven parameter formula.
The solution is performed using the common point coordinates and EPS software, where the main parameters are set as follows: the central meridian is 108°, the Y coordinate constant is 50,000, the source ellipsoidal reference and the targeted ellipsoidal reference are both involved in CGCS-2000 coordinate system, and the seven parameters of Bursa are shown below:
∆X = 381.4994
∆Y = 294.0328
∆Z = −597.6798
W(x) = −16.070929
W(y) = −11.627451
W(z) = −22.172061
K = 0.0000328145
4.4 Data Conversion
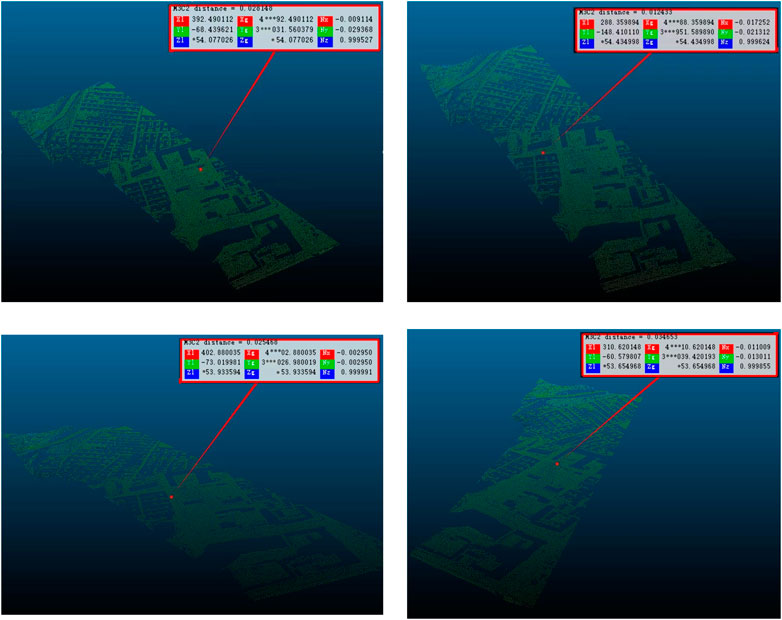
The point cloud data of the second filtering and classification were converted by using the obtained Bursa seven parameters, and the point clouds of the converted period were superimposed with the point clouds of the first period. Then, the M3C2 algorithm is utilized to process the point clouds of the two periods to obtain subsidence values of surface, and the surface subsidence quantities of four randomly selected points are 0.028, 0.0123, 0.034, and 0.025 respectively, of which the distribution of the four points is shown in the following Figure 12. The quantity of surface subsidence produced by this method is close to the level monitoring results, but individual voids appear in the point cloud data after filtering and classification, which cannot completely cover all the ground surface in the survey area. In order to analyze the changes of surface subsidence more comprehensively, the inverse distance interpolation algorithm is used to interpolate the point cloud to construct the DEM and form a ground elevation model covering all the ground surface.
4.5 DEM Overlay Analysis
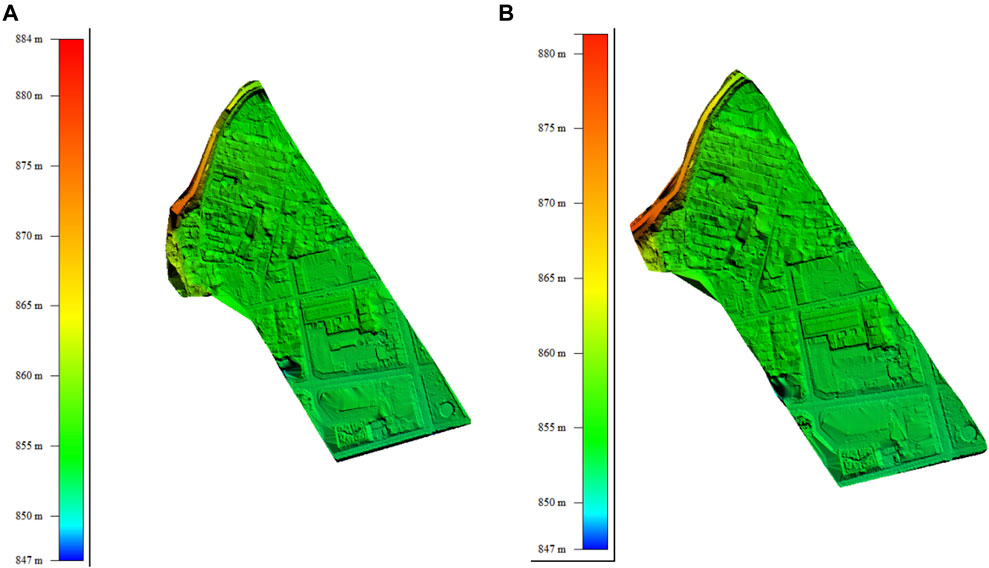
The DEMs formed by the point clouds of the two phases are shown in Figure 13. Due to the small quantity of surface subsidence in this measurement area, the maximum subsidence is 0.05 m, and there is no obvious area of subsidence change and subsidence basin morphology after DEM overlay. In order to better display the settlement changes, the surface road settlement values are extracted along the strike and tendency of the two survey lines respectively.
5 Results
5.1 Subsidence Curve
The specific extraction line of settlement value both in tendency direction and strike direction is shown in Figure 13, and the surface road subsidence value in the strike direction and tendency direction is shown in Figure 14.
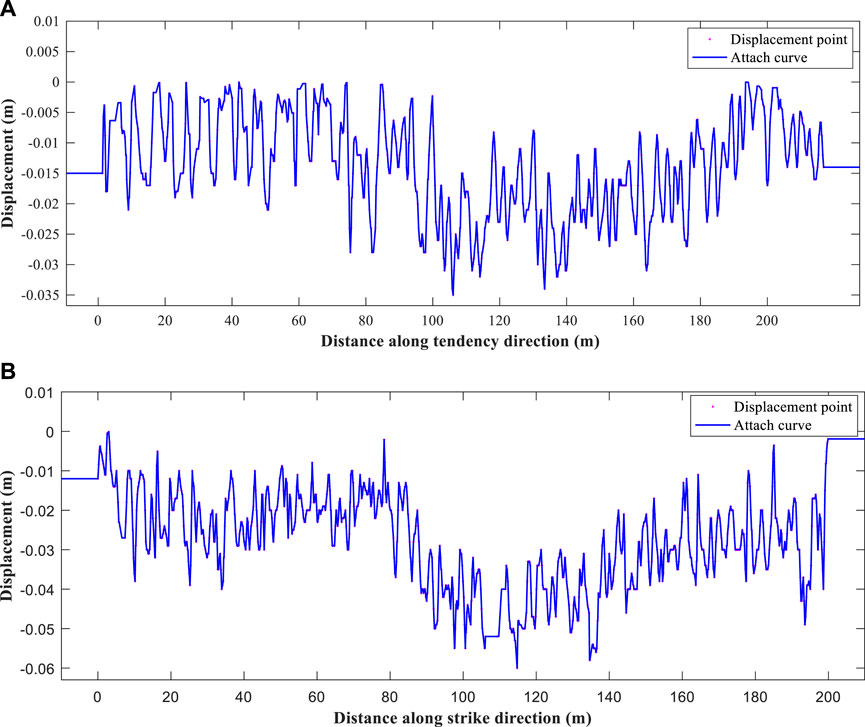
FIGURE 14. Surface road subsidence value. (A) Subsidence value in the tendency direction (B) Subsidence value in the strike direction.
5.2 Accuracy Evaluation
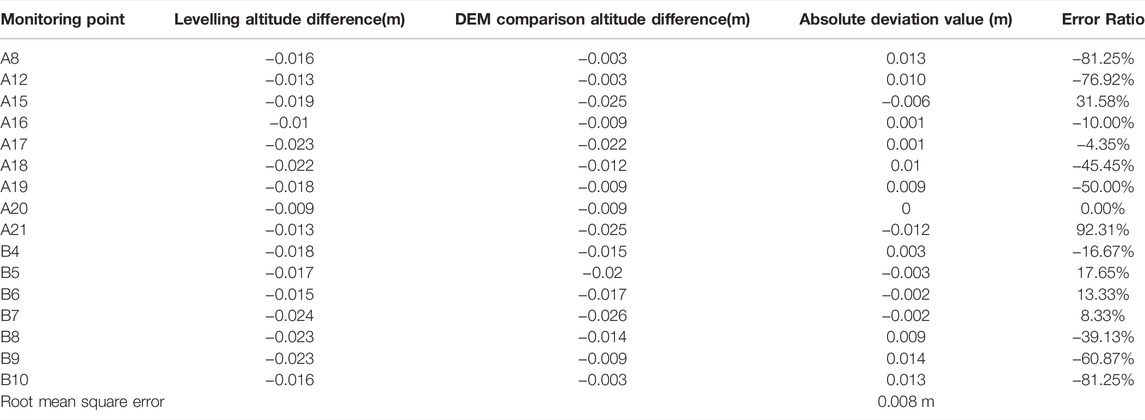
Taking the leveling data as the criteria, the accuracy analysis of the subsidence curve obtained by LiDAR data is analyzed. It is found that the accuracy of subsidence value obtained by airborne radar is high, and the error rate is significantly reduced. The maximum error is only 0.014 m, and the minimum error is 0 m, while the error rate is also significantly reduced, the maximum error rate is 92.31%, and the minimum error rate is 0. The RMSE is 0.008 m indicating that the data observation accuracy is high. The specific point accuracy is shown in Table 5.
6 Discussion
As one of the main geological hazards in mining areas, surface subsidence caused by coal mining seriously affects prevention and control of ecological environment and regional sustainable development in mining areas, and the study of mining subsidence has been a significant topic in academia (Ammirati et al., 2020; Dong et al., 2021). The airborne LiDAR is an important technical means for collecting large-scale and continuously distributed three-dimensional geospatial information. The characteristics of surface subsidence in the mining area can be quickly obtained by superimposing multi-period data. This is a new and reliable method of surface subsidence measurement, which has the advantages of high efficiency, low cost, high accuracy, etc., especially it can provide an effective solution for subsidence measurement in complex areas such as compound influence of multiple working surfaces, large topographic undulations, swamps and deserts (Rose et al., 2013; Peng et al., 2017). At the same time, the abundant laser wave can more comprehensively and accurately express the shape of the surface subsidence basin, and improve the authenticity of the monitoring data (Ao et al., 2016); combined with its simple operation mode that is easy to integrate with traditional aerial photography, it shows the incomparable advantages of the original surveying and mapping methods.
Previous studies have investigated measurement methods for the observation of surface movement and deformation in coal mines using airborne LiDAR (Ren et al., 2019). Many studies on LiDAR for surface rock movement observation in coal mine can be found in the literature, especially in Lu’s paper, where first proposed the application of airborne LiDAR for movement observation in coal mine (Lu, 2020). In the application, the DEM model is mainly generated by using the point cloud, and then the DEM model is utilized to and make a comparison to derive the surface subsidence basin. The method proposed in this paper is different from the existing ones. Firstly, the point cloud data were filtered to obtain the ground point cloud data; Secondly, the method of seven-parameter transformation was used for the first time to align the point cloud data of the two phases, and the second phase point cloud data were obtained after data conversion, which reduced the relative error of the point cloud data of the two phases and thus realized the data alignment of the point cloud data of the two phases; Then, the inverse distance weighted interpolation algorithm is used to process the point cloud data and obtain the DEM models of the two phases (Chen et al., 2020); Next, the DEM data of the two phases are superimposed to obtain the morphology of the subsidence basin. Finally, a detailed experimental evaluation of the obtained subsidence basins was carried out by using the levelling results.
The results of this study show that the method achieves high accuracy through processing point cloud, indicating that this reduces the absolute elevation accuracy of the point cloud data and thus improves the reliability of the relative elevation accuracy. This research proposes a method of point cloud data alignment utilizing the probability integration for the first time. Firstly, the probability integral method was used to calculate the expected extent of subsidence in accordance with the parameters of rock movement provided by the mine, and it was concluded that mining on the coal seam would affect the extent boundary. Secondly, outside the scope of mining influence, six datum points were selected, the datum point coordinate data of the two-period point cloud were obtained respectively, and the seven parameters for the transformation of the two periods of point cloud data were further calculated. Next, the seven parameters are used to transform the coordinates of the point cloud data in the second phase, so that the height difference between the two phases of point cloud data in the zero-deformation region tends to zero, which reduces the errors in data acquisition and processing, and enables the point cloud data in two phases to achieve high-precision alignment. After alignment, the height difference between the two-phases point cloud data in the non-deformed area is about 0.0034 m.
In this paper, 16 leveling observation points are selected to evaluate the accuracy of the results. The results show that the accuracy of the data obtained by the proposed data registration method has been significantly improved, and the maximum error value is reduced from 0.022 m to 0.014 m; the maximum error rate is decreased from 130.77% to 92.31%; the RMSE is increased from 0.013 m to 0.008 m. Besides, the surface subsidence model obtained by airborne LiDAR restores the state of surface buildings more accurately and obtains the surface subsidence more accurately. Therefore, this method effectively improves the robustness of LiDAR data and improves the recognition ability of airborne Lidar for small deformation regions.
Nevertheless, there are technical and operational limitations of UAV in urban area in particular. The achieved resolution of the orthomosaic depends on the flight height. The flight height is restricted by the type of UAV (i.e., helicopter or fixed wing), the aviation regulations and air traffic control considerations, and the target land surface geometry and surface cover. A further issue related to topographical change and features blockage: Firstly, the occurrence of point cloud density inhomogeneities subject to the variation of the advancing speed and the altitude at which the LiDAR system is located, and the image of the undulations of the ground surface. Secondly, although electromagnetic waves have a certain penetration for specific surface features, most features have absorption and blocking effects on laser pulses, and when there are more surface features, the phenomenon of missing surface points will occur. Moreover, the topographic undulations and complex structure of the features to a certain extent lead to the filtering algorithm being sensitive to changes in parameter thresholds, resulting in serious misclassification and reduced achievements precision (Lee and Park, 2019). Finally, the presence of scattered clouds and airborne particles can cause refraction of laser pulses, generating in point cloud noise or data loss, which increases the difficulty of point cloud data processing (Dalla Corte et al., 2020).
7 Conclusion
In this paper, data registration of multi-period point cloud based on seven-parameter model is proposed for mining subsidence using airborne LiDAR, and a ground level monitoring network is constructed to verify the feasibility of the scheme. The probability integral method is used to predict the mining subsidence, and then the seven parameters of the model conversion are calculated by using the datum points of the non-affected area of the working face mining to convert the multi-phase point cloud. Finally, the DEM model generated by the point cloud data is superimposed to do the difference to obtain the surface subsidence model. This method has been proved effective in different data sets and under different conditions. This method effectively weakens the errors in the process of collecting the flight data, such as aircraft vibration caused by airflow, atmospheric refraction during laser propagation, etc. Field experiments show that the method availably improves the results of airborne LiDAR data measurement, and the RMSE is increased from 0.013 m to 0.008 m, the maximum error value is reduced to 0.014 m which realizes the breakthrough of the monitoring ability of the airborne LiDAR deformation to millimeter level and greatly enhances the monitoring capability of airborne LiDAR for weak deformation. The method is also applicable to other applications of airborne LiDAR measurement, such as urban building deformation monitoring, foundation pit monitoring (Wang, 2011; Kong, 2021).
Data Availability Statement
The original contributions presented in the study are included in the article/Supplementary Materials, further inquiries can be directed to the corresponding author.
Author Contributions
Conceptualization, YD and DW; methodology, YD; software, FL and JW; validation, YD, DW, and FL; formal analysis, DW; investigation, DW; resources, DW; data curation, DW; writing—original draft preparation, DW and YD; writing—review and editing, DW and YL; visualization, FL; supervision, FL; project administration, DW; funding acquisition, DW. All authors have read and agreed to the published version of the manuscript.
Funding
This research was funded by Shandong Provincial Natural Science Foundation, grant number ZR2020MD024. This work was also supported by the China Postdoctoral Science Foundation, grant number 2021M693546.
Conflict of Interest
The authors declare that the research was conducted in the absence of any commercial or financial relationships that could be construed as a potential conflict of interest.
Publisher’s Note
All claims expressed in this article are solely those of the authors and do not necessarily represent those of their affiliated organizations, or those of the publisher, the editors and the reviewers. Any product that may be evaluated in this article, or claim that may be made by its manufacturer, is not guaranteed or endorsed by the publisher.
Abbreviations
InSAR, interferometric synthetic aperture radar; UAV, unmanned aerial vehicle; LiDAR, light detection and ranging; RMSE, root mean squared error; DEM, digital elevation model; GPS, global positioning system; D- InSAR, differential interferometry synnthetic aperture radar; PS-InSAR, persistent scatterer interferometric synthetic aperture radar; SBAS-inSAR, small baseline subset interferometric synthetic aperture radar; MEMS, micro-electro-mechanical system; IMU, inertial measurement unit; KD-tree, k-dimensional tree; TIN, triangulated irregular network; IDW, inverse distance weighted; CGCS-2000, china geodetic coordinate system 2000.
References
Ammirati, L., Mondillo, N., Rodas, R. A., Sellers, C., and Di Martire, D. (2020). Monitoring Land Surface Deformation Associated with Gold Artisanal Mining in the Zaruma City (Ecuador). Remote Sens. 12, 2135. doi:10.3390/rs12132135
Ao, J., Wu, K., Wang, Y., and Li, L. (2016). Subsidence Monitoring Using Lidar and Morton Code Indexing. J. Surv. Eng. 142, 06015002. doi:10.1061/(ASCE)SU.1943-5428.0000166
Axelsson, P. (2000). DEM Generation from Laser Scanner Data Using Adaptive TIN Models. Int. Archives Photogrammetry Remote Sens. Archives 33 (B4/1; PART 4), 111–117.
Bai, W. (2017). Mining Subsidence Monitoring Method Based on Laser Scanning Technique. Metal. Mine 1, 132–135. (in Chinese).
Bayram, E., Frossard, P., Vural, E., and Alatan, A. (2018). Analysis of Airborne LiDAR Point Clouds with Spectral Graph Filtering. IEEE Geosci. Remote Sens. Lett. 15 (8), 1284–1288. doi:10.1109/lgrs.2018.2834626
Chen, W., Xiang, H., and Moriya, K. (2020). Individual Tree Position Extraction and Structural Parameter Retrieval Based on Airborne LiDAR Data: Performance Evaluation and Comparison of Four Algorithms. Remote Sens. 12, 571. doi:10.3390/rs12030571
Chi, S., Wang, L., Yu, X., Fang, X., and Jiang, C. (2021). Research on Prediction Model of Mining Subsidence in Thick Unconsolidated Layer Mining Area. IEEE Access 9, 23996–24010. doi:10.1109/ACCESS.2021.3056873
Dai, H., Lian, X., Chen, Y., Cai, Y. F., and Liu, Y. X. (2011). Study of the Deformation of Houses Induce by Mining Based on 3D Laser Scanning. Bull. Surv. Mapp. 11, 44–46. (in Chinese).
Dalla Corte, A. P., Rex, F. E., Almeida, D. R. A. d., Sanquetta, C. R., Silva, C. A., Moura, M. M., et al. (2020). Measuring Individual Tree Diameter and Height Using Gatoreye High-Density UAV-Lidar in an Integrated Crop-Livestock-Forest System. Remote Sens. 12, 863. doi:10.3390/rs12050863
De Mulder, W., Molenberghs, G., and Verbeke, G. (2018). A Generalization of Inverse Distance Weighting and an Equivalence Relationship to Noise-free Gaussian Process Interpolation via Riesz Representation Theorem. Linear Multilinear Algebra 66 (5), 1054–1066. doi:10.1080/03081087.2017.1337057
Dong, L., Wang, C., Tang, Y., Tang, F., Zhang, H., Wang, J., et al. (2021). Time Series InSAR Three-Dimensional Displacement Inversion Model of Coal Mining Areas Based on Symmetrical Features of Mining Subsidence. Remote Sens. 13 (11), 2143. doi:10.3390/rs13112143
Gu, J., and Gao, Z. (2011). Application of Probability-Integral Method in the Prediction of Mining Subsidence. Mine Surv. 2, 47–48+2. (in Chinese). doi:10.3969/j.issn.1001-358X.2011.02.016
Gu, Y., Wang, Q., and Xie, B. (2017). Multiple Kernel Sparse Representation for Airborne LiDAR Data Classification. IEEE Trans. Geosci. Remote Sens. 55 (2), 1085–1105. doi:10.1109/tgrs.2016.2619384
Hu, C., Pan, Z., and Li, P. (2019). A 3D Point Cloud Filtering Method for Leaves Based on Manifold Distance and Normal Estimation. Remote Sens. 11 (2), 198. doi:10.3390/rs11020198
Hu, D., Wu, K., and Chen, R. (2013). Data Disposal of Mining Subsidence Monitoring by 3-D Laser Scanning. J. Min. Strata Control Eng. 18 (1), 20–22. (in Chinese). doi:10.13532/j.cnki.cn11-3677/td.2013.01.005
Hu, Z. (2019). The 30 years’ Land Reclamation and Ecological Restorationin in China: Review, Rethinking and Prospect. Coal Sci. Technol. 47 (1), 25–35. (in Chinese). doi:10.13199/j.cnki.cst.2019.01.004
Hu, Z., and Xiao, W. (2020). Some Thoughts on Green Development Strategy of Coal Industry: from Aspects of Ecological Restoration. Coal Sci. Technol. 48 (4), 35–42. (in Chinese). doi:10.13199/j.cnki.cst.2020.04.002
Kong, Y. (2021). Coordinate Transformation Algorithm Based on Bursa Model. Technol. Wind 4, 1–2. (in Chinese). doi:10.19392/j.cnki.1671-7341.202104001
Lee, K. W., and Park, J. K. (2019). Comparison of UAV Image and UAV Lidar for Construction of 3D Geospatial Information. Sensors Mater. 31, 2466. doi:10.18494/SAM.2019.2466
Lee, S.-H., Kim, C.-S., and Saf-Nets, (2021). SAF-nets: Shape-Adaptive Filter Networks for 3D Point Cloud Processing. J. Vis. Commun. Image Represent. 79, 103246. doi:10.1016/j.jvcir.2021.103246
Li, Y., Liu, H., Mao, J., Niu, L., and Yan, Y. (2015). Application of 3D Laser Scanning Technology to Monitoring Mining Subsidence. Eng. Surv. Mapp. 24 (07), 43–47. (in Chinese). doi:10.19349/j.cnki.issn1006-7949.2015.07.011
Li, Y., Wang, J., Li, B., Sun, W., and Li, Y. (2020). An Adaptive Filtering Algorithm of Multilevel Resolution Point Cloud. Surv. Rev. 53, 1–12. doi:10.1080/00396265.2020.1755163
Li, F., Zhu, H., Luo, Z., Shen, H., and Li, L. (2021). An Adaptive Surface Interpolation Filter Using Cloth Simulation and Relief Amplitude for Airborne Laser Scanning Data. Remote Sens. 13 (15), 2938. doi:10.3390/rs13152938
Lian, X., and Hu, H. (2017). Terrestrial Laser Scanning Monitoring and Spatial Analysis of Ground Disaster in Gaoyang Coal Mine in Shanxi, China: a Technical Note. Environ. Earth Sci. 76, 287. doi:10.1007/s12665-017-6609-6
Liang, Z., Zhao, F., Sun, W., and Shao, W. (2017). The Research of Surface Deformation Monitoring Method Using 3D Laser Scanning Technique. Geomatics Spatial Inf. Technol. 40 (6), 213–216. (in Chinese).
Liu, Y., Fan, B., Meng, G., Lu, J., Xiang, S., and Pan, C. (2019). “DensePoint: Learning Densely Contextual Representation for Efficient Point Cloud Processing,” in Proceeding of the 2019 IEEE/CVF International Conference on Computer Vision (ICCV), Seoul, Korea, Nov. 2019 (IEEE), 5238–5247.
Lu, J. (2020). Minging Subsidence Modeling Based on Airborne LIDAR Point Could in Yushen Mining Area [D]. Xian, China: Xi’An University of Science and Technology.
Lu, Y., Cheng, L., Isenberg, T., Fu, C.-W., Chen, G., Liu, H., et al. (2021). Curve Complexity Heuristic KD‐trees for Neighborhood‐based Exploration of 3D Curves. Comput. Graph. Forum 40 (2), 461–474. doi:10.1111/cgf.142647
Luan, Y., Dong, Y., Ma, Y., and Weng, L. (2020). Surface and New Building Deformation Analysis of Deep Well Strip Mining. Adv. Mater. Sci. Eng. 2020, 1–14. doi:10.1155/2020/8727956
Meng, X., Currit, N., and Zhao, K. (2010). Ground Filtering Algorithms for Airborne LiDAR Data: A Review of Critical Issues. Remote Sens. 2, 833–860. doi:10.3390/rs2030833
Meng, X., Lin, Y., Yan, L., Gao, X., Yao, Y., Wang, C., et al. (2019). Airborne LiDAR Point Cloud Filtering by a Multilevel Adaptive Filter Based on Morphological Reconstruction and Thin Plate Spline Interpolation. Electronics 8 (10), 1153. doi:10.3390/electronics8101153
Peng, F., Wong, M. S., Wan, Y., and Nichol, J. E. (2017). Modeling of Urban Wind Ventilation Using High Resolution Airborne LiDAR Data. Comput. Environ. Urban Syst. 64, 81–90. doi:10.1016/j.compenvurbsys.2017.01.003
Polat, N., Uysal, M., and Toprak, A. S. (2015). An Investigation of DEM Generation Process Based on LiDAR Data Filtering, Decimation, and Interpolation Methods for an Urban Area. Measurement 75, 50–56. doi:10.1016/j.measurement.2015.08.008
Ren, H., Zhao, Y., Xiao, W., and Hu, Z. (2019). A Review of UAV Monitoring in Mining Areas: Current Status and Future Perspectives. Int. J. Coal Sci. Technol. 6 (3), 320–333. doi:10.1007/S40789-019-00264-5
Rose, L. S., Seong, J. C., Ogle, J., Beute, E., Indridason, J., Hall, J. D., et al. (2013). Challenges and Lessons from a Wetland LiDAR Project: a Case Study of the Okefenokee Swamp, Georgia, USA. Geocarto Int. 28, 210–226. doi:10.1080/10106049.2012.681707
Sankey, T., Donager, J., McVay, J., and Sankey, J. B. (2017). UAV LiDAR and Hyperspectral Fusion for Forest Monitoring in the Southwestern USA. Remote Sens. Environ. 195, 30–43. doi:10.1016/j.rse.2017.04.007
Shepard, D. (1968). “A Two-Dimensional Interpolation Function for Irregularly-Spaced Data,” in Proceedings of the 1968 23rd ACM National Conference, January 1968, 517–524. doi:10.1145/800186.810616
Song, S., Wang, S., Zhao, X., and Shen, T. (2018). Stratification Transfer Method of the Mining Subsidence Based on the Characteristics of Layered Structure in Coal Overburden. J. China Coal Soc. 43 (S1), 87–95. (in Chinese). doi:10.13225/j.cnki.jccs.2017.3011
van Mierlo, C., Faes, M. G. R., and Moens, D. (2021). Inhomogeneous Interval Fields Based on Scaled Inverse Distance Weighting Interpolation. Comput. Methods Appl. Mech. Eng. 373, 113542. doi:10.1016/j.cma.2020.113542
Wallace, L., Lucieer, A., Malenovský, Z., Turner, D., and Vopěnka, P. (2016). Assessment of Forest Structure Using Two UAV Techniques: A Comparison of Airborne Laser Scanning and Structure from Motion (SFM) Point Clouds. FORESTS 7 (12), 62–77. doi:10.3390/f7030062
Wang, S., Huang, Q., Fan, L., Yang, Z., and Shen, T. (2010). Study on Overburden Aquclude and Water Protection Mining Regionazation in the Ecological Fragile Mining Area. J. China Coal Soc. 35 (1), 7–14. (in Chinese). doi:10.13225/j.cnki.jccs.2010.01.007
Wang, Z. (2011). Study on the Non-liner Prediction Theory of Old Goaf Residual Subsidence and its Application (Ph.D. Thesis). Xuzhou, China: China University of Mining and Technology. (in chinese).
Wang, Y. (2017). Research Progress and Prospect on Ecological Disturbance Monitoring in Mining Area. Acta Geod. Cartogr. Sinica 46 (10), 1705–1716. (in Chinese). doi:10.11947/j.AGCS.2017.20170358
Xie, H., Ren, S., Xie, Y., and Jiao, X. (2021). Development Opportunities of the Coal Industry towards the Goal of Carbon Neutrality. J. China Coal Soc. 46 (07), 2197–2211. (in Chinese). doi:10.13225/j.cnki.jccs.2021.0973
Yang, T., and Xue, H. (2020). “Removal of Scattered Noise Based on Data of the Cranial Point Cloud of the Zokor Head,” in Proceeding of the 2020 International Conference on Computer Information and Big Data Applications (CIBDA), Guiyang, China, April 2020 (IEEE), 75–78. doi:10.1109/CIBDA50819.2020.00025
Yao, Q., Feng, T., Li, S., Li, S., and Ning, Q. (2012). The Subsidence Prediction of Coal Mine ‘Three under’ Mining Based on Probability Integral Method. Saf. Coal Mines 43 (07), 188–190+193. (in Chinese). doi:10.13347/j.cnki.mkaq.2012.07.046
Yu, H., Yang, L., Zhang, C., Niu, F., and Wu, J. (2017). Mining Subsidence Information Extraction Based on Uncertainty Analysis of LiDAR DEM. Metal. Mine 10, 1–7. (in Chinese). doi:10.19614/j.cnki.jsks.2017.10.001
Yuan, Z. (2020). Research on Rock Movement Observation in Mining Area Based on UAV 3D Laser Scanning Technology [D]. Qingdao, China: Shandong University of Science and Technology. (in Chinese). doi:10.27275/d.cnki.gsdku.2020.000029
Zeng, K., and Jiang, Y. (2015). Application of 3D Laser Scanning Technology in Surface Subsidence Monitoring. Surv. Mapp. Geol. Mineral Resour. 31 (02), 28–30. (in Chinese). doi:10.16864/j.cnki.dkch.2015.02.008
Zeybek, M., and Şanlıoğlu, İ. (2019). Point Cloud Filtering on UAV Based Point Cloud. Measurement 133, 99–111. doi:10.1016/j.measurement.2018.10.013
Zhang, J., Guo, L., and Zhang, X. (2012). Effects of Interpolation Parameters in Inverse Distance Weighted Method on DEM Accuracy. J. Geomatics Sci. Technol. 29 (01), 51–56. doi:10.3969/j.issn.1673-6338.2012.01.013
Zheng, M., Deng, K., Du, S., Liu, J., Liu, J., and Feng, J. (2019). Joint Probability Integral Method and TCPInSAR for Monitoring Mining Time-Series Deformation. J. Indian Soc. Remote Sens. 47 (1), 63–75. doi:10.1007/s12524-018-0867-y
Keywords: rock movement observation, UAV lidar, point cloud registration, subsidence model, parameter transformation, mining subsidence
Citation: Dong Y, Wang D, Liu F and Wang J (2022) A New Data Processing Method for High-Precision Mining Subsidence Measurement Using Airborne LiDAR. Front. Earth Sci. 10:858050. doi: 10.3389/feart.2022.858050
Received: 19 January 2022; Accepted: 21 April 2022;
Published: 08 June 2022.
Edited by:
Susan Hough, United States Geological Survey, United StatesReviewed by:
Milad Janalipour, K.N.Toosi University of Technology, IranQiang Guo, China Jiliang University, China
Copyright © 2022 Dong, Wang, Liu and Wang. This is an open-access article distributed under the terms of the Creative Commons Attribution License (CC BY). The use, distribution or reproduction in other forums is permitted, provided the original author(s) and the copyright owner(s) are credited and that the original publication in this journal is cited, in accordance with accepted academic practice. No use, distribution or reproduction is permitted which does not comply with these terms.
*Correspondence: Dong Wang, c2R1c3R3ZEAxNjMuY29t
 Yue Dong
 Dong Wang
 Fengying Liu
 Junjie Wang