- 1Department of Civil Engineering, School of Civil and Resource Engineering, University of Science and Technology Beijing, Beijing, China
- 2State Key Laboratory of Hydroscience and Engineering, Tsinghua University, Beijing, China
- 3HUANENG Tibet Hydropower Safety Engineering Technology Research Center, Chengdu, China
With the wide application of full-face rock tunnel boring machine (TBM) in tunnel construction, the self-adaptive adjustment of TBM tunneling parameters is of great significance for the safety and efficiency of TBM tunnelling. Aiming at the shortcomings of the current TBM data mining capability and optimization methods of tunneling parameters, this paper proposes a prediction method of TBM tunneling parameters based on particle swarm optimization-bi-directional long short-term memory (PSO-Bi-LSTM) model, which selects the complete tunneling cycle data to predict the TBM tunneling parameters, and uses a number of numerical methods such as binary state discriminant function and
Introduction
With the large-scale development of infrastructure construction and the continuous application of new technologies in China, large-scale engineering equipment integrating soil cutting, tunnel support and other functions, namely tunnel boring machine (TBM), has become the first choice for various medium and long-distance tunnel construction due to its remarkable advantages such as high efficiency, safety, and economy (Gao et al., 2019; Hou and Liu, 2021). However, due to the variability of TBM tunneling parameters and the complexity of geological conditions (Feng et al., 2015; Feng et al., 2022; Yang et al., 2022), it is difficult to quantitatively analyze the interaction law between TBM and rock. Tunneling often relies on human experience to adjust repeatedly, and the real-time matching is poor, and it cannot adapt to the complex geological environment (Zhang et al., 2018a; Afradi et al., 2021). Therefore, accurate and effective real-time prediction of TBM tunneling parameters has become an urgent problem to be solved in the field of tunnel engineering.
In recent years, scholars have proposed a series of prediction models around the prediction of TBM tunneling parameters, including theoretical prediction models (Evans, 1965; Zhou et al., 2016), empirical prediction models (Barton, 2000; Gertsch et al., 2007), and prediction models based on machine learning methods (Sun et al., 2018; Zhang et al., 2021a). Based on indentation test or full-scale laboratory cutting test, the theoretical prediction model quantifies the equilibrium force equation required for cutting force. For example, the CSM model proposed by the Colorado School of Mines (Rostami, 1997) summarizes rock breaking laws and calculates TBM tunneling parameters based on the results of full-scale laboratory cutting tests on plenty of rock samples. This type of model considers limited engineering factors and has certain limitations. For improving the applicability of the theoretical model, Yagiz (Yagiz, 2006) improved the CSM model and introduced the research on the brittleness and discontinuity of rock mass. Zhang et al. (Zhang et al., 2013) established a theoretical load prediction model for shield tunneling machines with Earth pressure balance considering the influence of soil-rock interlayer foundation. Zhou and Zhai (Zhou and Zhai, 2018) extended the theoretical cutter head torque model to mixed surface grinding. In addition to the above theoretical prediction models, different scholars have conducted multi-angle explorations on the prediction of TBM tunneling parameters based on empirical learning methods and have made certain research progress. Krause (Krause, 1976) proposed a widely used empirical formula for TBM load prediction. Xue et al. (Jing et al., 2019) studied the rock crushing process based on experiments. Entacher et al. (Entacher et al., 2014) proposed a rock crushing test method for cutting experiments and used an empirical method to estimate the load in the light of the test results. In addition, with the continuous improvement of test equipment, multi-factor prediction models represented by the Norwegian Institute of Technology (NTNU) model (Sun et al., 2018) have been widely used. Although the above models have achieved abundant research results, they still have different degrees of limitations in the prediction process. Based on the existing engineering experience and through regression analysis, the empirical prediction model establishes the empirical relationship between the TBM tunneling parameters and rock mass parameters, but it only has a good prediction effect on specific strata, and the factors considered in the prediction process are limited. It has great limitations and poor universality under different geological conditions. The theoretical prediction model is mainly based on the summary of test results and mechanical theoretical analysis and cannot sensitively capture the small changes of TBM load, which is quite different from the actual TBM tunneling construction.
With the rapid development of artificial intelligence technology and the continuous improvement of various detection technologies (Zhang et al., 2020a; Zhang et al., 2021b), to make up for the shortcomings of the above traditional prediction models, many scholars have proposed a series of new intelligent prediction models for TBM tunneling parameters based on machine learning algorithms. Wen et al. (Wen et al., 2009) established a predication model based on Monte Carlo-BP neural network and ranked the importance of parameters to improve the prediction accuracy of TBM tunneling speed. Mahdevari et al. (Mahdevari et al., 2014) and Tao et al. (Tao et al., 2015) applied support vector regression (SVR) and random forest to predict the penetration rate of TBM in hard rock conditions, respectively. Xiong et al. (Xiong et al., 2017) established a BP neural network model through MATLAB based on the surrounding rock and machine performance parameters to predict the penetration of TBM. Compared with other optimization algorithms, particle swarm optimization (PSO) has the several advantages, that is, fewer parameters need to be adjusted, the algorithm implementation is simpler, the efficiency is higher, the robustness is better, and it is easy to converge. Therefore, Hou et al. (Hou et al., 2020) improved the standard particle swarm optimization (PSO) algorithm and proposed a TBM prediction model based on the improved PSO to optimize the BP neural network. In addition, Hou et al. (Hou et al., 2019) proposed an exponential adjustment inertia weight immune particle swarm optimization to enhance the accuracy and reliability regarding the selection of shield tunneling parameter values. The application of machine learning algorithm effectively improves the prediction accuracy of TBM tunneling parameter. However, due to the timeliness of TBM parameters, the machine learning algorithm fails to consider the time variation characteristics of various parameters, which greatly increases the difficulty of feature extraction and analysis in the prediction process. Therefore, the further development of more robust and effective algorithms is still an urgent problem to be solved.
As a new field, deep learning (Zhang et al., 2021c) has the advantages of efficient learning, transferability and strong adaptability compared with traditional machine learning algorithms. Due to advanced optimization techniques and powerful GPU computing power, deep learning models have been successfully applied in practical engineering fields such as speech recognition (Zhang et al., 2018b), image processing (Graves et al., 2009), and machine translation (Tan et al., 2018). Recurrent neural network (RNN) (Jin et al., 2018) is a special network structure in neural network for processing time series data, which is widely used in sequence related fields such as language model (Zhao and Dong, 2018), part-of-speech tagging (Si et al., 2018). The long-short term memory (LSTM) network (Vlachas et al., 2018; Liu et al., 2019; Zhang et al., 2020b; Wang et al., 2021) improves the unit structure of the traditional recurrent neural network and effectively solves the long-term dependency problems such as gradient disappearance in the RNN network. However, LSTM network is a one-way sequence structure, which cannot use the subsequent time information to calculate the output, and the data processing process is cumbersome. To solve this problem, this paper improves the propagation mode of LSTM neural network, introduces a bidirectional learning strategy, optimizes the model by PSO, and puts forward a prediction method of TBM tunneling parameters based on PSO-Bi-LSTM model.
Taking the data set based on the TBM3 bid section of Songhua River water conveyance project as the research object, 9,350 tunneling cycles are randomly selected as the model training set in the light of the ratio of 17:1 by data mining method. Different from the traditional prediction method that uses the data of the ascending segment to predict the parameters of the stable segment, this paper selects the data of the complete tunneling cycle to predict the TBM tunneling parameters. Using Pearson correlation analysis, this paper extracts the 21 key parameters with the highest correlation with the predicted parameters from the 199-dimensional tunneling parameters of the complete tunneling cycle as the model input features. Meanwhile, the Adam optimizer is used to train Bi-LSTM, and the mean square error (MSE) is used as the loss function of the model. By comparing with the current relevant algorithms and analyzing the prediction effect under different surrounding rock grades, the prediction performance of the PSO-Bi-LSTM model and its applicability under different surrounding rock grades are verified, to provide a more feasible intelligent decision-making method of tunneling parameters for TBM-assisted intelligent construction.
Bi-LSTM Model Optimized by PSO
Unidirectional LSTM
RNN is a special kind of network structure used to process sequence data. Different from the traditional neural network model, the RNN network has a high-dimensional hidden nonlinear internal structure, which can memorize the information of the previous moment and apply it to the current output vector. Theoretically, the RNN network can process sequence data of any length. But in practice, the information that the RNN network can store is limited, and there may be varying degrees of information forgetting during long-distance data transmission, and the input of the hidden layer has a significant impact on the output of the network. The influence decays as the network loop continues to recurse, making it difficult to deal with long-term dependencies such as vanishing gradients.
To solve this problem, related scholars introduced a gating mechanism upon the RNN network to form a LSTM network. Compared with the RNN network, LSTM adds three control gates, namely input gate, output gate, and forget gate. The unit structure of LSTM is shown in Figure 1, which is mainly composed of one memory unit and three gating units. Through the gated unit structure, the memory unit can effectively filter the historical information. The output vector of the hidden layer at the previous moment and the information at the current moment are combined into the input vector at the current moment, and then be stored, forgotten and output adaptively through the LSTM unit.
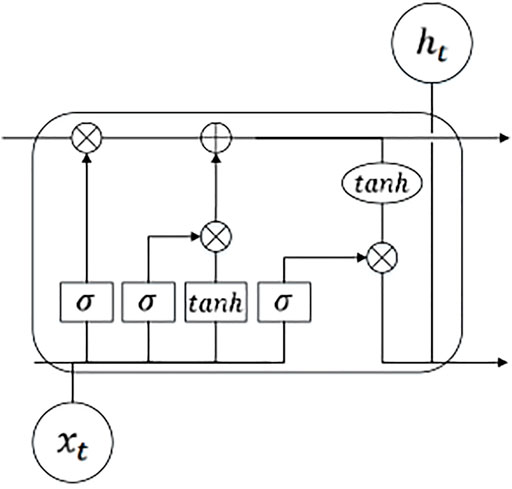
FIGURE 1. LSTM structure diagram (Gao et al., 2019).
Bi-LSTM
LSTM network can effectively deal with long-term dependence problems such as gradient disappearance in variable-length sequences, but TBM tunneling parameters are time-dependent, and the data change law is not only related to past information, but also considers the impact of future information on the model prediction performance. For changing the limitation that the traditional LSTM network only draws conclusions from past information, some scholars have improved the propagation method of the LSTM network and proposed a Bi-LSTM network.
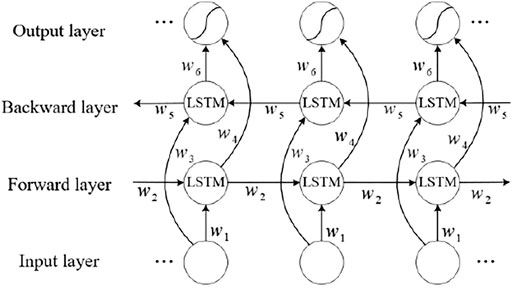
Bi-LSTM network is composed of forward LSTM and backward LSTM. Compared with traditional LSTM network, Bi-LSTM network can better adapt to sequence data with strong round-trip correlation and effectively capture the dynamic characteristics of TBM tunneling parameters. Figure 2 shows the Bi-LSTM network structure, which adds a backpropagation layer upon LSTM. The forward training sequence and the backward training sequence are two independent LSTM structures. The two structures are symmetrical, and the information transmission directions are opposite. The forward training sequence calculates the current moment information forward, and the backward training sequence calculates the same sequence backwards. Bi-LSTM predicts all input vectors based on the timing of the input features, the hidden layer integrates the past and future information and outputs to the output layer, and finally integrates the forward and reverse information to output the prediction result.
where,
Particle Swarm Optimization
PSO is a population-based computational method for intelligent bionic evolution, first proposed by American professors Eberhart and Kennedy in 1995. The concept of PSO originates from the research on the predation behavior of birds and realizes the intelligence of problem solving through cooperation and information sharing among individuals in the group. Compared with optimization algorithms such as genetic algorithm and ant colony algorithm, PSO has a relatively simple structure, fewer adjustment parameters, and has the advantage of fast convergence.
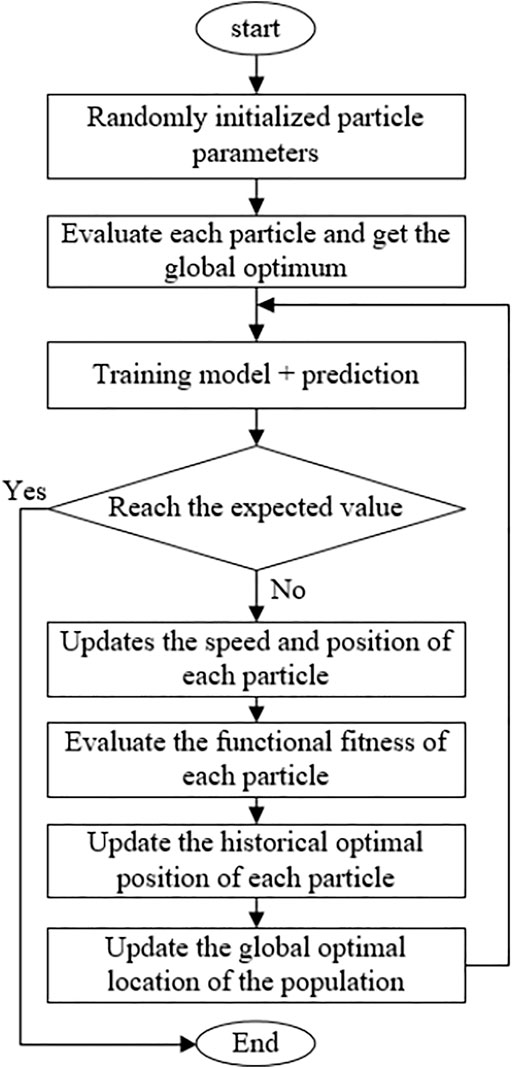
PSO uses the velocity-position iterative search method to determine the global optimal solution when solving the optimization problem. First, some particles are randomly initialized in the solution space. Each particle can be regarded as a search individual in the search space. The current velocity and position of the particle correspond to a candidate set of the optimization problem and are dynamically adjusted in accordance with the fitness function. The point where the fitness function is optimal is recorded as the current individual extreme value, also known as the local optimal solution. The local optimal solution is shared with other particles in the particle swarm, and the optimal individual extreme value is obtained by comparative analysis as the current global optimal solution of the whole particle swarm. The particle speed and position adjust the update state in the light of the two optimal solutions in the optimization process, and finally find the optimal parameters. According to the principle of the PSO above, the state update equation of the particle at time t+1 is as follows:
where,
Bi-LSTM Model Optimized by PSO
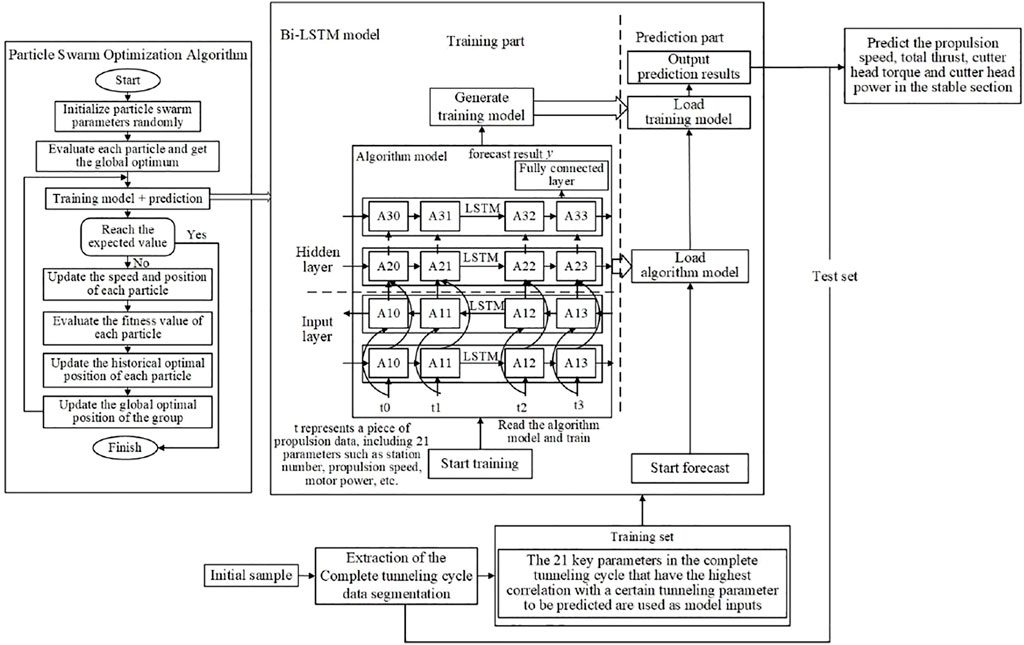
The basic idea of constructing the PSO-Bi-LSTM model is to use the PSO to optimize the bias and weights of the Bi-LSTM neural network, thereby improving its convergence speed and prediction accuracy. Compared with some deterministic algorithms, the PSO, as an uncertain algorithm of bionic optimization, has self-organization, robustness, and essential parallelism. Each particle cooperates with each other to better adapt to the environment, ensuring the effectiveness and practicability of the algorithm under different conditions and environments. Figure 3 is the specific algorithm flow of PSO.
The specific steps of PSO to optimize Bi-LSTM are as follows:
1) The method of constructing binary state discriminant function is used to preprocess the original data of TBM tunneling, and the data and outliers of the stop section are eliminated to obtain valid data samples.
2) Normalize the input data, import the PSO-Bi-LSTM model, determine the particle swarm search space, initialize the particle swarm parameters, set the optimization function, parameter dimension, number of iterations, and upper and lower limits of the parameters to be optimized.
3) Calculate the fitness value of each particle, update the particle based on the fitness function, and determine the local optimal solution; and compare the local optimal solution of each particle to obtain the current global optimal solution.
4) Determine the velocity and position of the particle at the current moment in the light of Eqs 4, 5.
5) Train the model and judge whether the predicted value reaches the expected value or reaches the maximum number of iterations. If the conditions are met, end the model training, and output the optimization result; otherwise, after recording the historical information, continue to execute the Bi-LSTM algorithm to train the model until it reaches the expectation.
6) In accordance with the optimized parameters of PSO, a PSO-Bi-LSTM model is constructed to predict the TBM tunneling parameters, and an appropriate evaluation function is selected to evaluate the prediction effect.
Project Overview and Data Processing
Project Overview
The Songhua River water conveyance project in Jilin Province has a total length of 263.01 km and a water diversion tunnel of 133.98 km. It is a large-scale cross-regional water diversion project with the largest scale, the longest water transmission line, and the most difficult construction in Jilin Province. The total length of the TBM3 bid section is 22,955 m, and the construction projects are mainly water diversion tunnels, shaft excavation, support, and drainage work. Among them, the tunnel excavation section with a total length of 20,198 m and a maximum buried depth of 260 m is mainly constructed by TBM and supplemented by the drilling and blasting method, and its engineering geological conditions are shown in Figure 4. The lithology of the stratum involved in this section is mainly granite and limestone, and the surrounding rock grades II to V are distributed. The groundwater is divided into five grades in the light of the degree of humidity. The distribution ratio of the granite area to the limestone area is 1:1.58; the proportions of grades II to V of the surrounding rocks in the granite area are 7.03, 65.23, 25.14 and 2.60% respectively; the proportions of grades II to V of the surrounding rocks in the limestone area are 5.19, 66.70, 22.83 and 5.28% respectively.
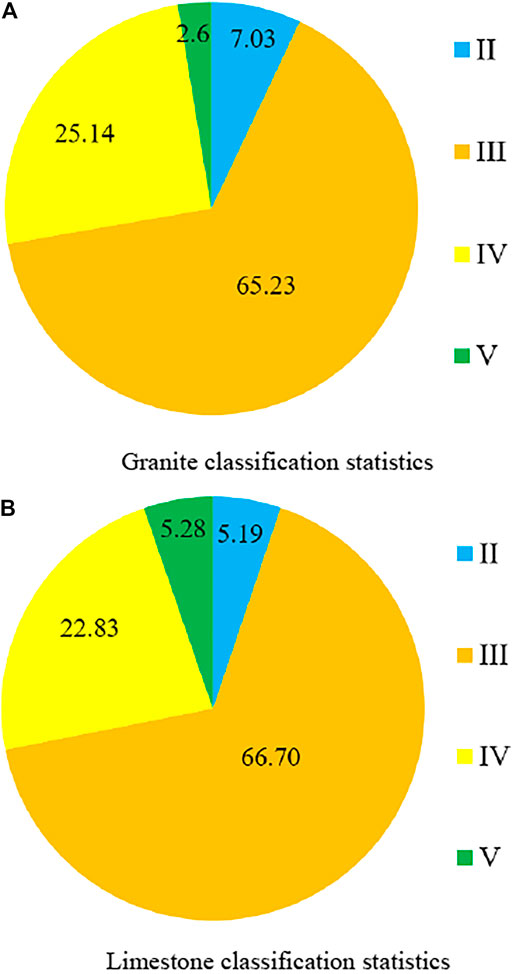
FIGURE 4. Statistics on geological conditions of TBM construction section. (A) Granite classification statistics; (B) Limestone classification statistics.
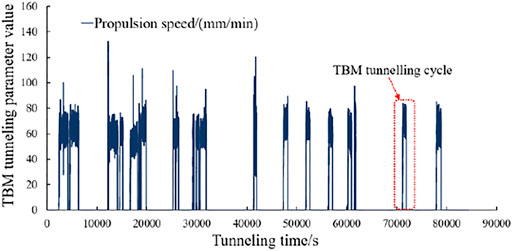
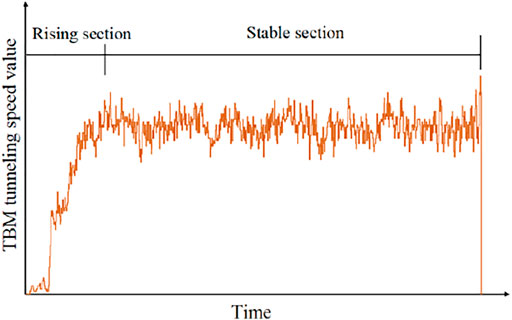
The data of the TBM3 bit section is taken as the research object. The data collection frequency is 1 Hz, and an average of 86,400 data are collected every day. Each data includes 199-dimensional TBM tunneling parameters such as the propulsion speed, total thrust, cutter head torque and cutter head power. As shown in Figure 5, the TBM tunneling process is composed of several tunneling cycles. Generally, the cylinder stroke is used as one tunneling cycle, with about 10–20 tunneling cycles per day. The tunneling data of a complete tunneling cycle is selected to predict the tunneling parameters of the stable segment of the next tunneling cycle, thereby judging the tunneling state of TBM.
Data Preprocessing
Figure 5 shows that the TBM tunneling parameter-time variation in a certain day. The adjacent tunneling cycles are divided by the shutdown state. The shutdown data (that is, the data with the TBM tunneling parameter value of 0) belongs to useless data for the machine learning algorithm. For eliminating the influence of the shutdown state data, the binary state discriminant function is constructed to preprocess the original working data and extract the effective tunneling data of each tunneling cycle from the record file. The formula for judging whether the TBM tunneling parameter value is the data of the shutdown section is as follows:
where, I is the binary state discriminant function; N is the propulsion speed; F is total thrust; T is cutter head torque; V is cutter head power. When the binary state discriminant function I = 0, it means that this segment of data is the shutdown segment data; when I = 1, it means that this segment of data is the TBM normal running state data.
Due to the influence of equipment factors, construction environment and construction experience of operators, there are abnormal working conditions in the collected data samples, which affect the prediction accuracy of the model. Therefore, the 3
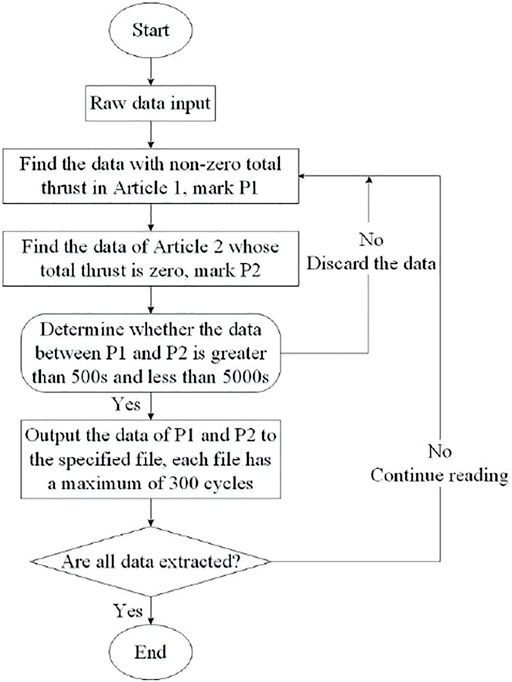
The original data is read row by row, and the input data is marked and judged based on total thrust. The first total thrust (non-zero value) data is marked as P1; then continue to read the next data, and the second total thrust (zero value) data is marked as P2. Subsequently, it is necessary to determine whether the data between P1 and P2 is within the range of 500 s to 5,000 s. If not, discard the data; if it is, output the data of P1 and P2 to the corresponding file. According to the above method, all data are sequentially extracted, and the data preprocessing process ends. Based on data preprocessing, a total of 9,900 groups of valid tunneling cycles were extracted, 9,350 groups of tunneling cycles were randomly selected as the model training set, and the remaining 550 groups of tunneling cycles were used as the model test set.
Tunneling Cycle Extraction
In accordance with the data preprocessing results, the working state of the TBM at each moment is determined, and valid data samples are extracted, wherein each group of continuous tunneling sequences corresponds to a complete tunneling cycle, and the data between adjacent tunneling cycles corresponds to a set of stop data. As shown in Figure 7, the TBM tunneling process can generally be divided into an ascending segment and a stable segment.
In the existing TBM tunneling parameter prediction research, several scholars such as Hou et al. (Hou et al., 2020) and Zhou et al. (Zhou et al., 2020) usually analyze and predict the parameters of the stable segment based on the data of the ascending segment, which helps the driver to judge the tunneling state and optimize the adjustment of parameters to a certain extent. However, the method of predicting TBM tunneling parameters by using the ascending segment data requires a lot of time to identify and extract data. The accuracy of the ascending segment identification directly affects the model prediction performance. Therefore, how to avoid the extraction of invalid features of the ascending segment is still an urgent problem to be solved. Secondly, the duration of the ascending segment is short, and the amount of data contained is limited, which cannot completely and accurately display the law of rock-machine interaction. In addition, the stable segment occupies most time of the total tunneling section. For the geological conditions that may be different from the ascending segment, when only the rock-machine interaction law of the ascending section is used to reflect the working state of the TBM stable segment, there will be large error. Therefore, this paper uses the data of the complete tunneling period to train the prediction model, which can effectively reduce the complexity and difficulty of the huge data processing generated during the TBM tunneling process, greatly improve the data preprocessing efficiency, and more accurately display the rock-machine interaction. It can provide a higher-quality intelligent decision-making method for TBM tunneling construction (Figure 8).

FIGURE 8. Comparison of the prediction processing flow between the ascending segment and the complete cycle. (A) Ascending segment prediction (Hou et al., 2020); (B) complete cycle prediction.
Prediction Model Based on PSO-Bi-LSTM
Feature Selection
The construction conditions of TBM tunneling are often complex, and the data generated during the working process of the equipment contains 199- dimensional parameters. However, when predicting TBM tunneling parameters, the selection of characteristic variables is not the better. On the one hand, too many parameters will cause the model dimension to be too high and the calculation will be slow; on the other hand, some parameters are not highly correlated with the prediction parameters, and too many selections will reduce the model prediction accuracy. Therefore, it is necessary to perform feature selection on the 199-dimensional tunneling parameters in the TBM operating data, with the aim of assisting the optimization and adjustment of the TBM tunneling parameters.
There are many factors affecting the prediction of TBM tunneling parameters, but most of the parameters that characterize the law of rock-machine interaction are greatly influenced by human factors and have poor correlation with rock-machine interaction, so they cannot be directly used for model prediction and analysis. Therefore, this paper only selects the propulsion speed, total thrust, cutter head torque and cutter head power of the TBM tunneling stable segment as the output characteristics of the model.
The selection of input features is of great significance to the parameter optimization of the model and the efficiency of intelligent decision-making. Based on the complexity of the model, the accuracy of prediction and the comprehensive consideration of previous studies, this paper uses Pearson correlation analysis to identify the 199-dimensional TBM tunneling parameters, eliminates irrelevant parameter variables, and selects key model parameters as model inputs. The formula for calculating the Pearson correlation coefficient is as follows:
1) Calculate the average of the data:
2) Calculate the variance of the data:
3) Compute data covariance:
4) Calculate data correlation:
where,
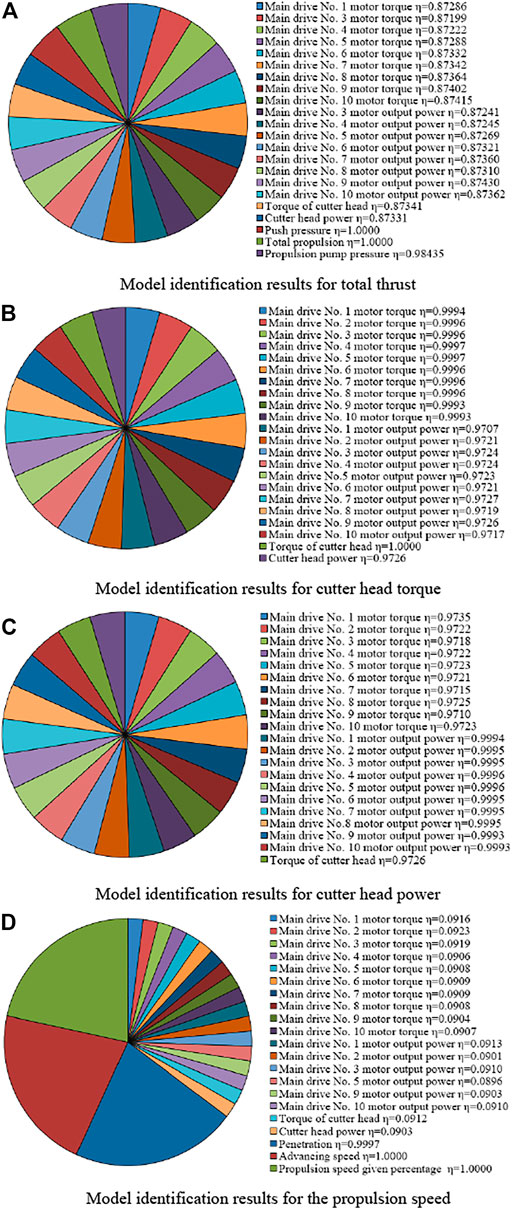
Based on the Pearson correlation analysis results, the PSO-Bi-LSTM model constructed in this paper selects the 21 key parameters with the highest correlation with the predicted parameters in the complete tunneling cycle data as the input features of the model, to realize the prediction and analysis of the four key parameter indicators in the TBM stable segment. The 21-dimensional input feature identification results corresponding to the four prediction parameters of the model divided according to the size of the correlation coefficient of each parameter are shown in Figure 9.
To solve the problems of low prediction efficiency and slow convergence speed caused by the dimensional difference between the tunneling parameters, this paper normalizes the input data of the model, and the formula is as follows:
where,
Model Establishment
Figure 10 shows the TBM tunneling parameter prediction model based on the PSO-Bi-LSTM. Before using the PSO to optimize, the Bi-LSTM model structure needs to be determined first. Compared with the unidirectional LSTM, a back-propagation layer is added. Each layer of this structure contains two parallel layers, which control the forward and backward outputs respectively, and can utilize the contextual information in the meanwhile.
After data preprocessing, the original data is divided into training set and test set in a ratio of 17:1. The 21 key parameters with the highest correlation with a certain tunneling parameter to be predicted in the complete tunneling cycle extracted from the training set are input into the Bi-LSTM. The Bi-LSTM is optimized by PSO, and the global optimal solution obtained by iterative optimization is input into the Bi-LSTM.
Model Training and Evaluation
To verify the generalization ability of the model, this paper adopts the goodness of fit
where,
The preprocessed data set is divided into training set and test set proportionally, in which the data of the training set is continuously used to iteratively optimize the model and update the model parameters; the test set is used to test the performance of the model and verify the generalization ability of the model. To improve the accuracy of the training model, this paper uses the Adam optimizer to update and optimize the network, and the loss function is the MSE function. The number of hidden layer nodes and layers will be discussed in Model Parameter Analysis. A fully connected layer is added after the hidden layer, and the learned distributed feature representation is mapped to the sample label space, so that the output feature dimension is represented as one dimension, which speeds up the model calculation efficiency. Considering the prevention of the model from overfitting, each layer of unit is regularized, and the dropout probability is set to 0.3. The maximum number of iterations is set to 50. When the number of iterations reaches the requirement or the average loss value no longer decreases with the iterations, the training is stopped.
Model Parameter Analysis
Before using PSO to optimize Bi-LSTM, the network structure of Bi-LSTM needs to be determined. Parameters such as the number of hidden layer nodes, the number of hidden layers, and the training learning rate
1) Discussion on number of hidden layer nodes in Bi-LSTM network
In the Bi-LSTM neural network, the selection of the number of hidden layer nodes is extremely important, which not only has a great impact on the performance of the neural network model, but also is the direct cause of overfitting. However, the theory of determining the optimal number of hidden layer nodes in neural networks is not yet mature. Research shows that the number of hidden layer nodes is not only related to the number of input/output layer nodes, but also depends on the complexity of the problem to be solved and the characteristics of the sample. If the number of nodes is too large, it is prone to over-fitting, which reduces the generalization ability of the model; if the number of nodes is too small, the model cannot fully learn the characteristics of time series data and reduces the performance of the model. To solve the above problems, scholars have proposed a variety of discrimination methods to determine the number of hidden layer units based on many experimental studies (Liu et al., 2012; Han et al., 2020; Zheng et al., 2020). In this study, the empirical formula is used to determine the value range of the number of hidden layer units:
where,
To prevent the model from overfitting and reduce the complexity of the model, the maximum number of iterations of the model in this section is 50, and the number of particle swarm populations is 30; other parameters such as the number of hidden layers is set to two according to experience, the learning rate is set to 0.001, and the value range of the number of the hidden layer is 3–13. Figure 11 shows the prediction of the propulsion speed with different numbers of hidden layer units based on lots of training samples. As the number of hidden layer units increases, the mean absolute percent error first decreases and then increases, and the goodness of fit first increases and then decreases. Too many or too few hidden layer nodes will reduce the prediction performance of the model. To sum up, when the number of nodes is 5, the prediction effect is optimal, so the number of hidden layer nodes in this model is set to 5.
2) Discussion on hidden layers of Bi-LSTM network
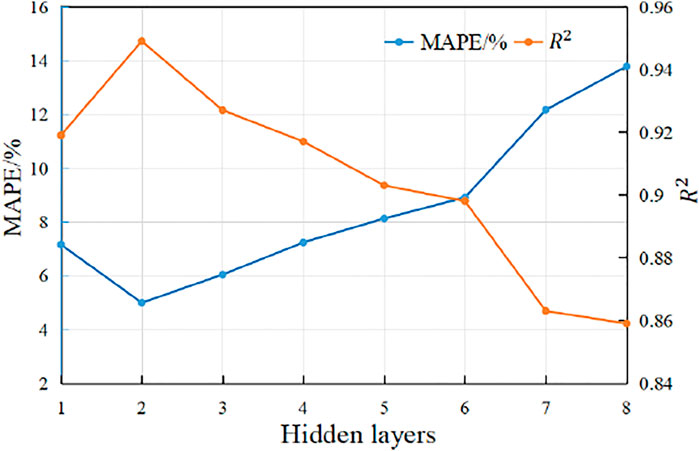
For the sake of exploring the optimal network structure, the number of layers of the model is further analyzed and studied. Theoretically, the prediction performance of the model is proportional to the number of hidden layers, but the time cost of model training increases gradually with the increase of the number of layers, the convergence effect and efficiency drop sharply, and the model often falls into the dilemma of local optimal solution, which leads to training long-term dependency problems such as information loss and gradient disappearance in the process.
Taking the propulsion speed as an example, the number of hidden layer nodes is set to 5, the maximum number of iterations is 50, the number of particle swarm populations is 30, the range of layers is set to 1∼8 based on experience, and the learning rate is 0.001.
As shown in Figure 12, when the number of hidden layers of Bi-LSTM is 2, the model accuracy is higher than that of single layer. However, the increase of the number of layers did not improve the prediction performance of the model. On the contrary, it fell into the problem of unable to find the global optimal solution, which greatly increased the risk of overfitting. Therefore, the number of hidden layers in this paper is selected as 2.
3) Discussion on learning rate
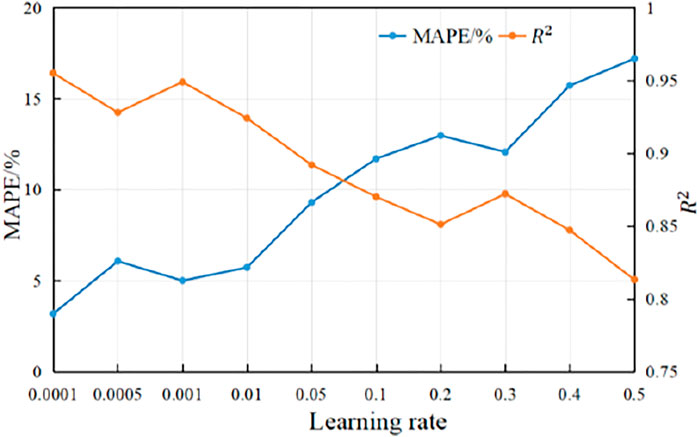
After the Bi-LSTM neural network structure is determined, the training learning rate of the model needs to be discussed. As an important hyperparameter in deep learning, the learning rate determines whether the objective function can converge to the local minimum and the convergence efficiency. If the learning rate is set too small, the convergence process is very slow, and even the algorithm does not converge; if the learning rate is set too large, the algorithm is prone to oscillation or divergence, resulting in gradient explosion (Shen et al., 2020). Therefore, the maximum number of iterations of the established model is 50, the number of particle swarm populations is 30, the number of hidden layer nodes is set to 5, the number of layers is set to 2, and the learning rate is set to 0.0001, 0.0005, 0.001, 0.01, 0.05, 0.1, 0.2, 0.3, 0.4, 0.5 according to experience, respectively.
Taking the propulsion speed as an example, Figure 13 shows the prediction results of the model under different learning rates. When the learning rate is 0.001, the prediction result of the model is the most stable, the MAPE is relatively low compared to other cases, and the goodness of fit is relatively high, so this paper selects the model learning rate of 0.001.
In summary, the final structural parameters of the model are determined through experimental research: the number of hidden layers is 2, the number of nodes is 5, and the learning rate is 0.001.
Model Application and Comparison
Application of PSO-Bi-LSTM Model Under Different Surrounding Rock Grades
In the actual tunneling process, the interaction between the TBM and the surrounding rock produces a complex rock-machine relationship. How to realize the real-time perception of the current rock mass information and ensure that the current TBM tunneling state matches the complex and changeable rock mass conditions is still a hot issue in TBM construction. This section studies the prediction performance of PSO-Bi-LSTM model under different surrounding rock grades based on the construction database of TBM3 bid section of Songhua River water conveyance project in Jilin Province. The 21-dimensional parameters with the highest correlation with the predicted parameters in the complete tunneling cycle are selected as the input features of the model to realize the prediction and analysis of the four key parameters (total thrust, the propulsion speed, cutter head torque and cutter head power) in the stable segment of the TBM tunneling; and the goodness of fit
The data samples in this paper are collected from a certain construction section of the TBM3 bid section. Based on the data preprocessing, a total of 9,900 valid tunneling cycles are extracted, and 9,350 tunneling cycles are randomly selected as the model training set, and the remaining data are used as the model test set. It is used to verify the applicability of the trained model to different surrounding rock levels. Among them, the surrounding rock grades are mainly distributed in grades II to V, among which grade III surrounding rock accounts for the largest proportion in this tunneling section, and there are relatively few grades II and V surrounding rock.
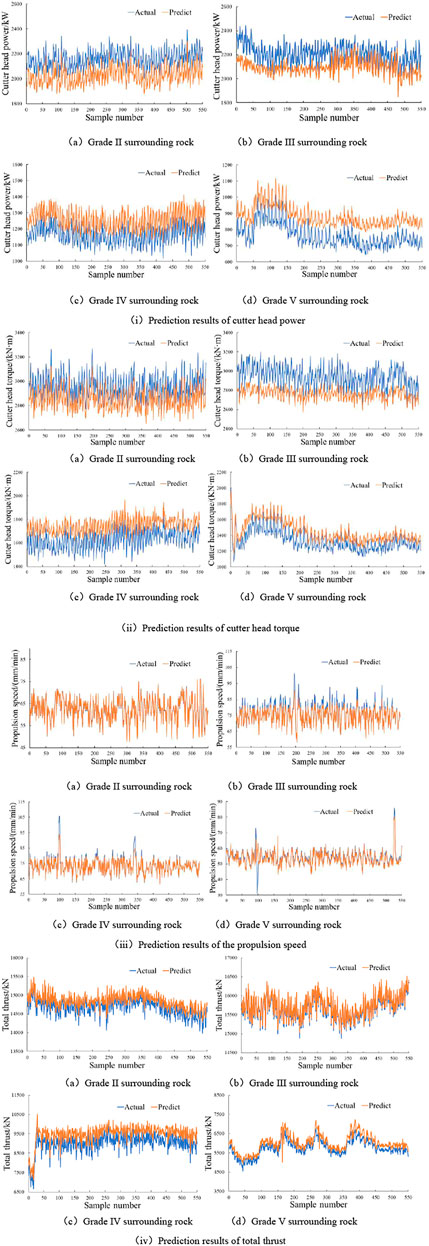
Figure 14 shows the prediction results of the PSO-Bi-LSTM model under different surrounding rock levels. It can be seen from the analysis of the figure that the predicted result and the measured value of each tunneling parameter have a high degree of fitting, and there is a large deviation only in individual samples. In addition, the prediction agreement between the propulsion speed and total thrust is the highest under the conditions of different surrounding rock grades; the prediction agreement between cutter head power and cutter head torque is relatively low.
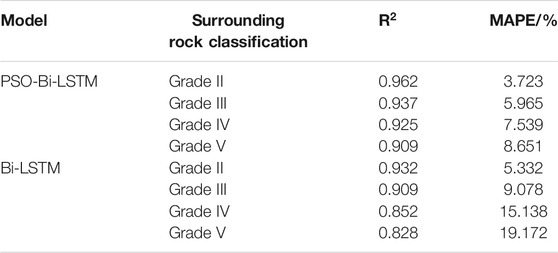
Table 1 shows the statistical analysis results of the evaluation indicators of the four key tunneling parameters under different surrounding rock grades. From the analysis of the goodness of fit and error of the prediction results, the PSO-Bi-LSTM model has high prediction accuracy. The higher the goodness of fit

TABLE 1. Statistics of evaluation indicators of four tunneling parameters under different surrounding rock grades.
In consideration of the influence of different surrounding rock grades on the prediction effect of the model, it can be found that the average values of
Comparison With the Prediction Effect of the Bi-LSTM Model
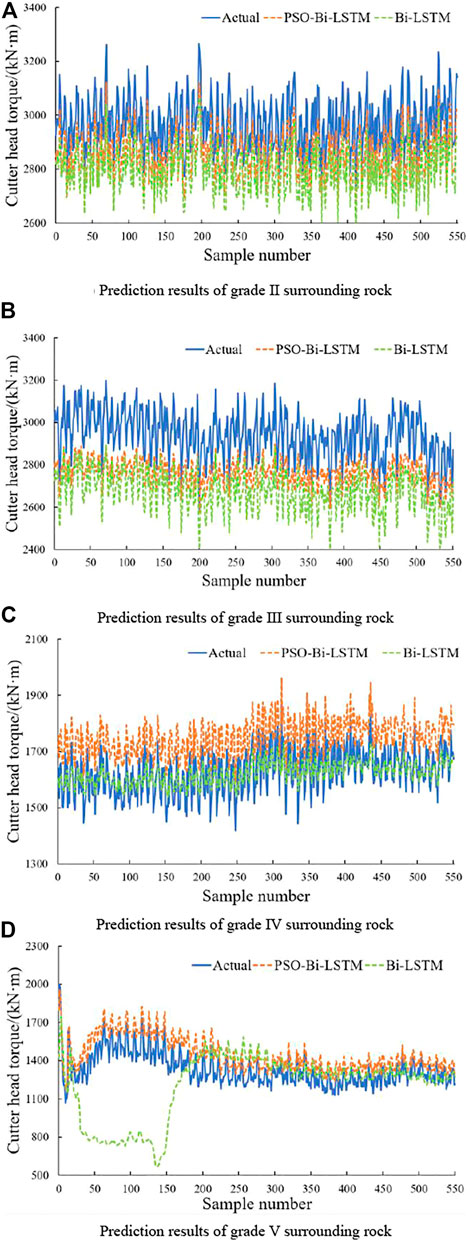
The same set of data was selected to quantitatively analyze the prediction performance of the Bi-LSTM model under different surrounding rock levels. Since total thrust is less affected by external factors, and the propulsion speed and cutter head torque are greatly affected by external rock mass information factors and have high sensitivity to the rock-machine relationship, this section takes cutter head torque as the research object and predict and analyze different surrounding rock grades in turn, and the prediction result is shown in Figure 15.
Figure 15 shows that the fluctuation of the prediction result curve of the Bi-LSTM model for cutter head torque under all levels of surrounding rock is significantly larger than that of the PSO-Bi-LSTM model. Combining with Table 2, among the grade II, III, IV and V surrounding rocks, the MAPE of the Bi-LSTM model is 1.938, 3.765, 1.890, and 3.408%, respectively, which is much larger than that of the PSO-Bi-LSTM model. On the one hand, it shows that the prediction accuracy of the traditional Bi-LSTM model is relatively poor; on the other hand, the Bi-LSTM model optimized by PSO can almost accurately predict the change law of tunneling parameters under different surrounding rock levels. This shows that the PSO-Bi-LSTM model has higher prediction accuracy and faster convergence speed for time sample series and can more effectively predict TBM tunneling parameters.
Given all of that, compared with the Bi-LSTM, the prediction model based on PSO-Bi-LSTM has better prediction performance and generalization ability. It can assist the safe and efficient tunneling of TBM under different stratum conditions and provide certain guidance for the optimization and adjustment of parameters.
Conclusion
To make the model better match the characteristics of TBM construction data under different surrounding rock levels, this paper uses PSO to optimize the Bi-LSTM model and establishes the PSO-Bi-LSTM model. This paper takes the construction data set of the TBM3 bid section of Songhua River water conveyance project as the research object and uses plenty of data processing methods such as constructing a binary state function and
1) An intelligent prediction model of TBM tunneling parameters based on PSO-Bi-LSTM is proposed. The prediction analysis was carried out for the formation sections under different surrounding rock grades, and the time series prediction method of the tunneling parameters was given by the PSO-Bi-LSTM model. The average
2) Different from the existing methods that use the data of the ascending segment to predict the tunneling parameters of the stable segment, this paper selects the data of the complete tunneling cycle to predict the tunneling parameters of the stable segment. The amount of data contained is rich, which can improve the quality of intelligent decision-making during TBM construction.
3) The higher the surrounding rock grade, the smaller the prediction error and the higher the prediction accuracy of the PSO-Bi-LSTM model. The fluctuations of the prediction results on the propulsion speed and total thrust are smaller in surrounding rocks at all levels, and the prediction performance is relatively stable.
4) Compared with the Bi-LSTM, the intelligent prediction method proposed in this paper has stronger prediction performance for different surrounding rock grades and different prediction parameters. This method can effectively assist the optimization and adjustment of tunneling parameters during TBM construction and can provide a more effective intelligent decision-making method for TBM-assisted intelligent construction.
Data Availability Statement
The original contributions presented in the study are included in the article/Supplementary Material, further inquiries can be directed to the corresponding author.
Author Contributions
All authors listed have made a substantial, direct, and intellectual contribution to the work and approved it for publication.
Funding
Fundamental Research Funds for the Central Universities (Project No: FRF-TP-20-043A1), Open Research Fund Program of State Key Laboratory of Hydroscience and Engineering (Project No: sklhse-2021-C-04), and Science and Technology Project of Huaneng Group Headquarters (Project No: HNKJ19-H15) are gratefully acknowledged. The data are from the National Program on Key Basic Research Project (973 Program) (Grant No. 2015CB058100).
Conflict of Interest
CD, SD, and KS were employed by the HUANENG company.
The remaining authors declare that the research was conducted in the absence of any commercial or financial relationships that could be construed as a potential conflict of interest.
Publisher’s Note
All claims expressed in this article are solely those of the authors and do not necessarily represent those of their affiliated organizations, or those of the publisher, the editors and the reviewers. Any product that may be evaluated in this article, or claim that may be made by its manufacturer, is not guaranteed or endorsed by the publisher.
References
Afradi, A., Ebrahimabadi, A., and Hallajian, T. (2021). Prediction of TBM Penetration Rate Using Fuzzy Logic, Particle Swarm Optimization and Harmony Search Algorithm. Geotechnical Geol. Eng., 1–24. doi:10.1007/s10706-021-01982-x
Barton, N. R. (2000). TBM Tunnelling in Jointed and Faulted Rock. Balkema,Rotterdam: CRC Press, 3–38.
Entacher, M., Lorenz, S., and Galler, R. (2014). Tunnel boring Machine Performance Prediction with Scaled Rock Cutting Tests. Int. J. Rock Mech. Mining Sci. 70, 450–459. doi:10.1016/j.ijrmms.2014.04.021
Evans, I. (1965). The Force Required to Cut Coal with blunt Wedges. Int. J. Rock Mech. Mining Sci. Geomechanics Abstr. 2 (01), 1–12. doi:10.1016/0148-9062(65)90018-5
Feng, G. L., Chen, B. R., Xiao, Y. X., Jiang, Q., Li, P. X., Zheng, H., et al. (2022). Microseismic Characteristics of Rockburst Development in Deep TBM Tunnels with Alternating Soft–Hard Strata and Application to Rockburst Warning: A Case Study of the Neelum–Jhelum Hydropower Project. Tunnelling Underground Space Techn. 122, 104398. doi:10.1016/j.tust.2022.104398
Feng, G. L., Feng, X. T., Chen, B. R., Xiao, Y. X., and Yu, Y. (2015). A Microseismic Method for Dynamic Warning of Rockburst Development Processes in Tunnels. Rock Mech. Rock Eng. 48 (05), 2061–2076. doi:10.1007/s00603-014-0689-3
Gao, X., Shi, M., Song, X., Zhang, C., and Zhang, H. (2019). Recurrent Neural Networks for Real-Time Prediction of TBM Operating Parameters. Automation in Construction 15, 130–140. doi:10.1016/j.autcon.2018.11.013
Gertsch, R., Gertsch, L., and Rostami, J. (2007). Disc Cutting Tests in Colorado Red Granite: Implications for TBM Performance Prediction. Int. J. Rock Mech. Mining Sci. 44 (02), 238–246. doi:10.1016/j.ijrmms.2006.07.007
Graves, A., Liwicki, M., Fernández, S., Bertolami, R., Bunke, H., and Schmidhuber, J. (2009). A Novel Connectionist System for Unconstrained Handwriting Recognition. IEEE Trans. Pattern Anal. Mach Intell. 31 (05), 855–868. doi:10.1109/TPAMI.2008.137
Han, Y., Ding, N., Geng, Z., Wang, Z., and Chu, C. (2020). An Optimized Long Short-Term Memory Network Based Fault Diagnosis Model for Chemical Processes. J. Process Control. 92, 161–168. doi:10.1016/j.jprocont.2020.06.005
Hou, G. Y., Xu, Z. D., Liu, X., and Jin, C. (2019). Improved Particle Swarm Optimization for Selection of Shield Tunneling Parameter Values. CMES-Computer Model. Eng. Sci. 118 (02), 317–337. doi:10.31614/cmes.2019.04693
Hou, S. K., and Liu, Y. R. (2021). Numerical Simulations of Double-Shield TBM Tunneling for Analyzing Shield Jamming Control Factors. J. Tsinghua Univ. (Science Technology) 61 (08), 809–817. doi:10.16511/j.cnki.qhdxxb.2021.26.013
Hou, S. K., Liu, Y. R., and Zhang, K. (2020). TBM Tunneling Parameter Prediction Based on IPSO-BP Hybrid Model. Chin. J. Rock Mech. Eng. 39 (08), 1648–1657. doi:10.13722/j.cnki.jrme.2019.1084
Jin, L., Li, S., and Hu, B. (2018). RNN Models for Dynamic Matrix Inversion: A Control-Theoretical Perspective[J]. IEEE Trans. Ind. Inform. 14 (01), 189–199. doi:10.1109/tii.2017.2717079
Jing, X., Xia, Y. M., Ji, Z. Y., and Zhou, X. W. (2019). Soft Rock Cutting Mechanics Model of TBM Cutter and Experimental Research. ICIRA Intell. Robotics Appl. 5928, 383–391. doi:10.1007/978-3-642-10817-4_38
Krause, H. (1976). Geologische Erfahrungen beim Einsatz von Tunnelvortriebs maschinen in Baden-Württemberg. Vienna: Springer. doi:10.1007/978-3-7091-8452-3_3
Liu, Y., Zhong, P. A., Zhang, M. R., Kong, Y., and Xu, B. (2012). Application Effect Evaluation of Empirical Formula of Hidden Layer Node Number in Reservoir Operation Rule Extraction. Water Resour. Power 30 (11), 42–44.
Liu, Z. B., Li, L., Fang, X. L., Qi, W. B., Shen, J. M., Zhou, H. Y., et al. (2021). Hard-rock Tunnel Lithology Prediction with TBM Construction Big Data Using a Global-Attention-Mechanism-Based LSTM Network. Automation in Construction 15, 130–140. doi:10.1016/j.autcon.2021.103647
Mahdevari, S., Shahriar, K., Yagiz, S., and Akbarpour Shirazi, M. (2014). A Support Vector Regression Model for Predicting Tunnel boring Machine Penetration Rates. Int. J. Rock Mech. Mining Sci. 72, 214–229. doi:10.1016/j.ijrmms.2014.09.012
Rostami, J. (1997). “Development of a Force Estimation Model for Rock Fragmentation with Disc Cutters through Theoretical Modeling and Physical Measurement of Crushed Zone Pressure,” (Golden: Colorado School of Mines). Ph.D. Thesis.
Shen, H. J., Luo, Y., Zhao, Z. C., and Wang, H. J. (2020). Prediction of Summer Precipitation in China Based on LSTM Network. Clim. Change Res. 16 (03), 263–275. doi:10.11896/j.issn.1002-137X.2018.04.009
Si, N. W., Wang, H. J., Li, W., Shan, Y. D., and Xie, P. C. (2018). Chinese Part of Speech Tagging Model Based on Attention Long Short- Term Memory Network. Comp. Sci. 45 (004), 66–70. doi:10.11896/j.issn.1002-137X.2018.04.009
Sun, W., Shi, M., Zhang, C., Zhao, J., and Song, X. (2018). Dynamic Load Prediction of Tunnel boring Machine (TBM) Based on Heterogeneous In-Situ Data. Automation in Construction 92 (05), 23–34. doi:10.1016/j.autcon.2018.03.030
Tan, Y. M., Wang, M. W., and Li, M. X. (2018). Automatic post Editing of Neural Network Translation Based on Translation Quality Estimation. Acta Scientiarum Naturalium Universitatis Pekinensis 54 (02), 255–261. doi:10.13209/j.0479-8023.2017.153
Tao, H., Wang, J., and Zhang, L. (2015). “Prediction of Hard Rock TBM Penetration Rate Using Random Forests,” in 27th Chinese Control and Decision Conference (CCDC), Qingdao, China, 23-25 May 2015 (IEEE).
Vlachas, P. R., Byeon, W., Wan, Z. Y., Sapsis, T. P., and Koumoutsakos, P. (2018). Data-driven Forecasting of High-Dimensional Chaotic Systems with Long Short-Term Memory Networks. Proc. R. Soc. A. 474 (2213), 20170844. doi:10.1098/rspa.2017.0844
Wang, R. H., Li, D. Q., Chen, E. J., and Liu, Y. (2021). Dynamic Prediction of Mechanized Shield Tunneling Performance. Automation in Construction 132, 1–14. doi:10.1016/j.autcon.2021.103958
Wen, S., Zhao, Y. X., and Yang, S. Q. (2009). TBM Tunneling Speed Prediction Based on Monte Carlo BP Neural Network. Rock Soil Mech. 30 (10), 3127–3132. doi:10.3969/j.issn.1000-7598.2009.10.040
Xiong, F., Hu, Z. P., Ren, X., and Zhang, P. (2017). Application of BP Neural Network Based on MATLAB in Predicting TBM Tunneling Speed. Mod. Tunnel Techn. 54 (05), 101–107. doi:10.13807/j.cnki.mtt.2017.05.014
Yagiz, S. (2006). A Model for the Prediction of Tunnel boring Machine Performance. Proc. 10th IAEG Congress, 1–10.
Yang, Y., Feng, G. L., Xu, C. J., Chen, B. R., Geng, D. X., and Zhu, B. T. (2022). Quantitative Threshold of Energy Fractal Dimension for Immediate Rock-Burst Warning in Deep Tunnel: a Case Study. Lithosphere, 1699273.
Zhang, N., Li, J. B., Jing, L. J., Li, P. Y., and Xu, S. T. (2018). Study and Application of Intelligent Control System of TBM Tunneling Parameters. Tunnel Construction 38 (10), 1734–1740. doi:10.3973/j.issn.2096-4498.2018.10.019
Zhang, P., Wu, H. N., Chen, R. P., Dai, T., Meng, F. Y., and Wang, H. B. (2020). A Critical Evaluation of Machine Learning and Deep Learning in Shield-Ground Interaction Prediction. Automation in Construction 106, 1–14. doi:10.1016/j.tust.2020.103593
Zhang, Q., Huang, T., Huang, G. Y., Cai, Z. X., and Kang, Y. L. (2013). Theoretical Model for Loads Prediction on Shield Tunneling Machine with Consideration of Soil-Rock Interbedded Ground. Sci. China Technol. Sci. 56 (09), 2259–2267. doi:10.1007/s11431-013-5302-6
Zhang, Q. L., An, Z. Z., Liu, T. Y., Zhang, Z. S., and Huangfu, Z. H. (2020). Intelligent Control Theory of Earth-Rock Dam Compaction. J. Hydroelectric Eng. 39 (07), 34–40. doi:10.11660/slfdxb.20200704
Zhang, Q. L., Ma, R., Hu, Y., An, Z. Z., Yin, T., and Li, Q. B. (2021). Intelligent Control Theory of thermal Stress in Mass concrete Structures. J. Hydroelectric Eng. 40 (05), 11–21. doi:10.11660/slfdxb.20210502
Zhang, Y., Zhang, P. Y., and Yan, Y. H. (2018). Far Field Speech Recognition Based on Attention LSTM and Multitasking Learning. J. Tsinghua Univ. (Science Technology) 58 (03), 249–253. doi:10.16511/j.cnki.qhdxxb.2018.25.016
Zhang, Y., Zhang, Y. B., and Chen, L. (2021). Optical Surface Impurity Detection Based on Deep Learning. Acta Physica Sinica 70 (16), 353–361. doi:10.7498/aps.70.20210403
Zhang, Z. M., Li, X. Y., and Ji, J. (2021). TBM Tunneling Parameter Prediction Model Based on LS-SVM. J. Hohai Univ. (Natural Sciences) 49 (04), 373–379. doi:10.3876/j.issn.1000-1980.2021.04.012
Zhao, S. F., and Dong, X. Y. (2018). Speech Recognition Based on Improved LSTM Deep Neural Network. J. Zhengzhou Univ. (Engineering Science) 39 (05), 63–67. doi:10.13705/j.issn.1671-6833.2018.02.004
Zheng, C., Deng, J. J., Hong, Z. X., and Wang, G. H. (2020). Prediction Model of Suspension Density in the Dense Medium Separation System Based on. LSTM. Process. 8 (08), 976. doi:10.3390/pr8080976
Zhou, S. Y., Kang, Y. L., Su, C. X., and Zhang, Q. (2016). Study on Prediction Model of TBM Driving Total Thrust Based on Mechanical Analysis. J. Mech. Eng. 52 (020), 76–82. doi:10.3901/jme.2016.20.076
Zhou, X. X., Gong, Q. M., Yin, L. J., Xu, H. Y., and Ban, C. (2020). Prediction of Tunneling Parameters in TBM Stable Section Based on BLSTM-AM Model. Chin. J. Rock Mech. Eng. 39 (S2), 3505–3515. doi:10.13722/j.cnki.jrme.2019.1158
Keywords: tunnel engineering, TBM, PSO-Bi-LSTM, tunneling parameter prediction, intelligent construction
Citation: Zhang Q, Zhu Y, Ma R, Du C, Du S, Shao K and Li Q (2022) Prediction Method of TBM Tunneling Parameters Based on PSO-Bi-LSTM Model. Front. Earth Sci. 10:854807. doi: 10.3389/feart.2022.854807
Received: 14 January 2022; Accepted: 27 January 2022;
Published: 09 March 2022.
Edited by:
Guang-Liang Feng, Institute of Rock and Soil Mechanics (CAS), ChinaReviewed by:
Yaxun Xiao, Institute of Rock and Soil Mechanics (CAS), ChinaMingyang Liu, Tianjin Research Institute of Water Transport Engineering, China
Zaizhan An, China Academy of Railway Sciences, China
Copyright © 2022 Zhang, Zhu, Ma, Du, Du, Shao and Li. This is an open-access article distributed under the terms of the Creative Commons Attribution License (CC BY). The use, distribution or reproduction in other forums is permitted, provided the original author(s) and the copyright owner(s) are credited and that the original publication in this journal is cited, in accordance with accepted academic practice. No use, distribution or reproduction is permitted which does not comply with these terms.
*Correspondence: Qingbin Li, cWluZ2JpbmxpQHRzaW5naHVhLmVkdS5jbg==
 Qinglong Zhang
 Yanwen Zhu1
 Rui Ma