
95% of researchers rate our articles as excellent or good
Learn more about the work of our research integrity team to safeguard the quality of each article we publish.
Find out more
ORIGINAL RESEARCH article
Front. Earth Sci. , 01 April 2022
Sec. Cryospheric Sciences
Volume 10 - 2022 | https://doi.org/10.3389/feart.2022.852054
This article is part of the Research Topic Cryosphere and Climate Change in the Arctic, the Antarctic and the Tibetan Plateau View all 24 articles
Solar radiation plays an important role in the cryospheric water cycle, especially in alpine regions. This study presents an evaluation of the Modern-Era Retrospective analysis for Research and Applications 2 (MERRA2), ERA5, High Asia Refined analysis version 2 (HAR v2), JRA-55, and National Centers for Environmental Prediction/Climate Forecast System Reanalysis datasets at different time scales by comparing observed datasets from July 2010 to December 2015 at 4,550 m in the Laohugou Basin. In terms of shortwave radiation, ERA5 performs significantly better than the other reanalysis radiation datasets. For downward shortwave radiation, HAR v2 performs better than ERA5 on only two timescales, 3 months and half-year, with mean absolute errors (MAEs) of 13.28 and 7.96 w/m2. The upward shortwave radiation, ERA5, outperforms the other reanalysis datasets on all 12 timescales. For downward longwave radiation, ERA5 also performs significantly better, with only MERRA2 outperforming ERA5 on the daily scale and annual scale, with R2, bias, root mean square error, and MAE of 0.6, 0.95, −9.51 w/m2, −9.41 w/m2, 34.98 w/m2, 9.46 w/m2, and 27.52 w/m2, 9.41 w/m2, respectively. In the upward longwave radiation, HAR v2 performs better than the other reanalysis datasets on all timescales, except for ERA5, which has a better R2 of 0.92 on the annual scale. All the reanalysis datasets can show the variation trend of the four radiation parameters in different seasons and achieve a better performance in winter. Therefore, ERA5 is recommended for regions without shortwave radiation observations, and HAR v2 and ERA5 are recommended for longwave radiation simulations. Although there are obvious shortcomings in the reanalysis radiation datasets, they still provide important supplementary information for research in high-altitude areas, where the observed datasets are too sparse.
Solar radiation is the main source of Earth’s energy (Li, 2015). Solar radiation and surface thermal conditions affect Earth’s energy balance, energy exchange, and ecohydrological processes (Liu et al., 2018), as well as the weather and climate (Fu et al., 2015). The Intergovernmental Panel on Climate Change (IPCC) reported that the atmosphere and cryosphere are undergoing rapid changes (Cao, 2021; IPCC, 2021). Therefore, the study of radiation as an important driver of climate evolution is important because of climate change. Previous radiation research was previously based on measured datasets, but sparse measured stations made it difficult to obtain spatially continuous and long time series of surface radiation datasets (Li et al., 2017; Zhang et al., 2018). Reanalysis datasets, which were introduced and rapidly developed in the 1990s, optimally combine observations of different types and sources with short-term weather forecasts through a constantly updated data assimilation system (Du et al., 2019; Yang et al., 2020). The development of reanalysis datasets has shown to be promising in the estimation of global surface radiation; nonetheless, the different models and assimilation techniques produce many systematic errors (Liang and Xia, 2005; Power and Mills, 2005; Shi et al., 2008; Deng et al., 2010; Shen et al., 2019). Therefore, it is necessary to evaluate the applicability of various reanalysis datasets and to obtain the appropriate reanalysis radiation data for research.
Currently, many scholars have evaluated the applicability of reanalysis datasets in different regions. At Dome A, Fu et al. (2015) evaluated the applicability of four reanalysis datasets, ERA-I, National Centers for Environmental Prediction (NCEP)–DOE, NCEP/NCAR, and JCDAS, using annual-scale radiation observations from February 2011 to January 2012 at the Southeast Polar Panda-1 station (73°39′S, 77°00′E) and showed that ERA-I was the best. Similarly, ERA-I is also more suitable for European regions than JRC-MARS based on longtime series solar radiation datasets from 1983 to 2005 (Bojanowski et al., 2014). However, ERA-I does not apply to all areas. For example, ERA-I performs worse than ITPCAS on the Tibetan Plateau (Du et al., 2019), and ERA-I is severely overestimated in western, northern, and Central China (Wang et al., 2020a). For other reanalysis datasets, Babar et al. (2019) evaluated four reanalysis radiation datasets, CLARA, SARAH, ERA5, and ASR, based on 31 observed stations in Norway. The results showed that the errors in ERA5 and ASR increased with an increase in cloudiness, with ERA5 overestimating TCWC under clear and moderate cloud cover conditions while underestimating it under cloudy conditions. Wang et al. (2020a) assessed the applicability of NCEP/DOE, ERA-Interim, and GLDASV2.1 using Chinese radiation observation datasets from 2000 to 2016. The results show that the precision of the abovementioned reanalysis datasets is higher in summer and autumn months than in winter and spring months. NCEP is severely overestimated in the eastern region, and GLDAS has the smallest average deviation. In the winter months, the errors are smaller in the high-elevation areas than in the low-elevation areas; however, they are not obvious in the summer months. Liu et al. (2018) validated and evaluated the SWDN-1.0 and SWDN-2.0 products using observations from 91 stations in China from 2009 to 2014 and compared them with the CERES-SYN1deg and ERA-Interim reanalysis irradiation datasets. The results show that CERES-SYN1deg is closest to the observed datasets, with R, root mean square error (RMSE), and bias of 0.92, 33.5, and 8.48 w/m2, respectively, and that ERA-Interim has the worst performance, with an R of 0.84. These studies are only assessed at annual or monthly scales and did not assess the reanalysis radiation datasets at hourly and daily scales. However, short time scale datasets are more important for the study of ice mass balance.
Moreover, many studies on reanalysis radiation dataset assessments have focused on low-latitude or flat terrain areas. In addition, few studies have focused on the application of reanalysis datasets in mountain regions with complex topography and severe climatic conditions. The preformation of all the reanalysis datasets in mountain regions is different because of different assimilation methods and resolutions. Although previous studies have evaluated different reanalysis datasets in different regions on long time scales (annual, seasonal, or monthly), the applicability of frequently used reanalysis datasets in alpine regions, especially in glacier cover zones or periglacial zones, warrants further discussion. Therefore, we want to evaluate the applicability of several reanalysis datasets at different time scales (from hourly to annually) in the Laohugou Basin of the western Qilian Mountains.
The observed stations were located in the Laohugou Basin (LHG) and 4,550 m a.s.l. The observed radiation datasets from 2010 to 2015 were selected to assess the applicability of five reanalysis radiation datasets (Modern-Era Retrospective analysis for Research and Applications2 [MERRA-2], JRA55, ERA5, NCEP–Climate Forecast System Reanalysis (CFSR)/CFS v2, and High Asia Refined analysis version 2 [HAR v2]) on different temporal-spatial scales in LHG. This approach facilitates the use and improvement of reanalysis radiation datasets in alpine regions with sparse observation stations and is important for the study and response to climate change in the Qilian Mountains.
The LHG is located on the northern slope of the western Qilian Mountains and belongs to the upper reaches of the Shule River, with a location of 39°25′–39°35′N, 96°31′–96°33′E (Zhang and Qin, 2017a). The length and width of the study area are 40 km from east to the west and 25 km from north to south, respectively. The LHG has a typical continental climate, with a large annual difference in temperature; the warmest month is in July, and the lowest temperature is in January. The average annual temperature is −9.1°C, and low temperatures occur year round at 4,550 m a.s.l. The LHG is controlled by westerly circulation, and the precipitation amount is approximately 390 mm, mainly concentrated from May to September and accounting for more than 70% of the annual precipitation (Zhang and Qin, 2017b). Air relative humidity and specific humidity show significantly higher values in July, August and September, with the maximum value measured in July. The type of daily variation in barometric pressure is double peak and double valley, and the seasonal variation shows a single peak and single valley (Li et al., 2017). There are 44 glaciers developed in the basin, with a total area of 54.32 km2 (Zhang and Qin, 2013). The LHG is located in the high value area of solar radiation in the country, and the total annual solar energy resources are very rich, up to 6,937.9 MJ/m2; the total radiation in spring and summer is larger than that in autumn and winter, with an annual average value of 220 W/m2, and the daily maximum value of total radiation is 35.5 MJ/m2 (Sun and Qin, 2011b).
The No. 12 glacier (5Y448D0012, Figure 1) is the most typical glacier in the LHG; it belongs to the extreme continental-type glacier, with an area of 21.91 km2 and a total length of 10.8 km, accounting for 40.3% of the glacier area and 65.8% of the ice reserves in the basin, which is the largest valley-type glacier in the Qilian Mountains (Zhang et al., 2017). Laohugou Glacier No. 12, which is composed of two branches from east and west, converges at an altitude of 4,560 m; the highest point is 5,483 m. The ice tongue end is 4,250 m; the relative altitude difference is greater than 1,000 m; and the mean elevation is 4,830 m, with a gentle slope (Li, 2015; Sun and Qin, 2011a). Laohugou Glacier No. 12 is the site of the first field station for glacier monitoring research in China (Shi, 1988) and interests many glaciologists because of its typical physical characteristics. Its glacial meltwater is an important source of recharge for the Changma River, with a water recharge of 40%, which eventually feeds into the Shule River (Du and Qin, 2012).
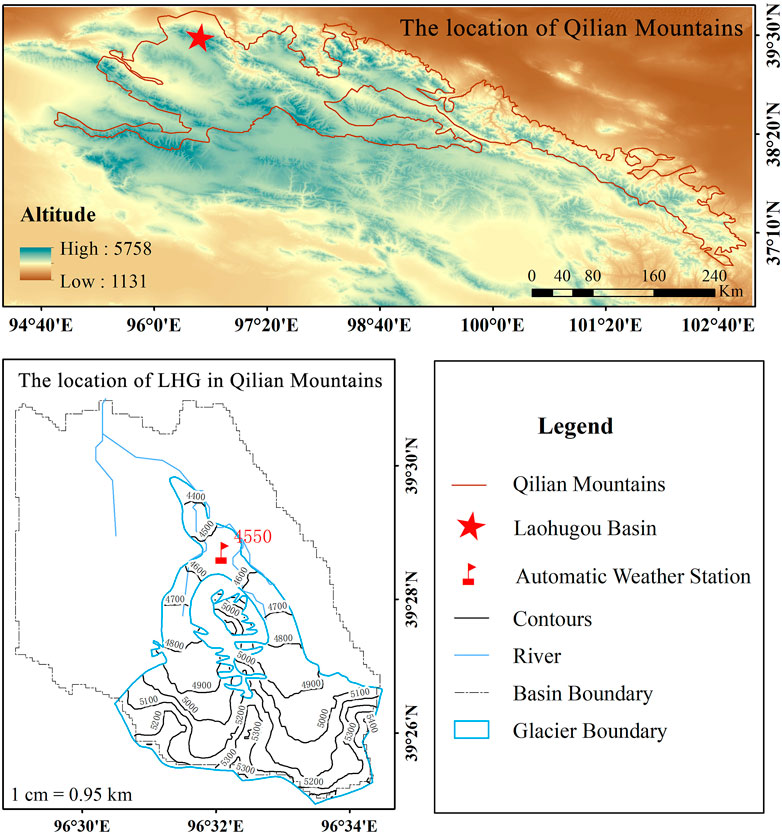
FIGURE 1. Geographical location of the Laohugou Basin with the spatial distribution of observation stations.
Radiation income and expenditure studies on mountain glaciers, where information is relatively sparse, are important for revealing the hydrothermal conditions of modern glacier development and glacier–climate interactions. The LHG is located in alpine regions, with a complex environment and few artificial observations, which need to be combined with reanalysis information. Thus, the LHG is important to evaluate the accuracy of reanalysis data in this basin.
Measured radiation datasets are derived from the automatic weather station (AWS) located in the ablation area of glaciers in LHG Glacier No. 12, with an elevation of 4,550 m in LHG (Figure 1). The AWS radiation sensor models are shown in Table 1. The equipment was calibrated and tested by the China Meteorological Administration in strict accordance with the Code of Practice for Specifications for Surface Meteorological Observation (China Meteorological Administration, 2003). All sensors are connected to a low-temperature–resistant data collector, the CR1000 (Campbell, USA), which collects data every 10 s and outputs an average value every 30 min. In this article, four components of radiation datasets from July 7, 2010, to December 31, 2015, were selected and divided into 12 timescales for analysis: hourly, 3 h, 6 h, half-day, daily, 3 days, 6 days, half-month, monthly, 3 months, half-year, and annually. All times in the article are in Beijing Time.
The radiation reanalysis datasets chosen for this article include the European Centre for Medium-Range Weather Forecasts (ECMWF) fifth generation of global climate and weather reanalysis products ERA5; JRA-55, which is a comprehensive climate reanalysis dataset produced by the Japan Meteorological Agency (JMA) (JRA-55: Japanese 55-year Reanalysis, Daily 3-Hourly and 6-Hourly Data, 2013); the NCEP CFSR and Climate Forecast System version 2 (Saha et al., 2010; National Center for Atmospheric Research Staff Eds, 2017); NASA’s atmospheric reanalysis, which is the second MERRA2; and the HAR v2, which is an atmospheric dataset generated within the framework of the CaTeNA project (Climatic and Tectonic Natural Hazards in Central Asia), which is funded by the Federal Ministry of Education and Research (Wang et al., 2020b). These five sets of reanalysis datasets are selected to match the radiation datasets with the measured data for evaluation. Detailed information on each reanalysis radiation dataset is shown in Table 2.
The reanalysis datasets consist of grid point data, whereas the observed data comprise site data. The reanalysis datasets are stratified by atmospheric pressure and correspond to different elevations. If the site elevation to be determined belongs to the upper and lower boundary layers of the reanalysis datasets, it can be calculated by interpolation and integration. Therefore, we evaluated the point-to-point applicability by interpolating the reanalysis radiation data to the corresponding station using the nearest-neighbor method based on the latitude, longitude, and altitude of 4,550 m a.s.l. The nearest neighbor method of interpolation directly applies the original data to fill in the points to be interpolated and uses the nearest of the four nearby grid points around the point to be sampled as the data for the point to be sampled (Liu and Luo, 2009). The formula is expressed as follows:
In this article, four evaluation indices were adopted to quantitatively assess the error characteristics of the suitability of the reanalysis radiation datasets, including the bias, RMSE, coefficient of determination (R2), and mean absolute error (MAE). These statistical metrics were calculated as follows:
(1) Bias
Reflects the degree to which the reanalysis radiation datasets deviate from the observed datasets (Fu et al., 2015). The formula is expressed as follows:
(2) RMSE
The smaller the value of RMSE is, the smaller the deviation of the reanalysis datasets from the observed datasets (Bromwich and Fogt, 2004). The formula is expressed as follows:
(3) Coefficient of determination (R2)
The coefficient of determination reflects what percentage of the fluctuations in y can be described by the fluctuations in x; that is, it characterizes what percentage of the variation in the dependent variable Y can be explained by the control of the independent variable X. The formula is expressed as follows:
Range of values: 0–1, the closer the value to 1, the better it fits.
(4) MAE
MAE avoids the problem of errors canceling each other out and accurately reflects the absolute error (Jia et al., 2004). The formula is expressed as follows:
In Eqs 2–5,
As seen from Figures 2, 3, on the hourly scale, the three sets of MERRA2, ERA5, and HAR v2 well fit the shortwave radiation, showing an underestimation for downward shortwave radiation (SW↓) and an overestimation for upward shortwave radiation (SW↑), with ERA5 having the lowest error and the best performance. The better fit of the reanalysis datasets on the 3-h scale improved. JRA55’s R2 of 0.46 and 0.37 were slightly lower than the R2 of the other three reanalysis datasets, and JRA55’s MAE of 153.83 w/m2, and 81.94 w/m2 for SW↓ and SW↑ were much higher than the MAE of the other three reanalysis datasets, which yield a poorer performance. At the 6-h scale, all four datasets are overestimated, except NCEP/CFSR, which underestimates SW↓. The R2 values for MERRA2, ERA5, and CFSR are similar, and the RMSE of 170.28 w/m2 for CFSR is the smallest of the five reanalysis datasets for the best performance. For SW↑, the fits for MERRA2, ERA5, HAR v2, and CFSR are similar, at 0.62, 0.65, 0.5, and 0.6, with RMSE and MAE for ERA5 at 93.88 and 57.6 w/m2 being the smallest of the five reanalysis datasets and achieving the best performance, whereas JRA55 has the largest error and the worst performance. On the 12-h scale, the fit of all five reanalysis datasets to SW↓ and SW↑ decreases; JRA55 and HAR v2 do not well fit the trends of both on the half-day scale, and ERA5 and CFSR perform best.
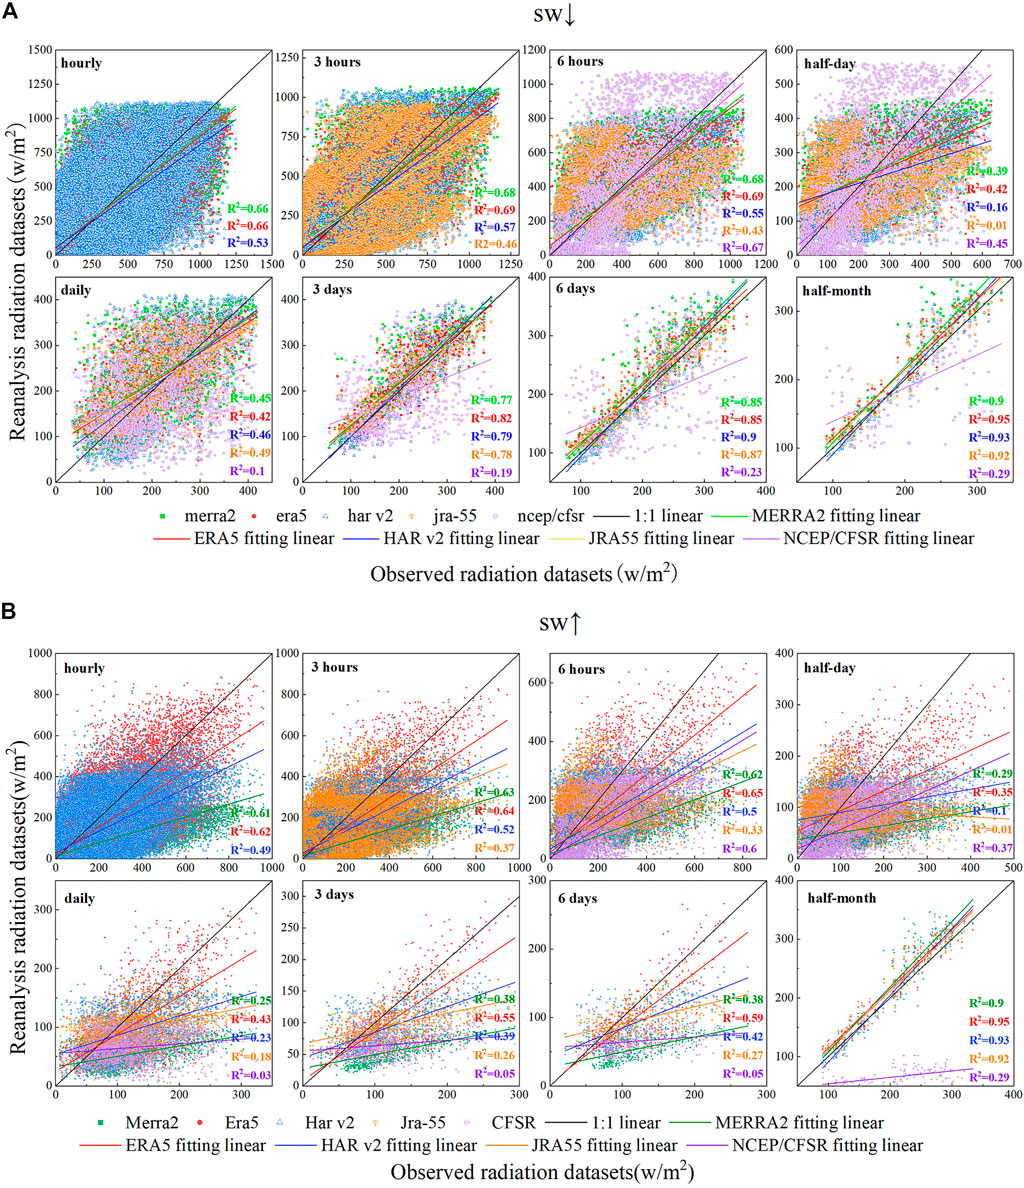
FIGURE 2. 2010–2015 Scatter distribution of shortwave radiation observed datasets and reanalysis datasets on different time scales; (A) and (B) represent downward shortwave radiation and upward shortwave radiation, respectively.
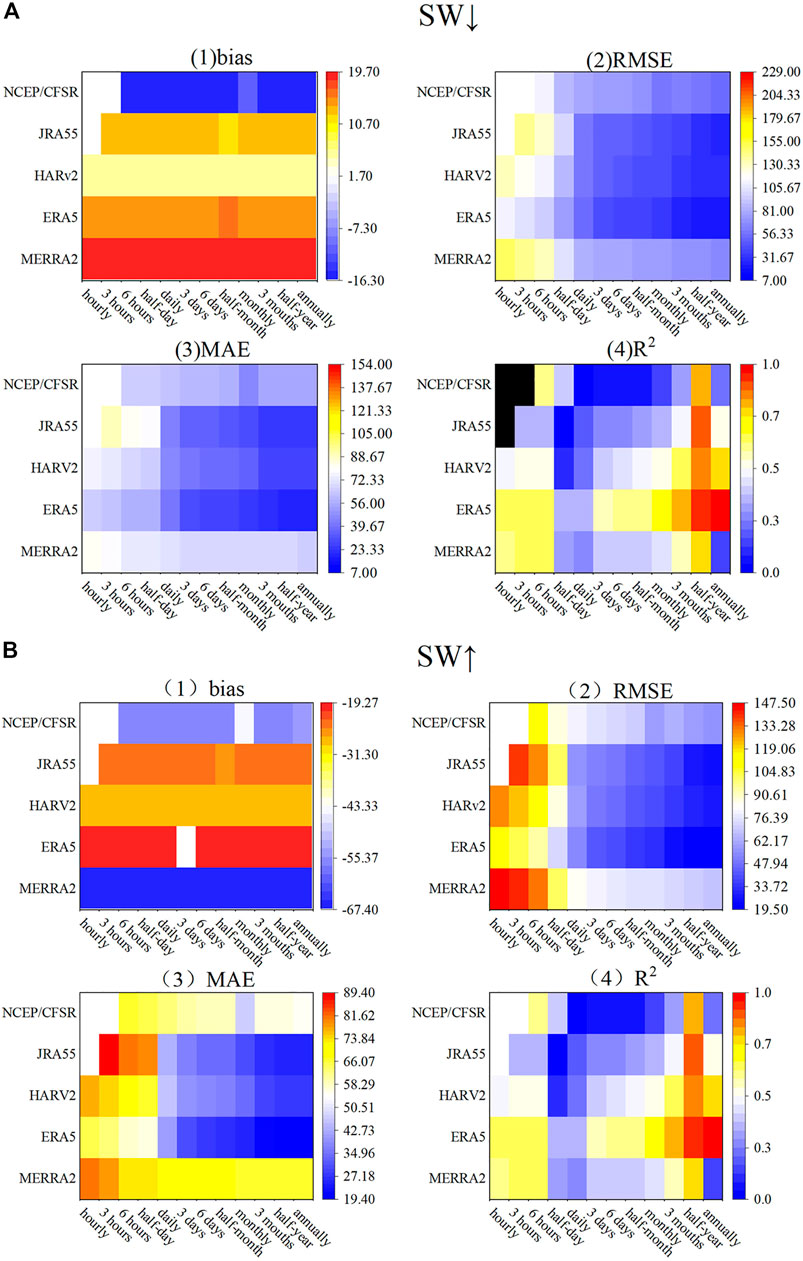
FIGURE 3. Five sets of reanalysis datasets shortwave radiation evaluation results; (A) and (B) represent downward shortwave radiation and upward shortwave radiation, respectively.
Compared with the hourly scale, the NCEP/CFSR performance at the daily scale is significantly lower and performs worse than the other reanalysis for SW↓, with HAR v2 performing the best at R2 of 0.46 and RMSE and MAE of 75.37 and 56.22 w/m2, respectively, both of which are the smallest values of the five reanalysis datasets. On the 3-day scale, the fit of the five sets of reanalysis radiation datasets to SW↓ increases substantially, with MERRA2, ERA5, HAR v2, JRA55, and CFSR showing good fits of 0.77, 0.82, 0.79, 0.78, and 0.19; all except CFSR well fit the trend of SW↓. However, the five sets of reanalysis radiation datasets do not fit the SW↑ trend well on both the daily scale and 3-day scale, showing a significant underestimation. MERRA2 is the most underestimated, and ERA5 is the best performer at relative term scales. On the 6-day and half-month scales, SW↓ HAR v2 performed best, with the highest coefficient of determination and lowest error (Table 3), whereas NCEP/CFSR performed the worst. For SW↑, there is minimal change in the five sets of reanalysis radiation datasets on the 6-day scale. ERA5 performed best, with an R2 of 0.59 and RMSE and MAE values of 39.07 and 28.41 w/m2, respectively, among the five reanalysis datasets. On the half-month scale, the fit of the five sets of reanalysis radiation datasets to SW↑ increases substantially, with fits of 0.9, 0.95, 0.93, 0.92, and 0.29. All four reanalysis datasets fit the observed SW↑ datasets well, except for NCEP/CFSR, and ERA5 still performs best, having the highest coefficient of determination and the lowest error.
As seen from the information reflected in Figure 3; Table 4, on the monthly scale, for SW↓, ERA5 has the best performance, with R2, bias, RMSE, and MAE values of 0.96, 15.18, 19.85, and 16.24 w/m2, respectively. For SW↑, MERRA2 has the highest degree of underestimation and the highest error; ERA5 has the smallest bias, best fit, and smallest error, performing best on this scale with R2, bias, RMSE, and MAE of 0.67, −19.31, 32.98, and 25.05 w/m2, respectively. The difference between HAR v2 and JRA-55 is not significant; HAR v2 has a slightly better fit than JRA-55, and NCEP/CFSR does not well fit upward shortwave radiation and performs poorly for downward shortwave radiation. At the 3-month scale, the four sets of reanalysis radiation datasets fit better for SW↓, but all exhibit a certain degree of overestimation. With the exception of the CFSR, HAR v2 is the least overestimated, with a bias of 5.43 w/m2, and the smallest error performs best at this scale. The five reanalysis datasets show improved fits and reduced errors for SW↑, again showing an underestimation trend, with ERA5 being the least underestimated with a bias of −19.31 w/m2 and a fit of 0.81 significantly higher than the other four datasets, of performing best at this scale. The errors in all five sets of reanalysis datasets for SW↓ on the half-year scale have been reduced, and their precision is improved, but the coefficients of determination have been reduced for all four datasets except NCEP/CFSR. The combined four evaluation indicators performed best on this scale for HAR v2, with CFSR performing the worst and the other three datasets showing a similar performance. However, the fit and accuracy of the five sets of reanalysis data for SW↑ have improved significantly, with the combined four assessment metrics performing best on this scale for ERA5, with R2, RMSE, and MAE of 0.92, 19.84, and 19.58 w/m2, respectively, and the worst performance for MERRA2. Compared with the monthly scales, the annual scales show a decrease in the fit of both upward shortwave radiation and downward shortwave radiation, except for ERA5, whose R2 values are 0.86 and 0.95, respectively, and which performs best at the annual scale.
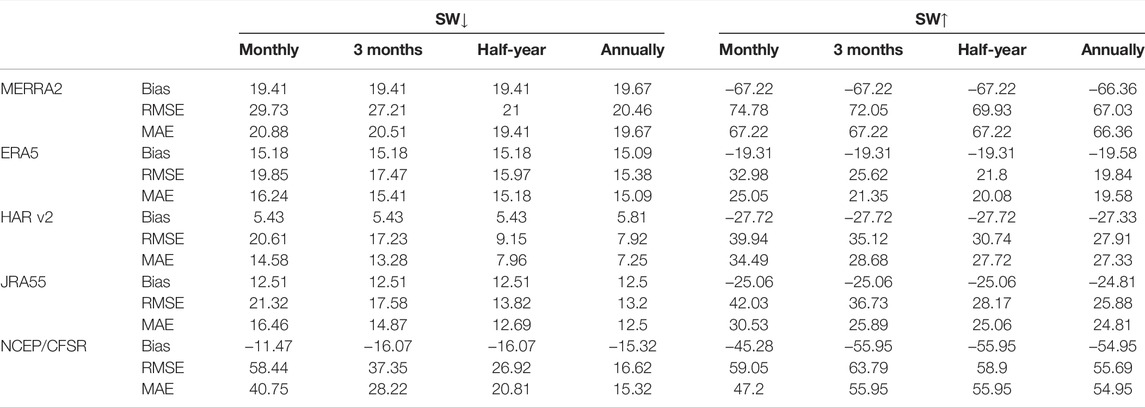
TABLE 4. Evaluation of monthly and annual scales of shortwave radiation from five sets of reanalysis datasets.
The downward and upward shortwave radiation varies widely over the seasons, with the five sets of reanalysis datasets showing significantly better applicability of SW↓ and SW↑ in winter (September to May) than in summer (June to August), as shown in Figure 4 and Table 5. Only ERA5 is able to fit the variation in upward shortwave radiation in summer, with R2, bias, RMSE, and MAE values of 0.39, −35.25, 63.51, and 47.54 w/m2, respectively. For SW↓, NCEP/CFSR shows a distinct trend of underestimation, whereas MERRA2, ERA5, HAR v2, and JRA55 show a trend of overestimation with biases of 49.29, 22.71, 25.68, and 28 w/m2. However, the five reanalysis datasets show a distinct tendency to underestimate SW↑, with HAR v2 being the least underestimated and NCEP/CFSR being the most underestimated, with biases of −3.62 and −52.91 w/m2.
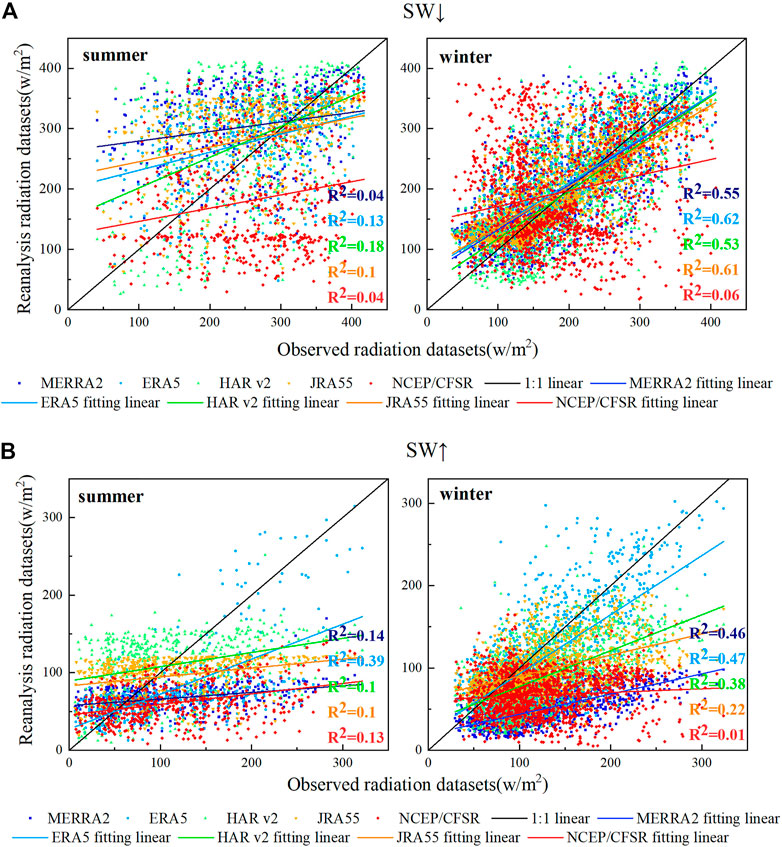
FIGURE 4. Trends in observed and reanalysis shortwave radiation datasets in different seasons; (A) and (B) represent downward shortwave radiation and upward shortwave radiation, respectively.

TABLE 5. Results of the five reanalysis datasets for shortwave radiation evaluated in summer and winter.
Compared with summer, the fit to downward and upward shortwave radiation improved for each reanalysis radiation dataset in winter, but the CFSR still failed to fit the SW↓ and SW↑ trends, with R2 values of 0.06 and 0.01, respectively. JRA55 still did not well fit the SW↑ trend, with an R2 of 0.22. The HAR v2 reanalysis datasets have a low degree of underestimation for SW↓ with a bias of −1.6 w/m2 and the smallest bias, whereas the other four reanalysis radiation datasets show a trend of overestimation. While the five reanalysis datasets show a tendency to underestimate SW↑ in both winter and summer, the underestimation of all four reanalysis radiation datasets shows an increasing trend, except for ERA5, where the underestimation decreases with a bias of −13.73 w/m2. A combination of the indicators evaluated shows that for SW↓, JRA55 has the highest accuracy in winter with the best performance of 6.97, 50.76, and 39.09 w/m2 for bias, RMSE, and MAE, respectively. ERA5 for SW↑ has the highest accuracy in winter, with the best performances of 44.73 and 33.8 w/m2 for RMSE and MAE, respectively.
The results of the assessment of shortwave radiation were consistent with those of previous studies; ERA5 performed best, and CFSR and MERRA2 performed worse (Jiang et al., 2019; Seo et al., 2020; Wang, 2020; Zhang et al., 2021). The advantages of the ERA-5 reanalysis datasets are particularly evident on snow and ice surfaces (Wang, 2020; Zhang et al., 2021). Because of cloudiness and other meteorological factors, the accuracy of rainy and cloudy conditions is lower than that of clear-sky conditions on the daily and monthly scales; on the seasonal scale, the accuracy is significantly higher in winter and spring than in summer and autumn (Jiang et al., 2019; Zhang et al., 2021).
As seen through Figures 5, 6, on the hourly scale, both MERRA2 and ERA5 are able to roughly fit the downward longwave radiation (LW↓) with R2 values of 0.42 and 0.48, respectively. The HAR v2 fit is poor, with an R2 of 0.28, and the ERA5 error is significantly smaller than that of MERRA2, which performs better. The three reanalysis datasets MERRA2, ERA5, and HAR v2 well fit the upward longwave radiation (LW↑), with R2 values of 0.72, 0.79, and 0.73, which are overestimated. HAR v2 has the smallest error, with bias, RMSE, and MAE values of 7.02, 24.53, and 18.92 w/m2, respectively, which is the best performance. There is some improvement in the fit of the reanalysis datasets on the 3-h scale for LW↓. The R2 of HAR v2 is 0.27, which is slightly lower than that of the other three reanalysis datasets. The RMSE and MAE are 57.57 and 44.98 w/m2, respectively, which are higher than those of the other three datasets, with poorer performance. ERA5 performs best with minimal error. However, in LW↑, the R2 values of MERRA2, ERA5, HAR v2, and JRA55 are similar, at 0.74, 0.8, 0.75, and 0.79, respectively. HAR v2 has the best performance, with RMSE and MAE values of 23.74 and 18.35 w/m2, respectively, which are lower than those of the other three datasets. At the 6-h scale, MERRA2 and HAR v2 underestimate and poorly fit LW↓, whereas the other datasets are overestimated. The fits for MERRA2, ERA5, and JRA55 are similar, with ERA5 having the lowest RMSE and MAE of 41.39 and 33.4 w/m2 of the three, performing best. MERRA2, ERA5, HAR v2, and JRA55 provide a better fit to LW↑, with values of 0.76, 0.82, 0.76, and 0.81, and all errors decrease. HAR v2 still has the smallest error and the best applicability. The fit of the five reanalysis datasets on the half-day scale continues to improve. NCEP/CFSR and HAR v2 have worse fits for LW↓ trends on half-day scales, whereas ERA5, MERRA2, and JRA55 perform similarly, with ERA5 performing slightly better. ERA5, MERRA2, HAR v2, and JRA55 are similar for LW↑ in R2, and HAR v2 has the smallest error, with bias, RMSE, and MAE values of 7.02, 18.4, and 14.71 w/m2, respectively, which are the best performances.
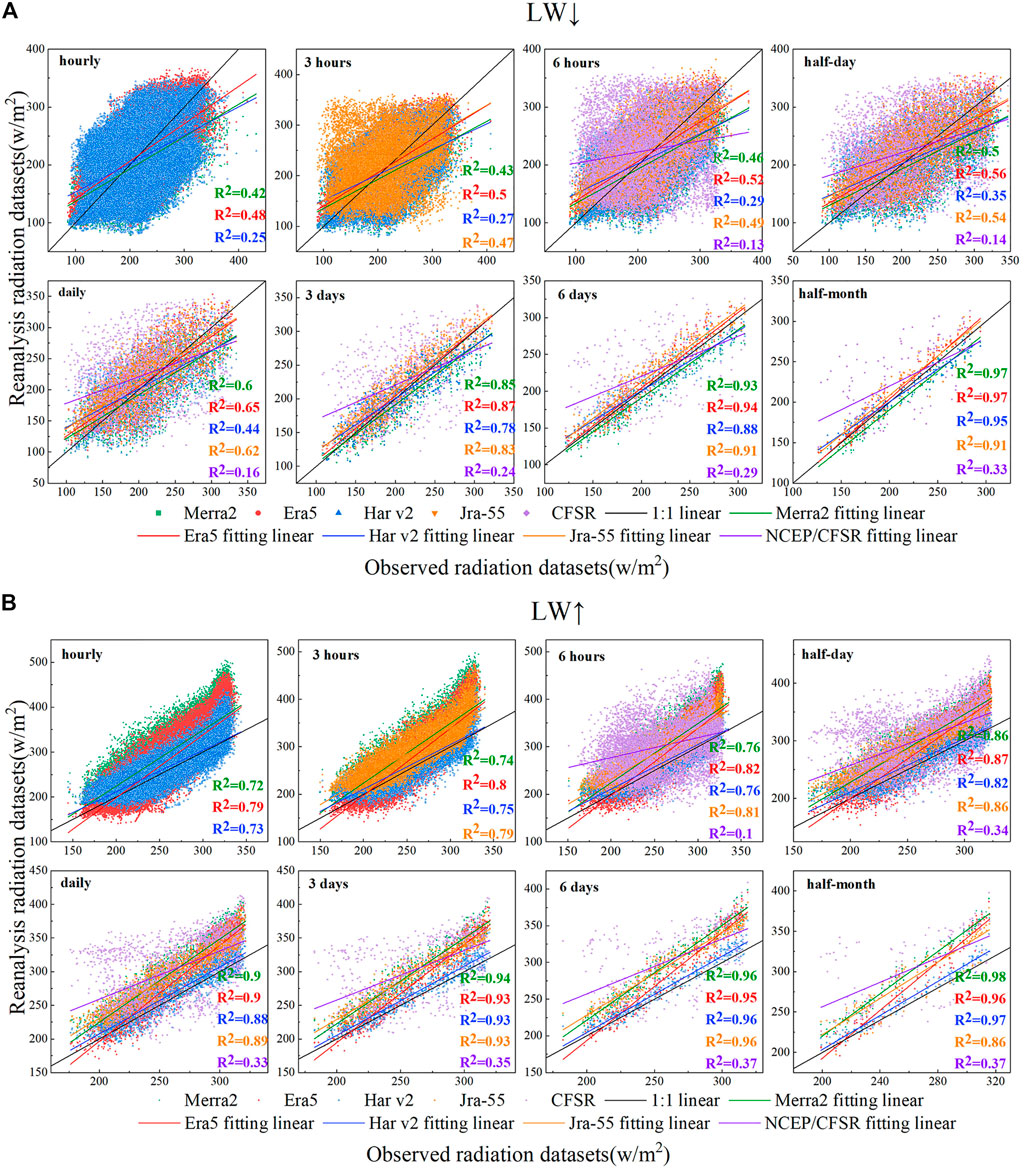
FIGURE 5. 2010–2015 Scatter distribution of observed longwave radiation datasets and reanalysis datasets on different time scales; (A) and (B) represent downward longwave radiation and upward longwave radiation.
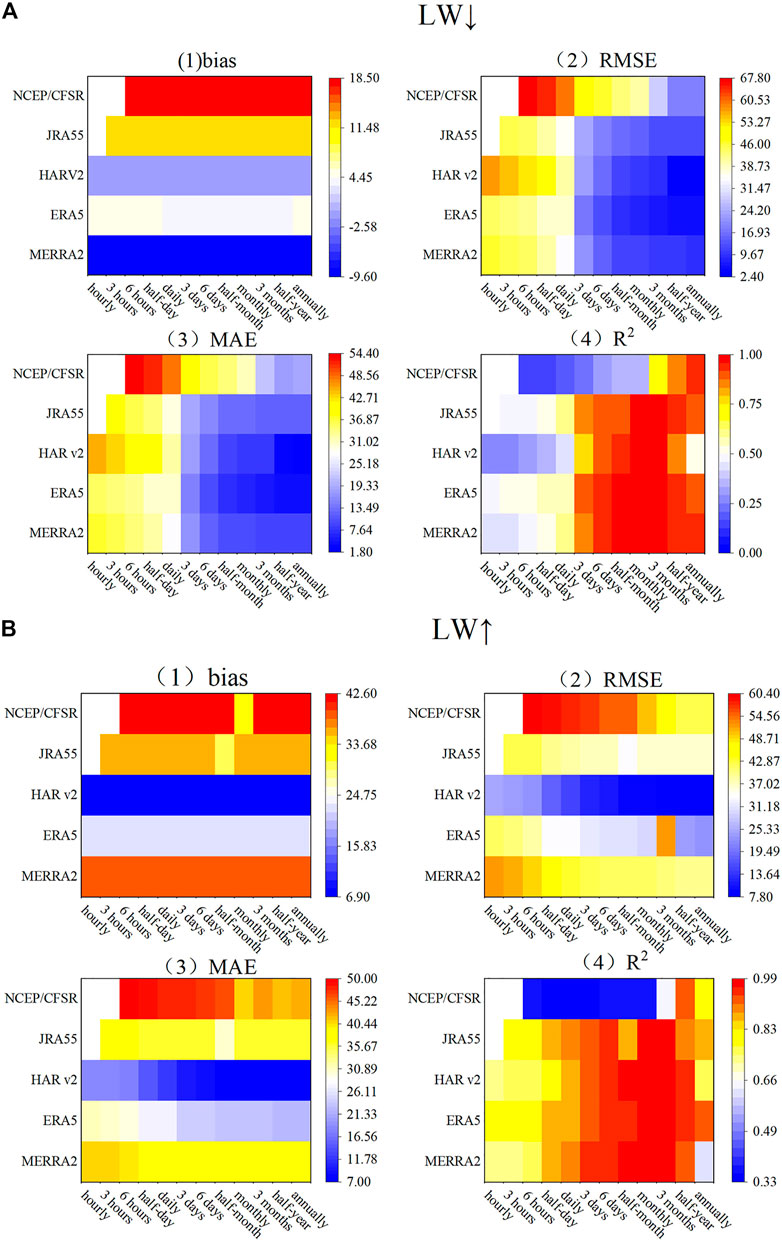
FIGURE 6. Five sets of reanalysis datasets longwave radiation evaluation results; (A) and (B) represent downward longwave radiation and upward longwave radiation, respectively.
Combined with Table 6, the five sets of reanalysis radiation datasets well fit the LW↓ and LW↑ trends on four scales—daily, 3 days, 6 days, and half-month—with an increase in accuracy, but all show a tendency to overestimate. For LW↓, MERRA2 has the best performance, with RMSE and MAE values of 34.98 and 27.57 w/m2, respectively, which are the smallest values of the three datasets. On the 3-day scale, the R2, RMSE, and MAE of ERA5 are 0.85, 18.08, and 14.85 w/m2, respectively, which is a small error and the best performance. On the 6-day and half-month scales, ERA5 performs best, with an R2 of 0.97 and minimum error RMSE and MAE of 9.21 and 7.24 w/m2, respectively. For LW↑, HAR v2 is the least overestimated and decreasing dataset, reaching its lowest value on the half-month scale with a bias of 6.97 w/m2. On the daily to half-month time scales, the fits of the four reanalysis radiation datasets—MERRA2, ERA5, HAR v2, and JRA55—exceed 0.9, except for JRA55, which is 0.86 on the half-month scale, and well fit LW↑, with HAR v2 performing the best.
Based on the information reflected in Figure 6 and Table 7, it can be seen that on the monthly scale, all four sets of reanalysis datasets, except NCEP/CFSR, fit above 0.95 and well fit the LW↓ at this scale. The best fit is achieved by ERA5, with the smallest R2, bias, RMSE, and MAE values of 0.98, 4.41, 8.02, and 6.35 w/m2. All five sets of reanalysis datasets show a tendency to overestimate LW↑, with HAR v2 being the best and showing the lowest degree of overestimation and the smallest error, bias, RMSE, and MAE of 7.01, 9.16, and 7.56 w/m2. At the 3-month scale, MERRA2 and HAR v2 show an underestimated trend, and the other three are overestimated. The bias of HAR v2 is the smallest at −0.6 w/m2; combining the other three indicators proves that ERA5 performs best at this scale. The error in the ERA5 reanalysis datasets for LW↑ is higher; the others are not significantly different from the monthly scale, and HAR v2 is the least overestimated, with a fit of 0.98, and performs best on this scale. The errors in the five reanalysis radiation datasets for LW↓ and LW↑ on the half-year scale are essentially the same as those on the 3-month scale, and the NCEP/CFSR fit is significantly better. The combined four evaluation indicators performed best on this scale for HAR v2. Compared with the monthly scales, the fit of the reanalysis data to both LW↓ and LW↑ is significantly reduced on the annual scale, except for the NCEP/CFSR, where the fit to LW↓ is improved. MERRA2 fit is better than the other three datasets, with a slightly higher error than ERA5, and its R2, bias, RMSE, and MAE values were 0.95, −9.41, 9.46, and 9.41 w/m2, respectively, which are the best performances in LW↓. ERA5 has a distinct advantage for LW↑ with an R2 of 0.92. HAR v2, JRA55, and CFSR are not much different; HAR v2 produces error less than both and performs slightly better, whereas MERRA2 performs the worst, with R2, RMSE, MAE, values of 0.62, 39.65, and 39.56 w/m2.
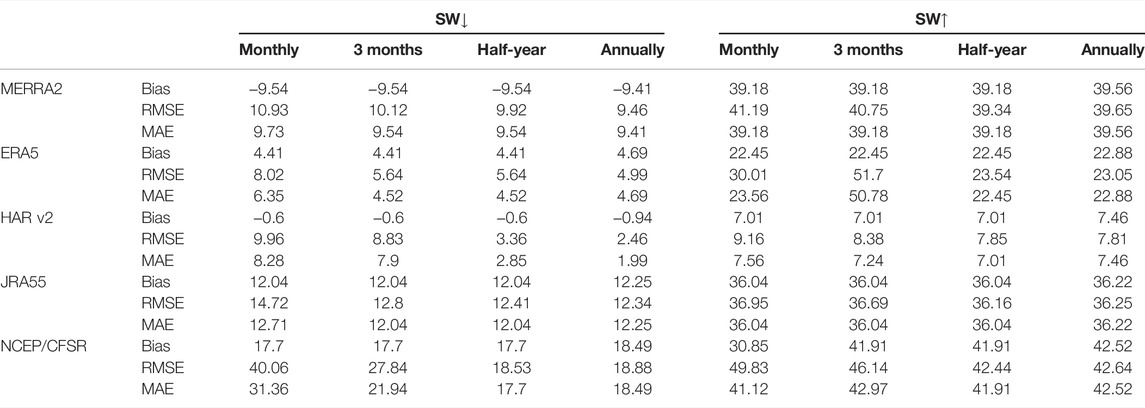
TABLE 7. Evaluation of monthly and annual scales of longwave radiation from five sets of reanalysis datasets.
The downward and upward longwave radiation varies considerably over the seasons, with the five sets of reanalysis datasets showing significantly better applicability in winter than in summer, as shown in Figure 7 and Table 8. Only ERA5 and JRA55 are able to fit the variation in upward longwave radiation in summer, with R2, bias, RMSE, and MAE values of 0.39, 0.26; 48.22 w/m2, 41.39 w/m2; 50.77 w/m2, 43.17 w/m2; and 48.24 w/m2, 41.39 w/m2, respectively. MERRA2, HAR v2 and NCEP/CFSR show a distinct trend of underestimation for LW↓, whereas ERA5 and JRA55 are overestimated. The five biases of MERRA2, ERA5, HAR v2, JRA55, and CFSR are −11.01 w/m2, 9.23 w/m2, −11.69 w/m2, 12.22 w/m2, and −37.49 w/m2, respectively, with the combined four assessment indicators ERA5 performing the best. However, the five reanalysis datasets show a distinct tendency to overestimate LW↑, with NCEP/CFSR underestimating the least and MERRA2 underestimating the most, with biases of 0.22 and 55.48 w/m2, respectively.
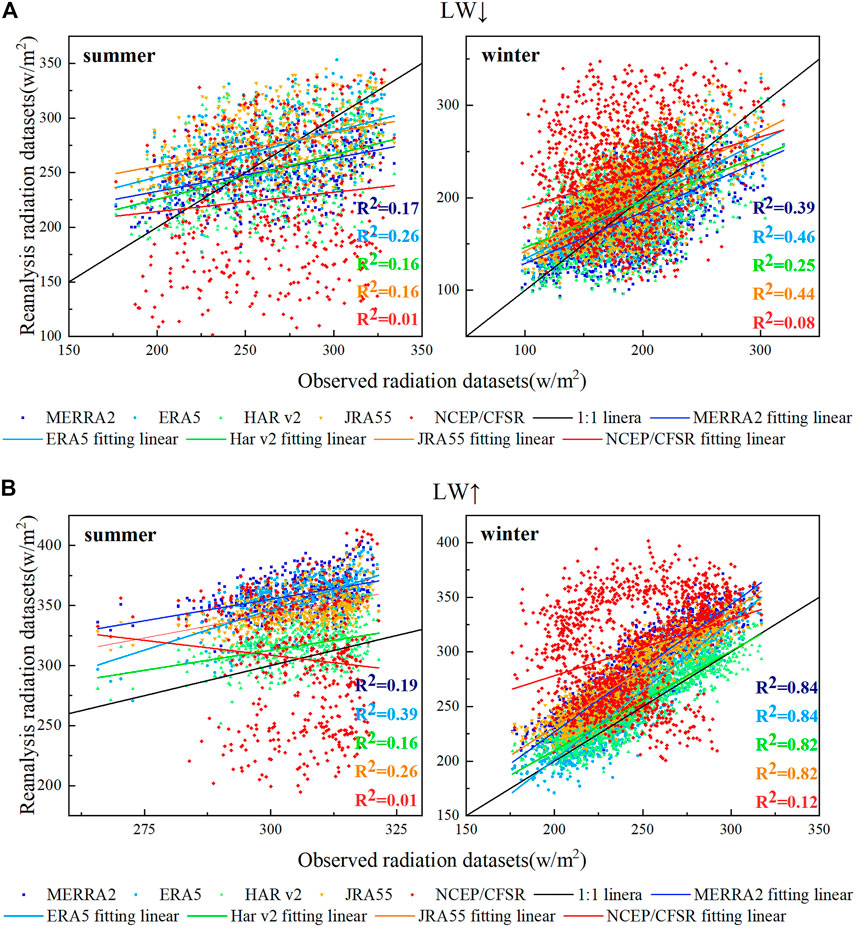
FIGURE 7. Trends in observed and reanalysis longwave radiation datasets in different seasons; (A) and (B) represent downward longwave radiation and upward longwave radiation.

TABLE 8. Results of the five sets of reanalysis datasets for longwave radiation evaluated in summer and winter.
Compared with summer, the fit to downward and upward longwave radiation improved for all reanalysis radiation datasets in winter, but HAR v2 and CFSR still do not fit the LW↓ trend well, with R2 of 0.25 and 0.08, respectively. The CFSR still does not fit the LW↑ trend well, with R2 of 0.12. Only the MERRA2 reanalysis shows an underestimation trend for LW↓ with a bias of −9 w/m2, whereas the other reanalysis radiation datasets show an overestimation trend for LW↓ and LW↑. ERA5 and JRA55 have the best fit, with R2 values of 0.46 and 0.44 for LW↓, respectively, and MERRA2 is the next best with an R2 of 0.39. All three models fit better for downward solar radiation in winter. A combination of the evaluation indicators shows that for LW↓, ERA5 has the highest accuracy in winter, with the best performance of 31.67 w/m2 for RMSE and 25.78 w/m2 for MAE. However, the fits of ERA5, MERRA2, HAR v2, and JRA55 are similar, with R2 values of 0.84, 0.84, 0.82, and 0.82 for LW↑; the HAR errors are obviously lower than the three datasets, with biases, RMSEs, and MAEs of −5.7, 14.2, and 11.42 w/m2, respectively, which are the best performances.
The assessment of longwave radiation is also consistent with previous studies, with HAR v2 and ERA5 performing better but still performing better in winter than in summer on a seasonal scale (Jiang et al., 2019; Zhang, 2019; Zhang et al., 2021).
The radiation assimilation performance of different reanalysis datasets for glacier ablation areas (4,550 m) in the LHG basin showed significant differences at different timescales. In alpine regions, the accuracy of reanalysis datasets is significantly influenced by topography, weather, land surface, assimilation methods, and accurate observed datasets (Fan and Van den Dool, 2008; Luo et al., 2019; Jia et al., 2021). We analyze the possible reasons for the errors in the reanalysis radiation datasets, taking into account the assimilation model and the basic principles of the dynamic downscaling model. First, different assimilation methods are the main error sources. In the abovementioned results, the four sets of reanalysis datasets, except NECP/CFSR, can roughly fit the variation characteristics of downward shortwave radiation, upward shortwave radiation, downward longwave radiation, and upward longwave radiation. This finding is attributed mainly to the production of MERRA2 using the GEOS 5.12.4 model, which reduces certain spurious trends and jumps in the observing system and updates in the CIS scheme (Rienecker et al., 2011; Gelaro et al., 2017; Wu et al., 2019). JRA-55 uses the 4D-Var datasets assimilation system with variable component bias correction (VarBC) for satellite radiation and adds a new source of observed datasets (Kobayashi et al., 2015). The better performance of HAR v2 is attributed to the notion that it is generated for dynamical downscaling using ERA5 driving WRF 4.1, with a horizontal maximum of 10 km (Orsolini et al., 2019). ERA5 performs best because it uses the 4D-Var dataset assimilation and prediction model in Integrated Forecasting System (IFS) CY41R2, has 137 mixed pressure levels in the vertical direction and at the top of 0.01 h Pa, and has available surface and single layer datasets (Hersbach et al., 2020).
Second, cloud cover is an important factor that affects the wireless signal received by the sensor and that further affects the dataset accuracy. The five sets of reanalysis radiation datasets underestimate upward shortwave radiation with significantly lower accuracy, possibly due to inaccurate estimates of subsurface type by the respective models, inaccurate estimates of atmospheric transparency and cloudiness, and biases in surface reflectance simulations. The worse fit of the five reanalysis datasets to downward longwave radiation may be caused by inaccurate model estimates of cloudiness. In summer, the LHG basin is influenced by the western wind band, with concentrated precipitation and increased cloud cover, as well as clouds with a less longwave radiation effect than shortwave radiation, making the reanalysis radiation data more applicable to longwave radiation than shortwave radiation. Third, the type of underlying surface can also cause errors in the reanalysis datasets. The applicability of the five reanalysis radiation datasets is significantly higher in winter than in summer. The high radiation values and temperatures above 0°C in the LHG basin are mainly concentrated between June and August, whereas temperatures are largely below 0°C from September to May. The basin is in the ablation period from June to August, with rapid changes in albedo, and reanalysis datasets have produced inaccurate subsurface estimates, causing bias (Gueymard et al., 2019).
There are many factors that affect the accuracy of reanalysis datasets, but ERA5 is the optimum radiation reanalysis dataset for LHG in the western Qilian Mountains. Possible main reasons are listed as follows: ERA5 provides data for 240 variables with high spatial and temporal resolution and updates the IFS cycle from 31r2 to 41r2 with the 4DVAR method, absorbing a larger number of observations and satellite data (Hersbach & Dee, 2016; Hersbach et al., 2020). Furthermore, ERA5 assimilates historical observations based on the data assimilation ensemble (EDA) system developed by ECMWF to account for errors in observation and forecast models, making ERA5 more applicable (Meng et al., 2018). The HAR v2 reanalysis datasets are formed by WRF4.1 power downscaling with ERA5 as the driving data, and its horizontal resolution of 10 km is significantly higher than those of the other four reanalysis datasets, making it second only to ERA5 in terms of applicability (Wang et al., 2020b).
Therefore, to reduce the error of different assimilation methods, many researchers have attempted to combine multiple reanalysis datasets based on different merging methods (Shi and Liang, 2013; Xu et al., 2020; Davison et al., 2021). However, the accuracy of merged datasets cannot be suited to regional scales to some extent, especially in alpine mountains. To fundamentally solve the problem of errors in reanalysis datasets, the main ideas should be to improve the sensor and to eliminate the effect of clouds.
This article evaluates five sets of reanalysis radiation datasets (ERA5, JRA55, MERRA2, HARv2, and NCEP/CFSR) at different time scales based on 2010–2015 observed radiation datasets in the 4,550-m glacial ablation zone of the LHG basin. The conclusions are presented as follows:
(1) For shortwave radiation, ERA5 has the best performance compared with the other reanalysis datasets on different time scales. For downward shortwave radiation, HAR v2 is better than ERA5 on only two timescales, 3 months and half-year. The upward shortwave radiation, ERA5, outperforms the other reanalysis datasets on all 12 timescales. Therefore, ERA5 is recommended first in regions without shortwave radiation observations.
(2) For downward longwave radiation, ERA5 also performs significantly better, with only MERRA2 outperforming ERA5 on the daily and annual scales. For upward longwave radiation, HAR v2 is better than the other reanalysis datasets on all timescales, except for ERA5, which has a better R2 of 0.92 on the annual scale.
(3) All the reanalysis datasets can show the variation trend of the four radiation parameters in different seasons. They have better performance in winter and worse performance in summer because of much cloud cover. However, ERA5 is still the most recommended dataset.
The raw data supporting the conclusion of this article will be made available by the authors, without undue reservation.
WY, SW, and WL contributed to conception and design of the study. WY was mainly responsible for the writing of the manuscript, data processing and graphing. SW provided the writing ideas for part of the manuscript’s chapters and some original data. WL provided the writing ideas and language editing. LY, DW, CJ, and QX were responsible for setting up the instruments and collating the data. All authors contributed to manuscript revision, read, and approved the submitted version.
The research was funded by the National Natural Science Foundation of China (41971073, 42101120), The Second Tibetan Plateau Scientific Expedition and Research (STEP) Program (2019QZKK0106, 2019QZKK020103), the Natural Science Foundation of Shandong Province (ZR2021QD138), and the “Light of West China” Program, Chinese Academy of Sciences.
The authors declare that the research was conducted in the absence of any commercial or financial relationships that could be construed as a potential conflict of interest.
All claims expressed in this article are solely those of the authors and do not necessarily represent those of their affiliated organizations, or those of the publisher, the editors and the reviewers. Any product that may be evaluated in this article, or claim that may be made by its manufacturer, is not guaranteed or endorsed by the publisher.
We are grateful to ECMWF, University of Berlin, GES DISC, JMA and NCAR for providing the reanalysis radiation datasets.
Babar, B., Graversen, R., and Boström, T. (2019). Solar Radiation Estimation at High Latitudes: Assessment of the CMSAF Databases, ASR and ERA5. Solar Energy 182, 397–411. doi:10.1016/j.solener.2019.02.058
Bojanowski, J. S., Vrieling, A., and Skidmore, A. K. (2014). A Comparison of Data Sources for Creating a Long-Term Time Series of Daily Gridded Solar Radiation for Europe. Solar Energy 99, 152–171. doi:10.1016/j.solener.2013.11.007
Bromwich, D. H., and Fogt, R. L. (2004). Strong Trends in the Skill of the ERA-40 and NCEP-NCAR Reanalyses in the High and Midlatitudes of the Southern Hemisphere, 1958-2001. J. Clim. 17 (23), 4603–4619. doi:10.1175/3241.1
Cao, L. (2021). Climate System Response to Solar Radiation Modification. Clim. Change Res., 1. doi:10.12006/j.issn.1673-1719.2021.170
China Meteorological Administration (2003). Specifications for Surface Meteorological Observation. Beijing: China Meteorological Press.
Davison, S., Barbariol, F., Benetazzo, A., Cavaleri, L., and Mercogliano, P. (2021). “A Data Fusion Strategy for Reanalysis and Climate Model Winds,” in EGU General Assembly Conference Abstracts, EGU21.
Deng, X., Zhai, P., and Yuan, C. (2010). Comparative Analysis of NCEP/NCAR , ECMWF and JMA Reanalysis. Meteorological Science Technology 38 (01), 1. doi:10.3969/j.issn.1671-6345.2010.01.001
Du, J., Wen, L., and Su, D. (2019). Reliability of Three Reanalysis Datasets in Simulation of Three alpine Lakes on the QinghaiTibetan Plateau. Plateau Meteorology 38 (01), 101–113.
Du, W., and Qin, X. (2012). Wind Characteristics in Accumulation Area of the Laohugou Glacier No.12, Qilian Mountains. J. Glaciology Geocryology 34 (01), 29–36.
Fan, Y., and Van den Dool, H. (2008). A Global Monthly Land Surface Air Temperature Analysis for 1948–present. J. Geophys. Res. Atmospheres 113 (D1), D01103. doi:10.1029/2007jd008470
Fu, L., Bian, L., and Xiao, C. (2015). Evaluation of the Applicability of Four Reanalyzed Radiometric Data in the East Antarctic Plateau. Chin. J. Polar Res. 27 (01), 56–64. doi:10.13679/j.jdyj.2015.1.056
Gelaro, R., Mccarty, W., Suárez, M., Todling, R., and Zhao, B. (2017). The Modern-Era Retrospective Analysis for Research and Applications, Version 2 (MERRA-2). J. Clim. 30 (41). doi:10.1175/JCLI-D-16-0758.1
Global Modeling and Assimilation Office (Gmao), (2015). MERRA-2 tavg1_2d_rad_Nx: 2d,1-Hourly, Time-Averaged, Single-Level, Assimilation, Radiation Diagnostics V5.12.4. Greenbelt, MD, USA: Goddard Earth Sciences Data and Information Services Center (GES DISCdoi:10.5067/Q9QMY5PBNV1T
Gueymard, C. A., Lara-Fanego, V., Sengupta, M., and Xie, Y. (2019). Surface Albedo and Reflectance: Review of Definitions, Angular and Spectral Effects, and Intercomparison of Major Data Sources in Support of Advanced Solar Irradiance Modeling Over the Americas. Solar Energy 182 (APR.), 194–212. doi:10.1016/j.solener.2019.02.040
Hersbach, H., Bell, B., Berrisford, P., Hirahara, S., and Jeankmol, T. (2020). The Era5 Global Reanalysis. QJR Meteorol. Soc. 146, 1999–2049. doi:10.1002/qj.3803
Hersbach, H., and Dee, D. (2016). ERA5 Reanalysis Is in Production—No. 147. Reading, UK: ECMWF. Technical Report.
IPCC (2021). Climate Change 2021: The Physical Science Basis. Cambridge: Cambridge University Press.
JRA-55: Japanese 55-year Reanalysis, Daily 3-Hourly and 6-Hourly Data (2013). JRA-55: Japanese 55-year Reanalysis, Daily, 3 hours and 6 hours Data. Research Data Archive at the National Center for Atmospheric Research, Computational and Information Systems Laboratory. doi:10.5065/D6HH6H41
Jia, J. P., He, X. Q., and Jin, Y. J. (2004). Statistics. 2nd ed. Beijing: China Renmin University Press.
Jia, M., Huang, X., Ding, K., Liu, Q., Zhou, D., and Ding, A. (2021). Impact of Data Assimilation and Aerosol Radiation Interaction on Lagrangian Particle Dispersion Modelling. Atmos. Environ. 247, 118179. doi:10.1016/j.atmosenv.2020.118179
Jiang, H., Yang, Y., Bai, Y., and Wang, H. (2019). Evaluation of the Total, Direct, and Diffuse Solar Radiations from the Era5 Reanalysis Data in china. IEEE Geosci. Remote Sensing Lett. (99), 1–5.
Kobayashi, S., Ota, Y., Harada, Y., Ebita, A., Moriya, M., Onoda, H., et al. (2015). The JRA-55 Reanalysis: General Specifications and Basic Characteristics. J. Meteor. Soc. Japan (93), 5–48. doi:10.2151/jmsj.2015-001
Li, J. (2015). Numerical Simulations of Land Surface Processes in the Tigou 12 Glacier Area of the Qilian Mountains. China Tianjin: Annual Meeting of the Chinese Meteorological Society. Paper presented at the The 32nd.
Li, J., Wang, D., and Feng, J. (2017). Simulation of Solar Radiation Based on Neural Network and MODIS Remote Sensing Products. Scientia Geographica Sinica 37 (06), 912–919.
Liang, F., and Xia, X. A. (2005). Long-term Trends in Solar Radiation and the Associated Climatic Factors over China for 1961-2000. Ann. Geophysicae 23 (7), 2425–2432. doi:10.5194/angeo-23-2425-2005
Liu, J., Shi, C., and Jia, B. (2018). Retrievals Evaluation of Downward Solar Radiation Derived from FY-2E. Remote Sensing Inf. 33 (01), 104–110.
Luo, H., Ge, F., Yang, K., Zhu, S., Peng, T., Cai, W., Liu, X., and Tang, W. (2019). Assessment of ECMWF Reanalysis Data in Complex Terrain: Can the CERA‐20C and ERA‐Interim Data Sets Replicate the Variation in Surface Air Temperatures over Sichuan, China? Int. J. Climatol 39 (15), 5619–5634. doi:10.1002/joc.6175
Meng, X., Guo, J., Han, Y., and Observatory, S. M. (2018). Preliminarily Assessment of Era5 Reanalysis Data. J. Mar. Meteorology 38 (1), 9. doi:10.19513/j.cnki.issn2096-3599.2018.01.011
National Center for Atmospheric Research Staff Eds, (2017). The Climate Data Guide: Climate Forecast System Reanalysis (CFSR). https://climatedataguide.ucar.edu/climate-data/climate-forecast-system-reanalysis-cfsr.
Orsolini, Y., Wegmann, M., Dutra, E., Liu, B., and Arduini, G. (2019). Evaluation of Snow Depth and Snow Cover Over the Tibetan Plateau in Global Reanalyses uUsing in situ and Satellite Remote Sensing Observations. The Cryosphere 13 (8), 2221–2239. doi:10.5194/tc-13-2221-2019
Porter, D. F., Cassano, J. J., and Serreze, M. C. (2011). Analysis of the Arctic Atmospheric Energy Budget in WRF: A Comparison with Reanalyses and Satellite Observations. J. Geophys. Res. Atmospheres 116 (D22). doi:10.1029/2011jd016622
Power, H. C., and Mills, D. M. (2005). Solar Radiation Climate Change over Southern Africa and an Assessment of the Radiative Impact of Volcanic Eruptions. Int. J. Climatology 25 (3), 295–318. doi:10.1002/joc.1134
Rienecker, M. M., Suarez, M. J., Gelaro, R., Todling, R., Bacmeister, J., Liu, E., et al. (2011). MERRA: NASA's Modern-Era Retrospective Analysis for Research and Applications. J. Clim. 24 (14), 3624–3648. doi:10.1175/JCLI-D-11-00015.1
Saha, S., Moorthi, S., Pan, H.-L., Wu, X., Wang, J., Nadiga, S., et al. (2010). NCEP Climate Forecast System Reanalysis (CFSR) 6-hourly Products, January 1979 to December 2010. Research Data Archive at the National Center for Atmospheric Research, Computational and Information Systems Laboratory. doi:10.5065/D69K487J
Seo, M., Kim, H. C., Lee, K. S., Seong, N. H., and Han, K. S. (2020). Characteristics of the Reanalysis and Satellite-Based Surface Net Radiation Data in the Arctic. J. Sensors 2020 (1), 1–13. doi:10.1155/2020/8825870
Shen, H., Lv, J., and Tu, X. (2019). The Applicability of ERA-Interim and NCEP/NCAR Reanalysis Datasets in the Adjacent Waters of the Southeast China Sea. Mar. Foreasts 36 (02), 12. doi:10.11737/j.issn.1003-0239.2019.02.002
Shi, G., Tadahiro, H., and Atsumu, O. (2008). Data Quality Assessment and the Long-Term Trend of Ground Solar Radiation in China. J. Appl. Meteorology Climatology 47 (4), 1006–1016. doi:10.1175/2007jamc1493.1
Shi, Q., and Liang, S. (2013). Characterizing the Surface Radiation Budget over the Tibetan Plateau with Ground-Measured, Reanalysis, and Remote Sensing Data Sets: 1. Methodology. J. Geophys. Res. Atmos. 118 (17), 9642–9657. doi:10.1002/jgrd.50720
Sun, W., and Qin, X. (2011b). Annual Variations of the Components of Radiation on the Laohugou No 12 Glacier in the Qilian Mountains. Adv. Earth Sci. 26 (003), 347–354.
Sun, W., and Qin, X. (2011a). Surface Energy Balance in the Accumulation Zone of the Laohugou Glacier NO.12 in the Qilian Mountains during Ablation Period. J. Glaciology Geocryology 33 (01), 38–46.
Wang, H. (2020). Estimation of Downward Radiation Based on Multi-Source Data Fusion. Doctoral dissertation. JiLin University.
Wang, J., Sun, X., and Sun, R. (2020a). Compararison of Reanalysis Radiation Data and Observations in China for 2000-2016. J. Trop. Meteorology 36 (06), 734–743. doi:10.16032/j.issn.1004-4965.2020.066
Wang, X., Tolksdorf, V., and Otto, M., (2020b): WRF-based Dynamical Downscaling of ERA5 Reanalysis Data for High Mountain Asia: Towards a New Version of the High Asia Refined Analysis. Int. J. Climatol 99, 152–171. doi:10.1002/joc.6686
Wu, Q., Ma, S., and Zhang, Z. (2019). Evaluation on the Performance of Five Precipitation Datasets of Monthly Precipitation in the Upper Reachesmiddle and Low Er Reaches of Shule River basin. J. Glaciology Geocryology 41 (02), 470
Xia, Z., Song, Y., and Ma, J. (2017). Research on the Pearson Correlation Coefficient Evaluation Method of Analog Signal in the Process of Unit Peak Load Regulation.”in 13th IEEE International Conference on Electronic Measurement & Instruments (ICEMI). IEEE.
Xu, L., Chen, N., Moradkhani, H., Zhang, X., and Hu, C. (2020). Improving Global Monthly and Daily Precipitation Estimation by Fusing Gauge Observations, Remote Sensing, and Reanalysis Data Sets. Water Resour. Res. 56 (3), e2019WR026444. doi:10.1029/2019wr026444
Yang, X., Lv, Y., and Wen, J. (2020). Evaluations and Analysis of Applicability of the Different Parameterization Schemes and Reanalysis Data in the Typical Alpine Lake Areas. Plateau Meteorology, 1–12. doi:10.7522/j.issn.1000-0534.2020.00051
Zhang, J., Shen, R., Shi, C., Bai, L., Liu, J., and Sun, S. (2021). Evaluation and Comparison of Downward Solar Radiation from New Generation Atmospheric Reanalysis ERA5 across mainland China. J. Geo-information Sci. 23 (12), 2261–2274. doi:10.12082/dqxxkx.2021.180357
Zhang, M., and Qin, X. (2013). Glacier Change in the Laohugou River basin Monitored by Remote Sensing from 1957 to 2009. J. Arid Land Resour. Environ. 27 (04), 70–75.
Zhang, Q., Kang, S., and Wang, J. (2017). Elevation Change of the Laohugou Glacier No 12 in the Western Qilian Mountains from 2000 to 2014. J. Glaciology Geocryology 39 (04), 733–740. doi:10.12082/dqxxkx.2021.180357
Zhang, W. (2019). Trend in Surface Solar Radiation and Evaluation of Reanalysis Radiation Datasets from Shule River. Doctoral dissertation. Shangdong Normal University.
Zhang, X., Lv, N., and Yao, L. (2018). Error Analysis of ECMWF Surface Solar Radiation Data in China. J. Geo-information Sci. 20 (02), 254–267. doi:10.12082/dqxxkx.2018.170381
Zhang, X., and Qin, X. (2017b). Reanalysis of the Characteristics of Runoff Yield and confluence in the Laohugou basinQilian Mountains. J. Glaciology Geocryology 39 (01), 140–147. doi:10.7522/j.issn.1000-0240.2017.0017
Keywords: Laohugou basin, solar radiation, reanalysis datasets, applicability evaluation, alpine regions
Citation: Yingshan W, Weijun S, Lei W, Yanzhao L, Wentao D, Jizu C and Xiang Q (2022) How Do Different Reanalysis Radiation Datasets Perform in West Qilian Mountains?. Front. Earth Sci. 10:852054. doi: 10.3389/feart.2022.852054
Received: 10 January 2022; Accepted: 07 February 2022;
Published: 01 April 2022.
Edited by:
Xichen Li, Institute of Atmospheric Physics (CAS), ChinaReviewed by:
Baofu Li, Qufu Normal University, ChinaCopyright © 2022 Yingshan, Weijun, Lei, Yanzhao, Wentao, Jizu and Xiang. This is an open-access article distributed under the terms of the Creative Commons Attribution License (CC BY). The use, distribution or reproduction in other forums is permitted, provided the original author(s) and the copyright owner(s) are credited and that the original publication in this journal is cited, in accordance with accepted academic practice. No use, distribution or reproduction is permitted which does not comply with these terms.
*Correspondence: Wang Lei, bGVpd2FuZzIwMTlAMTYzLmNvbQ==
Disclaimer: All claims expressed in this article are solely those of the authors and do not necessarily represent those of their affiliated organizations, or those of the publisher, the editors and the reviewers. Any product that may be evaluated in this article or claim that may be made by its manufacturer is not guaranteed or endorsed by the publisher.
Research integrity at Frontiers

Learn more about the work of our research integrity team to safeguard the quality of each article we publish.