 Shengfu Wang
 Liang Lv
- Department of Civil and Architecture Engineering, East China University of Technology, Nanchang, China
The artificial ground freezing method has been widely used in shield end reinforcement and connecting channel reinforcement of urban subway tunnel in water-rich soft soil. Accurate quantification of micropore change and redistribution due to freeze-thaw is important to understand frost heave and thaw settlement of soft soils including mucky clay and silty clay. This paper presents Mercury Intrusion Porosimetry (MIP) data for mucky clay and silty clay specimens before and after freeze-thaw and compression. MIP tests were conducted on the soil samples of undisturbed soil, frozen-thawed soil, compressed soil and compressed frozen-thawed soil. The pores of clays were divided into five groups according to the diameter, including 1) macro pore, 2) medium pore, 3) small pore, 4) micro pore, 5) ultramicro pore. Micro pores and ultramicro pores account for more than 80% of clays’ total pore volume and pore surface area. The pore distribution characteristics of mucky clay and silty clay were studied, and the pore volume and pore surface area distributions’ capacity dimension was estimated. The particle contact, pore changes of clays due to freeze-thaw and compression were analyzed quantitatively. Total pore volume and pore surface area of clays increased due to freeze-thaw, and decreased due to compression correspondingly. The distribution of clays’ pore volume and pore surface area have statistical self similarity, and it is effective to quantify the microstructure changes of clays due to freeze-thaw and compression by estimating capacity dimension, which can provide a new way to reveal the internal micro-pore change of clays due to freeze-thaw and compression quantitatively.
1 Introduction
The artificial ground freezing method (AGF) has been widely adopted in urban subway construction in Ningbo, a coastal city in eastern China, which is located in a soft soil area that is rich in water (Wang et al., 2017; Wang et al., 2018; Fan et al., 2019). However, the AGF would cause frost heaves and thaw settlement in water rich areas (Yamamoto and Springman, 2014; Marwan et al., 2016). The key problem to be solved is to reduce the thaw settlement deformation caused by the AGF (Civan, 2000; Jin et al., 2010; Shen et al., 2018). For soft soil, due to its unique soil structure, the change in the microstructure before and after the freeze-thaw is the fundamental cause of macro thaw settlement deformation (Yamamuro and Wood, 2004; Cuisinier et al., 2011; Lieb-Lappen et al., 2017).
At present, the research methods for investigating soil microstructure mainly include mercury intrusion porosimetry (MIP), gas absorption operations (BET), energy dispersive spectroscopy, computed tomography (CT), and scanning electron microscopy (SEM) (Yamamuro and Wood, 2004; Grimstad et al., 2010; Cuisinier et al., 2011; Gu et al., 2013; Lopes, 2016; Lieb-Lappen et al., 2017). Among them, MIP has been widely used due to its large measurement range and good repeatability of measurement results (Romero and Simms, 2009; Lubelli et al., 2013; Lopes, 2016; Wang et al., 2016). Cui and Tang (2011) used MIP to study the evolution of the pore size distribution of natural structures in soft soil during compression, and proposed the concept of the pore structure damage potential, which is used to characterize the variation in the pore distribution with load. Tang and Yan (2015) revealed the micromechanism of the effect of freeze-thaw cycles on soil strength through mercury intrusion tests and scanning electron microscopy. In addition, the application of MIP in studies of soil microstructure has included the following aspects: 1) the variation law of the soil pores under different degrees of compression (Cudny and Vermeer, 2004; Liu and Zhang, 2014; Jarvis et al., 2017; Wang et al., 2020), 2) the consolidation and dynamic load conditions based on mercury intrusion tests (Dean et al., 1987; Jiang et al., 2014; Tang and Li, 2018) and SEM analyses (Kang et al., 2003; Cui and Jia, 2013), 3) the micropore characteristics and their changes with engineering properties such as compression deformation and seepage consolidation (Kawaragi et al., 2009; Le Runigo et al., 2009; Aldaood et al., 2014; Yi et al., 2015; Lei et al., 2019; Liu et al., 2020).
Fractal theory is a very popular, active new theory (Mandelbrot, 1967). The most basic characteristic of fractal theory is to describe and study objective things from the perspective of fractal dimension and mathematical methods, that is, to describe and study objective things using the mathematical tools of the fractal dimension (Mandelbrot, 1983; Avnir et al., 1985; Avnir, 1989; Moore and Donaldson, 1995; Zeng et al., 1996; Liu et al., 2011). It breaks away from the traditional barriers of one-dimensional line, two-dimensional surface, three-dimensional shapes, and even four-dimensional space-time. Its results are closer to the description of the real attributes and states of complex systems, and they are more in line with the diversity and complexity of objective things. Since Tyler (Tyler and Wheatcraft, 1992) introduced the use of fractal theory in the study of soil structures, many scholars have carried out fractal research on the quantity distribution, mass distribution, volume distribution, surface area, and contour line of particles in geotechnical media (Peyton et al., 1994; Zeng et al., 1996; Cai et al., 2010; Caruso et al., 2011; Zhang et al., 2015; Zhao et al., 2017; Wang and Guo, 2019), and many important achievements have been made in the study of the microstructure of non-freeze-thaw soils. However, research on the microstructure of frozen soils has mainly focused on the compression deformation of disturbed perennial and seasonal frozen soils, the shear damage, and the change in the soil properties under freeze-thaw cycles (Zhang and Zhang, 2006; Tang and Yan, 2015; Ding et al., 2019). Numerous qualitative studies have been carried out in combination with mercury intrusion tests, SEM image processing, and CT scanning technology (Chunhua et al., 2005; Bornert, 2010; Hamamoto et al., 2016; Ding et al., 2019). Because of the large number of micro parameters, it is difficult to establish a macroscopic quantitative expression based on the microstructural parameters that reflects the actual engineering problem.
The structure of the disturbed soil has changed, and its microscopic particle state, interparticle contact state, and pore characteristics cannot fully reflect the structural characteristics of the undisturbed soil. Little research has been conducted on the micro-mechanism of undisturbed artificial frozen and thawed soils. Tang et al. (2011) (Zhou and Tang, 2015a; Zhou and Tang, 2015b; Tang and Yan, 2015; Jie and Tang, 2018; Tang and Li, 2018; Zhou and Tang, 2018) compared and analyzed the micromechanisms of the dynamic characteristics of frozen and thawed dark green silty clay by combining the microstructure scanning pictures of the soil before and after freezing. Taking the fourth layer of muddy clay in Shanghai as the research object, we studied the influence of the soil freezing temperature on the pore diameter, pore shape, directivity, porosity, and surface void ratio.
Many achievements have been made in the study of the microstructure of rocks and soils, while little research has been conducted on the micro-mechanism of the thawing settlement characteristics of undisturbed artificial frozen-thawed soils. Systematic research on the pore distribution and variation law of undisturbed soft soil, frozen-thawed soil, compressed undisturbed soil, and compressed thawed soil is still lacking. Therefore, through MIP tests and based on fractal geometry theory, quantitative and qualitative research was carried out. Therefore, it is necessary to study the pore distribution characteristics and the micro-mechanism of thaw settlement.
2 Experiments
2.1 Soil Samples
Mucky clay and silty clay samples were obtained from 12 to 35 m below the ground surface using a thin-walled sampler (11 cm ID) and carefully transported to the laboratory from a site in Ningbo, China. Table 1 presents the soils’ index properties.
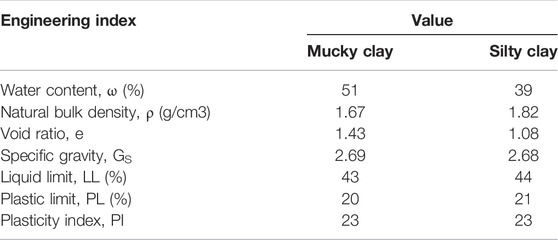
TABLE 1. Soil index properties of the tested samples.
2.2 Apparatus for the Freeze-Thaw Simulation
Figure 1 shows a schematic of the apparatus designed to simulate the freeze-thaw process using the artificial ground freezing method (AGF). It consists of a temperature controlled environmental chamber, a specimen tube, top and bottom plates, a makeup water device, a loading device, and a temperature and vertical displacement monitoring system.
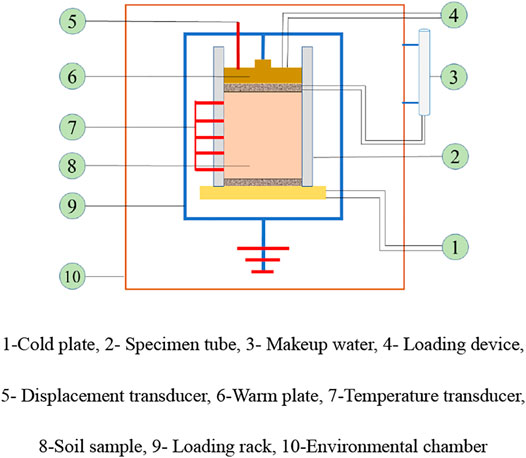
FIGURE 1. Schematic of the freeze-thaw simulation apparatus. 1-Cold plate, 2- Specimen tube, 3- Makeup water, 4- Loading device, 5- Displacement transducer, 6-Warm plate, 7-Temperature transducer, 8-Soil sample, 9- Loading rack, 10-Environmental chamber.
The main steps of the experiment are as follows: 1) The undisturbed soil sample was cut into a cylinder with a diameter of 79.8 mm and a height of 50 mm using a soil cutter. 2) The soil specimen was packed into a tube and wrapped with an insulation layer. Then, the tube was placed in the environmental chamber with a constant temperature. The top and bottom plates were connected to the cold liquid circulation pipeline, the displacement sensor was installed, and the temperature of the thermostat and the top and bottom plates was set to 1°C. The sample was held constant for 6 h, and the temperature and deformation were monitored. 3) When the initial temperature of the sample equally reached 1°C, the water supply pipeline was opened, the water level of the water supply device was adjusted, and the freeze-thaw test began. 4) The temperature of the bottom plate was adjusted to −10°C, and the sample was frozen from the bottom to the top. The temperature of the environmental chamber and the warm end was maintained at 1°C. The initial water level was recorded, and the water level, temperature, and deformation was recorded in real time. The frost heave test was completed when the height change of the sample was less than 0.02 mm in 2 h 5) After the frost heave test, the upper and lower cold plate supply and the water supply device were closed, and the temperature of the environment box was adjusted to 20°C to simulate the thawing of frozen soil in a natural environment. The temperature and deformation were recorded in real time. 6) Within 2 h, the height change value of the sample was less than 0.05 mm, and the test was complete. The components of the instrument were dismantled, the sample was removed, and the next test was carried out.
2.3 Consolidation Test
To study the compressibility of undisturbed and frozen-thawed soils, the maximum compressive load was set to 600 kPa based on the burial depth. The test was carried out according to Standard GB/T50123-2019 for the Geotechnical Test Method. Additional details can be found in references (Morgenstern and Smith, 1973; Chai et al., 2004; Cui and Jia, 2013; Zhang et al., 2016).
2.4 Mercury Intrusion Porosimetry
Mercury intrusion porosimetry (MIP) was used to observe the change of the soil’s micropore after the freeze-thaw and compression. The MIP test was carried out using an Auto-pore 9,500 mercury porosimeter with a pore size range of 5–360,000 nm. The mercury injection test samples were prepared by the liquid nitrogen vacuum freeze-drying method, which had little effect on the microstructure of the soil samples. As shown in Table 2, the specimens were prepared under four different test conditions (undisturbed samples, compressed samples, frozen-thawed samples, compressed samples upon freezing-thawing) and were immersed in mercury. The mercury was gradually pressed into the pores of the specimens by applying pressure on the mercury. MIP is a common method used to study the pore size and distribution of solid materials such as rocks and soils. The testing process is divided into two stages: low pressure and high pressure. The pore size measurement capability ranges from several nanometers to several hundred microns. The experimental principle is that non-wetting liquids (such as mercury) will not flow into the pores of solid materials without external pressure. An assumption was made that cylindrical flow channels with a radius r exist in the soil, and the radius of the pores are intruded by mercury under an applied pressure, p. For a cylindrical pore, the Washburn Equation can be used to calculate the pore radius (Washburn, 1921).
where p is the applied external pressure (psia); σ is the surface tension coefficient of the mercury (N/m), taken as 0.484 N/m at normal temperatures; α is the infiltration angle of the mercury into the soil, taken as 130°; and r is the radius of a cylindrical pore (m).
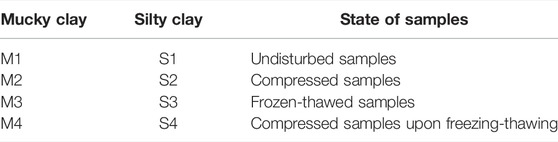
TABLE 2. Test groups and samples.
3 Results and Analysis
3.1 Freeze-Thaw Characteristics
The freeze-thaw properties and the physical properties of soft clay were obtained through freeze-thaw tests and are presented in Table 3.
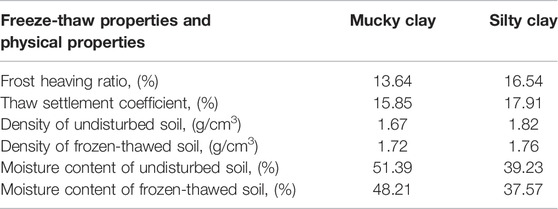
TABLE 3. Freeze-thaw properties and physical properties of the specimens.
3.2 Compression Characteristics
The e-p curves obtained from the compression tests on the mucky clay and silty clay samples before and after the freeze-thaw are shown in Figure 2. The overall curve can be divided into two stages by the red line in the figure: the rapid decrease in the void ratio and the slow decrease in the void ratio. During the process of clay compression, when the load is small, the compression mainly destroys the structure of the soil sample. The freeze-thaw action destroys the original skeleton structure of the soil and reorganizes it into a new structure. For the mucky clay and silty clay samples, the reduction in the void ratio of the soil after the freeze-thaw and compression was greater than that in the undisturbed soil. In addition, the compression coefficients of the mucky clay and silty clay samples after the freeze-thaw were reduced by nearly 20%, which indicates that the structure of the soft clay was disturbed by the freeze-thaw, and its compressibility was decreased.
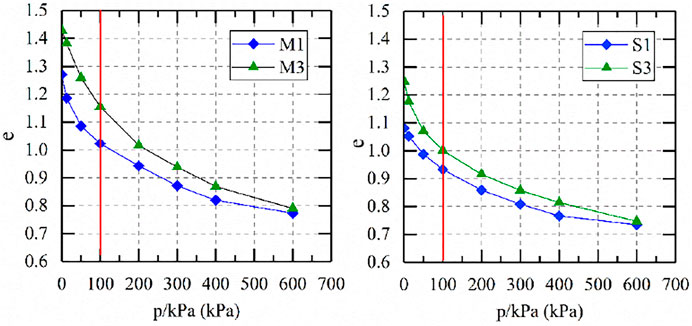
FIGURE 2. e-p curves for the soil specimens before and after the freeze-thaw.
3.3 Analysis of the Mercury Intrusion Porosimetry Test Results
According to the shear’s pore size division theory (Shear et al., 1993) and the microstructure and pore size characteristics of clays in the Ningbo area, the pore size of clays can be divided into the following five categories according to the diameter (d): 1) macro pore (d > 20 μm), including intergranular pores and some intragranular pores; 2) medium pore (10 μm < d < 20 μm), mainly intragranular pores; 3) small pore (2 μm < d < 10 μm), including intragranular pores and some intergranular pores; 4) micro pore (0.1 μm < d < 2 μm), mainly intergranular pores; and 5) ultramicro pore (d < 0.1 μm), mainly intragranular pores.
3.3.1 Mercury Intrusion Characteristics of Clays
According to the principle of MIP, different mercury injection pressures correspond to different pore sizes. A complete mercury injection test includes two processes: mercury injection and mercury withdrawal.
Figures 3A,B show the cumulative mercury injection and mercury pressure curves of the mucky clay and silty clay, respectively. The mercury injection curves of the mucky clay and silty clay can be divided into three stages. The two soils exhibit the same trend: the first stage pressure was less than 100 psia, the second stage pressure was 100–10,000 psia, and the third stage pressure was greater than 10,000 psia until the set pressure value reached 300,000 psia. The overall curve shows that in the first stage, the mercury pressure was small, and the amount of mercury injection increased slowly. In the second stage, the mercury injection pressure increased continuously, and the cumulative mercury injection volume increased rapidly. In the third stage, the mercury pressure continued to increase to the set value, but the cumulative mercury intake growth was gentle at this stage. Only the first stage of the thawed silty soil stopped at 300 psia, and the increase rate in the second stage was higher than that in the other two stages, which is likely due to the heterogeneity of the soil samples.
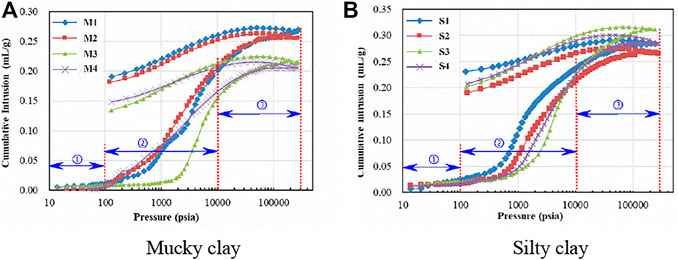
FIGURE 3. The cumulative mercury intrusion amount of different pressures. (A) Mucky clay, (B) Silty clay.
In the mercury withdrawal stage of the mucky clay and silty clay samples, the curve was smooth. The mercury pressure decreased continuously in the mercury withdrawal stage, and the cumulative mercury injection volume did not return to 0. The mercury injection curve and the mercury withdrawal curves are not closed, which indicates that some mercury remained in the soil pores after the mercury withdrawal stage. The residual amount remaining in the pores is related to the pore characteristics of the soil samples. The larger the pore size and pore volume, the greater the residual mercury content.
3.3.2 Distribution of the Cumulative Pore Volume and Pore Surface Area
According to the cumulative distribution curve or differential curve of pore size corresponding to different pressures in mercury injection experiment, the cumulative pore volume or pore surface area can be calculated. Figure 4 shows the curves of the cumulative mercury injection versus pore size for the mucky clay and silty clay. As can be seen, the pore volumes of the silty undisturbed soil, compressed undisturbed soil, and compressed thawed soil are mainly distributed in the less than 6,000 nm pore diameter range, while the pore size of the frozen-thawed soil is mainly distributed in the less than 1,000 nm pore diameter range. The pore volumes of the clay undisturbed soil, compressed undisturbed soil, and compressed thawed soil are mainly distributed in the less than 6,000 nm pore diameter range, while that of the frozen-thawed soil is mainly distributed in the less than 2,000 nm pore diameter range. The results show that the pore size of soft soil decreases and the proportion of micropores increase. The curve for the mucky clay and silty clay thawed soils after compression plot above those of the frozen-thawed soils, which indicates that the compression improved the pore connectivity and decreased the pore volume of the large-diameter pores.
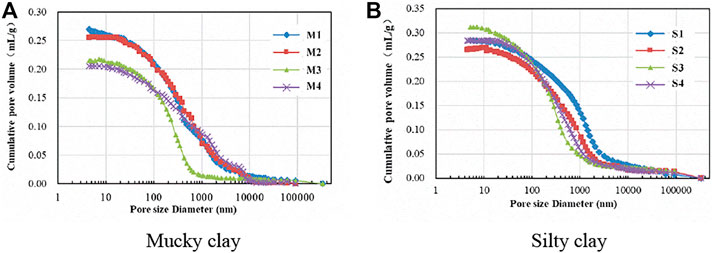
FIGURE 4. The cumulative pore volume at different pore sizes. (A) Mucky clay, (B) Silty clay
Figure 5 shows the curves of the cumulative pore surface area versus pore size for mucky clay and silty clay. The pore surface areas of the mucky clay and silty clay are mainly distributed in the pores with pore diameters of less than 1,000 nm.

FIGURE 5. The cumulative pore area at different pore sizes. (A) Mucky clay, (B) Silty clay.
3.3.3 Pore Distribution Characteristics of the Soil Samples After the Freeze-Thaw and Compression
The total pore volumes and the total pore surface areas of the mucky clay under different conditions are shown in Figure 6A and Figure 7A, respectively. After the freeze-thaw, the total pore volume and the pore surface area decreased. Total pore volume and pore surface area of the samples was shown in Table.4, compared with the undisturbed soil, the pore volume and pore surface area of the thawed mucky clay soil decreased by 20.49 and 8.03%, respectively. The pore volumes and surface areas of the soil samples were decreased by the compression. The pore volumes of the undisturbed soil and the frozen-thawed soil decreased by 5.47 and 5.73%, respectively, and their pore surface areas decreased by 2.45 and 7.66%, respectively. As the volume of the soil sample decreased after the freeze-thaw, it can be concluded that the soil particles are incompressible, so the pore volume inevitably decreased. With decreasing pore volume, the proportion of the pore volume accounted for by the small pores increased, so the pore surface area decreased. The freeze-thaw process transformed the pores larger than the mesopores into micropores and ultramicropores, decreasing pore sizes smaller, and it transformed the pores within some of the aggregates into pores between and within the particles. The pore surface area of the sludge was mainly distributed in the micropores. Although some of the pore volume accounted for by the pores larger than micropores, their pore surface area can be ignored. For mucky clay, the proportion of ultramicropores in pore surface area is high, up to about 70%. The remaining 30% of the pore surface area is almost microporous.
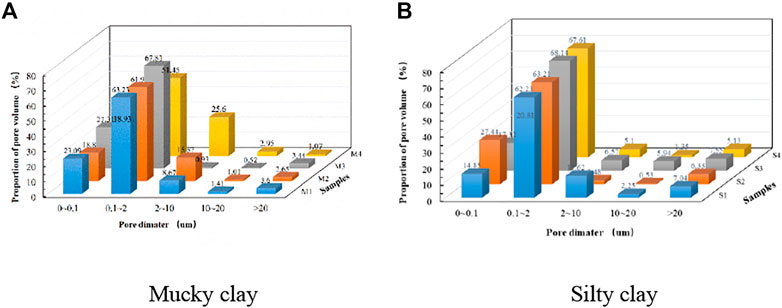
FIGURE 6. The pore volume distribution. (A) Mucky clay, (B) Silty cla.
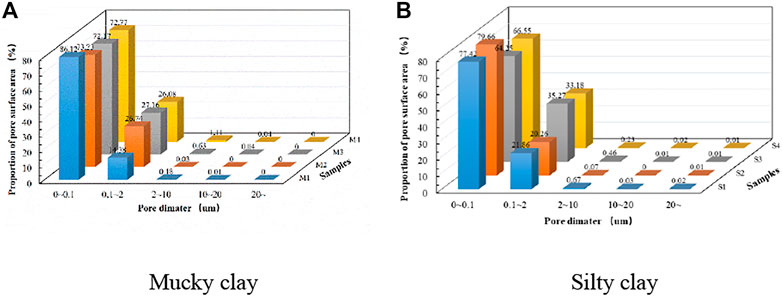
FIGURE 7. The pore area distribution. (A) Mucky clay, (B) Silty clay.
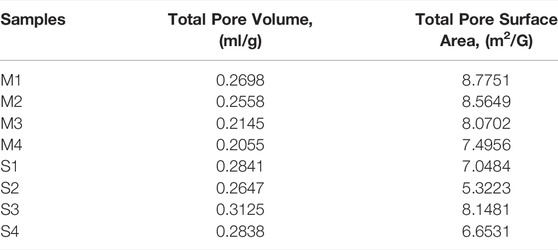
TABLE 4. Total pore volume and pore surface area of the samples.
The total pore volumes and total pore surface area distributions of the silty clay under different conditions are shown in Figures 6B, 7B, respectively. The pore volume and pore surface area of the silty clay increased after thawing, and the pore ratio of the clay was increased by the freeze-thaw process. Compared with the undisturbed soil, the pore volume and pore surface area of the silty clay increased by 9.99 and 15.62% due to freeze-thaw, respectively. The pore volume of the undisturbed soil and the thawed soil decreased by 7.33 and 10.11%, respectively; and the pore surface area decreased by 32.43 and 22.47%, respectively due to compression (shown in Table 4). The freeze-thaw process transformed the pores larger than the micropores in the silty clay into micropores and ultramicropores, increasing the pore size, even if the pores within some of the aggregates were transformed into pores between and within the particles. The pore volume ratios of the micropores and ultramicropores increased after compression of the undisturbed and frozen-thawed soils, whereas the proportion of the micropores decreased, that is, the transformation of the small pores into micropores and ultramicropores. The pore surface area of the clay is mainly distributed in the ultramicropores and micropores, accounting for 99%. Compared with the micropores, the area distribution ratio of the ultramicropores is larger, about 80% for the undisturbed soil and the compressed undisturbed soil and about 70% for the frozen-thawed soil and the compressed thawed soil, which indicates that the freeze-thaw process decreased the surface area of the ultramicropores, creating pores larger than micropores.
4 Fractal Quantitative Characteristics of the Soil Micropores
4.1 Computation of the Capacity Dimension
Fractal features are usually expressed as the fractal dimension. The fractal dimension D is used to quantitatively describe the complexity and irregularity of the different fractal graphics. The larger the D value, the richer the details. In this paper, the fractal dimensions of the pore volume distribution and the pore surface area distribution were calculated using the capacity dimension method as follows:
In the calculation, D was the particle size or pore diameter, ln D was taken as the abscissa, and lnN(d) was the logarithm of the pore volume lnv(d) or the logarithm of the pore surface area lnA(d), which was larger than the pore diameter, was taken as the ordinate. If there is a linear segment in the curve, the pore volume distribution and the pore surface area distribution has fractal characteristics. The negative slope value of the stable straight-line section was taken as the fractal dimension value of the pore volume distribution and the pore surface area distribution. The pore size, pore volume, and pore surface area were directly obtained from the mercury injection test.
The geometric meaning of the fractal dimension of the pore volume distribution and the pore surface area distribution are as follows: the larger the fractal dimension, the more uneven the distribution of the pore volume, and the larger the pore volume (or pore surface area), the smaller pore diameter. Based on the pore volume, the pore surface area of soft clay, and the linear correlation degree in a specific particle size range, the self-similar interval was determined. Finally, the pore diameter range was determined to be 0.4–3.5 μm for pore volume distribution, and 0.01–0.25 μm for the pore surface area distribution.
It was found that the pore volume distribution and the pore surface area distribution of the soil have fractal characteristics. Taking the calculation of the pore volume distribution fractal dimension of the mucky clay as an example, the pore volume of the mucky clay is mainly distributed in the less than 0.1–2 μm pore diameter range, but there are still a small number of pores in the 2–10 μm pore diameter range, so the upper limit of the pore size is 2.5 μm. By taking ln (d) as the abscissa and lnv (d) as the ordinate, the regression line was obtained, and the negative number of the slope of the straight line was taken as the fractal dimension. In a linear regression, when the number of test points is more than 10, the correlation coefficient is greater than 0.95, which indicates that the correlation is very good. When the lower limit of the aperture range was 0.05 μm, the linear regression correlation coefficient was less than 95%; and when the lower limit was 0.10 μm, the linear regression correlation coefficient was greater than 95%, which meets the requirements. Therefore, the lower limit is 0.1 μm, and the fractal dimension is 0.589. The larger the fractal dimension, the more uneven the distribution of the pore volume; and the smaller the pore diameter, the larger the pore volume.
4.2 Fractal Quantitative Characteristics of the Soil Pore Volume Distribution
According to the method described in the previous section, the pore volume of the silty soil under various states has fractal characteristics within the pore size range of 0.1–2.5 μm. The fractal dimension regression curve of the pore volume distribution of the silty soil for under different states is shown in Figure 8A.
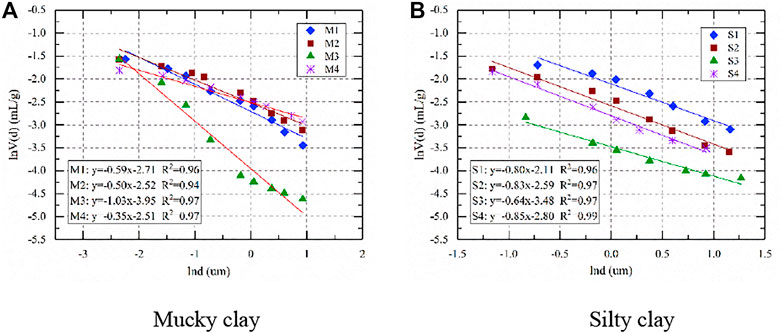
FIGURE 8. Capacity dimension distribution curve of the soil pore volume. (A) Mucky clay, (B) Silty clay.
As can be seen from Figure 8A, the fractal dimension of the pore volume distribution of the undisturbed soil is smaller than that of the frozen-thawed soil; that of the compressed undisturbed soil is slightly smaller than that of the undisturbed soil; and that of the compressed thawed soil is smaller than that of the frozen-thawed soil. The fractal dimension of the pore volume increases by 75.38% after the freeze-thaw, and the fractal dimensions of the pore volume distributions of the undisturbed soil and the frozen-thawed soil decreased by 15.95 and 66.11% due to compression, respectively. The fractal dimension of the pore volume distribution of the frozen-thawed soil is larger than that of the undisturbed soil, which indicates that the pore volume distribution in this pore size range is uneven due to the freeze-thaw action. The pore volume distribution of the smaller pore size is greater than that of the slightly larger pore size. The fractal dimension of the pore volume distribution decreases after compression, which indicates that the distribution of the pore volume in each pore size range is made more uniform by the compression. In particular, the distribution of the pore volume tends to be more uniform after compression. The fractal dimension of the pore volume distribution is approximately positively correlated with the proportion of the pore volume in this range. The larger the proportion of the pore volume in this range, the larger the fractal dimension of the pore volume distribution.
The pore volume of the silty clay is mainly distributed in the less-than-0.1–2 μm pore size range, but there are still some pores in the 2–10 μm pore size range, so the upper limit of the pore size is 3.5 μm. Taking the undisturbed silty clay as an example, the correlation coefficient is only 88% when the lower limit is 0.1 μm, and the correlation coefficient is greater than 95% until the lower limit of 0.4 μm. The pore size range is 0.4–3.5 μm. The fractal dimension of the pore volume distribution of the silty clay is shown in Figure 8B.
Figure 8B shows that the pore volume integral dimensions of the thawed clay soil and the undisturbed soil are very similar, and the pore volume distribution fractal dimensions of the undisturbed soil and the frozen-thawed soil increase slightly after compression, but the increase is not very significant. The fractal dimension of the pore volume distribution of the silty clay decreased by 19.79%, and the fractal dimensions of the pore volume distributions of the undisturbed soil and the frozen-thawed soil decreased by 4.51 and 32.81%, respectively. The fractal dimension of the pore volume distribution of the frozen-thawed soil is smaller than that of the undisturbed soil, which indicates that the pore volume distribution of the clay within this pore size range is homogenized by the freeze-thaw action. The fractal dimension of the pore volume distribution is increased by compression, which indicates that the pore volume distribution of the clay is non-uniform in this pore size range due to compression. In particular, the pore size range tends to be more uneven after compression. The fractal dimension of the pore volume distribution is approximately positively correlated with the proportion of the pore volume in this range. The larger the proportion of the pore volume in this range, the larger the fractal dimension of the pore volume distribution.
4.3 Fractal Quantitative Characteristics of the Soils’ Pore Surface Area
The pore surface areas of the mucky clay and silty clay soils are mainly distributed in the less-than-0.1 μm pore diameter range, and the proportion is greater than 60%. The method of calculating the fractal dimension of the pore surface area distribution is the same as that for calculating the fractal dimension of the pore volume distribution. By taking ln(d) as the abscissa and the natural logarithm of the hole surface area lnA(d) as the ordinate, the regression of the straight line was obtained, and the negative value of the slope of the straight line was taken as the fractal dimension. It was found that there is a good linear relationship in the 0.01–0.25 μm range. The larger the fractal dimension, the more uneven the distribution of the pore surface area, that is, the smaller the pore diameter, the greater the pore surface area.
The numerical value of the fractal dimension of the pore surface area of the mucky clay soil does not vary significantly, and it has a certain regularity. As shown in Figures 9A,B after thawing, the fractal dimension of the pore surface area distribution increases slightly, and the fractal dimensions of the pore surface areas of the undisturbed soil and the frozen-thawed soil increase slightly. As shown in Figure 9B, the numerical value of the fractal dimension of the pore surface area of the silty clay soil does not vary significantly, and it has a certain regularity. The fractal dimension of the pore surface area distribution slightly increases after thawing, and it decreases slightly after the compression of the undisturbed soil and the frozen-thawed soil. The fractal dimension of the pore surface area distribution of the silty clay is 2.08% larger than that of the undisturbed soil, and the fractal dimensions of the pore surface area distributions of the undisturbed soil and the frozen-thawed soil decrease by 4.90 and 10.66%, respectively. The fractal dimension of the pore surface area distribution of the frozen-thawed soil is greater than that of the undisturbed soil, which indicates that the pore area distribution of the clay within this pore size range is non-uniform due to the freeze-thaw action. The fractal dimension of the pore surface area distribution increases after compression, which indicates that the pore surface area distribution of the clay is uniform in this pore size range. In particular, the pore size range of the frozen-thawed soil tends to be more uniform after compression.
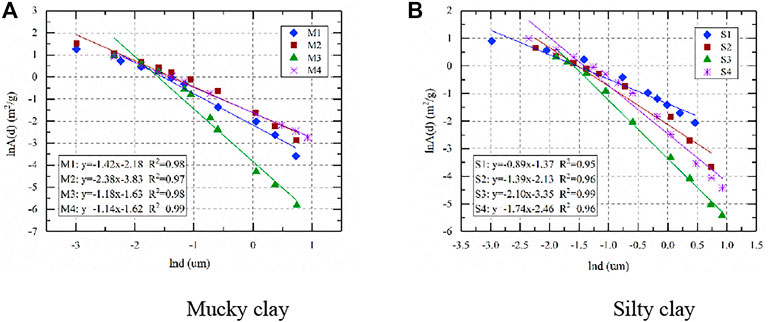
FIGURE 9. Capacity dimension distribution curve of the soils’ pore surface area. (A) Mucky clay, (B) Silty clay.
5 Limitations and Engineering Implications
The soil skeleton structure is a function of the three-dimensional stress on the stratum, and in the natural state, it retains its inherent structural, shape. In this paper, to determine the change in the soil pores under freeze-thaw action and compression more accurately, original soil samples were tested. We ignored the influence of the disturbance on the soil pore structure caused by the sampling and the sample preparation processes. Furthermore, as the sample size of the MIP is small, to avoid the influence of the structural differences between the soil samples in different states, for all the states, mercury intrusion tests were run in triplicate and the three groups of parallel test data were averaged.
6 Conclusion
This study 1) presents micropores test data obtained from MIP tests conducted on undisturbed samples, compressed samples, frozen-thawed samples, and compressed samples upon freezing-thawing; 2) analyzes the quantitative changes in the micropores of mucky clay and silty clay after freeze-thaw and compression; and 3) establishes the quantitative relationship between the pore volume and pore surface area based on the fractal dimension. The following conclusions are drawn from the results of this study:
1) Freeze-thaw action and compression have different effects on the pore characteristics of mucky clay and silty clay. The results show that the pore volume and pore surface area of the mucky clay decreased by 20.49 and 8.03% due to freeze-thaw, respectively, which is in accordance with the law of the smaller pore ratio. The pore volume and pore surface area of the thawed silty clay soil increased by 9.99 and 15.62% due to freeze-thaw, respectively, which is in line with the law of the larger pore ratio. After compression, for the mucky clay, the pore volumes of the undisturbed and frozen-thawed soils decreased by 5.47 and 5.73%, respectively; and their pore surface areas decreased by 2.45 and 7.66%, respectively. For the silty clay, the pore volumes of the undisturbed clay and the frozen-thawed soil decreased by 7.33 and 10.11%, respectively, and their pore surface areas decreased by 32.43 and 22.47%, respectively.
2) Micro pores and ultramicro pores account for more than 80% of clays’ total pore volume and pore surface area. The proportion of the micropores in the pore volume is about three times that of the ultramicropores. The pore surface area is also mainly distributed in the micropores and the ultramicropores, accounting for about 99% of the total pore surface area. The proportion of the micropores in the pore surface area is about four times that of the ultramicropores.
3) Both the pore volume distribution and the pore surface area distribution have fractal characteristics. The pore volume of the mucky clay has fractal characteristics in the 0.1–2.5 μm pore diameter range, the pore volume of the silty clay has fractal characteristics in the 0.4–3.5 μm pore diameter range, and the pore surface area has fractal characteristics in the 0.01–0.2 μm pore diameter range. The fractal dimension is positively correlated with the proportion of the pore volume and the pore surface area.
4) The fractal dimension of the pore volume distribution of soft soil is smaller than that of undisturbed soil, and it decreases after compression. The fractal dimension of the thawed clay soil is smaller than that of the undisturbed soil, and it increases after compression.
5) The fractal dimension of the pore surface area distribution of soft soil is similar to that of undisturbed soil, and it increases after compression. The fractal dimension of the thawed clay soil is larger than that of the undisturbed soil, and it decreases after compression.
Data Availability Statement
The original contributions presented in the study are included in the article/Supplementary Material, further inquiries can be directed to the corresponding author.
Author Contributions
All authors listed have made a substantial, direct, and intellectual contribution to the work and approved it for publication.
Funding
The work was supported by the National Natural Science Foundation of China (Nos. 42167024, 52168043, 42061011, 41977236, and 42107203), Natural Science Foundation of Jiangxi Province (Nos. 20202BABL214044, and 20192ACBL20002), and the Doctoral Scientific Research Foundation of East China University of Technology (No. DHBK2017121), Science and Technology Project Founded by the Education Department of Jiangxi Province (No. GJJ200701).
Conflict of Interest
The authors declare that the research was conducted in the absence of any commercial or financial relationships that could be construed as a potential conflict of interest.
Publisher’s Note
All claims expressed in this article are solely those of the authors and do not necessarily represent those of their affiliated organizations, or those of the publisher, the editors and the reviewers. Any product that may be evaluated in this article, or claim that may be made by its manufacturer, is not guaranteed or endorsed by the publisher.
References
Aldaood, A., Bouasker, M., and Al-Mukhtar, M. (2014). Impact of Freeze-Thaw Cycles on Mechanical Behaviour of Lime Stabilized Gypseous Soils. Cold Regions Sci. Techn. 99, 38–45. doi:10.1016/j.coldregions.2013.12.003
Avnir, D., Farin, D., and Pfeifer, P. (1985). Surface Geometric Irregularity of Particulate Materials: The Fractal Approach. J. Colloid Interf. Sci. 103 (1), 112–123. doi:10.1016/0021-9797(85)90082-7
Farin, D., and Avnir, D. (1989). The Fractal approach to heterogeneous chemistry. Hoboken, NY: John Wiley and Sons.
Bornert, M. (2010). X-ray Micro CT for Studying Strain Localization in clay Rocks under Triaxial Compression. Adv. X-ray Tomography Geomaterials 118, 35. doi:10.1002/9780470612187.ch2
Cai, J., Yu, B., Zou, M., and Mei, M. (2010). Fractal Analysis of Invasion Depth of Extraneous Fluids in Porous media. Chem. Eng. Sci. 65 (18), 5178–5186. doi:10.1016/j.ces.2010.06.013
Caruso, T., Barto, E. K., Siddiky, M. R. K., Smigelski, J., and Rillig, M. C. (2011). Are Power Laws that Estimate Fractal Dimension a Good Descriptor of Soil Structure and its Link to Soil Biological Properties? Soil Biol. Biochem. 43 (2), 359–366. doi:10.1016/j.soilbio.2010.11.001
Chai, J.-C., Miura, N., Zhu, H.-H., and Yudhbir, (2004). Compression and Consolidation Characteristics of Structured Natural clay. Can. Geotech. J. 41 (6), 1250–1258. doi:10.1139/t04-056
Chunhua, X., Xueyan, X., and Xiaodong, S. (2005). Study on Residual Strain of Frozen Soil and CT Analysis under Cyclic Loading of Variable Amplitudes. Yantu Lixue(rock Soil Mech. 26 (4), 572–576. doi:10.1007/s11769-005-0030-x
Civan, F. (2000). Unfrozen Water in Freezing and Thawing Soils: Kinetics and Correlation. J. Cold Reg. Eng. 14 (3), 146–156. doi:10.1061/(asce)0887-381x(2000)14:3(146)
Cudny, M., and Vermeer, P. A. (2004). On the Modelling of Anisotropy and Destructuration of Soft Clays within the Multi-Laminate Framework. Comput. Geotechnics 31 (1), 1–22. doi:10.1016/j.compgeo.2003.12.001
Cui, Z., and Tang, Y. (2011). Microstructures of Different Soil Layers Caused by the High-Rise Building Group in Shanghai. Environ. Earth Sci. 63, 109–119. doi:10.1007/s12665-010-0673-5
Cui, Z.-D., and Jia, Y.-J. (2013). Analysis of Electron Microscope Images of Soil Pore Structure for the Study of Land Subsidence in Centrifuge Model Tests of High-Rise Building Groups. Eng. Geology. 164, 107–116. doi:10.1016/j.enggeo.2013.07.004
Cuisinier, O., Auriol, J.-C., Le Borgne, T., and Deneele, D. (2011). Microstructure and Hydraulic Conductivity of a Compacted Lime-Treated Soil. Eng. Geology. 123 (3), 187–193. doi:10.1016/j.enggeo.2011.07.010
Dean, T., Bell, J., and Baty, A. (1987). Soil Moisture Measurement by an Improved Capacitance Technique, Part I. Sensor Design and Performance. J. Hydrol. 93 (1), 67–78. doi:10.1016/0022-1694(87)90194-6
Ding, Z., Kong, B., Wei, X., Zhang, M., Xu, B., and Zhao, F. (2019). Laboratory Testing to Research the Micro-structure and Dynamic Characteristics of Frozen-Thawed Marine Soft Soil. Jmse 7 (4), 85. doi:10.3390/jmse7040085
Fan, W., Yang, P., and Yang, Z. (2019). Impact of Freeze-Thaw on the Physical Properties and Compressibility of Saturated clay. Cold Regions Sci. Techn. 168, 102873. doi:10.1016/j.coldregions.2019.102873
Grimstad, G., Degago, S. A., Nordal, S., and Karstunen, M. (2010). Modeling Creep and Rate Effects in Structured Anisotropic Soft Clays. Acta Geotechnica 5 (5), 69–81. doi:10.1007/s11440-010-0119-y
Gu, X., Huang, M., and Qian, J. (2013). DEM Investigation on the Evolution of Microstructure in Granular Soils under Shearing. Granular Matter 16 (1), 91–106. doi:10.1007/s10035-013-0467-z
Hamamoto, S., Moldrup, P., Kawamoto, K., Sakaki, T., Nishimura, T., and Komatsu, T. (2016). Pore Network Structure Linked by X-ray CT to Particle Characteristics and Transport Parameters. Soils and Foundations 56 (4), 676–690. doi:10.1016/j.sandf.2016.07.008
Jarvis, N., Larsbo, M., and Koestel, J. (2017). Connectivity and Percolation of Structural Pore Networks in a Cultivated silt Loam Soil Quantified by X-ray Tomography. Geoderma 287, 71–79. doi:10.1016/j.geoderma.2016.06.026
Jiang, M., Zhang, F., Hu, H., Cui, Y., and Peng, J. (2014). Structural Characterization of Natural Loess and Remolded Loess under Triaxial Tests. Eng. Geology. 181, 249–260. doi:10.1016/j.enggeo.2014.07.021
Jie, Z., and Tang, Y. (2018). Practical Model of Deformation Prediction in Soft clay after Artificial Ground Freezing under Subway Low-Level Cyclic Loading. Tunnelling Underground Space Techn. 76, 30–42. doi:10.1016/j.tust.2018.03.003
Jin, H., Hao, J., Chang, X., Zhang, J., Yu, Q. h., Qi, J., et al. (2010). Zonation and Assessment of Frozen-Ground Conditions for Engineering Geology along the China-Russia Crude Oil Pipeline Route from Mo'he to Daqing, Northeastern China. Cold Regions Sci. Techn. 64 (3), 213–225. doi:10.1016/j.coldregions.2009.12.003
Kang, M.-S., Watabe, Y., and Tsuchida, T. (2003). Effect of Drying Process on the Evaluation of Microstructure of Clays Using Scanning Electron Microscope (SEM) and Mercury Intrusion Porosimetry (MIP), the Thirteenth International Offshore and Polar Engineering Conference, Honolulu, Hawaii, May 25–30, 2003. International Society of Offshore and Polar Engineers.
Kawaragi, C., Yoneda, T., Sato, T., and Kaneko, K. (2009). Microstructure of Saturated Bentonites Characterized by X-ray CT Observations. Eng. Geology. 106 (1-2), 51–57. doi:10.1016/j.enggeo.2009.02.013
Le Runigo, B., Cuisinier, O., Cui, Y.-J., Ferber, V., and Deneele, D. (2009). Impact of Initial State on the Fabric and Permeability of a Lime-Treated silt under Long-Term Leaching. Can. Geotech. J. 46 (11), 1243–1257. doi:10.1139/t09-061
Lei, H., Song, Y., Qi, Z., Liu, J., and Liu, X. (2019). Accumulative Plastic Strain Behaviors and Microscopic Structural Characters of Artificially Freeze-Thaw Soft clay under Dynamic Cyclic Loading. Cold Regions Sci. Techn. 168, 102895. doi:10.1016/j.coldregions.2019.102895
Lieb-Lappen, R. M., Golden, E. J., and Obbard, R. W. (2017). Metrics for Interpreting the Microstructure of Sea Ice Using X-ray Micro-computed Tomography. Cold Regions Sci. Techn. 138, 24–35. doi:10.1016/j.coldregions.2017.03.001
Liu, J., Zha, F., Xu, L., Kang, B., Yang, C., Feng, Q., et al. (2020). Strength and Microstructure Characteristics of Cement-Soda Residue Solidified/stabilized Zinc Contaminated Soil Subjected to Freezing-Thawing Cycles. Cold Regions Sci. Techn. 172, 102992. doi:10.1016/j.coldregions.2020.102992
Liu, J., and Zhang, L. (2014). The Microstructure Characters of Saline Soil in Qarhan Salt Lake Area and its Behaviors of Mechanics and Compressive Strength. Arab J. Sci. Eng. 39 (12), 8649–8658. doi:10.1007/s13369-014-1410-2
Liu, X. H., Liu, J. H., and Wang, Y. (2011). Fractal Characteristic Analysis of Rock Breakage Based on CT Images International Conference on Civil Engineering and Information Technology. Sham Shui Po: Int Industrial Electronic Center, 22–26.
Lopes, B. d. C. F. L. (2016). Microstructural-Based Approach to the Interpretation of Clays and Transitional Soils Behaviour. Universidade de Brasília.
Lubelli, B., de Winter, D. A. M., Post, J. A., van Hees, R. P. J., and Drury, M. R. (2013). Cryo-FIB-SEM and MIP Study of Porosity and Pore Size Distribution of Bentonite and Kaolin at Different Moisture Contents. Appl. Clay Sci. 80-81, 358–365. doi:10.1016/j.clay.2013.06.032
Mandelbrot, B. B. (1983). The Fractal Geometry of NatureAm. J. of Phys.. Macmillan 51, 286. doi:10.1119/1.13295
Mandelbrot, B. (1967). How Long Is the Coast of Britain? Statistical Self-Similarity and Fractional Dimension. Science 156 (3775), 636–638. doi:10.1126/science.156.3775.636
Marwan, A., Zhou, M.-M., Zaki Abdelrehim, M., and Meschke, G. (2016). Optimization of Artificial Ground Freezing in Tunneling in the Presence of Seepage Flow. Comput. Geotechnics 75, 112–125. doi:10.1016/j.compgeo.2016.01.004
Moore, C. A., and Donaldson, C. F. (1995). Quantifying Soil Microstructure Using Fractals. Géotechnique 45 (1), 105–116. doi:10.1680/geot.1995.45.1.105
Morgenstern, N. R., and Smith, L. B. (1973). Thaw-Consolidation Tests on Remoulded Clays. Can. Geotech. J. 10 (1), 25–40. doi:10.1139/t73-003
Peyton, R. L., Gantzer, C. J., Anderson, S. H., Haeffner, B. A., and Pfeifer, P. (1994). Fractal Dimension to Describe Soil Macropore Structure Using X ray Computed Tomography. Water Resour. Res. 30 (3), 691–700. doi:10.1029/93wr02343
Romero, E., and Simms, P. H. (2009). Microstructure Investigation in Unsaturated Soils: A Review with Special Attention to Contribution of Mercury Intrusion Porosimetry and Environmental Scanning Electron Microscopy, Laboratory and Field Testing of Unsaturated Soils. Springer, 93–115. doi:10.1007/978-1-4020-8819-3_8
Shear, D., Olsen, H., and Nelson, K. (1993). Effectsof Desiccation on the Hydraulic Conductivity versus Void Ratio Relationship Fora Natural clay, Transportation Research Record. Washington DC: National academy press, 1365–1370.
Shen, Y.-j., Wang, Y.-z., Zhao, X.-d., Yang, G.-s., Jia, H.-l., and Rong, T.-l. (2018). The Influence of Temperature and Moisture Content on sandstone thermal Conductivity from a Case Using the Artificial Ground Freezing(AGF) Method. Cold Regions Sci. Techn. 155, 149–160. doi:10.1016/j.coldregions.2018.08.004
Tang, Y.-q., and Yan, J.-j. (2015). Effect of Freeze-Thaw on Hydraulic Conductivity and Microstructure of Soft Soil in Shanghai Area. Environ. Earth Sci. 73 (11), 7679–7690. doi:10.1007/s12665-014-3934-x
Tang, Y.-q., Zhou, J., Hong, J., Yang, P., and Wang, J.-x. (2011). Quantitative Analysis of the Microstructure of Shanghai Muddy clay before and after Freezing. Bull. Eng. Geol. Environ. 71 (2), 309–316. doi:10.1007/s10064-011-0380-9
Tang, Y., and Li, J. (2018). Experimental Study on Dynamic Cumulative Axial-Strain Performance of Freezing-Thawing Saturated sandy silt. Cold Regions Sci. Techn. 155, 100–107. doi:10.1016/j.coldregions.2018.08.001
Tyler, S. W., and Wheatcraft, S. W. (1992). Fractal Scaling of Soil Particle-Size Distributions: Analysis and Limitations. Soil Sci. Soc. America J. 56 (2), 362–369. doi:10.2136/sssaj1992.03615995005600020005x
Wang, S.-l., Lv, Q.-f., Baaj, H., Li, X.-y., and Zhao, Y.-x. (2016). Volume Change Behaviour and Microstructure of Stabilized Loess under Cyclic Freeze-Thaw Conditions. Can. J. Civ. Eng. 43 (10), 865–874. doi:10.1139/cjce-2016-0052
Wang, S., and Guo, Z. (2019). Random Heterogeneous Microstructure Construction of Composites via Fractal Geometry. Appl. Math. Mech.-Engl. Ed. 40 (10), 1413–1428. doi:10.1007/s10483-019-2522-5
Wang, S., Yang, P., Dai, D., Xue, K., and Li, D. (2020). A Study on Micro-pore Characteristics of Clay Due to Freeze-Thaw and Compression by Mercury Intrusion Porosimetry. Front. Earth Sci. 7 (344). doi:10.3389/feart.2019.00344
Wang, S., Yang, P., and Yang, Z. (2018). Characterization of Freeze-Thaw Effects within clay by 3D X-ray Computed Tomography. Cold Regions Sci. Techn. 148, 13–21. doi:10.1016/j.coldregions.2018.01.001
Wang, S., Yang, Z., and Yang, P. (2017). Structural Change and Volumetric Shrinkage of clay Due to Freeze-Thaw by 3D X-ray Computed Tomography. Cold Regions Sci. Techn. 138, 108–116. doi:10.1016/j.coldregions.2017.03.007
Washburn, E. W. (1921). Note on a Method of Determining the Distribution of Pore Sizes in a Porous Material. Proc. Natl. Acad. Sci. U.S.A. 7 (4), 115–116. doi:10.1073/pnas.7.4.115
Yamamoto, Y., and Springman, S. M. (2014). Axial Compression Stress Path Tests on Artificial Frozen Soil Samples in a Triaxial Device at Temperatures Just below 0 °C. Can. Geotech. J. 51 (10), 1178–1195. doi:10.1139/cgj-2013-0257
Yamamuro, J. A., and Wood, F. M. (2004). Effect of Depositional Method on the Undrained Behavior and Microstructure of Sand with silt. Soil Dyn. Earthquake Eng. 24 (9-10), 751–760. doi:10.1016/j.soildyn.2004.06.004
Yi, Y., Gu, L., and Liu, S. (2015). Microstructural and Mechanical Properties of marine Soft clay Stabilized by Lime-Activated Ground Granulated Blastfurnace Slag. Appl. Clay Sci. 103, 71–76. doi:10.1016/j.clay.2014.11.005
Zeng, Y., Payton, R. L., Gantzer, C. J., and Anderson, S. H. (1996). Fractal Dimension and Lacunarity of Bulk Density Determined with X‐ray Computed Tomography. Soil Sci. Soc. Am. J. 60 (6), 1718–1724. doi:10.2136/sssaj1996.03615995006000060016x
Zhang, H., Zhang, J., Zhang, Z., Chen, J., and You, Y. (2016). A Consolidation Model for Estimating the Settlement of Warm Permafrost. Comput. Geotechnics 76, 43–50. doi:10.1016/j.compgeo.2016.02.013
Zhang, Q., Yin, G., Fan, X., Wei, Z., Wang, W., and Nie, W. (2015). Loading Capacity and Deformation Characteristics of Tailings Based on a Fractal Geometrical Analysis of the Particle Microstructure. Minerals 5 (1), 86–103. doi:10.3390/min5010086
Zhang, S. G., and Zhang, X. D. (2006). “Dynamic Damage and Microscopic Analysis of Frozen Aeolian Soil in the West of Liaoning Province,” in Key Engineering Materials (Switzerland: Trans Tech Publications, Ltd.) 324–325, 751–754. doi:10.4028/www.scientific.net/kem.324-325.751
Zhao, H., Zhang, H., Li, H., Wang, F., and Zhang, M. (2017). Formation and Fractal Characteristics of Main Fracture Surface of Red sandstone under Restrictive Shear Creep. Int. J. Rock Mech. Mining Sci. 98, 181–190. doi:10.1016/j.ijrmms.2017.07.011
Zhou, J., and Tang, Y. (2015a). Artificial Ground Freezing of Fully Saturated Mucky clay: Thawing Problem by Centrifuge Modeling. Cold Regions Sci. Techn. 117, 1–11. doi:10.1016/j.coldregions.2015.04.005
Zhou, J., and Tang, Y. (2015b). Centrifuge Experimental Study of Thaw Settlement Characteristics of Mucky clay after Artificial Ground Freezing. Eng. Geology. 190, 98–108. doi:10.1016/j.enggeo.2015.03.002
Keywords: micro pore, mercury intrusion porosimetry, freeze-thaw, compression, clay
Citation: Wang S, Lv L, Xue K, Zhang D, Li M, Li D and Yuan C (2022) Micropore Structure and Fractal Characteristics of Clays Due to Freeze-Thaw and Compression Based on Mercury Intrusion Porosimetry. Front. Earth Sci. 10:851673. doi: 10.3389/feart.2022.851673
Received: 10 January 2022; Accepted: 18 March 2022;
Published: 08 April 2022.
Edited by:
Shibing Huang, Wuhan University of Science and Technology, ChinaReviewed by:
Dongdong Ma, Anhui University of Science and Technology, ChinaYanjun Shen, Xi’an University of Science and Technology, China
Copyright © 2022 Wang, Lv, Xue, Zhang, Li, Li and Yuan. This is an open-access article distributed under the terms of the Creative Commons Attribution License (CC BY). The use, distribution or reproduction in other forums is permitted, provided the original author(s) and the copyright owner(s) are credited and that the original publication in this journal is cited, in accordance with accepted academic practice. No use, distribution or reproduction is permitted which does not comply with these terms.
*Correspondence: Kaixi Xue, eGt4MTI1N0Bmb3htYWlsLmNvbQ==