 Hema Joshi
 Manish Naja1
 Tarun Gupta
- 1Aryabhatta Research Institute of Observational Sciences (ARIES), Nainital, India
- 2Department of Civil Engineering, Indian Institute of Technology, Kanpur, India
- 3Department of Physics and Astrophysics, University of Delhi, Delhi, India
- 4Space Physics Laboratory, Vikram Sarabhai Space Centre, Thiruvananthapuram, India
Continuous ground-based observations of aerosols over the Himalayan region are highly beneficial in studying aerosol trends over the complex geographic terrain. This study presents the results from continuous long-term observations (2004–2016) of aerosols over a high-altitude site in the central Himalayas – Nainital, quantifying multihued aspects of black carbon (BC) and columnar aerosol optical depth (AOD). The results reveal that BC and AOD have a positive trend of 23.04 ± 3.00 ng m−3 year−1 and 0.0076 ± 0.0003 year−1, respectively. Simultaneously, a positive trend of 0.0066 ± 0.0059 year−1 is observed in the Angstrom exponent, thus indicating an increase in anthropogenic aerosols. The satellite observations covering a broader region around Nainital also depicted increasing trends in AOD (0.0042–0.0074 year−1), absorbing aerosol optical depth (0.0001 ± 0.0001 year−1) and aerosol index (0.0131 ± 0.0019 year−1), along with a slight decline in single scattering albedo (−0.0004 year−1). These results suggest that aerosols of absorbing nature might have increased over this region in recent times. Investigation of the AOD ratio, obtained from aerosol vertical profiles, revealed an increasing trend in aerosol load below 1 km. The observed trends in aerosols are found to be associated with enhanced biomass burning activity, reflected in terms of the positive trend in fire count ∼38.65 ± 5.88 year−1 over the region.
1 Introduction
The Himalayan region comprises an important, diverse, and sensitive ecosystem, which is presently extremely vulnerable due to climate change. In this context, the impact of atmospheric aerosols on the Himalayan environment and climate is a global concern (Wester et al., 2019). The glaciers of the Hindu-Kush–Himalayan (HKH) region are the largest reservoir of freshwater supply to the millions of people living downstream (Molden et al., 2022); however, the accelerated retreating of glaciers (Singh and Kumar, 1997; Meier and Dyurgerov, 2002; Xu et al., 2016; Sharma et al., 2022) has a negative impact on this water supply (Barnett et al., 2005). This problem is further aggravated by an increase in regional warming as evidenced by an observed rise in the long-term near-surface air temperature over the region (Barnett et al., 2005; Garg et al., 2022). Recent studies have revealed the role of light-absorbing aerosols (LAA) in the observed warming (Ramanathan et al., 2007) and retreat of the glaciers in the HKH regions (Thompson et al., 2003; Barnett et al., 2005; Goes et al., 2005; Berthier et al., 2007; Ramanathan et al., 2007). The absorbing aerosols are also known to cause significant implications on snow albedo, regional hydroclimate, cloud properties, and monsoon circulation (Ackerman et al., 2000; Jacobson, 2004; Flanner et al., 2007; Flanner et al., 2009; Ming et al., 2008; Yasunari et al., 2010; Bollasina et al., 2011; Ming et al., 2012; Bond et al., 2013; Nair et al., 2013; Nair et al., 2013; Kaspari et al., 2014.; Vinoj et al., 2014; Yasunari et al., 2015; IPCC, 2021). In particular, black carbon (BC) is characterized by strong and wide absorption in the visible wavelength (Hansen et al., 1984), and its climatic impact has been well-recognized (Bond et al., 2013; Kang et al., 2020). The mass fraction of BC, although constitutes only a few percent (typically less than 10%) (Bond et al., 2013) of the atmospheric aerosols, is found to play a crucial role in the radiation budget and accelerated glacier retreats (Menon et al., 2010; Yasunari et al., 2010) over the Himalayan region. Interestingly, BC deposition has been reported to increase over the Himalayan region in recent times (Kaspari et al., 2011). The studies involving source-receptor modeling suggest that the BC deposits in the Himalayan regions originate from the highly polluted low-lying regions (Kopacz et al., 2011; Lu et al., 2012; Zhang et al., 2015) via free tropospheric transport or due to long-range transport.
To comprehensively evaluate the impact of aerosols and their sources in this region, long-term observations over distinct geographic locations of the Himalayas are extremely crucial. However, ground-based observations are very limited and scanty over the Himalayan region due to the topographic challenge and observational constraints. To fill this gap, model simulations have been used to study the aerosol sources and their transport processes over this region. Although these models provide important information on aerosol processes, yet they are shown to have significant limitations in simulating aerosol absorption over Asia (Myhre, 2013; Shindell et al., 2013), South Asia (Nair et al., 2012), and especially over the snow-covered regions of the Himalayan–Tibetan region (Qian et al., 2011; Sarangi et al., 2019). Several studies have reported an underestimation of aerosols by the chemistry transport model over the Indian region owing to an underestimation of aerosol emissions in the emission inventories (Moorthy et al., 2013). Specifically, large uncertainties in simulating BC mass concentration and its major sources are observed over the South Asian region (Lawrence and Lelieveld, 2010; Menon et al., 2010). The limited comparison of the measured BC over the Tibetan region (Qian et al., 2011), Kathmandu valley (Mues et al., 2018), Indian Himalayas (Bhardwaj et al., 2021), and Himalayan foothills location in the Indo-Gangetic Plain (IGP) region (Joshi et al., 2016) have shown that the models fail to simulate even the seasonal variation of BC over the HKH region. These significant differences have been mainly attributed to the uncertainties in the emissions, initial conditions of BC and meteorological parameters, limitations of the aerosol-chemistry scheme, coarse model resolutions, and other contributing factors. These studies thus emphasize the importance of long-term, ground-based aerosol observations in the Himalayan region.
In this context, continuous long-term (2004–2016) ground-based measurements of aerosols – BC and aerosol optical depth (AOD) – are made over a remote high-altitude site, Nainital (29.4o N, 79.5o E, 1958 m msl) in the central Himalayas. The present study utilizes these rigorous measurements simultaneously with satellite observations to understand the multihued aspects of aerosol emissions over this unique background location in the Himalayas. The decadal-scale continuous datasets are used as a primary dataset to study the inter-annual variability and long-term trends of BC and AOD. In addition, the regional picture of aerosol variation and their trends is presented at a larger domain by utilizing various satellite datasets. The aerosol vertical profiles are used to study aerosol contribution and trends within the boundary layer (below 1 km) and above 1 km. The observed aerosol abundance and their trends are then discussed against the backdrop of regional and local aerosol sources, seasonally changing air masses, and other possible contributing factors.
2 Observational Site, Instrument, and Database
2.1 Site Description and General Meteorology
Recognizing the importance of ground-based observations over the Himalayan region, the systematic and continuous observations of aerosols were initiated at the Aryabhatta Research Institute of Observational Sciences (ARIES), Nainital (29.4o N, 79.5o E, 1958 m msl) in the central Himalayas (Figure 1A). The observational site is located on a mountain top in the hilly terrain, surrounded by thick vegetation. The site is well below the snowline (Figure 1B); however, it receives occasional snowfall in winter. The high-altitude Himalayan Mountains are on the north and northeast side of the site, while on the south and southwest side, low elevated plain regions merge with the Indo-Gangetic Plain (IGP). The IGP region extends beyond the aerial distance of ∼20 km from the observational site toward the south and southwest of the site. The main town of Nainital is spread in an area of ∼11.73 km2 and is situated due north (∼2 km) of the present observation site.
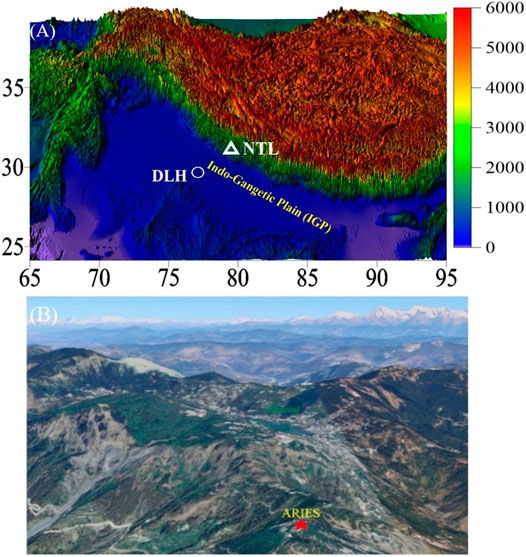
FIGURE 1. (A) Location of the observational site ARIES, Nainital (NTL: 29.4°N; 79.5°E; 1958 m msl) in the central Himalayas. The location of country capital Delhi (DLH) is also shown. The surface elevation above the mean sea level (meter) is shown in the color scale. The Indo-Gangetic Plain (IGP) region is also shown, (B) Zoomed topography of the observation site is shown where the high-altitude Himalayas and snowline can also be seen far away, towards the north of the site.
The surface observations of meteorological parameters were made at the site using the Automatic Weather Station (Campbell Scientific Inc., Canada, and Astra Scientific, India). The seasonal and annual variation of temperature and rainfall measurements at the site during the observation period is shown in Figure 2. Hourly data were used to calculate the monthly average temperature and total rainfall. The monthly mean temperature was maximum in May–June (30°C) and minimum during February (−1.5°C). There were few events of snowfall during December–February, which were not regular in all the years. High relative humidity was observed during monsoon (mid-Jun–Aug), while winter (Dec–Feb) usually remains dry. The site receives high rainfall (Figure 2) during July–September. Other details regarding the site and prevailing meteorological conditions have been reported earlier (Pant et al., 2006; Kumar et al., 2011; Naja et al., 2016).
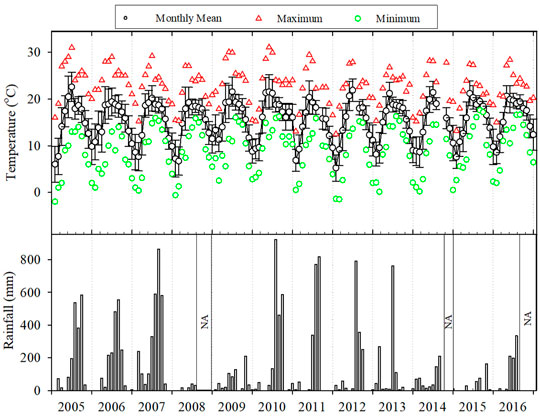
FIGURE 2. Seasonal variations in the mean temperature (°C), maximum temperature, minimum temperature, and total rainfall during the years 2005–2016 at the observational site, Nainital. Here, the hourly data are used for estimations of monthly mean temperature and total rainfall. The missing rainfall data are shown as not available (NA).
2.2 Methodology
2.2.1 Measurements of Black Carbon
Continuous measurements of black carbon (BC) mass concentrations were made using a seven-channel (370–950 nm) Aethalometer (Magee Scientific, United States). The instrument utilizes the optical measurement technique (Hansen et al., 1984) for BC measurements. In this instrument, ambient air is aspirated, which is then passed to the measurement chamber where the aerosol samples are collected onto a quartz filter paper. The optical attenuation is calculated by passing the light through the blank and the particle-laden quartz filter paper (Hansen et al., 1984). BC mass concentration data are obtained from the absorption coefficient values by utilizing the mass-specific absorption cross-section of 14625/λ (m2 g− 1) for the model of the Aethalometer used in the present study, where λ represents the wavelength (Hansen, 1996). The absorption measurements at 880 nm wavelength were used as a measure of BC in the atmosphere due to the relatively strong absorption at this wavelength compared to other species (Bodhaine, 1995) and have been used widely (Moorthy et al., 2004; Nair et al., 2007; Moorthy et al., 2009; Cheng et al., 2010; Gogoi et al., 2020). This method of BC measurement has shown agreement with other analytic techniques (Hansen et al., 1984). In our present study, the instrument was mostly set to a flow rate of 5 L per minute to aspirate the ambient air at a time resolution of 5 min. The data were then filtered and corrected for ambient temperature and pressure, as mentioned by Moorthy et al. (2004), Moorthy et al. (2007)). BC measurements from the Aethalometer were also corrected for multiple scattering in the quartz fiber matrix of the tape (also called C-factor) and another for ‘shadowing effects’, arising due to the deposition of scattering material along with BC in the filter tape, as mentioned by Weingartner et al. (2003). More details on the instrument and other technical details are the same as mentioned by Pant et al. (2006), Dumka et al. (2010), Joshi et al. (2016), Joshi et al. (2019). The sensitivity and accuracy of the Aethalometer, as reported by the manufacturer, were <100 ng m−3 and 5%, respectively (Hansen, 1996). The uncertainty in BC measurement has been reported to be 20% (Moorthy et al., 2007).
2.2.2 Measurement of Aerosol Optical Depth
Ground-based measurements of aerosol optical depth (AOD) were made using the handheld, multiband MICROTOPS-II (Solar Light Company, United States) sunphotometer. The instrument works on the principle of the Bouguer–Lambert–Beer law and provides AOD at five wavelengths: 380, 440, 500, 675, and 870 nm. MICROTOP is equipped with accurately aligned optical collimators, with a full field view of 2.5°. The instrument is also integrated with internal baffles, which eliminate internal reflections. The interference filters used in all channels, except 380 nm, have a peak wavelength precision of ±1.5 nm and a full width at half maximum (FWHM) band pass of 10 nm. The 380-nm channel has a wavelength precision of ±0.4 nm and FWHM band pass of 4 nm. The instrument was operated only when the region of sky (∼10°) around the Sun was free from clouds in order to avoid cloud contamination in the data (Pant et al., 2006). Following this, the data were collected for clear sky conditions at half-hourly intervals during the daytime, with a minimum of three consecutive observations at a time (within a short span <20 s). Out of these three successive observations, the one with minimum AOD (at 500 nm) has been used for further analysis since the minimum AOD corresponds to the maximum pointing accuracy (Morys et al., 2001; Porter et al., 2001; Ichoku, 2002).
2.2.3 Satellite-Based Observations
Supplementing the ground-based observations, we have also utilized the satellite-based observations in our study. Aerosol optical depth data from satellite-based observations of the Moderate Resolution Imaging Spectroradiometer (MODIS), on board Terra and Aqua, were used. The Dark Target Deep Blue Combined (DTB) products (Levy et al., 2013) of AOD at 550 nm from MODIS Terra (MOD) and MODIS Aqua (MYD) were used to investigate the AOD trend at a regional level (1° × 1°). Along with MODIS, AOD from the Multi-angle Imaging Spectro Radiometer (MISR) (Diner et al., 1998) aboard the Terra satellite was also used for trend estimates. The Ozone Monitoring Instrument (OMI) satellite (Torres et al., 2007) datasets were used to study the absorbing aerosols at a regional scale. The level 3 datasets of absorption AOD (AAOD) at 500 nm and UV Aerosol Index (AI) data at a spatial resolution of 1-degree were also used. The Single Scattering Albedo (SSA) data at 388 nm are studied using OMI level 3 data. Vertical profiles of aerosols were investigated utilizing Cloud-Aerosol Lidar and Infrared Pathfinder Satellite Observations (CALIPSO). The elastic backscatter observations from the satellite observations were utilized at 532 and 1,064 nm channels (Winker et al., 2009). Here, version-3, 5-km horizontal resolution data of the vertical profiles of aerosol extinction coefficients (532 nm) from CALIPSO were studied for the period 2006–2016.
2.2.4 Statistical Method of Trend Calculation
In our present study, we have estimated trends in BC and AOD following Weatherhead et al. (1998), where the annual values of the desired parameter were used. The yearly data (Yt) are modeled as follows:
where
where
where σN is the standard deviation of the noise and n is the total number of years.
The significance of the trend is then assured by considering the ratio |ω/σω|. The trend is considered significant at a 5% significance level or 95% confidence level when this ratio is above 2 (Tiao et al., 1990; Hsu et al., 2012).
3 Results and Discussion
3.1 Trends in Black Carbon Mass Concentration
The long-term (2004–2016) variation in BC at Nainital (as shown in Figure 3) showed large temporal variability in the hourly, daily, and monthly scales. The hourly values of BC varied as high as ∼9,235 ng m−3 during March–May (MAM), leading to corresponding very high daily mean BC as high as ∼6,540 ng m−3. On a monthly scale, BC showed a maximum of 1,548.2 ± 928.8 ng m−3 in May and a minimum of 483.7 ± 344.1 ng m−3 in August. The annual mean BC during the period under study was found to be 1,073 ± 933 ng m−3. Detailed statistics of the data are given in Table 1. Seasonally, the mean BC during the study period was found to be maximum in spring (March–May), with BC concentration of 1,404.0 ± 793.7 ng m−3, followed by winter (December–February) ∼1,220.8 ± 829.3 ng m−3 and autumn (September–November) ∼ 1,012.9 ± 613.9 ng m−3. BC concentration during summer–monsoon (June–August) was found to be a minimum of ∼660.3 ± 507.7 ng m−3 owing to scavenging caused by extensive rainfall (Figure 2). This reduction in BC due to the arrival of monsoon at the site was also reported by Dumka et al. (2010). Enhancement in BC is observed during spring season as a result of the strong thermal convections in spring, which results in uptake and transport of BC from IGP to the site (Joshi et al., 2016; Joshi et al., 2019). These high concentrations are also a result of transportation activities due to an increase in automobiles and biomass burning activities (Dumka et al., 2010; Kumar et al., 2011). BC observations at this site are reported to have well-defined diurnal variations with a single pronounced peak during late afternoon hours, which are closely associated with the atmospheric boundary layer dynamics (Dumka et al., 2010).
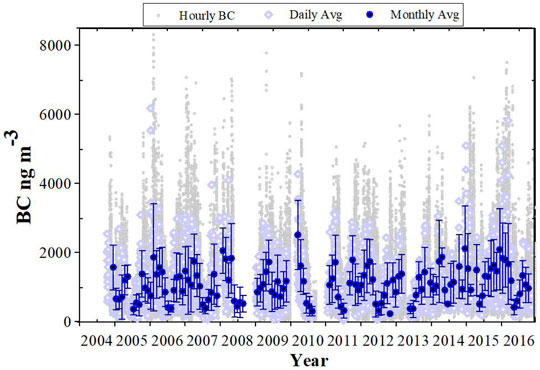
FIGURE 3. Long-term trend in the observed surface BC mass concentration from December 2004 to December 2016 at Nainital. Here, the temporal variations in the hourly (gray), daily (light blue), and monthly (filled circle in blue) average BC are shown.
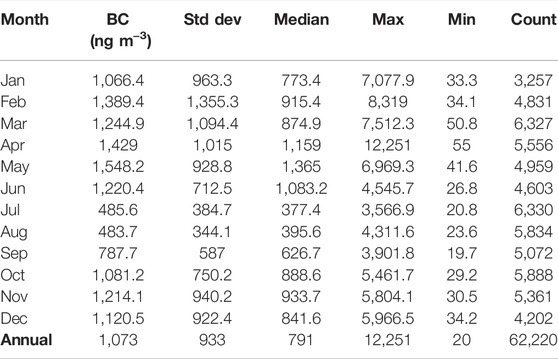
TABLE 1. Average monthly BC during 2004–2016. The standard deviation, median, maximum, minimum, and total count are also shown.
With a view to examine the long-term trend in BC at the present site, the annual mean BC at the site is considered. The annual BC at the site shows (Figure 4A) a positive trend of 23.04 ± 3.00 ng m−3 year−1 (relative to the base year 2005) at a 95% significant level. The detailed statistics of the estimated trend in BC are provided in Table 2. The percentage enhancement in BC is found to be 2.5% year−1 (of its value in the starting year 2005). Interestingly, a close examination of the annual values of BC indicates an insignificant positive trend during 2005–2013, as against a quite prominent increasing pattern after the year 2013. This is also clearly seen in the 365 days moving average of the daily mean BC data (Supplementary Figure S1). One possible reason for the change in the pace of BC in the most recent years, especially during 2014–2016, could be the reduced amount of rainfall (annual rainfall ∼565 mm) during this period (Figure 2). The amount of precipitation during the rest of the years (2005–2013), other than the year 2008, was significantly higher (annual rainfall ∼1787 mm). During the year 2008, the rainfall data were not sufficient due to data gap for any conclusion. The statistical association between BC and rainfall for the two distinct periods of ‘2005–2013’ and ‘2014–2016’ clearly shows the effect of rainfall on the observed variability of BC over the study location. The correlation coefficient (R) is relatively higher (R = 0.60) during 2005–2013 than that during 2014–2016 (R = 0.52). Since rain amount exhibits strong seasonality, the association is further examined on a seasonal basis for the full observation period (2005–2016), as shown in Supplementary Figure S2. A clear distinction in the seasonal distribution of BC and rainfall is seen during the 2014–2016 period from that of the previous years. This is very prominent during December–February (DJF) and June–September (JJAS). As can be seen from the figure, the site receives maximum rainfall during JJAS due to the arrival of the southwest monsoon, and during this period, a very good association of BC with rainfall (R ∼ 0.51; Figure S2e) is observed, which clearly indicates that rainfall is the major dominating removal process during this season. During DJF, even though the association between BC and rainfall is statistically not significant, the substantial increase in BC against the reduction in seasonal rainfall during 2015–2016 clearly highlights the role of rainfall on BC, which, in turn, affects the annual values of BC over the observational site. Apart from the inter-annual variability of rainfall, aerosol sources and transport play a dominating role in governing the seasonal variations in BC during spring. Thus, the aerosol sources, transport processes, and removal by rainfall altogether contribute to the observed annual variation in BC at the site.
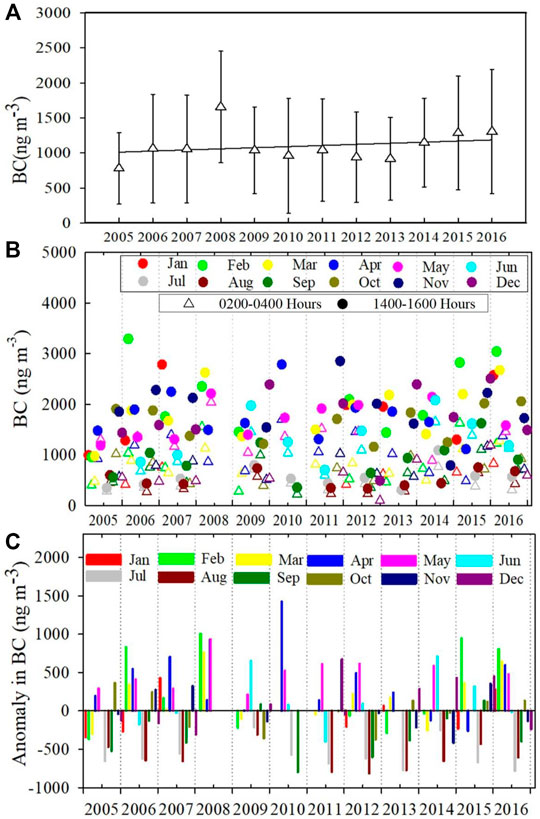
FIGURE 4. (A) Annual trend in BC during the years 2005–2016 along with the standard deviation (±1σ from the mean). (B) Seasonal variation in the monthly mean night-time (0,200–0,400 h) and day-time (1,400–1,600 h) BC. (C) Seasonal anomaly in monthly BC calculated for the years 2005–2016.

TABLE 2. Trend in observed black carbon during 2005–2016. The annual average value of BC and AOD are used for trend estimations. Trend in BC is shown in ng m−3 year−1, while for AOD and AE, the trend is shown in year−1. Trends in aerosol optical depth (AOD) at 500 nm and Angstrom exponent (AE) at 440–870 nm are also shown for the years 2006–2014. The details of the trend statistics are given in the table.
In order to assess the contribution of aerosol sources and transport to the observed BC trends, aerosols trends are examined further during day-time and night-time. For this, two distinct time segments (02:00–04:00 h and 14:00–16:00 h) on each of the days are studied, which are considered representatives of night-time low and day-time high BC (Dumka et al., 2010). The contribution from the local emission sources is also evident in the BC diurnal variations at the site. The local emission sources and the aerosols from the valley region get uplifted to the site during the daytime, while most of the aerosols get subsided in the valley region during the night. The temporal variations in day-time and night-time BC (Figure 4B) show large month-to-month variation. The daytime monthly mean BC during the study period was found to be ∼1,489.2 ± 703 ng m−3, while the mean night-time BC during the study period was found to be ∼786.7 ± 394.6 ng m−3. During spring, BC shows large enhancement both in day-time and night-time; thus, the difference in day-time and night-time BC is less, indicating the influence of regional BC emission sources. The difference in day-time and night-time BC is maximum in winter, indicating the strong influence of local sources during day-time and less BC during night-time. This difference is also very less during summer–monsoon due to the scavenging by rainfall, leading to a reduction in overall BC (both day-time and night-time). The estimation of day-time and night-time BC trends revealed a greater trend of 18.84 ± 10.45 ng m−3 year−1 during day-time, as compared to night-time ∼15.29 ± 4.86 ng m−3 year−1. This could be attributed to the fact that the present site receives significant amount of aerosols from the nearby valley regions and other foothill locations during the day-time when the mixing layer depth evolves to its maximum (Joshi et al., 2016). The larger trend in the day-time BC, thus, indicates an enhancement in the transported aerosols from the nearby valley regions along with local sources.
The local and regional effects of aerosol sources are also seen from the monthly (Figure 4C)/seasonal (Figure 5) anomaly in BC, which provides insights into monthly/seasonal changes in aerosol sources from year to year during the study period. The variation in monthly/seasonal anomaly in BC reveals a positive anomaly in BC mostly during March–May (spring), along with mixed behavior during autumn/winter, while mostly negative anomaly was found during the summer–monsoon. This clearly indicates the influence of the seasonal cycle on the observed BC levels from year to year at the site. It is noted that the inter-annual anomaly in BC in winter plays an important role in determining the annual trend in BC during the study period. The positive anomaly in BC is consistent during 2014–2016 (expect that in spring –2014). These seasonal anomalies and their change from year to year are found to contribute to the annual anomaly in BC, as shown in Figure 5E. The observed annual anomaly in BC, thus, explains the observed almost stable trend in BC till the year 2013, while enhancement in years afterward is observed. The seasonal aerosol sources, their transport and seasonally changing air-masses play an important role in governing this observed variation in a seasonal anomaly in BC, which then explains the observed nature of the trend.
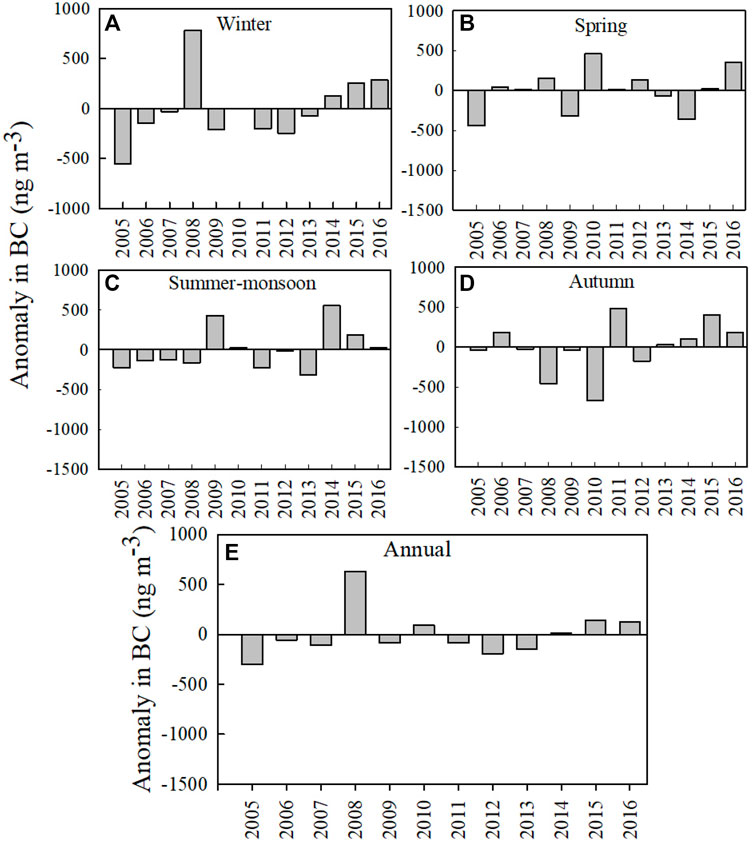
FIGURE 5. Seasonal anomaly in BC calculated from the (A) seasonal mean BC for winter (DJF), (B) spring (MAM), (C) summer–monsoon (JJA), and (D) autumn (SON). (E) Seasonal anomaly in BC is also calculated from the annual mean BC for the years 2005–2016.
We now compare the observed trend in BC at the present site with the reported trends in BC over other Indian locations. There are very few reported studies over the Indian region on the long-term trend using ground-based BC observations. Manoj et al. (2019) have reported the long-term trend in BC over the southernmost semi-urban coastal site, Trivandrum, with a decreasing trend of −75 ± 21 ng m−3 year−1 for the year 2000–2016. The BC trend over the later period 2007–2015 was also reported over the peninsular Indian region, where the trend was again found to be decreasing at a rate of −70 ± 31 ng m−3 year−1. The observed trend in BC over the present site is quite different from that reported over Trivandrum and the peninsular Indian region. Here, it is important to note that BC trends over the urban/semi-urban coastal locations in southern India can be quite different, as compared to the high-altitude locations over northern India, which are in close proximity to the highly polluted IGP region. Interestingly, the BC trend over the urban location, Varanasi, over the central IGP has been reported to show an increasing trend in BC (Srivastava et al., 2019).
The observed rise in BC at the present site is in accordance with the reported enhancement in BC deposition over the Himalayan region in recent times (Kaspari et al., 2011) and the IGP region (Srivastava et al., 2019). It is quite possible that the amount of absorbing aerosols reaching the high-altitude site of the Himalayas might have increased in recent times due to the enhanced anthropogenic sources of aerosols and their transport. In this context, several studies have also reported the transport of BC from the polluted regions to the Himalayan environment (Bonasoni et al., 2010; Decesari et al., 2010; Kopacz et al., 2011; Marinoni et al., 2010; Marinoni et al., 2013). The anthropogenic emissions of BC originating from the Indian plain region were also reported to affect the Himalayan region (Ohara et al., 2007). In a recent study by Ramachandran et al. (2020a), it was reported that BC aerosols were found to dominate the aerosol absorption (≥75%) over the IGP and the Himalayan foothill region based on AERONET data. The atmospheric mixing of BC can further enhance BC absorption, leading to higher mass absorption cross-sections for mixed BC than pure BC (Soni and Gupta, 2022). A significant influence of emissions from IGP to the nearby Himalayas was also reported by Santra et al. (2019) based on a simulation study (using GCM) in which, they reported a decrease in BC distribution due to these emissions toward 30°N at higher altitudes in the Himalayan region, while significant contribution over part of the Himalayan region due south of 30°N was observed. In addition to the effect of long-range transport of aerosols, the increasing BC concentrations, especially in recent years, could be attributed to the variation in local aerosol sources, being modulated by the local meteorological conditions at the site.
3.2 Trends in Aerosol Optical Depth
The variation in columnar abundance of aerosols provides crucial information regarding the total aerosol abundance over the region. Here, the hourly AOD values at 500 nm are used to calculate the daily and monthly mean AOD for the years 2005–2014, as shown in Figure 6A. The variations in daily mean AOD values during the observation period are found to vary from 0.02 to 0.82, while monthly mean AOD varies from 0.19 to 0.52. The seasonal values of AOD show a sharp enhancement in spring (March–May) and lower values in winter (December–February). This is also apparent from the seasonal variation in AOD calculated using 30 and 365 days moving average, as shown in Supplementary Figure S3. The multi-wavelength data of AOD were also used to examine the ‘Angstrom exponent’ (AE), a measure of aerosol size. The least-square fitting method, as mentioned by Ångström, (1964), was used to determine the AE at 440–870 nm. The average AE value during the study period was found to be ∼0.68. The monthly mean AE also shows (Figure 6A) clear seasonal variation from year to year.
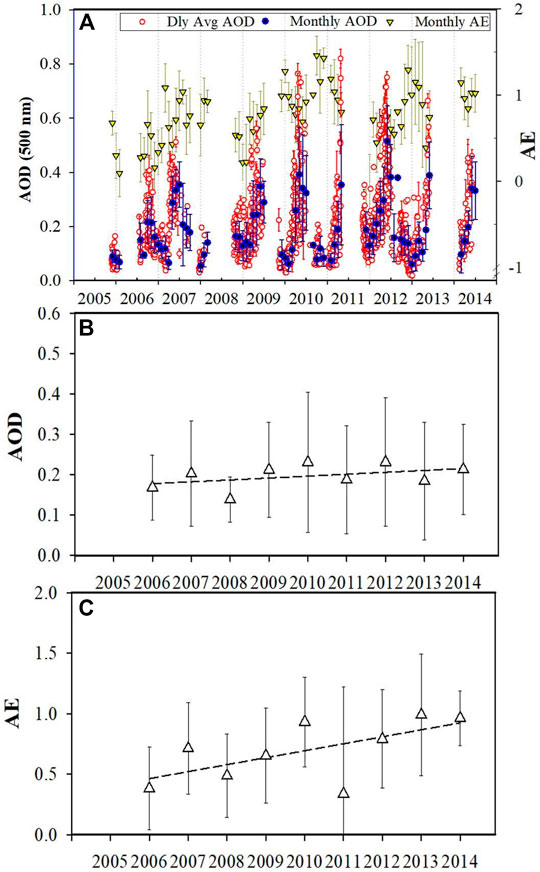
FIGURE 6. (A) Seasonal variation in daily and monthly mean aerosol optical depth (AOD) at 500 nm wavelength and aerosol Angstrom exponent (AE) at 440–870 nm from ground-based data at Nainital during the years 2005–2014. (B) Annual trend in AOD at 500 nm during the years 2006–2014. (C) Annual trend in (AE) at 440–870 nm during the years 2006–2014.
The annual mean AOD and AE are then used to calculate the trend in AOD and AE at the site during 2006–2014. The analysis of annual mean AOD at 500 nm, as shown in Figure 6B, revealed a positive trend of 0.0076 ± 0.0003 year−1 at a 95% significance level. The detailed statistics of the estimated trend are mentioned in Table 2. The annual mean AE (440–870 nm) shown in Figure 6C also shows an increasing trend of ∼0.0066 ± 0.0059 year−1 at a 95% significance level. The positive trend in the AE indicates the enhancement of the fine mode of aerosols, which might be contributed as a result of increased anthropogenic activities over the region in recent times.
The observed AOD trend at Nainital is discussed in the context of the reported AOD trends from the ground-based observations over few other Indian sites. Moorthy et al. (2013) have utilized AOD data from various ground-based networks of observatories (Aerosol Radiative Forcing over India Network, ARFINET) over the Indian region and found that the AOD over this region has increased at a rate of 2.3% (of its value in 1985) per year. This reported rate of increase was found to be more rapid, ∼4%, in the later decade (Moorthy et al., 2013). The major factor of this enhancement was reported to be of anthropogenic origin. The AOD trends were reported at several Indian locations by Babu et al. (2013) which are compared here with the observed AOD trend at the present site as mentioned in Table 3. The reported trends are categorized as island/coastal sites and urban and rural sites and then compared. The observed trend at Nainital (∼0.0076 year−1) is lower than that observed at the other sites mentioned in Table 3. The observed trend in AOD at Port Blair in the Bay of Bengal is ∼0.0097 year−1 from its initial value of 0.29 in the year 2002. The observed annual mean at Nainital (0.149) is also lower than the reported value of 0.29 at Port Blair. The reported AOD trends at another island location, Minicoy, in the Indian Ocean, were seen slightly higher (observed trend in AOD at Minicoy is 0.0208 year−1 from its initial value of 0.22 in the year 2005) than at the present site. The reported AOD trend at other coastal sites, Trivandrum (semi-urban) and industrialized coastal location, Visakhapatnam, was reported to be ∼0.011 year−1 and ∼0.0266 year−1, respectively. AOD trends at a rural location, Dibrugarh, in Northeast India, were also higher (∼0.0135 year−1) than what is observed at the present site. The mean annual AOD observed at Dibrugarh was also quite high (0.3) as compared to that of Nainital (0.14). It is quite evident from the above mentioned comparison that the observational period for which the comparison is made and the base value of AOD against which the trends are estimated need to be carefully assessed before making any comparison in AOD trends with the other sites.
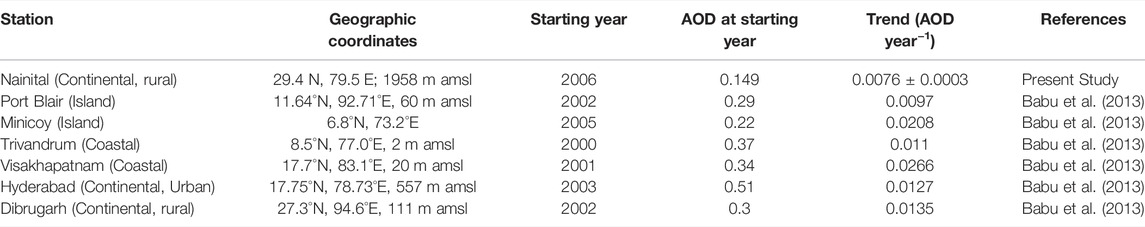
TABLE 3. Comparison of the AOD trend observed at Nainital site with the reported trends over other Indian sites.
Aerosol trends were also reported over several Indian cities by Ramachandran et al. (2012), utilizing satellite observations of the aerosols using the MODIS data. In their study, aerosol trends were found to be different on the spatial and seasonal scale over the Indian region where most of the sites showed positive trends, while some of them also showed negative trends in AOD. Enhancement in aerosol loading was also reported in a few Indian cities, Hyderabad, Bengaluru (due to increased anthropogenic activities and urbanization), and Jaipur, where the increase in aerosol loading was reported to be as high as ∼40%. Aerosol trends were also reported at an IGP location, Kanpur, in a recent study by Ramachandran et al. (2020b), where an overall increasing trend of 0.0082 year−1 has been reported during the years 2002–2017 using AERONET data. The AOD trend of Kanpur was reported to be 0.0049 year−1 using MODIS Terra Combined Dark target and Deep Blue product and 0.0022 year−1 using MODIS Terra Deep Blue product during the same period. The reported trends in AOD using these two satellite datasets over the wider region of IGP (23°N-33°N, 70°E-90°E) were, however, reported to be lower than those at Kanpur with trend values of 0.002 year−1 and 0.0004 year−1, respectively, (from the aforesaid datasets) during the same period (Ramachandran et al., 2020b). An increase in aerosol trends was also reported for the IGP region by Jethva et al. (2019) during winter ∼0.0168 and post-monsoon ∼0.0187, associated with an increase in the agricultural fires along with the fossil fuel emissions.
3.3 Aerosol Trends Over Larger Spatial Scale: Satellite Datasets
3.3.1 Satellite Observations of Aerosol Optical Depth, Aerosol Index, Absorption Aerosol Optical Depth, and Single Scattering Albedo
With an aim to study AOD trends over a larger spatial domain surrounding the present site and extract valuable information regarding the enhancement in the anthropogenic emissions near the foothill regions, we have investigated regional AOD trends using satellite data sets. We have used spatial datasets from satellites over a 1-degree region centered at the present site. This study domain, thus, includes both the Himalayan sites (with less emissions) and some of the adjacent semi-urban sites in foothills regions in the IGP (with fresh emission sources). Here, we have used level-3 data products from MODIS Terra and MODIS Aqua for estimating annual trends in AOD. The long-term variation in regionally averaged AOD (at 550 nm) obtained from MODIS Terra and MODIS Aqua is shown in Figures 7A and B, respectively, which clearly show the inter-annual variations. The observed trend in MODIS Terra and MODIS Aqua shows an increase of 0.0063 ± 0.0004 year−1 and 0.0074 ± 0.0005 year−1, respectively, both of which show close resemblance in the observed trends. These regional trends in AOD, as mentioned in Table 4, clearly show a significant positive trend, indicating an increase in the total columnar abundance of aerosols over this region in the recent times. The AOD trend was also examined from MISR data, which also shows a positive trend 0.0042 ± 0.0005 year−1 (Figure 7C). Here, it is important to mention that the MISR data contain very less data points (maximum numbers of days for which data were available per year was 80 days out of 365 days), which could lead some uncertainty in estimating the trend from MISR data. Overall, the observed positive trends in AOD in this present study using ground data and satellite data are in agreement with the reported positive AOD trends from the satellite data of MODIS, MISR, and AERONET over the South Asian/Indian region (Moorthy et al., 2013; Li et al., 2014; Zhao et al., 2017; Ramachandran et al., 2020b).
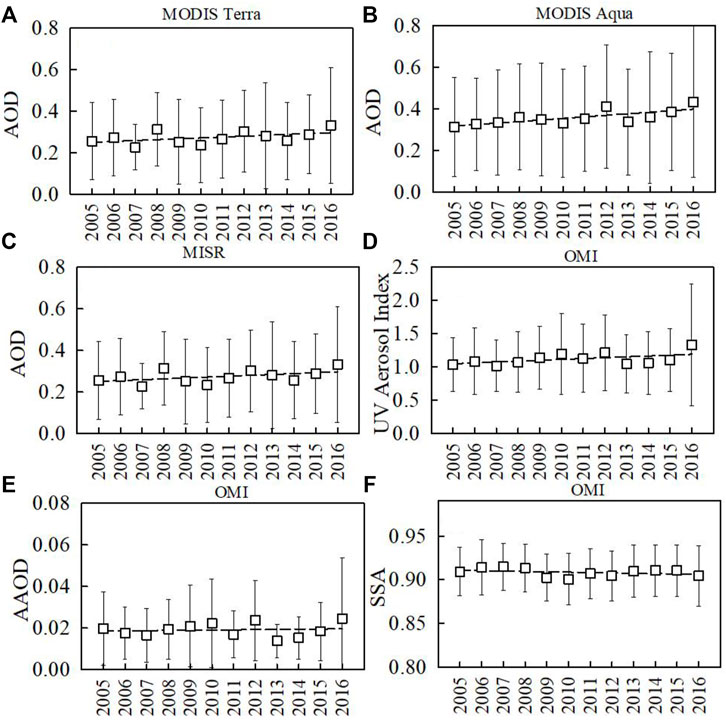
FIGURE 7. Regional picture of aerosol trends over a 1 × 1° grid region, including both the Himalayan site and its adjacent foothill regions for the years 2004–2016. Trend in AOD obtained from (A) MODIS terra at 550 nm, (B) MODIS Aqua at 550 nm, and (C) MISR at 555 nm. Trends in (D) UV Aerosol Index, (E) AAOD at 500 nm, and (F) Single Scattering Albedo (SSA) at 388 nm obtained from OMI data are also shown.
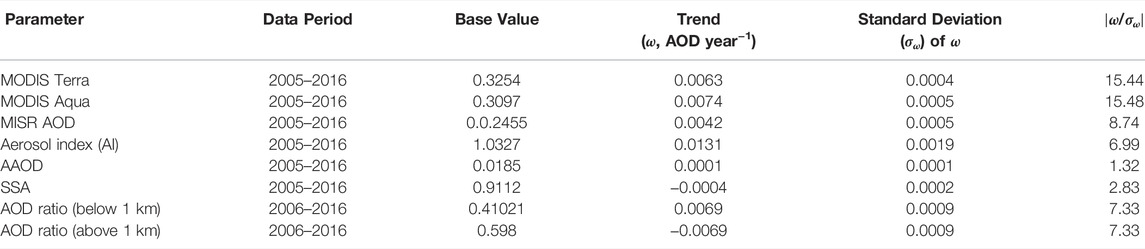
TABLE 4. Regional estimations of trends over the 1-degree grid box surrounding the present observational site, using satellite datasets for the years 2005–2016. Here, AOD observations from MODIS Aqua, MODIS Terra, and MISR are used. In addition, OMI datasets are used for AAOD and Aerosol Index and Single Scattering Albedo (SSA). CALIPSO datasets are used to calculate AOD ratios over the study domain. The data statistics of the estimated trends are also given.
The absorbing aerosols are then studied utilizing OMI level-3 datasets. The UV aerosol index is mainly known to detect the presence of UV absorbing aerosols (soot and dust). It is based on the spectral contrast method in the UV region and is calculated as the difference between the observations and model calculations of absorbing and non-absorbing spectral radiance ratios. The daily data are used to calculate the annual mean AI and AAOD, the variation of which is shown in Figures 7D and E, respectively. AI and AAOD both show a positive trend of 0.0131 ± 0.0019 year−1 and 0.0001 ± 0.0001 year−1, respectively (Table 4). This positive increase in both of these parameters confirms the regional increase in absorbing aerosols over the study domain. In addition, the SSA variation at 388 nm obtained from OMI level 3 data is also examined over the study domain and is shown in Figure 7F. The SSA is a measure of the absorption capacity of aerosols, which is related to the aerosol composition. The observed trend in SSA in our present study is found to be decreasing at a rate of −0.0004 ± 0.0002 year−1 (Table 4), which indicates the possibility that the absorbing aerosols might have increased over the region in recent times. The increase in both AAOD and AI and a simultaneous decrease in SSA are indicative of the increase in abundance of absorbing aerosols over this region.
3.3.2 Trends Using Vertical Datasets of Aerosols
Here, an attempt has been made to understand the influence of aerosols near the source regions, which are located in the foothills of the Himalayas (in IGP). The origin of major sources of aerosols is located in the adjacent foothills region due south of the present site, Nainital, which have contributions from many small-scale industries of automobiles, food and agricultural products, a paper manufacturing unit, and a small airport (Joshi et al., 2016). On the other hand, the Himalayan sites are not home to such industrial activities and do not have any major sources of aerosols. An investigation of aerosol trends over the source regions might strengthen our understanding and help us establish an association between the observed increasing trends over the Himalayan site (Nainital) to that near-source region (in foothills). Since the ground-based long-term datasets of aerosols were not available from the foothill region, we have used the satellite datasets for this study. The information regarding the aerosol source regions, which are mostly scattered in nature in the foothill’s location in the IGP regions, can be better represented by the larger spatial coverage of satellite datasets rather than point observation. As discussed earlier, the major sources of aerosols are located in the low-altitude regions (<500 m above sea level) in the foothills, as in our present case; therefore, we have made an assumption here that all the major and direct sources of aerosols are contributed within 1 km altitude. These aerosols near source regions are also indicative of anthropogenic sources due to contributions from industrial and other anthropogenic activities. Thus, the aerosol trends below 1 km altitude (as most of the aerosol sources are located in low-altitude plain regions) will be representative of aerosol sources over this region. In addition, if we assume the average mixing layer height to be ∼1 km, then these aerosols will also represent aerosols within the boundary layer, which are directly influenced by the aerosol emissions and might represent the anthropogenic influence.
We have used the vertical variations of aerosols from CALIPSO for this purpose. The vertical profile data of aerosols have been investigated for trends in AOD and AOD ratio (as mentioned in Eq. 4). The AOD ratio was also calculated near the source region (below 1 km) as follows:
Due to the limited repetition cycle of the satellite (as mentioned earlier), not enough data points were available for our study region of a 1-degree grid box that includes both Himalayan and foothill locations. The data collected in this region were not sufficient to capture aerosol seasonality and also have many missing data, especially in monsoon months. So, the study domain was extended to a 2-degree grid box in order to capture the complete seasonality in aerosol profiles. The seasonal variations in AOD from aerosol profiles above 1 km and below 1 km are studied for the years 2006–2016. The aerosols are seen to be mostly confined within the boundary layer, particularly in winter, while they are found to be above the boundary layer in spring. The annual and inter-annual variation in seasonal mean AOD is shown in Figure 8A.
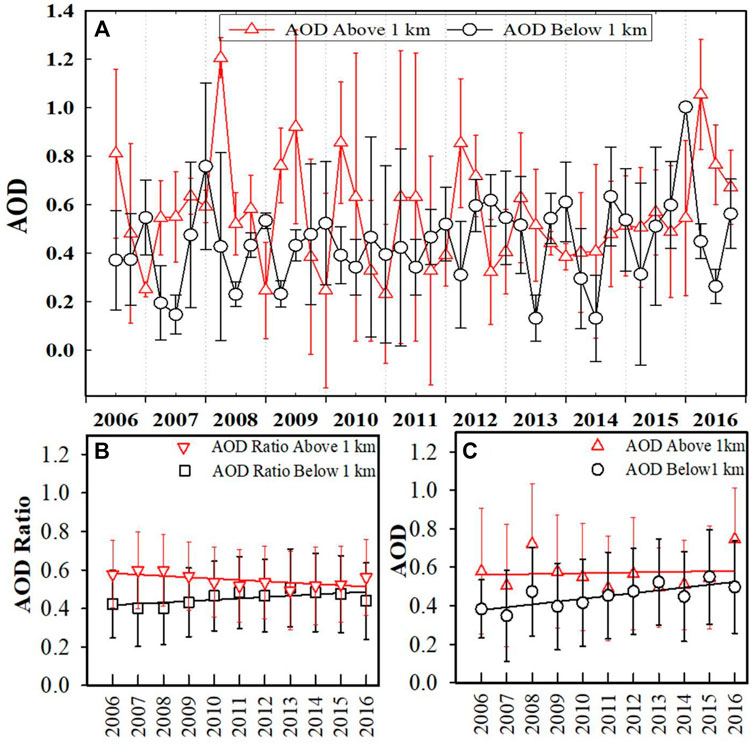
FIGURE 8. (A) Seasonal variation of the aerosol optical depth (AOD) ratio as mentioned in Eq. 4 during the period 2006–2016 for spring (March–April–May), summer–monsoon (June–July–August), autumn (September–October–November), and winter (December–January–February). (B) Trend in the annual mean AOD ratio above and below 1 km. (C) Trend in AOD above and below 1 km is also shown. The error bars shown here represent standard deviation. The Cloud-Aerosol Lidar and Infrared Pathfinder Satellite Observations (CALIPSO)–derived aerosol extinction profile has been used for AOD estimations at a 2-degree grid region around the observational site Nainital.
The observed seasonality in the AOD ratio both below 1 km and above 1 km is also shown in Figure 8A. It is observed that both AOD ratio below 1 km and AOD ratio above 1 km show significant seasonality over this region. The trends in the AOD ratio below 1 km (Figure 8B) are found to show an increasing trend of 0.0069 ± 0.0009 year−1 as against the decreasing trend in the AOD ratio above 1 km. As shown in Figure 8C, AOD below and above 1 km altitude also shows different patterns of aerosol loading over the years. During 2006–2009, the AOD above 1 km altitude shows an increasing trend, similar to the pattern of AOD below 1 km. However, AOD above 1 km almost stabilizes with a slightly decreasing trend during 2010–2015, while those below 1 km keep showing an increasing trend. This finally results in a nearly stabilized pattern of AOD beyond 2010. The trend in the overall AOD below 1 km region is found to be 0.0147 ± 0.0004 year−1. Thus, the observed variability in the pattern of columnar AOD and AI from that of the near-surface BC could be attributed to inter-annual variations in the upper-level transport of aerosols from the surrounding arid regions in the west and polluted regions of the IGP. The enhancement in AOD below the 1-km range might be due to an increase in aerosol sources in the foothill region, possibly due to increase in population density and industrial activities, thus more anthropogenic influence. The enhancement in the anthropogenic aerosol emissions over the IGP region during the last decade was also mentioned by Ramachandran et al. (2020b), in which it was highlighted that the increase/decrease in the anthropogenic aerosol emissions was mainly responsible for the seasonal trends, while no change was reported in natural aerosols over the region.
In order to understand and explain the role of aerosol vertical distribution to the observed trends of aerosol loading over the study region, we have explored the vertical profiles of the aerosol extinction coefficient at 532 nm (km−1), as shown in Supplementary Figure S4. Here, we have shown the representative profile of January and May averaged for year 2010–2011 representing winter and spring season. The aerosol extinction coefficient profile shows a high value of the aerosol extinction coefficient near ground in winter, which reduces with altitude, while in spring, the extinction coefficient is less near ground, but the build-up of aerosols is seen over the higher altitudes. This clearly explains the seasonality in observed difference in the surface variation and columnar abundance of aerosols over the region.
In addition, we have studied the role of seasonally changing air masses in the observed aerosol loading over the region, for which, we have also simulated 5-day back-air trajectories over the Nainital site at 500 n AGL and 3,000 m AGL during spring (MAM) and June–September (JJAS), as shown in Figure S5 and S6. These trajectories are calculated using NCEP/NCAR data at 2.5° × 2.5° resolution using Hybrid Single-Particle Lagrangian Integrated Trajectory (HYSPLIT; Draxler and Rolph, 2003) trajectories for MAM and JJAS for representative years 2007, 2008, 2011, 2013, and 2015. The trajectories calculated at 500 m AGL in spring shows that the air masses mostly circulate over the site and IGP region before reaching the site. The major pathways of air masses and their percentage contributions are also shown in Figures S5 and Figure S6. The air masses typically arrive from the northwestern region before reaching the site. However, there are significant inter-annual variations in air-mass pathways found in both spring and summer at 500 m AGL and 3,000 m AGL. The air-mass trajectories in MAM at both levels mostly traverse the northwestern part of India before arriving at the observational site. However, the numbers of trajectories in each of the clusters vary from year to year. For example, there is significant advection at the upper level from the Western peninsula, which then passes over the IGP during MAM-2015, while no such observation was seen in the other years. Similarly, at 500-m AGL, trajectory clusters in 2007, 2008, and 2011 are different from those of the years 2013 and 2015. Similarly, during JJAS, there are significant inter-annual variations in the air mass trajectories in both 500 and 3,000 m AGL. In addition, the different pathways of the back-air trajectories at 500 m AGL and 3,000 m AGL in different seasons might cause different variation in the vertical distribution of aerosols, causing different trends by AOD below and above 1 km. The variation in air-mass pathways is an important factor in modulating the transported aerosol components to the observational site, resulting in heterogeneous columnar distribution and their annual variability over the years.
We have also studied the role of biomass burning activities, which emit significant amount of aerosols at a regional scale over this region. The association of biomass burning activity is also investigated in the observed trends of aerosols over this region. MODIS Fire data (both Terra and Aqua) available at 1-km resolution are used for our study domain. In this study, fire data from MODIS (both Terra and Aqua) available at 1-km resolution with detection confidence greater than 80% were used in order to reject any false detection of fire. The annual mean fire count during the observational period over the study domain of 1-degree is shown in Figure 9A. It is observed that the fire count in the region of 1 by 1° shows a positive trend of ∼2.52 ± 0.71 year−1. The variation in the fire radiative power (FRP) expressed in Mega-Watts/km2 (MW/km2) (Kaufman et al., 1998), which is known to provide information on measured radiant heat output of fires, also showed a slightly positive trend (Figure 9B). Here, it is worthwhile to mention that fire activity is a large-scale phenomenon that also affects the adjacent regions. We have, therefore, examined fire counts over the 2-degree region, as shown in Figure 9C. The analysis reveals more active fires expressed in terms of fire counts over this larger spatial scale. The annual trend in fire count over this region is found to be more than 38.65 ± 5.88 year−1. The observed trend in fire count also supports the increasing trend observed in BC and AOD over the study region. This rapid increase in fire count trend indicates that the biomass burning activity in the adjacent regions has increased in recent times, which might be one of the possible causes of enhanced aerosol loading over this region and adjacent locations.
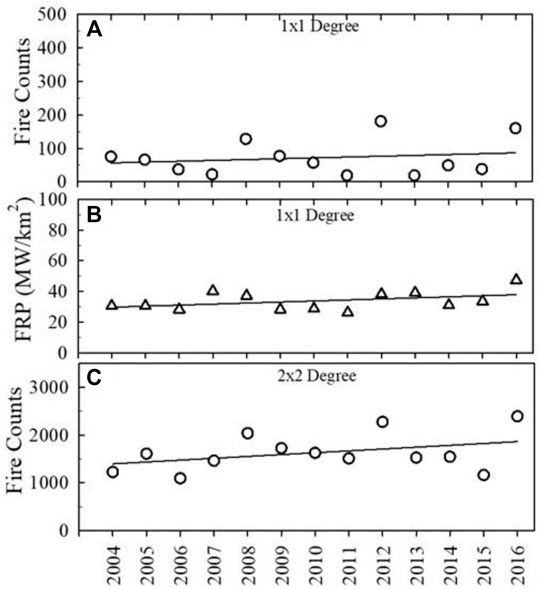
FIGURE 9. Variation in (A) MODIS fire count over 1×1 degree grid box region centred at the observational site Nainital (B) Variation in the Fire Radiative Power (FRP). (C) Trend in fire count over 2×2 degree region is also shown.
In addition to BC and absorbing aerosol, brown carbon (BrC) is also co-emitted during biomass burning activities. The increase in biomass burning activity over this region also indicates a possibility of an increase in brown carbon over this region. The biomass burning activity (which include residential cooking and heating, forest fires, agricultural fires, and industrial use of biomass fuel), fossil fuel combustion (mainly including industrial activities and emission from transport), and dust episodes are the main regional sources of aerosols over this region (Hegde et al., 2007; Kumar et al., 2011), while the local sources of aerosols mainly include use of biomass/biofuel (Srivastava and Naja, 2020) and vehicular emissions due to tourist activities. The drastic enhancement in the number of tourists observed in this region (Supplementary Figure S7) might also have contributed in the form of vehicular emissions on a local scale. In addition, the columnar abundance of aerosols is also affected by the inter-annual variations in the upper-level transport of aerosols from the surrounding arid regions in the west and polluted regions of the IGP. The aged transported aerosols might also be subjected to hygroscopic growth at the upper level, contributing to the increase in the aerosol loading over the region.
4 Summary and Conclusion
The long-term trends of black carbon (BC) and aerosol optical depth (AOD) were estimated using ground-based observations over the central Himalayan region for the first time. Aerosol trends were also investigated using satellite datasets at a larger domain for a regional picture of aerosol trends. The vertical variations of aerosols were also utilized to study aerosol contribution from the foothill regions. The important findings of this present study are mentioned as follows:
1) The long-term data of black carbon over the central Himalayan site, Nainital, were found to show a positive trend of ∼23.04 ± 3.00 ng m−3 year−1, indicating an enhancement in BC over this site.
2) The columnar loading of aerosols was also found to show an increasing trend of ∼0.0076 ± 0.0003 year−1 at Nainital. An increasing trend was also observed in the Angstrom exponent, indicating an enhancement of fine-mode aerosols and anthropogenic influence over this site.
3) The long-term trends in the aerosols near source regions in the foothill locations were also studied, which showed an increasing trend in AOD within 1 km.
4) The increasing contribution of aerosols from the source regions in the foothill locations is clearly evident in terms of trends in the AOD ratio below 1 km, which showed an increasing trend of 0.0069 ± 0.0009 year−1, indicating a clear contribution from the fresh emissions possibly of anthropogenic origin to the total columnar abundance.
5) The regional scenario of the aerosol loading and absorbing aerosols over the region encompassing the Himalayan site and the foothill region also showed enhancement in recent times. The absorbing aerosol optical depth and aerosol index showed an increasing trend. The single-scattering albedo showed a slightly decreasing trend, confirming the overall increase in the absorbing aerosols over this region.
6) The fire count data showed an increasing trend of 38.65 ± 5.88 year−1, indicating that the region has witnessed an enhancement in biomass burning activity in the recent times, which supports the observed trend in BC and AOD at Nainital and regional trends over the region.
7) A similar trend analysis should be made in impact-based studies. This study also urges the need for ground-based measurements of vertical distribution of absorbing aerosols and aerosol composition over the complex Himalayan region and the foothill region in order to accurately assess the impact of aerosols over the region.
Data Availability Statement
The raw data supporting the conclusions of this article will be made available by the authors upon reasonable request.
Author Contributions
HJ has made observations, data acquisition, analysis, interpretation of data, and written the original manuscript. MN and MG have reviewed, edited, and helped with the interpretation of data. All other authors have made contributions in editing and reviewing of this manuscript.
Conflict of Interest
The authors declare that the research was conducted in the absence of any commercial or financial relationships that could be construed as a potential conflict of interest.
Publisher’s Note
All claims expressed in this article are solely those of the authors and do not necessarily represent those of their affiliated organizations, or those of the publisher, the editors, and the reviewers. Any product that may be evaluated in this article, or claim that may be made by its manufacturer, is not guaranteed or endorsed by the publisher.
Acknowledgments
This work was carried out as part of the Aerosol Radiative Forcing over India (ARFI) project of Indian Space Research Organization’s Geosphere Biosphere Programme (ISRO-GBP). We greatly acknowledge the support received from K. Krishnamoorthy, ISRO. We also thank Director, ARIES, for supporting us to carrying out the measurements during the study period. Author HJ acknowledges the database help from Prashant Hegde, and U. C. Dumka. Author HJ highly acknowledges Liji M. David for scientific discussions during manuscript preparation, and Manoj M. R. The help received from the technical staff team in the lab is acknowledged. CALIPSO datasets were obtained from the NASA Langley Research Center Atmospheric Science Data Center. The MODIS, MISR and OMI science team is highly acknowledged for providing the datasets. Fire data was obtained from LANCE /FIRMS website. NOAA, HYSPLIT model was used for calculation of air mass trajectories using NCEP/NCAR Reanalysis data. The tourist data was available from Uttarakhand Tourism Development Board. We are also thankful to the editor and reviewers for their suggestions and constructive comments.
Supplementary Material
The Supplementary Material for this article can be found online at: https://www.frontiersin.org/articles/10.3389/feart.2022.851444/full#supplementary-material
References
Ackerman, A. S., Toon, O. B., Stevens, D. E., Heymsfield, A. J., Ramanathan, V., and Welton, E. J. (2000). Reduction of Tropical Cloudiness by Soot. Science 288, 1042–1047. doi:10.1126/science.288.5468.1042
Ångström, A. (1964). The Parameters of Atmospheric Turbidity. Tellus 16, 64–75. doi:10.1111/j.2153-3490.1964.tb00144.x
Babu, S. S., Manoj, M. R., Moorthy, K. K., Gogoi, M. M., Nair, V. S., Kompalli, S. K., et al. (2013). Trends in Aerosol Optical Depth over Indian Region: Potential Causes and Impact Indicators. J. Geophys. Res. Atmos. 11811, 794806–794811. doi:10.1002/2013JD020507
Barnett, T. P., Adam, J. C., and Lettenmaier, D. P. (2005). Potential Impacts of a Warming Climate on Water Availability in Snow-Dominated Regions. Nature 438, 303–309. doi:10.1038/nature04141
Berthier, E., Arnaud, Y., Rajesh, K., Sarfaraz, A., Wagnon, P., and Chevallier, P. (2007). Remote Sensing Estimates of Glacier Mass Balances in the Himachal Pradesh (Western Himalalya, India). Remote Sens. Env. 108 3, 327–338. doi:10.1016/j.rse.2006.11.017
Bhardwaj, P., Kumar, R., and Seddon, J. (2021). Interstate Transport of Carbon Monoxide and Black Carbon Over India. Atmos. Environ. 251, 118268. doi:10.1016/j.atmosenv.2021.118268
Bodhaine, B. A. (1995). Aerosol Absorption Measurements at Barrow, Mauna Loa and the South Pole. J. Geophys. Res. 100 (D5), 8967–8975. doi:10.1029/95JD00513
Bollasina, M. A., Ming, Y., and Ramaswamy, V. V. (2011). Anthropogenic Aerosols and the Weakening of the South Asian Summer Monsoon. Science 334, 502–505. doi:10.1126/science.1204994
Bonasoni, P., Laj, P., Marinoni, A., Sprenger, M., Angelini, F., Arduini, J., et al. (2010). Atmospheric Brown Clouds in the Himalayas: First Two Years of Continuous Observations at the Nepal Climate Observatory-Pyramid (5079 M). Atmos. Chem. Phys. 10 (15), 7515–7531. doi:10.5194/acp-10-7515-2010
Bond, T. C., Doherty, S. J., Fahey, D. W., Forster, P. M., Berntsen, T., DeAngelo, B. J., et al. (2013). Bounding the Role of Black Carbon in the Climate System: A Scientific Assessment. J. Geophys. Res. Atmos. 118, 5380–5552. doi:10.1002/jgrd.50171
Cheng, T. T., Han, Z. W., Zhang, R. J., Du, H. H., Jia, X. A., Wang, J. J., et al. (2010). Black Carbon in a Continental Semi–arid Area of Northeast China and its Possible Sources of Fire Emission. J. Geophys. Res. Atmos. 115, D23204. doi:10.1029/2009jd013523
Decesari, S., Facchini, M. C., Carbone, C., Giulianelli, L., Rinaldi, M., Finessi, E., et al. (2010). Chemical Composition of PM10 and PM1 at the High-Altitude Himalayan Station Nepal Climate Observatory-Pyramid (NCO-P) (5079 m a.s.l.). Atmos. Chem. Phys. 10, 4583–4596. doi:10.5194/acp-10-4583-2010
Diner, D. J., Beckert, J. C., Reilly, T. H., Bruegge, C. J., Conel, J. E., Kahn, R. A., et al. (1998). Multi-Angle Imaging SpectroRadiometer (MISR) Instrument Description and Experiment Overview. IEEE Trans. Geosci. Remote Sens. 36 (4), 1072–1087. doi:10.1109/36.700992
Draxler, R. R., and Rolph, G. D. (2003). Real Time Environmental Applications and Display System (READY). Silver Spring, MD: NOAA Air Resources Laboratory.
Dumka, U. C., Moorthy, K. K., Kumar, R., Hegde, P., Sagar, R., Pant, P., et al. (2010). Characteristics of Aerosol Black Carbon Mass Concentration over a High Altitude Location in the Central Himalayas from Multi-Year Measurements. Atmos. Res. 96, 510–521. doi:10.1016/j.atmosres.2009.12.010
Flanner, M. G., Zender, C. S., Hess, P. G., Mahowald, N. M., Painter, T. H., Ramanathan, V., et al. (2009). Springtime Warming and Reduced Snow Cover from Carbonaceous Particles. Atmos. Chem. Phys. 9, 2481–2497. doi:10.5194/acp-9-2481-2009
Flanner, M. G., Zender, C. S., Randerson, J. T., and Rasch, P. J. (2007). Present-day Climate Forcing and Response from Black Carbon in Snow. J. Geophys. Res. 112, D11202. doi:10.1029/2006JD008003
Garg, P. K., Shukla, A., Yousuf, B., and Garg, S. (2022). Temperature and Precipitation Changes over the Glaciated Parts of Indian Himalayan Region during 1901-2016. Environ. Monit. Assess. 194 (2), 84–27. doi:10.1007/s10661-021-09689-5
Goes, J. I., Thoppil, P. G., Gomes, H. d. R., and Fasullo, J. T. (2005). Warming of the Eurasian Landmass Is Making the Arabian Sea More Productive. Science 308, 545–547. doi:10.1126/science.1106610
Gogoi, M. M., Jayachandran, V. N., Vaishya, A., Babu, S. N. S., Satheesh, S. K., and Moorthy, K. K. (2020). Airborne In Situ Measurements of Aerosol Size Distributions and Black Carbon across the Indo-Gangetic Plain during SWAAMI-RAWEX. Atmos. Chem. Phys. 20, 8593–8610. doi:10.5194/acp-20-8593-2020
Hansen, A. D. A. (1996). Magee Scientific Aethalometer User's Guide. Berkeley, Calif: Magee Sci. Company, 56.
Hansen, A. D. A., Rosen, H., and Novakov, T. (1984). The Aethalometer - an Instrument for the Real-Time Measurement of Optical Absorption by Aerosol Particles. Sci. Total Environ. 36, 191–196. doi:10.1016/0048-9697(84)90265-1
Hegde, P., Pant, P., Naja, M., Dumka, U. C., and Sagar, R. (2007). South Asian Dust Episode in June 2006: Aerosol Observations in the Central Himalayas. Geophys. Res. Lett. 34, a–n. doi:10.1029/2007GL030692
Hsu, N. C., Gautam, R., Sayer, A. M., Bettenhausen, C., Li, C., Jeong, M. J., et al. (2012). Global and Regional Trends of Aerosol Optical Depth over Land and Ocean Using SeaWiFS Measurements from 1997 to 2010. Atmos. Chem. Phys. 12 (8), 8037–8053. doi:10.5194/acp-12-8037-2012
Ichoku, C. (2002). Analysis of the Performance Characteristics of the Five-Channel Microtops II Sun Photometer for Measuring Aerosol Optical Thickness and Precipitable Water Vapor. J. Geophys. Res. 107, D13. doi:10.1029/2001JD001302
IPCC (2021). “Climate Change 2021: The Physical Science Basis. Contribution of Working Group I to the Sixth Assessment Report of the Intergovernmental Panel on Climate Change,”. Editors A. Zhai, S. L. Pirani, C. Connors, S. Péan, N. Berger, Y. Caudet al. (Cambridge University Press). In Press.
Jacobson, M. Z. (2004). Climate Response of Fossil Fuel and Biofuel Soot, Accounting for Soot's Feedback to Snow and Sea Ice Albedo and Emissivity. J. Geophys. Res. 109, a–n. doi:10.1029/2004JD004945
Jethva, H., Torres, O., Field, R. D., Lyapustin, A., Gautam, R., and Kayetha, V. (2019). Connecting Crop Productivity, Residue Fires, and Air Quality over Northern India. Sci. Rep. 9, 16594. doi:10.1038/s41598-019-52799-x
Joshi, H., Naja, M., David, L. M., Gupta, T., Gogoi, M. M., and Babu, S. S. (2020). Absorption Characteristics of Aerosols over the Central Himalayas and its Adjacent Foothills. Atmos. Res. 233, 104718. ISSN 0169-8095. doi:10.1016/j.atmosres.2019.104718
Joshi, H., Naja, M., Singh, K. P., Kumar, R., Bhardwaj, P., Babu, S. S., et al. (2016). Investigations of Aerosol Black Carbon from a Semi-Urban Site in the Indo-Gangetic Plain Region. Atmos. Environ. 125, 346–359. doi:10.1016/j.atmosenv.2015.04.007
Kang, S., Zhang, Y., Qian, Y., and Wang, H. (2020). A Review of Black Carbon in Snow and Ice and its Impact on the Cryosphere. Earth-Science Rev. 210, 103346. doi:10.1016/j.earscirev.2020.103346
Kaspari, S. D., Schwikowski, M., Gysel, M., Flanner, M. G., Kang, S., Hou, S., et al. (2011). Recent Increase in Black Carbon Concentrations from a Mt. Everest Ice Core Spanning 1860-2000 AD. Geophys. Res. Lett. 38, a–n. doi:10.1029/2010GL046096
Kaspari, S., Painter, T. H., Gysel, M., Skiles, S. M., and Schwikowski, M. (2014). Seasonal and Elevational Variations of Black Carbon and Dust in Snow and Ice in the Solu-Khumbu, Nepal and Estimated Radiative Forcings. Atmos. Chem. Phys. 14, 8089–8103. doi:10.5194/acp-14-8089-2014
Kaufman, Y. J., Justice, C. O., Flynn, L. P., Kendall, J. D., Prins, E. M., Giglio, L., et al. (1998). Potential Global Fire Monitoring from EOS-MODIS. J. Geophys. Res. 103, 32215–32238. doi:10.1029/98JD01644
Kopacz, M., Mauzerall, D. L., Wang, J., Leibensperger, E. M., Henze, D. K., and Singh, K. (2011). Origin and Radiative Forcing of Black Carbon Transported to the Himalayas and Tibetan Plateau. Atmos. Chem. Phys. 11, 2837–2852. doi:10.5194/acp-11-2837-2011
Krishna Moorthy, K., Suresh Babu, S., Manoj, M. R., and Satheesh, S. K. (2013). Buildup of Aerosols over the Indian Region. Geophys. Res. Lett. 40, 1011–1014. doi:10.1002/grl.50165
Kumar, R., Naja, M., Satheesh, S. K., Ojha, N., Joshi, H., Sarangi, T., et al. (2011). Influences of the Springtime Northern Indian Biomass Burning over the Central Himalayas. J. Geophys. Res. 116, D19302. doi:10.1029/2010JD015509
Lawrence, M. G., and Lelieveld, J. (2010). Atmospheric Pollutant Outflow from Southern Asia: a Review. Atmos. Chem. Phys. 10, 11017–11096. doi:10.5194/acp-10-11017-2010
Levy, R. C., Mattoo, S., Munchak, L. A., Remer, L. A., Sayer, A. M., Patadia, F., et al. (2013). The Collection 6 MODIS Aerosol Products over Land and Ocean. Atmos. Meas. Tech. 6, 2989–3034. doi:10.5194/amt-6-2989-2013
Li, J., Carlson, B. E., Dubovik, O., and Lacis, A. A. (2014). Recent Trends in Aerosol Optical Properties Derived from AERONET Measurements. Atmos. Chem. Phys. 14 (22), 12271–12289. doi:10.5194/acp-14-12271-2014
Lu, Z., Streets, D. G., Zhang, Q., and Wang, S. (2012). A Novel Back-Trajectory Analysis of the Origin of Black Carbon Transported to the Himalayas and Tibetan Plateau during 1996-2010. Geophys. Res. Lett. 39, L01809. doi:10.1029/2011gl049903
Manoj, M. R., Satheesh, S. K., Moorthy, K. K., Gogoi, M. M., and Babu, S. S. (2019). Decreasing Trend in Black Carbon Aerosols over the Indian Region. Geophys. Res. Lett. 46, 2903–2910. doi:10.1029/2018GL081666
Marinoni, A., Cristofanelli, P., Laj, P., Duchi, R., Calzolari, F., Decesari, S., et al. (2010). Aerosol Mass and Black Carbon Concentrations, a Two Year Record at NCO-P (5079 M, Southern Himalayas). Atmos. Chem. Phys. 10, 8551–8562. doi:10.5194/acp-10-8551-2010
Marinoni, A., Cristofanelli, P., Laj, P., Duchi, R., Putero, D., Calzolari, F., et al. (2013). High Black Carbon and Ozone Concentrations during Pollution Transport in the Himalayas: Five Years of Continuous Observations at NCO-P Global GAW Station. J. Environ. Sci. 25, 1618–1625. doi:10.1016/s1001-0742(12)60242-3
Meier, M. F., and Dyurgerov, M. B. (2002). How Alaska Affects the World. Science 297, 350–351. doi:10.1126/science.1073591
Menon, S., Koch, D., Beig, G., Sahu, S., Fasullo, J., and Orlikowski, D. (2010). Black Carbon Aerosols and the Third Polar Ice Cap. Atmos. Chem. Phys. 10, 4559–4571. doi:10.5194/acp-10-4559-2010
Ming, J., Cachier, H., Xiao, C., Qin, D., Kang, S., Hou, S., et al. (2008). Black Carbon Record Based on a Shallow Himalayan Ice Core and its Climatic Implications. Atmos. Chem. Phys. 8, 1343–1352. doi:10.5194/acp-8-1343-2008
Ming, J., Du, Z., Xiao, C., Xu, X., and Zhang, D. (2012). Darkening of the Mid-himalaya Glaciers since 2000 and the Potential Causes. Environ. Res. Lett. 7, 014021. doi:10.1088/1748-9326/7/1/014021
Molden, D. J., Shrestha, A. B., Immerzeel, W. W., Maharjan, A., Rasul, G., Wester, P., et al. (2022). “The Great Glacier and Snow-Dependent Rivers of Asia and Climate Change: Heading for Troubled Waters,” in Water Security under Climate Change (Singapore: Springer), 223–250. doi:10.1007/978-981-16-5493-0_12
Moorthy, K. K., Babu, S. S., and Satheesh, S. K. (2009). Climate Implications of Atmospheric Aerosols and Trace Gases: Indian Scenario. UK: Climate Sense. Published by WMO (ISBN: 978-92-63-11043-5). Tudor Rose.
Moorthy, K. K., Babu, S. S., and Satheesh, S. K. (2007). Temporal Heterogeneity in Aerosol Characteristics and the Resulting Radiative Impact at a Tropical Coastal Station-Part 1: Microphysical and Optical Properties. Ann. Geophys. 25, 2293–2308. doi:10.5194/angeo-25-2293-2007
Moorthy, K. K., Babu, S. S., Sunilkumar, S. V., Gupta, P. K., and Gera, B. S. (2004). Altitude Profiles of Aerosol BC, Derived from Aircraft Measurements over an Inland Urban Location in India. Geophys. Res. Lett. 31, L22103. doi:10.1029/2004GL021336
Morys, M., Mims, F. M., Hagerup, S., Anderson, S. E., Backer, A., Kia, J., et al. (2001). Design, Calibration and Performance of Microtops II Hand-Held Ozone Monitor and Sun Photometer. J. Geophys. Res. 10614, 573582–573614. doi:10.1029/2001jd900103
Mues, A., Lauer, A., Lupascu, A., Rupakheti, M., Kuik, F., and Lawrence, M. G. (2018). WRF and WRF-Chem v3.5.1 Simulations of Meteorology and Black Carbon Concentrations in the Kathmandu Valley. Geosci. Model Dev. 11 (6), 2067–2091. doi:10.5194/gmd-11-2067-2018
Myhre, G., Samset, B. H., Schulz, M., Balkanski, Y., Bauer, S., Berntsen, T. K., et al. (2013). Radiative Forcing of the Direct Aerosol Effect from AeroCom Phase II Simulations. Atmos. Chem. Phys. 13, 1853–1877. doi:10.5194/acp-13-1853-2013
Nair, V. S., Babu, S. S., Moorthy, K. K., Sharma, A. K., Marinoni, A., and Ajai, (2013). Black Carbon Aerosols over the Himalayas: Direct and Surface Albedo Forcing. Tellus B Chem. Phys. Meteorology 65, 19738. doi:10.3402/tellusb.v65i0.19738
Nair, V. S., Moorthy, K. K., Alappattu, D. P., Kunhikrishnan, P. K., George, S., Nair, P. R., et al. (2007). Wintertime Aerosol Characteristics Over the Indo-Gangetic Plain (IGP): Impacts of local Boundary Layer Processes and Long-Range Transport. J. Geophys. Res. 112, D13205. doi:10.1029/2006JD008099
Nair, V. S., Solmon, F., Giorgi, F., Mariotti, L., Babu, S. S., and Moorthy, K. K. (2012). Simulation of South Asian Aerosols for Regional Climate Studies. J. Geophys. Res. 117, a–n. doi:10.1029/2011JD016711
Naja, M., Bhardwaj, P., Singh, N., Kumar, P., Kumar, R., Ojha, N., et al. (2016). High-Frequency Vertical Profiling of Meteorological Parameters Using AMF1 Facility during RAWEX-GVAX at ARIES, Nainital. Nainital, Curr.Sci. 111 (1), 132–140. doi:10.18520/cs/v111/i1/132-140
Ohara, T., Akimoto, H., Kurokawa, J., Horii, N., Yamaji, K., Yan, X., et al. (2007). An Asian Emission Inventory of Anthropogenic Emission Sources for the Period 1980-2020. Atmos. Chem. Phys. 7, 4419–4444. doi:10.5194/acp-7-4419-2007
Pant, P., Hegde, P., Dumka, U. C., Sagar, R., Satheesh, S. K., Moorthy, K. K., et al. (2006). Aerosol Characteristics at a High-Altitude Location in Central Himalayas: Optical Properties and Radiative Forcing. J. Geophys. Res. 111, D17206. doi:10.1029/2005JD006768
Porter, J. N., Miller, M., Pietras, C., and Motell, C. (2001). Ship-Based Sun Photometer Measurements Using Microtops Sun Photometers. J. Atmos. Ocean. Technol. 18 (5), 765–774. doi:10.1175/1520-0426(2001)018<0765:sbspmu>2.0.co;2
Qian, Y., Flanner, M. G., Leung, L. R., and Wang, W. (2011). Sensitivity Studies on the Impacts of Tibetan Plateau Snowpack Pollution on the Asian Hydrological Cycle and Monsoon Climate. Atmos. Chem. Phys. 11, 1929–1948. doi:10.5194/acp-11-1929-2011
Ramachandran, S., Kedia, S., and Srivastava, R. (2012). Aerosol Optical Depth Trends over Different Regions of India. Atmos. Environ. 49, 338–347. doi:10.1016/j.atmosenv.2011.11.017
Ramachandran, S., Rupakheti, M., and Lawrence, M. G. (2020b). Aerosol-induced Atmospheric Heating Rate Decreases over South and East Asia as a Result of Changing Content and Composition. Sci. Rep. 10, 20091. doi:10.1038/s41598-020-76936-z
Ramachandran, S., Rupakheti, M., and LawrenceLawrence, M. G. M. G. (2020a). Black Carbon Dominates the Aerosol Absorption over the Indo-Gangetic Plain and the Himalayan Foothills. Environ. Int. 142, 105814. doi:10.1016/j.envint.2020.105814
Ramanathan, V., Ramana, M. V., Roberts, G., Kim, D., Corrigan, C., Chung, C., et al. (2007). Warming Trends in Asia Amplified by Brown Cloud Solar Absorption. Nature 448, 575–578. doi:10.1038/nature06019
Santra, S., Verma, S., Fujita, K., Chakraborty, I., Boucher, O., Takemura, T., et al. (2019). Simulations of Black Carbon (BC) Aerosol Impact over Hindu Kush Himalayan Sites: Validation, Sources, and Implications on Glacier Runoff. Atmos. Chem. Phys. 19, 2441–2460. doi:10.5194/acp-19-2441-2019
Sarangi, C., Qian, Y., Rittger, K., Bormann, K. J., Liu, Y., Wang, H., et al. (2019). Impact of Light-Absorbing Particles on Snow Albedo Darkening and Associated Radiative Forcing over High-Mountain Asia: High-Resolution WRF-Chem Modeling and New Satellite Observations. Atmos. Chem. Phys. 19, 7105–7128. doi:10.5194/acp-19-7105-2019
Sharma, R. K., Kumar, R., Pradhan, P., and Sharma, A. (2022). Climate-Induced Glacier Retreats and Associated Hazards: Need for Robust Glaciers and Glacial Lake Management Policy in Sikkim Himalaya, India. Clim. Change, 161–182. doi:10.1007/978-3-030-92782-0_8
Shindell, D. T., Lamarque, J.-F., Schulz, M., Flanner, M., Jiao, C., Chin, M., et al. (2013). Radiative Forcing in the ACCMIP Historical and Future Climate Simulations. Atmos. Chem. Phys. 13, 2939–2974. doi:10.5194/acp-13-2939-2013
Singh, P., and Kumar, N. (1997). Impact Assessment of Climate Change on the Hydrological Response of a Snow and Glacier Melt Runoff Dominated Himalayan River. J. Hydrology 193, 316–350. doi:10.1016/s0022-1694(96)03142-3
Soni, A., and Gupta, T. (2022). Alternative Approach for the In Situ Measurement of Absorption Enhancement of Atmospheric Black Carbon Due to Atmospheric Mixing. ACS Earth Space Chem. 6 (2), 261–267. doi:10.1021/acsearthspacechem.1c00362
Srivastava, P., and Naja, M. (2020). Characteristics of Carbonaceous Aerosols Derived from Long-Term High-Resolution Measurements at a High-Altitude Site in the Central Himalayas: Radiative Forcing Estimates and Role of Meteorology and Biomass Burning. Environ. Sci. Pollut. Res. 28 (12), 14654–14670. doi:10.1007/s11356-020-11579-1
Srivastava, S., Kumar, M., Kumar, M., Singh, R. S., Rai, B. N., Mall, R. K., et al. (2019). Long-term Observation of Black Carbon Aerosols at an Urban Location over the Central Indo-Gangetic Plain, South Asia. Atmósfera 32 (2), 95–113. doi:10.20937/atm.2019.32.02.02
Thompson, L. G., Mosley-Thompson, E., Davis, M. E., Lin, P.-N., Henderson, K., and Mashiotta, T. A. (2003). Tropical Glacier and Ice Core Evidence of Climate Change on Annual to Millennial Time Scales. Clim. Change 59, 137–155. doi:10.1007/978-94-015-1252-7_8
Tiao, G. C., Reinsel, G. C., Xu, D., Pedrick, J. H., Zhu, X., Miller, A. J., et al. (1990). Effects of Autocorrelation and Temporal Sampling Schemes on Estimates of Trend and Spatial Correlation. J. Geophys. Res. 95, 20507–20517. doi:10.1029/jd095id12p20507
Torres, O., Tanskanen, A., Veihelmann, B., Ahn, C., Braak, R., Bhartia, P. K., et al. (2007). Aerosols and Surface UV Products from Ozone Monitoring Instrument Observations: An Overview. J. Geophys. Res. 112, D24S47. doi:10.1029/2007JD008809
Vinoj, V., Rasch, P. J., Wang, H., Yoon, J.-H., Ma, P.-L., Landu, K., et al. (2014). Short-term Modulation of Indian Summer Monsoon Rainfall by West Asian Dust. Nat. Geosci. 7, 308–313. doi:10.1038/ngeo2107
Weatherhead, E. C., Reinsel, G. C., and Tiao, G. C. (1998). Factors Affecting the Detection of Trends: Statistical Considerations and Applications to Environmental Data. J. Geophys. Res. 103 (17), 149–217. doi:10.1029/98jd00995
Weingartner, E., Saathoff, H., Schnaiter, M., Streit, N., Bitnar, B., and Baltensperger, U. (2003). Absorption of Light by Soot Particles: Determination of the Absorption Coefficient by Means of Aethalometers. J. Aerosol Sci. 34 (10), 1445–1463. doi:10.1016/S0021-8502(03)00359-8
Wester, P., Mishra, A., Mukherji, A., and Shrestha, A. B. (2019). The Hindu Kush Himalaya Assessment: Mountains, Climate Change, Sustainability and People. Switzerland AG, Cham: Springer Nature, 627.
Winker, D. M., Vaughan, M. A., Omar, A., Hu, Y., Powell, K. A., Liu, Z., et al. (2009). Overview of the CALIPSO Mission and CALIOP Data Processing Algorithms. J. Atmos. Ocean. Tech. 26, 2310–2323. doi:10.1175/2009JTECHA1281.1
Xu, Y., Ramanathan, V., and Washington, W. M. (2016). Observed High-Altitude Warming and Snow Cover Retreat over Tibet and the Himalayas Enhanced by Black Carbon Aerosols. Atmos. Chem. Phys. 16 (3), 1303–1315. doi:10.5194/acp-16-1303-2016
Yasunari, T. J., Bonasoni, P., Laj, P., Fujita, K., Vuillermoz, E., Marinoni, A., et al. (2010). Estimated Impact of Black Carbon Deposition during Pre-Monsoon Season from Nepal Climate Observatory - Pyramid Data and Snow Albedo Changes Over Himalayan Glaciers. Atmos. Chem. Phys. 10, 6603–6615. doi:10.5194/acp-10-6603-2010
Yasunari, T. J., Koster, R. D., Lau, W. K. M., and Kim, K. M. (2015). Impact of Snow Darkening via Dust, Black Carbon, and Organic Carbon on Boreal Spring Climate in the Earth System. J. Geophys. Res. Atmos. 120, 5485–5503. doi:10.1002/2014jd022977
Zhang, R., Wang, H., Qian, Y., Rasch, P. J., Easter, R. C., Ma, P.-L., et al. (2015). Quantifying Sources, Transport, Deposition, and Radiative Forcing of Black Carbon over the Himalayas and Tibetan Plateau. Atmos. Chem. Phys. 15, 6205–6223. doi:10.5194/acp-15-6205-2015
Keywords: black carbon, aerosol optical depth, trends, carbonaceous aerosols, Himalayas, biomass burning
Citation: Joshi H, Naja M, Srivastava P, Gupta T, Gogoi MM and Suresh Babu S (2022) Long-Term Trends in Black Carbon and Aerosol Optical Depth Over the Central Himalayas: Potential Causes and Implications. Front. Earth Sci. 10:851444. doi: 10.3389/feart.2022.851444
Received: 09 January 2022; Accepted: 06 May 2022;
Published: 21 June 2022.
Edited by:
Sachchidanand Singh, National Physical Laboratory (CSIR), IndiaReviewed by:
Ashok Kumar Jaswal, India Meteorological Department, IndiaStefano Decesari, National Research Council (CNR), Italy
Copyright © 2022 Joshi, Naja, Srivastava, Gupta, Gogoi and Suresh Babu. This is an open-access article distributed under the terms of the Creative Commons Attribution License (CC BY). The use, distribution or reproduction in other forums is permitted, provided the original author(s) and the copyright owner(s) are credited and that the original publication in this journal is cited, in accordance with accepted academic practice. No use, distribution or reproduction is permitted which does not comply with these terms.
*Correspondence: Hema Joshi, aGVtYWpvc2hpMTExQGdtYWlsLmNvbQ==