 Haoshuang Niu
 Xiaolin Weng*
- Key Laboratory for Special Area Highway Engineering of Ministry of Education, Chang’an University, Xi’an, China
In order to study the variation law of support pressure and instability mode of excavation face under different soil parameters, a complete set of centrifugal model seepage test device is independently developed. The results of centrifugal tests with different C/D (where C is the overburden thickness of the tunnel and D is the tunnel diameter), internal friction angles, and heights of water head show that with the increase of the retreating displacement S of the excavation surface, the support pressure P of the excavation surface can be divided into three stages: rapid decline (S < 1.5D%), slow rebound after reaching the limit support pressure Plim (1.5D% ≤ S ≤ 3D%), and gradually reaching the stable value (3D% < S). With the increase of C/D, the limit support pressure on the excavation face gradually increases and tends to be stable. For different soil properties, when C/D > 1.5, the limit support pressure on the excavation face tends to be stable. With the increase of internal friction angle, the limit support pressure decreases gradually, and its influence on support pressure can be ignored when φ > 40°. With the increase of height of water head Hw, the limit support pressure increases linearly. By establishing a numerical analysis model and analyzing the instability modes of soil under different C/D, internal friction angles, and cohesion, the instability mode of soil in front of the excavation face can have a great correlation with C/D of the soil and internal friction angle, while the influence of cohesion is minimal. With the increase of C/D, the soil changes from overall failure to local failure, the change of C/D mainly affects the height of soil arching effect and the width of the wedge below, while the internal friction angle mainly affects the width of the wedge and the instability angle of soil.
Introduction
How to reasonably develop and utilize underground space has become an important step in the process of modern urbanization. In recent years, with the gradual increase of urban population and the increasing shortage of land resources, traffic congestion has become a major problem perplexing urban development. With the rapid development of urban rail transit, tunnel shield construction with high safety, fast construction speed, and less condition constraints has been widely used. However, if the setting of support pressure acting on the tunnel surface is unreasonable, it may cause soil collapse or uplift (Feng et al., 2015; Han et al., 2020; Feng et al., 2022). Therefore, calculating the support pressure required by a shield tunnel is very important to maintain the stability of tunnel working face. In order to obtain more accurate critical support pressure, the influencing factors and failure area must be determined at the same time.
Many scholars have conducted a series of theoretical and experimental studies on the stability of excavation face through different research methods (Zhang and Sun, 2018; Li et al., 2019; Liu et al., 2021; Yu et al., 2022). Horn (1961) first used the limit equilibrium method to construct the collapse form in front of the tunnel excavation surface, which is composed of a wedge and a simple warehouse on its upper part. This model provides a research basis for the subsequent limit equilibrium method to calculate the support pressure of the excavation surface. Broere (2001) applied it to multi-layer soil for analysis, and the calculation results are close to the actual project. Jancsecz and Steiner (1994) improved a new limit equilibrium model based on horn. The top of the model is composed of prisms. The soil arching effect in the soil is studied, and the relationship between the coefficient of soil lateral pressure and internal friction angle, tunnel buried depth ratio, and wedge angle is established. The calculation results are expressed by the three-dimensional earth pressure index. Anagnostou and Kovári (1996) established a wedge model to analyze the stability of tunnel excavation surface in a homogeneous soil layer. The results show that the limit support pressure of the excavation surface in dry sand layer is related to the buried depth of tunnel vault, tunnel diameter, internal friction angle of soil, cohesion of soil, and other factors, but there is no regular analysis on each influencing factor. Based on the upper bound theorem of limit analysis, Mollon et al. (2011) and others studied the stability of shield excavation face in heterogeneous sandy soil by constructing the failure mode of two-dimensional rotating multi block set. It is found that the results of limit support pressure and failure mode of the excavation surface obtained by this method are close to those obtained by finite difference numerical analysis. Liu et al. (2012) established the upper bound solution of stability limit and effective support pressure of shield excavation face in a saturated sandy soil layer under steady-state seepage. The research shows that under steady-state seepage, the shield buried depth and surface overload have little influence on the limit support pressure, and the seepage and shield diameter have a significant influence on the limit support pressure. Yang et al. (2010) and others analyzed the stability of the excavation surface of two-dimensional shallow tunnel by using the upper bound method, which assumed that the failure mode of the excavation surface was composed of a group of rigid blocks. The results show that the cohesion and friction angle of soil are positively correlated with the stability of the excavation surface. However, when the internal friction angle and cohesion of soil are small, the influence of tunnel buried depth on the stability of the excavation surface is obvious. In the numerical simulation and model test, Vermeer et al. (2002) used finite element analysis to simulate the stability of the excavation surface, and explored the effects of soil gravity, cohesion, and surface overload on the limit support pressure. Zhu et al. (2005) used FLAC 3D to model and analyze the relationship between support pressure and tunnel face soil deformation, and obtained their relationship curve. Oblozinsky and Kuwano (2006) studied the influence law of tunnel buried depth on the failure mode of the excavation surface and minimum support pressure in a sandy soil layer, and obtained the influence law between them. However, due to its single consideration factor, it has not been applied in engineering practice. Meguid et al. (2008) pointed out the advantages of centrifugal model test in the stability simulation of the excavation surface by summarizing the previous test results. Lv et al. (2019) studied the failure process of extreme instability of the excavation surface under different buried depths through model tests, and improved the traditional wedge model into a wide wedge model. Li et al. (2011) revealed the dissipation process of soil arch and the instability form of the excavation surface through a large-scale model test and combined with the stress state of the soil in front of the excavation surface.
Because the stress level of soil determines its own mechanical characteristics, while the stress level of the 1 g model test is small, and the test results still have a certain gap with the actual project (Taylor, 2005), it has become a reliable means to explore the support pressure of excavation face by using a geotechnical centrifuge. Through a series of centrifugal model tests and comparative analysis of numerical simulation, this paper studies the change and instability mode of excavation face support pressure under different buried depths, internal friction angles, cohesions, and head differences; reveals the response law of different cohesive soils in the process of instability; and provides a theoretical basis for the study of excavation face support pressure in shield tunnel construction.
Centrifugal Model Test
Test Preparation
According to the three basic laws of similarity theorem and the results of the model test (Weng et al., 2019), the similarity ratio can be deduced through equation analysis to meet the similarity relationship. The soil is regarded as a homogeneous, continuous, and isotropic material, and only the self-weight stress is considered. The relationship is as follows.
From three governing equations, such as Eqs. 1–6:
When conducting the model test, if the three governing equations of prototype and model are the same, the stress–strain relationship between prototype and model can fully meet the following conditions:
According to Eqs. 4–6, in the centrifugal model experiment, if the geometric similarity ratio is N, the corresponding centrifugal acceleration is
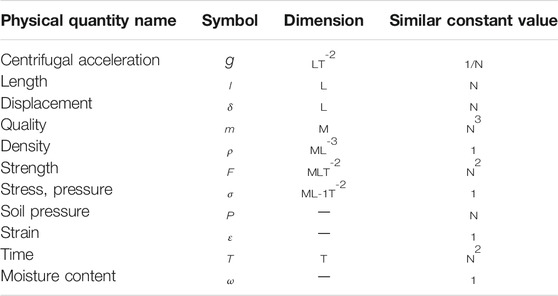
TABLE 1. Similarity constants of commonly used physical quantities in centrifugal test (scale 1: N, C = prototype parameter/model parameter).
Test Device
The test was carried out on a TLJ-3 centrifuge, a large geotechnical centrifuge of Chang’an University, with a maximum capacity of 60 gt, a rotation radius of 2 m, and a maximum centrifugal acceleration of 200 g (Weng et al., 2019), as shown in Figure 1.
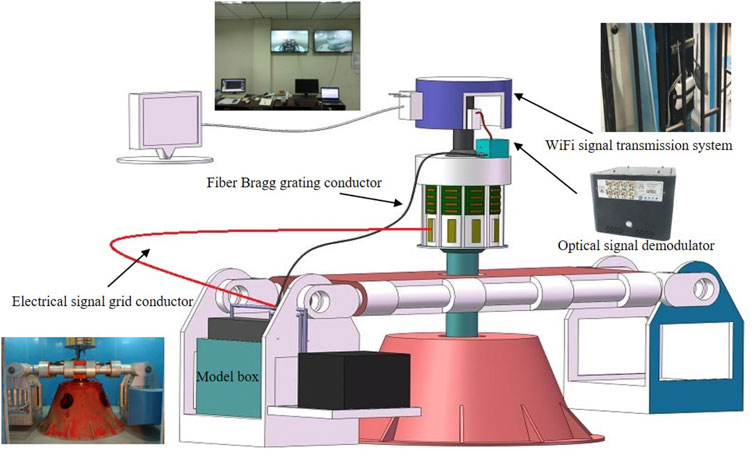
FIGURE 1. Geotechnical centrifuge of Chang’an University.
Figure 2 shows the centrifugal test device for tunnel face stability of the shield tunnel under different working conditions. The whole set of device consists of a model box, a lower water storage tank, a tunnel model (permeable tunnel face, steel shield shell), a cushion block, a high water level control hole, stress acquisition element FBG (fiber Bragg grating), a displacement stepping device, a loading dowel bar, etc.; the size of the model box is 700 mm × 400 mm × 500 mm. The front of the model box is high-strength transparent glass, through which it is easy to observe the characteristics of the tunnel face after instability. The other three sides and the bottom plate are high-strength steel plates. The shield model is mainly composed of shield shell, permeable excavation glass panel, FBG element, and stepper device to control displacement. Water level control is also an important part of the device. The water pump in the bottom water storage tank is used to pump water into the model box, the water level is kept unchanged through the water level control hole, and the overflow water flows back into the water tank to realize the displacement change of the shield excavation surface, which can be realized through the motor unit and the force transfer loading rod (Niu et al., 2020). When the centrifuge works, FBG can transmit the data of support pressure on the shield excavation surface to the external computer host by wireless transmission. Due to the symmetry of the tunnel, to reasonably observe the deformation and displacement, half of the tunnel model is made, that is, the shield shell with cross section of “D”, and the inner diameter of the shield shell is 100 mm. Because the test content of this paper mainly monitors the stress law and instability mode of the tunnel surface, the influence of materials on the tunnel structure and stress is ignored.
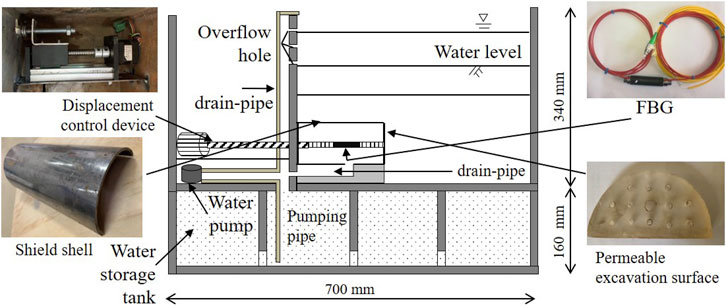
FIGURE 2. Centrifugal test model box for stability of shield tunnel excavation face.
Test Scheme and Steps
A series of comparative test conditions are set according to the influence of different soil parameters and working conditions. The main factors considered are shown in Table 2, where C is the overburden thickness of the tunnel, Hw is the height of water head at the center of the excavation surface, and D is the tunnel diameter. The internal friction angle is adjusted by mixing local clay with different proportions of river sand, which is measured by direct shear test. Combined with the power tunnel of Guangzhou trunk line, the tunnel diameter is 5 m, the scale of the model is 100 mm, and the centrifugal acceleration is designed as 50 g. In the instability mode analysis, C/D = 1 remains unchanged. In the whole test, the displacement control device is programmed to control the retreat of the permeable excavation surface of the shield model. The instability of the soil in front of the model is used to simulate the instability and failure of the soil in front of the shield excavation surface under seepage conditions. The support pressure on the excavation surface is measured by FBG, and the variation law and instability mechanism of each soil layer parameter on the support pressure under different working conditions are analyzed.
1) Put the prepared model box into the centrifuge test boom as a whole, and turn on the water pump to inject water into the box to the water level required for the test condition, that is, to reach the overflow hole (this process is not required for water free test).
2) Start the centrifuge, set the acceleration from 0 to 50 g, and stabilize for 30 min; this process keeps the position of the excavation surface unchanged, mainly to make the soil closer to the nature of the undisturbed soil.
3) After the support pressure remains stable, the displacement control device gradually retreats to the excavation surface at a certain rate, and the data are collected through the fiber Bragg grating system.
4) At the end of the centrifugal test, the acceleration gradually decreased from 50 g to 0. In the whole process, the displacement control was programmed by the stepper control system, and the support pressure of the excavation surface was monitored in real time by the FBG on the loading rod.
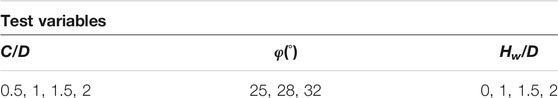
TABLE 2. Conditions of centrifuge model tests.
Experimental Treatment
In order to prevent soil particles from flowing into the tunnel under high acceleration and seepage, Vaseline is applied between the excavation surface and the shield tunnel wall to fill the gap. At the same time, the contact between the shield tunnel and plexiglass plate and support is bonded with glass glue to prevent water, but although this measure can prevent soil particles from entering the tunnel. On the other hand, it causes the tunnel to retreat and produce certain friction during the test, which cannot be ignored. Especially for the high-sensitivity element FBG (Fiber Bragg Grating), it affects the accuracy of the support pressure data on the excavation surface (Niu et al., 2020). Using the method proposed by Idinger et al. (2011), the model box is idled without soil and water, and the centrifugal conditions are consistent with the test conditions, Under the condition of 50 g, the average value of the retreating friction of the excavation surface can be obtained by this calibration method. It should be pointed out that the retreating friction of the excavation surface in this test is significantly less than the test results of Chen et al. (2015). The main reason is that the excavation surface here is made of high-strength glass and the filling material is Vaseline, which has a lubricating effect.
FBG writes the grating on the optical fiber with ultraviolet light, which can directly measure the support pressure on the excavation surface through the conversion formula, and has the characteristics of high sensitivity and strong adaptability (Taylor, 2005).
Instability Mode Analysis
Support Pressure Change Process
The variation law of the support pressure on the excavation surface of the core test tunnel is shown in Figure 3. The whole evolution process can be divided into three stages: the first stage is when the displacement is small (S < 1.5D%), the support pressure decreases rapidly with the increase of the displacement of the excavation surface, and the slope of the drawn line gradually decreases. The main reason is that with the retreat of the excavation surface, some collapsed soil mass is re-balanced under the action of surrounding forces. No more sliding with the soil below. The second stage is that the displacement of the excavation surface is between 1.5D% and 3D%. In this stage, with the increase of the retreat displacement of the tunnel excavation surface, the support pressure of the excavation surface reaches the limit state, and then the support pressure of the excavation surface rises slowly, which is in a circular arc shape in the graph. It can be seen from Figure 3 that the displacement points of soil mass with different internal friction angles reach the limit state and are also different at φ = 25°, the displacement of the excavation surface is S = 1.9D%, and the soil reaches the limit bearing state. Similarly, when at φ = 28° and 32°, the displacement of the excavation surface reaches the limit bearing state at 1.7D% and 1.5D%, respectively. The analysis shows that the fluidity of sandy soil is better than that of clay. When the proportion of sandy soil increases, the cohesion of soil decreases gradually. When the excavation surface retreats, the “reaction” time of soil deformation becomes longer. However, under seepage conditions, such as Hw = 1.5D and 2D, under the action of seepage force, the soil flow speed will be accelerated and the soil deformation time will be shortened. The greater the water level difference under the same conditions, the shorter the time to reach the limit point. The main reason for the rebound of support pressure is the increase of retreat displacement, which makes the deformation of soil above the collapse lag after reaching the limit state. At the same time, it can be seen that different soil bodies also have different rebound times at φ = 25°; the longest time is about 7 min, at φ = 32°, and the shortest time is about 3 min. Therefore, seepage does not play a major role in the rebound time of support pressure. In the third stage, when the displacement of the excavation surface is greater than 3D%, the support pressure of the excavation surface gradually tends to a stable value with the increase of displacement. In this stage, it can be judged that the soil has been unstable.
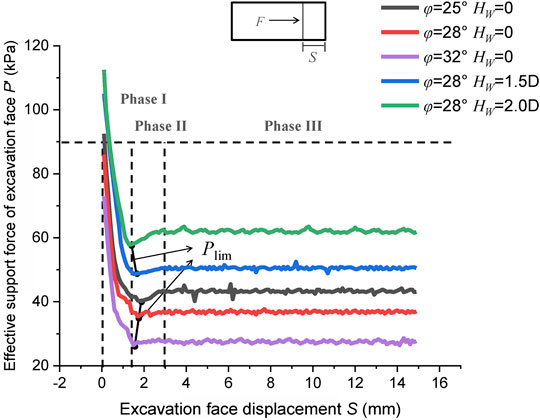
FIGURE 3. Relationship between limit support pressure and tunneling face displacement.
Change of Support Pressure on Excavation Face of Dry Soil
Figure 4 shows the soil support pressure displacement relationship curve with different internal friction angles. Under the same buried depth ratio C/D = 1, the increase of the internal friction angle of the tunnel significantly reduces the support pressure on the excavation surface. The limit support pressures of the three kinds of soil are 40.2, 35.4, and 26.1 kPa, respectively. The instability modes of different soils are also different. With the increase of the displacement of the excavation surface, the soil mass in front of it deforms, and the soil particles above this part of the soil mass loosen along the vertical direction, which directly leads to the rapid reduction of the vertical earth pressure of the soil mass, while the horizontal earth pressure increases rapidly, which shows that the horizontal soil mass is more dense. At this time, the soil arching effect plays a role and initially forms a soil arching. The introduced lateral pressure coefficient K = horizontal earth pressure/vertical earth pressure. When K > 1, that is, the horizontal earth pressure is greater than the vertical earth pressure, the stress direction of soil changes, resulting in the rotation of the principal stress axis. As the excavation surface continues to retreat, the K value in the upper area in front of the tunnel gradually increases to the maximum value. At this time, the soil arching effect plays an extreme value, and the minimum value of the support pressure on the excavation surface is obtained. Pmin is the limit support pressure obtained from the test, that is, the lowest point of the curve in Figure 3. There is a local shear failure area in front of the excavation surface, but at this time, the soil is in a limit equilibrium state. When the excavation surface continues to retreat, the K value gradually decreases from the peak value, and the local shear failure area develops into a shear sliding area. The sliding surface initially forms and extends upward, resulting in the failure of the original soil arch; the soil above the soil arch collapses and finally forms local instability failure. At this time, the support pressure of the excavation surface gradually increases, that is, the rebound in the second stage mentioned above. The soil arch continues to move upward, iterates over the new soil arch, and finally plays a bearing role. Due to different soil properties, when the horizontal earth pressure and vertical earth pressure reach equilibrium, the new soil arch is sufficient to bear the load of the upper loose soil, and the soil arch completes the whole extension process and finally ends in the local instability state.
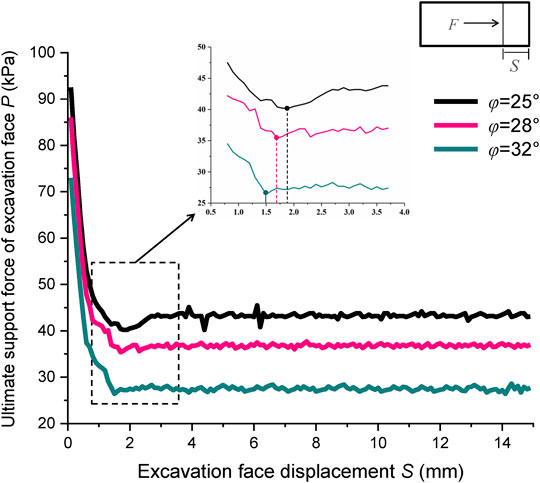
FIGURE 4. Relationships between support pressure and tunneling face displacement under the different internal friction angles.
The continuous soil arch iteration makes the soil near the surface loose and the surface has small settlement. Currently, the loose soil is particularly sensitive. When the excavation surface continues to retreat, the loose soil will collapse with the soil arch iteration, resulting in large settlement of the surface, and overall instability and failure of the soil. In this process, the soil arching effect plays a role from bottom to top along the top of the tunnel, and destroys with the expansion of the unstable sliding surface, then produces loose soil areas, circulates in turn, and finally develops to the surface. The soil arching effect gradually fails, and the support pressure of the excavation surface tends to a stable value, that is, the third stage mentioned above. The surface settlement is similar to funnels and chimneys, which is mainly related to soil quality, C/D, and hydrological conditions.
Variation of Support Pressure on Excavation Face of Saturated Soil
It can be seen from the curve of limit support pressure displacement under different head pressures in Figure 5 that when Hw = 1.5D, the limit effective support pressure P’lim = 48.7 kPa, which is 37.6% higher than that under dry conditions. When Hw = 2D, the limit effective support pressure P’lim = 57.8 kPa, which is 63.3% higher than that under dry condition and 18.7% higher than that under Hw = 1.5D condition. The data fitting shows that the limit effective support pressure increases linearly with the increase of head pressure.
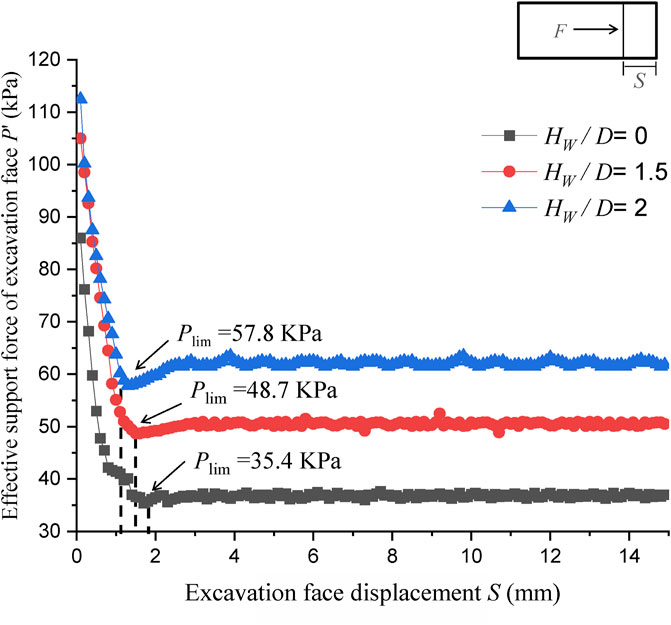
FIGURE 5. Relationships between limit support pressure and tunneling face displacement under the different head pressures.
When the overall instability failure of the soil occurs, the surface presents a chimney shape. Under the action of seepage force, the deformation of the soil is accelerated, resulting in the expansion of the width and a larger volume of the collapse body, extending from the bottom to the surface, which intensifies the iteration speed and failure strength of the soil arch. In the theoretical calculation and numerical simulation, for the convenience of calculation, the seepage coefficient is often regarded as isotropic. In the comparison of the test results in this paper, it can be seen that the seepage force of the soil in the collapse area along the tunnel is significantly greater than that outside the failure surface, and the seepage force near the tunnel surface is significantly greater than that far away from the tunnel surface. It is not difficult to see that if the excavation surface continues to retreat, under the action of seepage force, the soil particles with original force balance will be carried to the lower part, making the chimney shape wider and wider, and finally leading to the tunnel filled with soil. This is also the key to increase the support pressure of the excavation surface in time to prevent the further development of collapse and prevent water and mud gushing in the process of shield instability.
Factor Influence Analysis
Influence of C/D on Limit Support Pressure of Tunnel
The variation law of tunnel limit support pressure with C/D is shown in Figure 6. It can be seen that with the increase of C/D, the limit support pressure gradually decreases and tends to a stable value φ = 28°, increased by 7.6%, 1.7%, and 0.6%, respectively, with the increase of C/D. When C/D = 2, the limit support pressure is stable at 41.7, 36.2, and 26.7 kPa. From φ = 32° to φ = 25°C at C/D = 0.5, the limit support pressure is reduced by 28.4%. When C/D = 0.5, because it is a shallow buried tunnel, overall instability will occur. At this time, P is 35.2 kPa. With the increase of C/D, when C/D = 1, the buried depth increases, the soil arching effect is further developed, and local instability will occur. At this time, P is equal to 40.2 kPa with an increase of 14.2%, which is shown in the figure, where the first half of the curve is steep. When φ is 28°, the slope of the first half section decreases compared with that at 25°, which is mainly due to the more effective role played by the soil arching effect with the increase of internal friction angle. Similarly, when φ is 32°, the limit support pressure is hardly affected by C/D, and only increases by 3.5%. When C/D > 1.5, the buried depth has little effect on the limit support pressure of the tunnel. It can be seen that the soil with larger internal friction angle is more likely to produce a soil arching effect, which plays a more effective role. In the construction of a shallow buried tunnel, attention should be paid to the soil with a smaller internal friction angle.
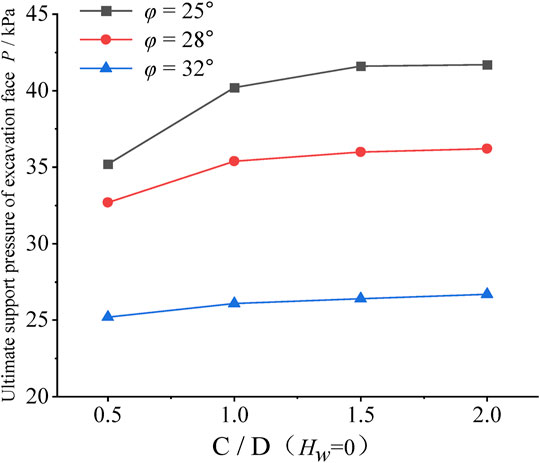
FIGURE 6. Relationship between limit support pressure and ratio of tunnel C/D.
Influence of Internal Friction Angle on Limit Support Pressure of Tunnel
It has been known from the section Influence of C/D on Limit Support Pressure of Tunnel that when C/D > 1.5, P will tend to be stable, so this group selects C/D = 1.5 for the test. The variation law of tunnel limit support pressure with internal friction angle is shown in Figure 7. It can be seen that with the increase of internal friction angle, the limit support pressure decreases linearly. Due to the limited test conditions, the test with larger internal friction angle is not continued. However, it can be seen from literature (Du and Han, 2010; Idinger et al., 2011), when internal friction angle φ is more than 40°, that P gradually tends to a stable value with the continuous increase of φ. Taking Hw = 1.5 as an example, with the increase of internal friction angle, it decreases by 16.6% and 17.9%, respectively. At the same head height, with the increase of Hw, φ = 28° more than φ = 25°. The limit support pressure is reduced by 15.5%, 16.9%, 20.3%, and 21.6%. It can be seen from the comparison that in the case of no water, with the increase of internal friction angle, the reduction rate of limit support pressure is slow, and when the height of water head increases continuously, it will accelerate the reduction of limit support pressure. The main reason is that under the action of seepage force, the formation of soil arch effect is accelerated, its iterative development is terminated, and smaller limit support pressure is obtained. With the increase of head height, there is no significant increase between Hw = 1 and Hw = 1.5. The main reason is that during the centrifugal test, because the head water level is lower than the soil layer height, the overflow of the centrifuge is blocked by soil particles at high acceleration, resulting in the actual head height being greater than the control the height of water head and no head increment of 0.5 Hw. It can be seen that in the construction of high water level or shallow buried tunnel, the value of soil limit support pressure with a low internal friction angle should be more conservative.
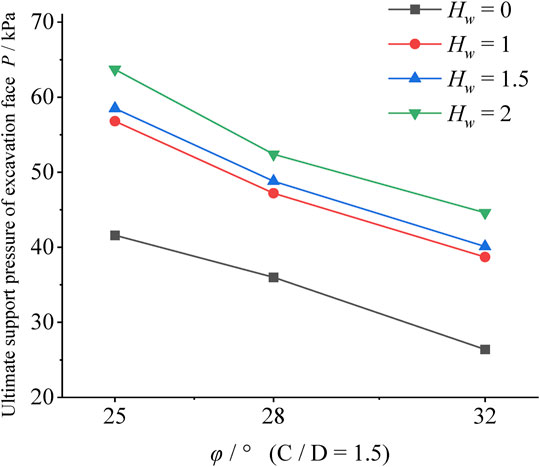
FIGURE 7. Relationship between limit support pressure and internal friction angle of tunnel.
Influence of Height of Water Head on Limit Support Pressure of Tunnel
It can be seen from Influence of Internal Friction Angle on Limit Support Pressure of Tunnel that with the increase of internal friction angle, the limit support pressure gradually tends to a stable value. That is, the larger value of φ is, the smaller the influence on the support pressure of the excavation face is, so φ = 32° is selected. This group of tests shall be carried out for 32° soil. It can be seen from Figure 8 that with the increase of Hw, the limit support pressure increases linearly, and there is a sudden change when C/D = 1 and Hw = 1.5. The reason is the same as that in Influence of Internal Friction Angle on Limit Support Pressure of Tunnel. The overflow is blocked by soil particles, which also provides improvement ideas for researchers who conduct subsequent centrifugal tests. When Hw = 1, with the increase of C/D, the limit support pressure increases by 3.4%, 6.3%, and 3.8%, respectively. When Hw = 1.5, it increases by 2.9%, 1.8%, and 5.7%, respectively. When Hw = 2, it increases by 3.3%, 3.2%, and 1.2%, respectively. It can be seen that under the condition of height of water head, with the increase of C/D, the increase of limit support pressure caused by Hw also gradually decreases, which is consistent with the fact that the increase of C/D obtained in Influence of C/D on Limit Support Pressure of Tunnel to a certain extent is no longer the main factor affecting limit support pressure. At the same time, with the continuous increase of Hw, the limit support pressure of the tunnel under different buried depths increases linearly. It can be obtained from Yu et al. (2020). Due to the influence of tunnel diameter, with the continuous increase of Hw, the seepage force on the tunnel excavation surface will not increase linearly, but gradually flatten. Due to the complex test conditions, the influence of tunnel diameter on the limit support pressure is not considered in the test, but this influencing factor cannot be ignored.
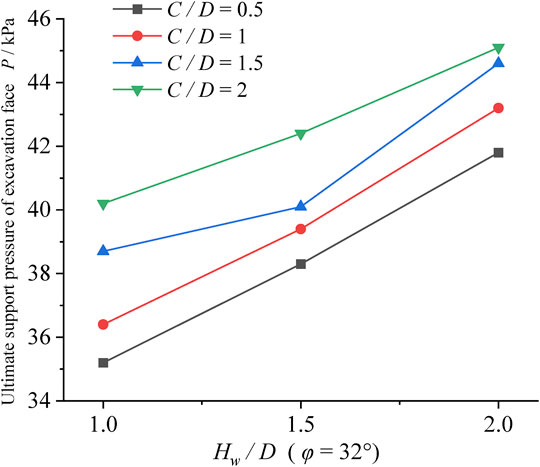
FIGURE 8. Relationship between limit support pressure and height of water head of tunnel.
Numerical Analysis
Due to the limited test conditions and the need to invest more human and material resources, and the uncertain randomness of the data results, in order to better analyze the research of different factors on the instability mode of the tunnel excavation surface, this paper will carry out modeling and analysis in combination with the finite element software, considering the directness of the analysis and the symmetry of the data. Half of the circular tunnel cut longitudinally along the central axis is used as the analysis model (Li et al., 2018, Lu et al., 2016). As shown in Figure 9, the tunnel diameter is 10 m, and the length and width of the model are 80 m and 55 m, respectively. The model is large enough to avoid boundary effect, where C is the buried depth of the tunnel. The soil model adopts the M-C model, and the lining structure is represented by the shell element, with a thickness of 35 mm. Earth pressure monitoring points are set within the three-dimensional and two-dimensional range in front of the tunnel excavation surface to judge the tunnel instability contour. In the result analysis diagram, the black contour is the tunnel body, the color line is the instability contour drawing, and the contour line is fitted and linearized.
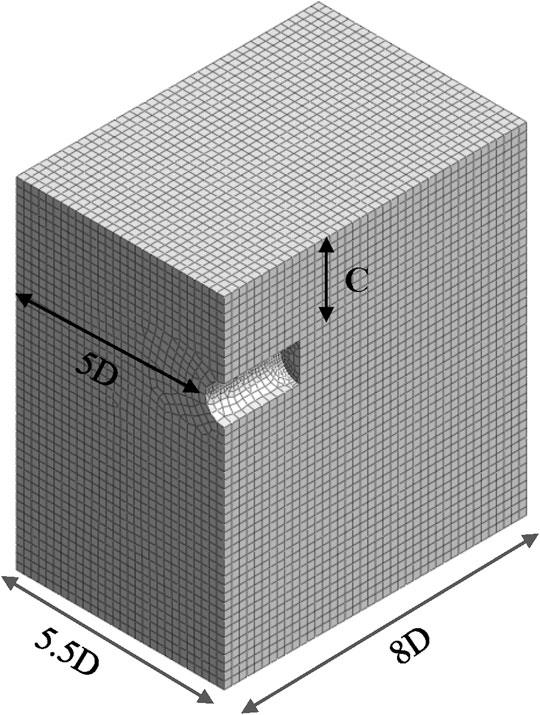
FIGURE 9. Numerical analysis model.
The boundary conditions of the model are as follows: only the top surface of the model can move freely. The normal direction of all vertical planes is fixed. The bottom surface of the model is also fixed. The surface between soil and lining is fixed.
Influence of C/D on Tunnel Instability Mode
The influence of C/D on the tunnel instability mode is shown in Figure 10. Similar to the previous centrifugal test results, the tunnel is prone to overall instability under shallow buried conditions, such as C/D < 1. When the red line C/D in the figure is 0.5, the overall instability occurs, and the instability range is expanded in a trumpet shape. With the continuous increase of C/D, the soil arch effect plays a role. It can be seen that the soil arch continues to develop above the soil, up to 1.2D, but its development speed continues to slow down. With the increase of C/D, the instability angle of the tunnel also gradually slows down, the width of the wedge below increases, and the height of the soil arch continues to increase. In other words, for the same soil layer, with the increase of C/D, the soil mass in front of the tunnel excavation face gradually changes from initial overall instability to local instability, and the height and width of soil arch continue to increase. When C/D increases to a certain extent, the soil arch effect will no longer extend and play a role, and C/D will no longer have an impact on the limit support pressure of the excavation face.
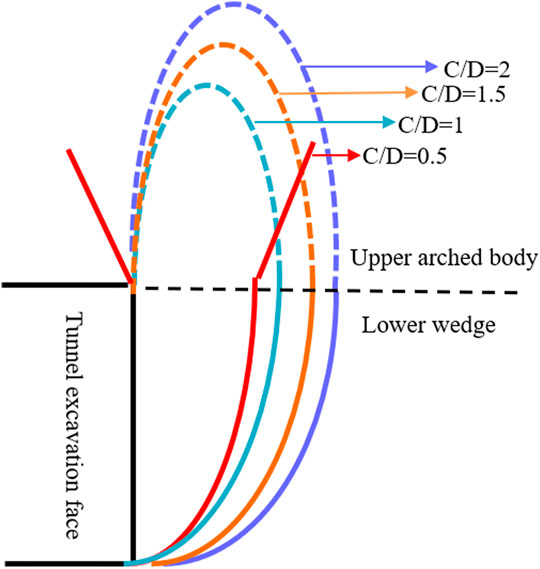
FIGURE 10. Relationship between C/D and tunnel instability mode.
Internal Friction Angle φ Influence on Tunnel Instability Mode
The influence of the internal friction angle on the tunnel instability mode is shown in Figure 11. It can be seen from the figure that with the increase of the internal friction angle, the soil instability mode has not changed greatly, and the height of the soil arch is not greatly affected by the internal friction angle. With the increase of the internal friction angle, the height of the soil arch increases by 1/5D, while the width of the wedge below increases by 2/5D. For the collapse mode, the inclination angle of unstable soil decreases continuously and does not increase continuously with the increase of internal friction angle. With the increasing internal friction angle, the wedge will not continue to grow, but will tend to a stable instability state, which is similar to the conclusion obtained from the previous centrifugal test. For the soil layer with high internal friction angle, the increase of C/D has little effect on the support pressure of the excavation face. Instead, we should pay more attention to the expansion of the instability range in front of the excavation face, explore how to take effective measures to reduce the collapse volume of the soil in front, and pay more attention to the shallow tunnel with low internal friction angle.
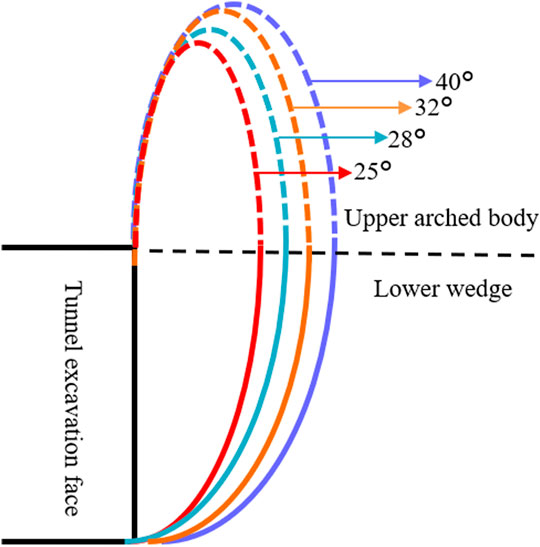
FIGURE 11. Relationship between internal friction angle and tunnel instability mode.
Influence of Cohesion c on Instability Mode of Tunnel
In the centrifugal test, it is difficult to take the cohesion as the variable, so the influence of soil cohesion on the tunnel instability mode is studied in the numerical simulation stage. The relationship between cohesion and tunnel instability mode is shown in Figure 12. It can be seen that the overall instability mode and contour of the tunnel have not changed substantially. With the increase of cohesion, the height of soil arch has hardly changed, with a maximum increase of 0.1–0.2D, and the width of wedge below has a slight increase. Similarly, the influence of cohesion on the support pressure of the excavation face is not the main factor, which is why most scholars do not take cohesion as the main research object when studying the influence on the support pressure of the excavation face.
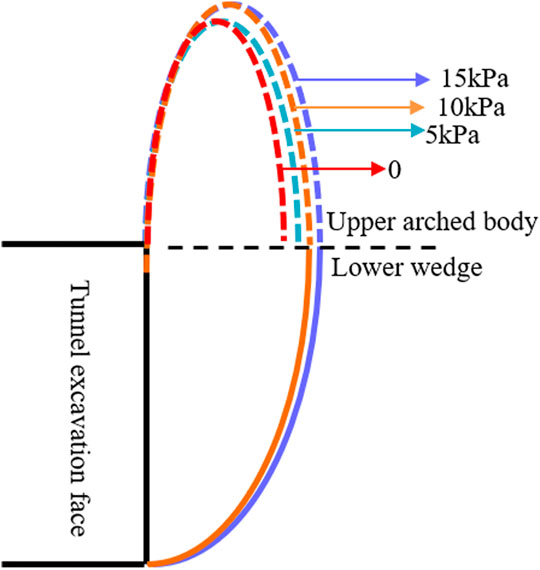
FIGURE 12. Relationship between cohesion and instability mode of tunnel.
Conclusion
Through the centrifugal model test and numerical modeling analysis of the instability of the excavation surface of the shield tunnel, comparing the support pressure and instability form of the lower excavation surface within different soil parameters, and analyzing its influence on the support pressure of the excavation surface and its effect on the instability mechanism, the following conclusions can be obtained:
1) The instability process of excavation face can be divided into three stages. In the first stage (S < 1.5D%), P decreases rapidly with the increase of S. In the second stage (1.5D% ≤ S ≤ 3D%), with the increase of S, the support pressure of the excavation face reaches the limit state, namely, PLIM, and then P rises slowly, showing a circular arc in the graph. In the third stage (3D% < S), as S continues to increase, P gradually approaches the stable value.
2) The C/D and internal friction angle are positively correlated with the ultimate support pressure of the excavation face. When φ > 40° or C/D > 1.5, the impact is small and can be ignored. With the increase of the height of water head, the limit support pressure increases linearly.
3) With the increase of C/D, the soil is in the gradual process from overall failure to local failure. The change of C/D mainly affects the height of soil arch and the width of wedge below, and the internal friction angle mainly affects the width of wedge and soil instability angle.
Data Availability Statement
The original contributions presented in the study are included in the article/Supplementary Material, further inquiries can be directed to the corresponding author.
Author Contributions
HN: Conceptualization, Data Curation, Validation, Investigation, Writing—original draft, and Writing—review and editing. XW: Research Conceptualization, Writing—review and editing, Resources, Supervision, and Funding acquisition. JH: Test help. LH: Data processing.
Funding
The authors would like to acknowledge the financial support of the National Natural Science Foundation of China (Grant No. U1934213).
Conflict of Interest
The authors declare that the research was conducted in the absence of any commercial or financial relationships that could be construed as a potential conflict of interest.
Publisher’s Note
All claims expressed in this article are solely those of the authors and do not necessarily represent those of their affiliated organizations, or those of the publisher, the editors and the reviewers. Any product that may be evaluated in this article, or claim that may be made by its manufacturer, is not guaranteed or endorsed by the publisher.
References
Anagnostou, G., and Kovári, K. (1996). Face Stability Conditions with Earth-Pressure-Balanced Shields. Tunnelling Underground Space Technol. 11 (2), 165–173. doi:10.1016/0886-7798(96)00017-x
Broere, W. (2001). Tunnel Face Stability and New CPT Application. Amsterdam: Delft University Press.
Chen, R. P., Yin, X. S., Tang, L. J., and Chen, Y. M. (2015). Limit Theoretical Study on Face Stability of Shield Tunnels. Rock Soil Mech. 36 (S1), 225–229. doi:10.3724/SP.J.1077.2011.00271
Du, Y. L., and Han, L. B. (2010). Geotechnical Centrifugal Model Test Technology. Beijing: China water resources and Hydro-power Press. (in Chinese).
Feng, G.-L., Chen, B.-R., Xiao, Y.-X., Jiang, Q., Li, P.-X., Zheng, H., et al. (2022). Microseismic Characteristics of Rockburst Development in Deep TBM Tunnels with Alternating Soft-Hard Strata and Application to Rockburst Warning: A Case Study of the Neelum-Jhelum Hydropower Project. Tunnelling Underground Space Technol. 122, 104398. doi:10.1016/j.tust.2022.104398
Feng, G.-L., Feng, X.-T., Chen, B.-R., Xiao, Y.-X., and Yu, Y. (2015). A Microseismic Method for Dynamic Warning of Rockburst Development Processes in Tunnels. Rock Mech. Rock Eng. 48 (5), 2061–2076. doi:10.1007/s00603-014-0689-3
Han, Z., Li, D., Zhou, T., Zhu, Q., and Ranjith, P. G. (2020). Experimental Study of Stress Wave Propagation and Energy Characteristics across Rock Specimens Containing Cemented Mortar Joint with Various Thicknesses. Int. J. Rock Mech. Mining Sci. 131, 104352. doi:10.1016/j.ijrmms.2020.104352
Horn, N. (1961). “Horizontal Earth Pressure on the Vertical Surfaces of the Tunnel Tubes,” in National Conference of the Hungarian Civil Engineering Industry, Budapest, November, 1961, 7–16.
Idinger, G., Aklik, P., and Wu, W. (2011). Centrifuge Model Test on the Face Stability of Shallow Tunnel. Acta Geotech 6 (2), 105–117. doi:10.1007/s11440-011-0139-2
Jancsecz, S., and Steiner, W. (1994). “Face Support for a Large Mix-Shield in Heterogeneous Ground Conditions,” in Proceeding of the 7th International Symposium on Tunneling, Boston, MA, 531–550. doi:10.1007/978-1-4615-2646-9_32
Li, D., Han, Z., Sun, X., Zhou, T., and Li, X. (2019). Dynamic Mechanical Properties and Fracturing Behavior of marble Specimens Containing Single and Double Flaws in SHPB Tests. Rock Mech. Rock Eng. 52 (6), 1623–1643. doi:10.1007/s00603-018-1652-5
Li, J., Chen, R. P., and Kong, L. G. (2011). Model Test Study of the Failure Mechanism of Shallow Tunnels in Dry Sands. China Civil Eng. 4 (07), 142–148. (in Chinese). doi:10.1631/jzus.B1000185
Li, W., Zhang, C., and Zhang, X. (2018). Stability Analysis of the Tunnel Face in the Cohesive-Frictional Soils Considering the Arch Effect and Rotational Mechanism. J. Chin. Inst. Eng. 41 (8), 697–709. doi:10.1080/02533839.2018.1534615
Liu, G.-F., Jiang, Q., Feng, G.-L., Chen, D.-F., Chen, B.-R., and Zhao, Z.-N. (2021). Microseismicity-Based Method for the Dynamic Estimation of the Potential Rockburst Scale during Tunnel Excavation. Bull. Eng. Geol. Environ. 80 (5), 3605–3628. doi:10.1007/s10064-021-02173-x
Liu, W., Zhang, X. J., and Tang, X. W. (2012). Supporting Pressure for Earth Pressure Balance Tunnel Face Stability sandy Soil when Tunneling Is Implemented in Saturated. J. Zhejiang Univ. (Engineering Science) 46 (4), 664–704. doi:10.3785/j.issn.1008-973X.2012.04.014
Lu, X., Zhou, Y., Huang, M., and Li, F. (2016). Computation of the Minimum Limit Support Pressure for the Shield Tunnel Face Stability under Seepage Condition. Int. J. Civ Eng. 15, 849–863. doi:10.1007/s40999-016-0116-0
Lv, X. L., Zeng, S., Wang, Y. P., Ma, S. K., and Huang, M. S. (2019). Physical Model Tests on Stability of Shield Tunnel Face in Saturated Gravel Stratum. Chin. J. Geotechnical Eng. 41 (S2), 129–132. (in Chinese). doi:10.11779/CJGE2019S2033
Meguid, M. A., Saada, O., Nunes, M. A., and Mattar, J. (2008). Physical Modeling of Tunnels in Soft Ground: A Review. Tunnelling Underground Space Technol. 23 (2), 185–198. doi:10.1016/j.tust.2007.02.003
Mollon, G., Phoon, K. K., Dias, D., and Soubra, A.-H. (2011). Validation of a New 2D Failure Mechanism for the Stability Analysis of a Pressurized Tunnel Face in a Spatially Varying Sand. J. Eng. Mech. 137 (1), 8–21. doi:10.1061/(asce)em.1943-7889.0000196
Niu, H. S., Weng, X. L., Yu, H. F., and Hu, J. B. (2020). Centrifugal Test Study on Instability Mode of Shield Tunnel Excavation Facein Silty Sand Stratum under Seepage. China Civil Eng. 53 (S1), 99–104+118. (in Chinese). doi:10.15951/j.tmgcxb.2020.s1.017
Oblozinsky, P., and Kuwano, J. (2006). “Centrifuge Experiments on Stability of Tunnel Face in sandy Ground,” in Proceedings of the 5th International Conference on Geotechnical Aspects of Underground Construction in Soft Ground, Amsterdam, Netherlands, June 15-17, 2006, 271–275.
Vermeer, P. A., Ruse, N., and Marcher, T. (2002). Tunnel Heading Stability in Drained Ground. Felsbau 20 (8), 8–18. Available at: https://www.researchgate.net/publication/228751251_Tunnel_Heading_Stability_in_Drained_Ground
Weng, X. L., Sun, Y. F., Yan, B. H., Niu, H. S., and Zhou, S. Q. (2019). Centrifuge Testing and Numerical Modeling of Tunnel Face Stability Considering Longitudinal Slope Angle and Steady State Seepage in Soft clay. Tunn Undergr Sp Tech. 101 (2), 103406. doi:10.1016/j.tust.2020.103406
Yang, F., Yang, J. S., and Zhao, L. H. (2010). Collapse Mechanism and Support Pressure for Shallow Tunnel Face. Chin. J. Geotechnical Eng. 32 (2), 279–281. (in Chinese). Available at: https://kns.cnki.net/kcms/detail/detail.aspx?FileName=YTGC201002023andDbName=CJFQ2010.
Yu, L., Zhang, D., Fang, Q., Cao, L., Zhang, Y., and Xu, T. (2020). Face Stability of Shallow Tunnelling in sandy Soil Considering Unsupported Length. Tunnelling Underground Space Technol. 102, 103445. doi:10.1016/j.tust.2020.103445
Yu, Y., Feng, G. L., Xu, C. J., Chen, B. H., Geng, D. X., and Zhu, B. T. (2022). Quantitative Threshold of Energy Fractal Dimension for Immediate Rock-Burst Warning in Deep Tunnel: A Case Study. Lithosphere 2022, 1699273. doi:10.2113/2021/1699273
Zhang, D. L., and Sun, Z. Y. (2018). Structural Stability of Complex Tunnel Surrounding Rock and its Control. J. Hydroelectric Eng. 37 (02), 1–11. (in Chinese). doi:10.11660/slfdxb.20180201
Keywords: tunnel, stability, centrifugal test, numerical simulation, limit support pressure
Citation: Niu H, Weng X, Hu J and Hou L (2022) Centrifugal Test and Instability Model Analysis of Excavation Surface Stability of a Shield Tunnel in a Clay Layer. Front. Earth Sci. 10:850505. doi: 10.3389/feart.2022.850505
Received: 07 January 2022; Accepted: 14 February 2022;
Published: 23 March 2022.
Edited by:
Guang-Liang Feng, Institute of Rock and Soil Mechanics (CAS), ChinaReviewed by:
Songhe Wang, Xi’an University of Technology, ChinaWenyuan Ren, Northwest A&F University, China
Lisi Niu, Henan Polytechnic University, China
Zhiyong Shi, Southeast University, China
Copyright © 2022 Niu, Weng, Hu and Hou. This is an open-access article distributed under the terms of the Creative Commons Attribution License (CC BY). The use, distribution or reproduction in other forums is permitted, provided the original author(s) and the copyright owner(s) are credited and that the original publication in this journal is cited, in accordance with accepted academic practice. No use, distribution or reproduction is permitted which does not comply with these terms.
*Correspondence: Xiaolin Weng, d2VuZ3hsMjAwMEAxMjYuY29t