 Gaofan Yue
 Guiling Wang2,3*
- 1School of Environmental Studies, China University of Geosciences, Wuhan, China
- 2Institute of Hydrogeology and Environmental Geology, Chinese Academy of Geological Sciences, Shijiazhuang, China
- 3Technology Innovation Center of Geothermal and Hot Dry Rock Exploration and Development, Ministry of Natural Resources, Shijiazhuang, China
- 4College of Resources and Environment, Yangtze University, Wuhan, China
The Xiong’an new area in northern China is rich in geothermal resources. The Gaoyuzhuang Formation in the Proterozoic Jixian system is an important recently discovered geothermal reservoir. The Gaoyuzhuang reservoir has been affected by multiple stages of tectonic movement. The fractures are very well developed, resulting in strong heterogeneity in the reservoir’s porosity and permeability. Few studies have been conducted on the fractures and heterogeneity of the Gaoyuzhuang reservoir. In this study, interpretation of data from image logs was used to summarize the characteristics of the fractures, including the fractures’ strikes, dips, and lengths. The permeability distribution of the reservoir in the vicinity of the borehole was predicted. The hydro-thermal (TH) coupling model was used to reproduce the process of pumping tests, and the simulation results were found to be in good agreement with the field test data. In addition, the relationship between the fracture aperture and length was obtained,
1 Introduction
Solving the problem of energy shortage and optimization of the energy structure is the key to sustainable global development (Dincer, 2000; Ahmad et al., 2020). Geothermal energy has become a hotspot in research on new energy sources due to its wide distribution, large reserves, good stability, and clean and environmentally friendly characteristics (Lu, 2018; Zhang et al., 2019; Gong et al., 2020; Wang et al., 2020; Dincer and Ozturk, 2021). Research has shown that geothermal energy can provide 3.9% of global energy and reduce CO2 emissions by 800 million tons by 2050 (Pan et al., 2019b). Globally, for both hot dry rock and hydrothermal geotherm type geothermal energy, deep geothermal reservoirs are often fractured. A large number of densely distributed fractures control the flow path of the underground fluid. The existence of fractures not only changes the mechanical parameters of the surrounding rock, but it also controls the distribution characteristics of the hydraulically fractured fracture network.
China is rich in geothermal resources, especially high-temperature hydrothermal geothermal energy resources (Chen, 1988; Wang et al., 2017; Wang and Lin, 2020). The best geothermal fields in the Beijing–Tianjin–Hebei region are distributed in the Xiong’an New Area. The Wumishan Formation in the Jixian system is the most representative hydrothermal reservoir in northern China (Pang, 2018; Wu et al., 2018; Ma et al., 2020). Since 2018, the China Geological Survey has conducted detailed exploration of the deep geothermal reservoir in the Xiong’an New Area and has found a second reservoir in the Gaoyuzhuang Formation (Wang et al., 2018; Ma et al., 2020). The Gaoyuzhuang Formation contains a large number of natural fractures, and the reservoir is very heterogeneous, which greatly effects future geothermal development. For example, the water production rate of well D22 in the original state is very low and cannot meet the requirements for development. It is urgent that a regional model be developed to guide the next stage for exploitation.
Discrete fracture network (DFN) models are commonly used to describe fracture networks. It uses deterministic or stochastic methods to generate a series of discrete fracture patches in order to quantitatively describe the size, strike, and strength of the fractures (Pan et al., 2019a; Barcelona et al., 2020; Giuffrida et al., 2020). The number of fractures in the reservoir is large, and the fractures range from a few microns to tens of meters, which cannot be simply described in a deterministic manner. The stochastic method uses the statistical results to describe the fracture network. There is no exact correspondence between individual fractures in reality, but in a representative body, the overall properties of the fracture network are the same as the real situation (Li et al., 2016; Gottron and Henk, 2021). The DFN model usually consists of three models: a distribution model, a dimensional model, and a spatial distribution model (Dowd et al., 2009). The normal vector is usually used to describe the strike and dip angle of the fractures. The probability density functions mainly include the Fisher distribution, Bingham distribution, binary normal distribution, and empirical probability distribution (Gottron and Henk, 2021). In practical applications, the Fisher distribution is the model that is most commonly used to describe the fracture direction. The model parameters mainly come from statistics of field observation data. For example, Pan et al., 2019a established a local fracture network model of a limestone mine using outcrop fracture measurements obtained using non-contact measurement techniques (such as 3D laser scanning and photometry). For deep reservoirs, image logging can be used to identify fractures more accurately and can provide important parameters such as the linear fracture density, direction, and pore diameter (Ozkaya, 2021; Nian et al., 2022). Tang et al. (2020) obtained statistics of the distribution characteristics of image logging fractures and gained a better understanding of the fractures in the Wumishan geothermal reservoir in the Jixian system in the Xiong’an new area. However, the fracture characteristics of the Gaoyuzhuang Formation have not been reported.
In this study, the characteristics of the fractures were analyzed quantitatively using image logging data. Using a geostatistical method, a regional discrete fracture network model was constructed, and the porosity and permeability distributions of the Gaoyuzhuang reservoir were calculated. A hydro-thermal (TH) coupling numerical model was established to validate the accuracy of the DFN model by fitting the field pumping test data.
2 Geologic Setting of the Xiong’an New Area
The Xiong’an new area is located in the middle of the Jizhong depression in the Bohai Basin (Figures 1A,B). According to previous studies, the Bohai Basin has experienced four stages of tectonic movement since the Archean (Qi et al., 2003; Chang et al., 2016; Qiu et al., 2017; Wang et al., 2019a). In particular, in the Mesozoic, the strata were uplifted and then strongly eroded (Zheng et al., 1999). The bedrock undulations have resulted in the secondary tectonic units in this area being developed, including the Niutuozhen uplift, Rongcheng uplift, and Gaoyang uplift (Qi et al., 2003; Cai et al., 2007). The faults in this area are well developed, including the Rongdong fault, Xushui fault, Niudong fault, Niunan fault, and Gaoyang fault (Figure 1C). The depths of the faults vary greatly, and some of them even reach the crystalline basement (Zhang et al., 2002). The study area is located in the southern part of the Rongcheng uplift near the Xushui Fault. The Xushui Fault is a normal fault with a dip angle of about 45°, and it is generally W–E trending, with a NE deflection near the Rongcheng uplift (Lu et al., 2019; Hu et al., 2020).
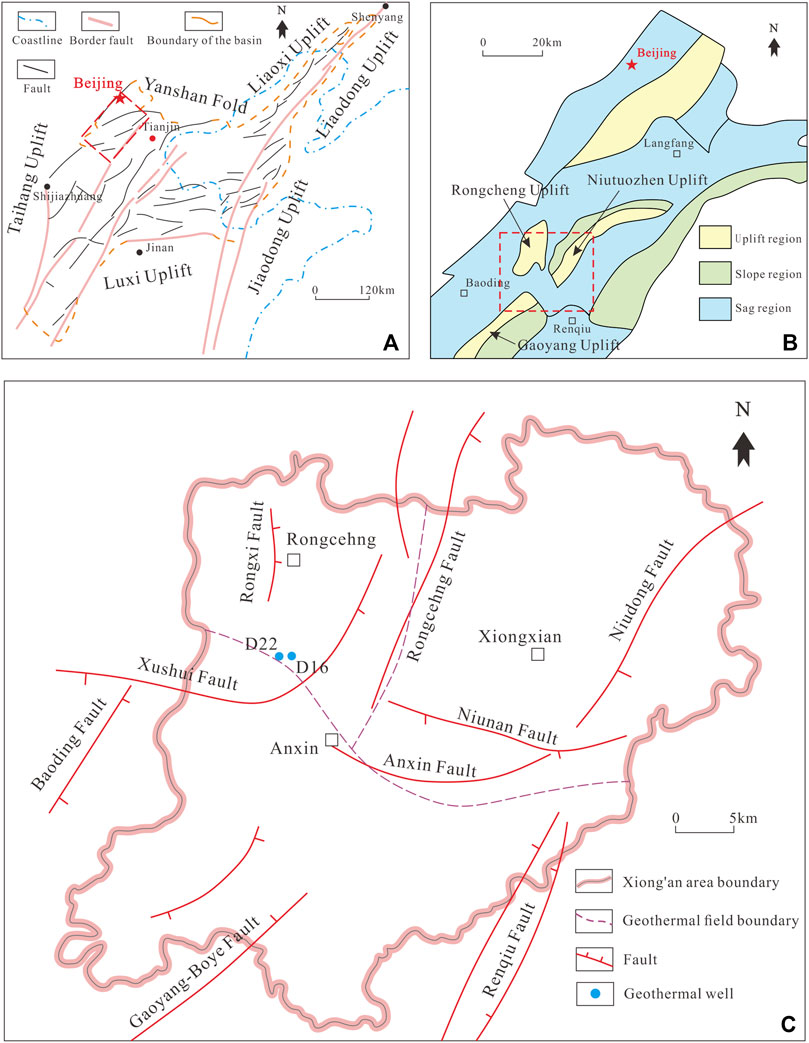
FIGURE 1. (A) Basic tectonic map of the Bohai Bay Basin; (B) Basic tectonic map of the Jizhong depression (from He et al., 2018); (C) Distributions of the major faults, geothermal fields, and boreholes in the Xiongan New Area.
Many stages of tectonic movement and karstification occurred from the Late Indosinian to the Himalayan, forming a large number of fractures in the geothermal reservoir. For example, the image logging of well Dawang1 shows that two main stages of fracture systems are developed in the Wumishan Formation, which is obviously similar to the trends of the Rongcheng fault and the Niudong fault. The high angle fractures control the vertical migration of the groundwater from bottom to top (Tang et al., 2020). In contrast to the development of the karst fractures in the Wumishan Formation, the Gaoyuzhuang Formation is mainly characterized by structural fractures due to its large burial depth and the weak influence of karstification. Wells D22 and D16 in the Rongcheng uplift encounter the Gaoyuzhuang Formation at a depth of about 3,200 m. The image logging results for well D22 show that the microfracture orientation is consistent with that of the large fault. A detailed analysis of the results will be presented in the subsequent sections.
Based on this, the heat accumulation mechanism in the Xiong’an New Area was determined. Affected by the westward subduction of the Pacific Plate, the eastern part of the North China Craton was obviously destroyed. The thickness of the lithosphere and crust was greatly reduced, and the Moho surface at the bottom of the study area was significantly uplifted, which is conducive to the conduction of mantle heat to the shallow part of the crust (Wang et al., 2019b). Deep faults cut through the upper crust, which is conducive to the upward intrusion of deep mantle thermal materials and magma into the crust. Under the thermal refraction effect, the heat accumulated in the concave area with a low thermal conductivity and was transferred to the convex area with a high thermal conductivity (Wang et al., 2020). The fault structure is very conducive to deep circulation heating of the groundwater (Pang, 2018). In addition, the internal temperature of the reservoir is homogenized due to the density flow of the water. Moreover, the intrusion of magma from the mantle provided radioactive material, and the heat from the subsequent radioactive decay created positive anomalies in the local geothermal field (Li H. et al., 2017a; Pang, 2018; Wang et al., 2021).
3 Methods
First, we analyzed the image logging results for well D22 in the Rongcheng uplift. In addition, we obtained the fracture density, fracture strike, dip angle, and other parameters. The fracture length was difficult to determine. Even image logging cannot accurately judge the lengths of fractures well. Based on a previous analysis of the entire Jizhong depression (Li et al., 2017b), we assumed that the fracture length had a normal distribution. Research has shown that there is an exponential relationship between the fracture aperture and length. Based on Fisher’s fractal statistical theory, a 3D DFN model of the Gaoyuzhuang reservoir around well D22 was established, and the fracture information was upscaled to a square grid using ODA theory. The random fractures result in great uncertainty. In order to reduce this uncertainty, we established a hydrothermal coupling model. Based on the field pumping test data for well D16 (well D16 is located about 200 m to the east of well D22), the model was verified, which greatly improved the correspondence between the model and the actual geological conditions.
3.1 Discrete Fracture Network Setting
3.1.1 Geometric Characteristics of Fractures
The disk shape has the greatest advantage in establishing mathematical expressions. In this study, it was assumed that the fractures in the 3D DFN model (rectangular fractures have an equivalent radius) were disk shaped. To quantitatively describe a fracture, its diameter (d), central position (x, y, z), poles (trends and folds), and aperture 1) need to be determined. It should be noted that poles and dip vectors are terms used to define the orientation of a plane in a space. The fractures were modeled as planar polygons and the poles or dips were used to describe their orientations (Figure 2A). The pole is a vector normal to the fracture plane, and it usually (by convention) points downward. The dip vector is a vector normal to the pole, and it lies in the plane pointing in the direction of the maximum slope gradient. The trend and plunge describe the orientation of the vector. The trend is the horizontal angle in the x-y plane away from north (positive y-axis) (Figure 2B). The plunge is the vertical angle in space away from the horizontal (x-y plane) (Figure 2C). The orientation of a dip or pole vector is completely specified by its trend and plunge (Golder Associates, 2019; Gläser et al., 2020).
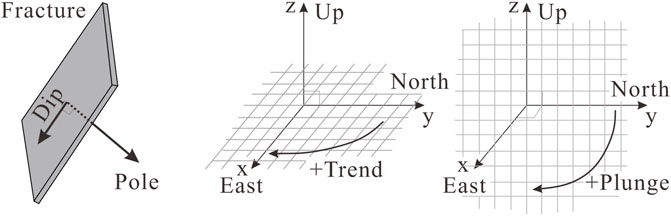
FIGURE 2. (A) Vertical fracture dip and pole, both pointing downward; (B) the pole trend in the x-y plane; and (C) a pole plunge in the y-z (or x-z) plane.
It was assumed that the spatial position of the fracture exhibits a Poisson distribution, that is, the center of the fracture is randomly distributed in 3D space. This assumption requires that the rock mass does not contain bedding planes, fault zones or geological structures (Baecher et al., 1977). This process can be described using the Baecher model. The Baecher model (Baecher, 1983) was one of the first well-characterized discrete fracture models. In this model, the fracture centers are located uniformly in space, and using a Poisson process, the fractures are generated as disks with a given radius and orientation. The enhanced Baecher model extends the Baecher model by providing the provision of the fracture terminations and more general fracture shapes. The enhanced Baecher model utilizes fracture shapes that are initially generated as polygons with three to sixteen sides. These polygons can be equilateral (aspect ratio of one) or elongate, and the aspect ratio (ratio of the major to minor axis size and orientation) is defined.
It was assumed that the fracture direction obeys a Fisher distribution. The univariate Fisher distribution is the analog of the normal (Gaussian) distribution on a sphere, and it is theoretically justified when the sum of multiple, uncorrelated variations in the rock’s properties and stress conditions cause variations in the fracture orientation. It is relatively easy to fit and easy to explain. However, its major drawback is that it requires symmetric variation of the orientation around the mean pole.
The Fisher distribution is defined by the probability density function (Gottron and Henk, 2021):
where
The Fisher concentration parameter
where
The fracture length exhibits significant fractal characteristics on the outcrop scale, which has also confirmed in many previous studies (Bertrand et al., 2018; Gong et al., 2021). However, the burial depth of the Gaoyuzhuang reservoir is more than 3,000 m, and the outcrop fractures are poorly representative of the in situ fractures in the reservoir after later karstification and other geological processes. We assumed that the fractures between 5 and 30 m play a major role in the migration of the groundwater (Lu et al., 2019; Tang et al., 2020; Wang et al., 2020), and the fracture length has a lognormal distribution. The lognormal distribution is specified by the probability density function (Golder Associates, 2019; Gläser et al., 2020):
where
where
The term fracture intensity can mean different things to different people, including the intensity, density, and frequency. A wide variety of methods are available for quantifying the intensity of fractures, such as the area of the fractures per unit volume (P32), the volume of the fractures per unit volume (P33), the number of fractures (NF), and the number of fractures per unit length of the borehole (P10) (Golder Associates, 2019; Gläser et al., 2020). The linear fracture intensity is expressed as the number of fractures per unit length. P10 is a 1-D measurement, and it is typically recorded as the position of the fracture intersection along a line in space, such as the core axis for boreholes, the well centerline for image log data, and the scanline on a surface outcrop or tunnel wall. We used P10 to describe the fracture density in well D22, which is the most direct and stable method.
The degree of elongation is specified in terms of the aspect ratio, which can either be set as a constant or specified as a uniform distribution. An aspect ratio of 2.5 was used.
3.1.2 Relationship Between Fracture Aperture and Length
The fracture aperture has been demonstrated to control the fluid flow and solute transport. Due to the rough surface of the fracture, the aperture of the fracture is non-uniform and is not the only determined value. In a natural fracture system, it is difficult to describe each of the fracture aperture distributions. Therefore, the maximum aperture (
The determination of the fracture aperture has been a research hotspot during the past few decades. It is generally believed that the fracture aperture follows a lognormal distribution or power-law distribution (Walmann et al., 1996; Renshaw and Park, 1997; Ghanbarian et al., 2019). In nature, larger fractures have larger permeabilities than smaller fractures, so it is reasonable to assume that the fracture aperture is related to the fracture length (Baghbanan and Jing, 2007). However, even if the effects of the shear history, weathering, and filling are ignored, it is difficult to establish the exact quantitative relationship between the aperture and length. Researchers have attempted to obtain a linear (Vermilye and Scholz, 1995) or power-law correlation (Hatton et al., 1994; Renshaw and Park, 1997) between the fracture aperture and length. Olson (2003) proposed a nonlinear power-law relationship:
where
where
A large number of statistical measurements (Olson, 2003; Schultz et al., 2008) have revealed that
3.2 Hydrothermal Coupling Model
3.2.1 Grid Permeability Calculations
Due to the limitation of the scientific computing capability, we could not use the full DFN simulation to perform calculations for hundreds of thousands of fractures. It is most economical and reliable to approximate a reservoir as a porous medium and to coarsen the fracture properties to finite grids.
Oda analysis calculates the permeability and/or hydraulic conductivity tensors in three dimensions and all directions for each cell in a given grid. The Oda tensor represents a simplification of Darcy’s Law for laminar flow through an isotropic porous medium. It works by projecting the fracture’s isotropic permeability (
Oda’s (1985) method begins by considering the orientation of fractures in a grid cell, which is expressed as a unit normal vector
where
For a specific grid cell with known fracture areas
where
Oda’s permeability tensor is derived from
where
However, the permeability estimated using Oda method is often overestimated, and the results calibrated using the actual flow model have a higher reliability.
3.2.2 Hydrothermal Coupled Flow in Porous Media
We used the TOUGH2 EOS1 program to perform the hydrothermal coupling simulations (Pruess, 1991). TOUGH2 has been demonstrated to be effective in geothermal porous media. All of the flow and transport equations have the same structure, and they can be derived based on the principle of the conservation of mass (or energy). The models for fluid and heat flow have been discussed in detail by Pruess (1991) and Pruess et al. (1999):
For Water
For Heat
where
4 Results and Discussion
4.1 Fracture Characteristics From Image Logging
A total of 248 fractures were interpreted through image logging in well D22. The cumulative fracture density distribution map (Figure 3) shows that the fracture density in the reservoir is relatively uniform without obvious stratification characteristics. The same line density (P10) can be used for the construction of the DFN model. The linear density of the fractures (P10) in the entire logging section is 0.3894 m−1.
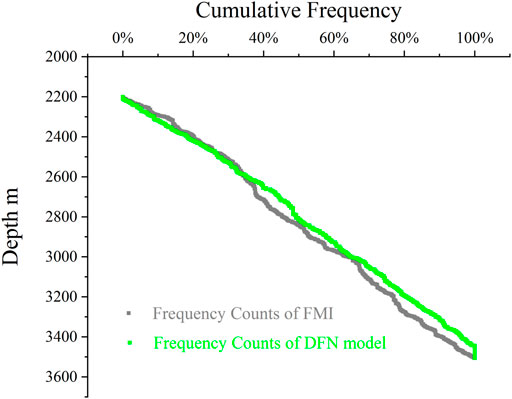
FIGURE 3. Cumulative density distribution of the measured and simulated fractures in well D22.
According to Fisher’s fractal analysis, the fractures near well D22 were mainly divided into two subsets (Figure 4): a nearly east–west trending fracture set (hereinafter referred to as the EW set) and a north–west trending fracture set (hereinafter referred to as the NW set). According to the statistics, there are more fractures in the EW fracture set, with a total of 171 fractures. The relative density is 68.95%, and the P10 value is 0.2685 m−1. The distribution is relatively concentrated. The mean poles (trends and pluges) are 357.9° and 35.1°, and the Fisher concentration is 62.05. The NW fracture set includes 77 fractures, with a relative density of 31.05% and a P10 value of 0.1209 m−1. The distribution is relatively scattered, with mean poles (trends and pluges) of 240.6° and 29.9°. They have different trend distributions, and a Fisher concentration of 26.55. The detailed results of the Fisher analysis are presented in Table 1.
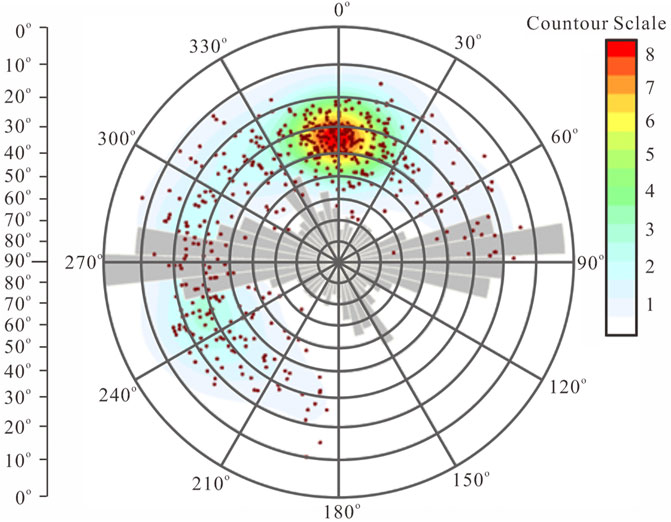
FIGURE 4. Well logging fracture rose diagram and Fisher fractal statistical results for well D22 (the rose diagram represents the fracture trend, and the scattered points are the projection of the trend and the plunge of each fracture).
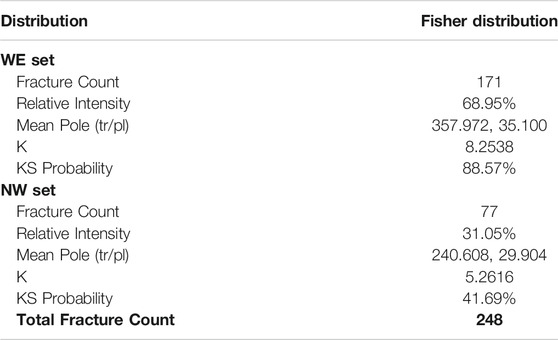
TABLE 1. Fisher fractal statistical results for well D22.
4.2 Three-Dimensional DFN Model and Fracture Parameters
Based on the Fisher’s fractal statistics, it was assumed that the fracture length ranged from 5 to 30 m and obeyed a lognormal distribution (Li et al., 2017b). The average fracture length was 10 m and the variance was 5 m. The length to height ratio of the fractures was 2.5:1. About 30% of all of the logged fractures had flow conductivity. As has been described in Relationship Between Fracture Aperture and Length Section, the aperture of the fracture directly affects its permeability. This section mainly presents the modeling results for
Taking well D22 as the center, the horizontal range was

FIGURE 5. (A) Three-dimensional DFN fracture modeling results the red pieces represent the logged fractures in well D22 and the black line represents well D16. Only 1% of the generated fractures are displayed. Blue denotes the EW set, and orange denotes the NW set; (B) EW vertical profile fracture trace map through D22 and D16; (C) Horizontal fracture trace map at the depth of 3000 m.
In order to determine the coincidence between the random fracture model and the actual fracture network, we drew a rose diagram of all of the fractures, a rose diagram of the fractures passing through well D22, and a cumulative density map of the fractures passing through well D22. Figure 6A shows the statistics of all of the fractures in the model, and Figure 6B shows the statistics of the model through the well fractures. The distributions of these two fracture sets, for both fracture strike and concentration, are very similar to the results of the statistical analysis of the actual logged fractures. The cumulative density distribution of the simulated fractures through the well also has the same slope as the measured value. We believe that the 3D DFN model established using this method adequately represents the actual fracture network.
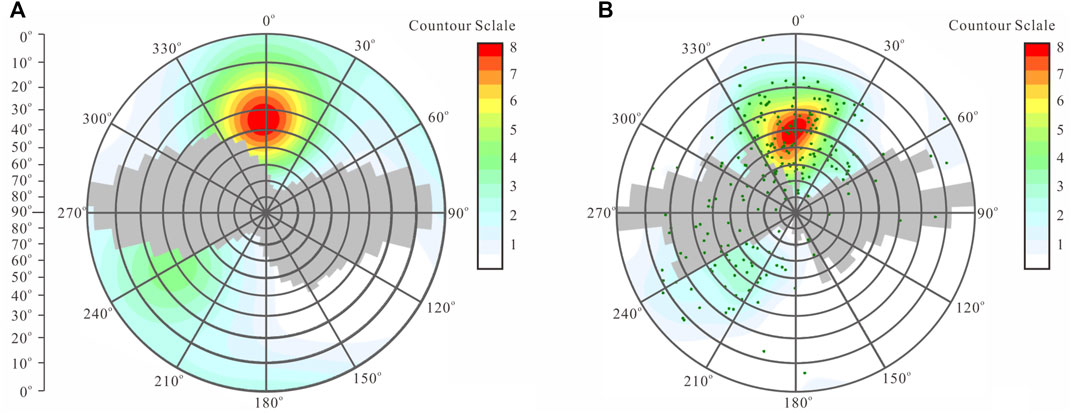
FIGURE 6. (A)Rose diagrams of all of the fractures in the DFN model, and (B)the fractures that cut through well D22.
The purpose of establishing a fracture network model is to predict the reservoir’s flow capacity. Before this, we needed to obtain the parameters for a single fracture, such as the aperture and permeability. Using the process described in Relationship Between Fracture Aperture and Length Section, we obtained the fracture aperture and permeability parameters of the 3D DFN model. In our DFN model, the maximum fracture aperture was 0.9 mm (Figure 7A) and the maximum permeability was

FIGURE 7. (A) Distribution of the fracture aperture, and (B) permeability for the 3D DFN model.
4.3 Prediction of Reservoir Permeability Distribution
We discretized the above range into
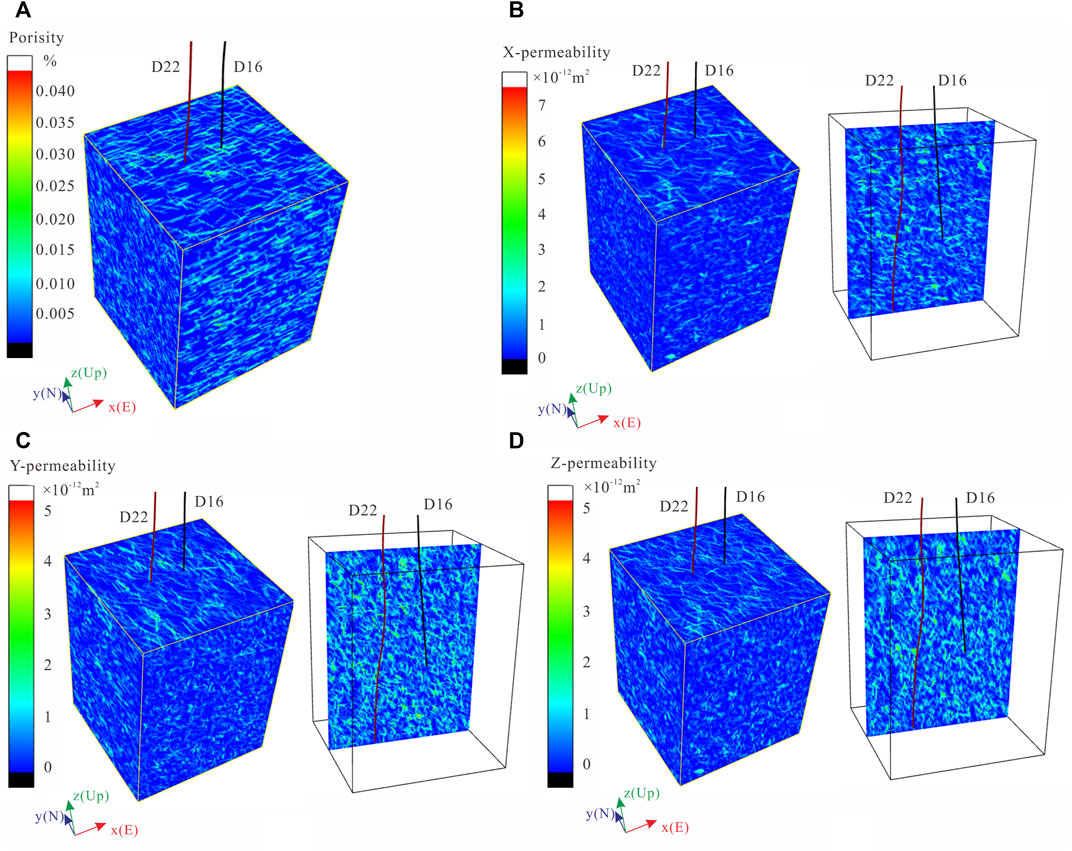
FIGURE 8. (A) Calculated porosity and permeability (B–D) in the reservoir grid. Earch of the permeability map contains a slice through D22 and D16.
4.4 Model Calibration Based on Pumping Test
As previously mentioned, the Oda method tends to overestimate the conductivity of fractures. In terms of the parameters, it can be considered that
Pumping tests for about 190 h were conducted for well D16 in June 2018, including 124 h of continuous pumping and 65 h of water level recovery. The pumping test results were divided into three stages, with durations of 72, 28, and 24 h. Initially, the water level was 101.61 m below the surface, the water level drawdowns during stages 1–3 were 82.09, 55.79, and 27.91 m, respectively, and the corresponding water inflow values were 171.4

FIGURE 9. Fitting of simulated and pumping test water levels in well D16.
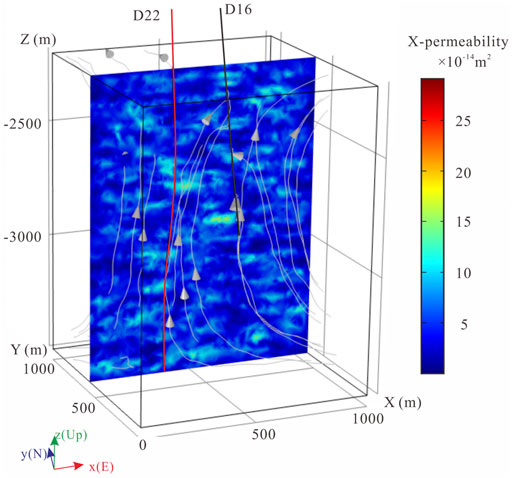
FIGURE 10. Calculated permeability in the x direction and the pumping streamline distribution.
5 Conclusion
The fractures control the convection and mass transfer processes in the reservoir. The Gaoyuzhuang Formation in the Jixian system in the Xiong’an new area has a great development potential. After analyzing the fracture distribution interpreted through image logging of D22 well, it was found that the fractures around the well are affected by the Xushui fault, and the fractures mainly strike east-west, followed by northwest. Most of the fractures are high angle fractures, which is very conducive to the vertical migration of hot water. This is the main reason for the low temperature gradient in the geothermal reservoir.
Via statistical methods, a random 3D DFN model of the Gaoyuzhuang Formation was established for the first time. This model describes the characteristics of the fracture distribution, fracture length, fracture aperture, and fracture permeability in detail. The distributions of the porosity and permeability were obtained through further calculations. The increase in the porosity caused by the fractures can be ignored, but the fractures directly control the distribution of the reservoir’s permeability. In our model, the maximum predicted reservoir permeability reached
The prediction of the fracture aperture is particularly important in the modeling process. It is a function of the fracture length, and the parameter
Data Availability Statement
The raw data supporting the conclusions of this article will be made available by the authors, without undue reservation.
Author Contributions
GY was responsible for numerical simulation and overall paper writing. GW put forward the research idea. FM provides funding and site support. XZ and HZ conducted well logging and pumping tests. JZ and JN gave guidance to fracture modeling.
Funding
The authors acknowledge the financial support provided by National Key R&D Program of China (2019YFB1504101), National Natural Science Foundation of China (41807208), and Natural Science Foundation of Hebei Province (D2021504041).
Conflict of Interest
The authors declare that the research was conducted in the absence of any commercial or financial relationships that could be construed as a potential conflict of interest.
Publisher’s Note
All claims expressed in this article are solely those of the authors and do not necessarily represent those of their affiliated organizations, or those of the publisher, the editors and the reviewers. Any product that may be evaluated in this article, orclaim that may be made by its manufacturer, is not guaranteed or endorsed by the publisher.
References
Ahmad, T., Zhang, H., and Yan, B. (2020). A Review on Renewable Energy and Electricity Requirement Forecasting Models for Smart Grid and Buildings. Sust. Cities Soc. 55, 102052. doi:10.1016/j.scs.2020.102052
Baecher, G. B., Lanney, N. A., and Einstein, H. H. (1977). Statistical Description of Rock Properties and Sampling. (OnePetro). Available at: https://onepetro.org/ARMAUSRMS/proceedings/ARMA77/All-ARMA77/ARMA-77-0400/128963 (Accessed August 18, 2021).
Baecher, G. B. (1983). Statistical Analysis of Rock Mass Fracturing. Math. Geology. 15, 1–20. doi:10.1007/bf01036074
Baghbanan, A., and Jing, L. (2007). Hydraulic Properties of Fractured Rock Masses with Correlated Fracture Length and Aperture. Int. J. Rock Mech. Mining Sci. 44, 704–719. doi:10.1016/j.ijrmms.2006.11.001
Barcelona, H., Maffucci, R., Yagupsky, D., Senger, M., and Bigi, S. (2020). Discrete Fracture Network Model of the Vapor Zone Leakages at the Copahue Geothermal Field. J. Struct. Geology. 140, 1–14. doi:10.1016/j.jsg.2020.104155
Bertrand, L., Jusseaume, J., Géraud, Y., Diraison, M., Damy, P.-C., Navelot, V., et al. (2018). Structural Heritage, Reactivation and Distribution of Fault and Fracture Network in a Rifting Context: Case Study of the Western Shoulder of the Upper Rhine Graben. J. Struct. Geology. 108, 243–255. doi:10.1016/j.jsg.2017.09.006
Cai, X., Zhu, J., Cao, J., and Cheng, X. (2007). 3D Structure and Dynamic Types of the Lithospheric Crust in continental china and its Adjacent Regions. Geology. China 34, 543–557. (in Chinese with English abstract).
Chang, J., Qiu, N., Zhao, X., Xu, W., Xu, Q., Jin, F., et al. (2016). Present-day Geothermal Regime of the Jizhong Depression in Bohai Bay Basin,East China. Chin. J. Geophys. 59, 1003–1016. (in Chinese with English abstract).
Dincer, I. (2000). Renewable Energy and Sustainable Development: a Crucial Review. Renew. Sust. Energ. Rev. 4, 157–175. doi:10.1016/S1364-0321(99)00011-8
Dowd, P. A., Martin, J. A., Xu, C., Fowell, R. J., and Mardia, K. V. (2009). A Three-Dimensional Fracture Network Data Set for a Block of Granite. Int. J. Rock Mech. Mining Sci. 46, 811–818. doi:10.1016/j.ijrmms.2009.02.001
Ghanbarian, B., Perfect, E., and Liu, H.-H. (2019). A Geometrical Aperture-Width Relationship for Rock Fractures. Fractals 27, 1940002. doi:10.1142/S0218348X19400024
Giuffrida, A., Agosta, F., Rustichelli, A., Panza, E., La Bruna, V., Eriksson, M., et al. (2020). Fracture Stratigraphy and DFN Modelling of Tight Carbonates, the Case Study of the Lower Cretaceous Carbonates Exposed at the Monte Alpi (Basilicata, Italy). Mar. Pet. Geology. 112, 104045. doi:10.1016/j.marpetgeo.2019.104045
Gläser, D., Flemisch, B., Class, H., and Helmig, R. (2020). Frackit: a Framework for Stochastic Fracture Network Generation and Analysis. JOSS 5, 2291. doi:10.21105/joss.02291
Golder Associates (2019). FracMan Interactive Discrete Feature Data Analysis, Geometric Modeling and Exploration Simulation. User Documentation.
Gong, H., Wang, B., Liang, H., Luo, Z., and Cao, Y. (2020). Strategic Analysis of China's Geothermal Energy Industry. Front. Eng. Manag. 8, 390–401. doi:10.1007/s42524-020-0106-4
Gong, L., Gao, S., Liu, B., Yang, J., Fu, X., Xiao, F., et al. (20212021). Quantitative Prediction of Natural Fractures in Shale Oil Reservoirs. Geofluids 2021, 1–15. doi:10.1155/2021/5571855
Gottron, D., and Henk, A. (2021). Upscaling of Fractured Rock Mass Properties - an Example Comparing Discrete Fracture Network (DFN) Modeling and Empirical Relations Based on Engineering Rock Mass Classifications. Eng. Geology. 294, 106382. doi:10.1016/j.enggeo.2021.106382
Hatton, C. G., Main, I. G., and Meredith, P. G. (1994). Non-universal Scaling of Fracture Length and Opening Displacement. Nature 367, 160–162. doi:10.1038/367160a0
He, D., Shan, S., Zhang, Y., Lu, R., Zhang, R., and Cui, Y. (2018). 3-D Geologic Architecture of Xiong ’an New Area :Constraints from Seismi Reflection Data. Sci. China Earth Sci. 49, 1207–1222. (in Chinese with English abstract).
Hu, Q., Gao, J., Ma, F., Zhao, Z., Liu, G., Wang, G., et al. (2020). Dynamic Prediction of Geothermal Recoverable Resources in the Rongcheng Uplift Area of the Xiong’an New Area. Acta Geologica Sinica 94, 2013–2025. (in Chinese with English abstract). doi:10.19762/j.cnki.dizhixuebao.2020230
Li, H., Yu, J., Lv, H., and Xiao, P. (2017a). Gravity and Aeromagnetic Responses and Heat-Control Lng Structures of Xiongxian Geothermal Area. Geophys. Geochemical Exploration 41, 242–248. (in Chinese with English abstract). doi:10.11720/wtyht.2017.2.08
Li, S., Zhang, S., Yu, G., and Xu, A. (2017b). An Equivalent Fracture Modeling Method. IOP Conf. Ser. Earth Environ. Sci. 104, 012007. doi:10.1088/1755-1315/104/1/012007
Li, Y., Hou, J., and Li, Y. (2016). Features and Classified Hierarchical Modeling of Carbonate Fracture-Cavity Reservoirs. Pet. Exploration Dev. 43, 655–662. doi:10.1016/S1876-3804(16)30076-3
Lu, K., Bao, Z., Ji, H., Liu, J., Wang, G., and Ma, F. (2019). Characteristics, Main Controlling Factors and Favorable Area Prediction of Karstic Geothermal Reservoirs of the Jixian Wumishan Formation in Xiong an New Area. J. Palaeogeogr. 21, 885–900. (in Chinese with English abstract).
Lu, S.-M. (2018). A Global Review of Enhanced Geothermal System (EGS). Renew. Sust. Energ. Rev. 81, 2902–2921. doi:10.1016/j.rser.2017.06.097
Ma, F., Wang, G., Zhang, W., Zhu, X., Zhang, H., and Yue, G. (2020). Structure of Geothermal Reservoirs and Resource Potential in the Rongcheng Geothermal Field in Xiong’an New Area. Acta Geologica Sinica 94, 1981–1990. (in Chinese with English abstract). doi:10.19762/j.cnki.dizhixuebao.2020217
Nian, T., Wang, G., Cang, D., Tan, C., Tan, Y., and Zhang, F. (2022). The Diagnostic Criteria of Borehole Electrical Imaging Log for Volcanic Reservoir Interpretation: An Example from the Yingcheng Formation in the Xujiaweizi Depression, Songliao Basin, China. J. Pet. Sci. Eng. 208, 109713. doi:10.1016/j.petrol.2021.109713
Oda, M. (1985). Permeability Tensor for Discontinuous Rock Masses. Géotechnique 35, 483–495. doi:10.1680/geot.1985.35.4.483
Olson, J. E. (2003). Sublinear Scaling of Fracture Aperture versus Length: An Exception or the Rule? J. Geophys. Res. 108. doi:10.1029/2001JB000419
Ozkaya, S. I. (2021). Geometry of Layer-Bound Fractures Based on Fracture Density and Aperture-Depth Plots from Resistivity Image Logs of Deviated wells. J. Struct. Geology. 149, 104372. doi:10.1016/j.jsg.2021.104372
Pan, D., Li, S., Xu, Z., Zhang, Y., Lin, P., and Li, H. (2019a). A Deterministic-Stochastic Identification and Modelling Method of Discrete Fracture Networks Using Laser Scanning: Development and Case Study. Eng. Geology. 262, 105310. doi:10.1016/j.enggeo.2019.105310
Pan, S.-Y., Gao, M., Shah, K. J., Zheng, J., Pei, S.-L., and Chiang, P.-C. (2019b). Establishment of Enhanced Geothermal Energy Utilization Plans: Barriers and Strategies. Renew. Energ. 132, 19–32. doi:10.1016/j.renene.2018.07.126
Pang, J. (2018). A Study on the Responsing Mechanism of Karstic Geothermal Reservoir to Large Scale Production and Reinjection in Niutuozhen Geothermal Field.
Pruess, K., Oldenburg, C. M., and Moridis, G. J. (1999). TOUGH2 User’s Guide Version 2. Berkeley, CA (United States: Lawrence Berkeley National Lab. (LBNL. doi:10.2172/751729
Pruess, K. (1991). TOUGH2: A General Purpose Numerical Simulator for Multiphase Fluid and Heat Flow. UNIVERSITY OF CALIFORNIA: Lawrence Berkeley Laboratory.
Qi, J., Yu, F., Lu, K., Zhou, J., Wang, Z., and Yang, Q. (2003). Conspectus on Mesozoic Basins in Bohai bay Province. Earth Sci. Front. 10, 199–206. (in Chinese with English abstract). doi:10.3321/j.issn:1005-2321.2003.z1.028
Qiu, N., Xu, W., Zuo, Y., Chang, J., and Liu, C. (2017). Evolution of Meso-Cenozoic thermal Structure and Therma-Rheological Structure of the Lithosphere in the Bohai Bay Basin, Eastern North China Craton. Earth Sci. Front. 24, 13–26. (in Chinese with English abstract). doi:10.13745/j.esf.2017.03.002
Renshaw, C. E., and Park, J. C. (1997). Effect of Mechanical Interactions on the Scaling of Fracture Length and Aperture. Nature 386, 482–484. doi:10.1038/386482a0
Schultz, R. A., Soliva, R., Fossen, H., Okubo, C. H., and Reeves, D. M. (2008). Dependence of Displacement-Length Scaling Relations for Fractures and Deformation Bands on the Volumetric Changes across Them. J. Struct. Geology. 30, 1405–1411. doi:10.1016/j.jsg.2008.08.001
Tang, B., Zhu, C., Qiu, N., Cui, Y., Guo, S., and Chen, C. (2020). Characteristics of the Karst thermal Reservoir in the Wu Misha nFormation in the Xiong’an New Area. Acta Geologica Sinica 94, 2002–2012. (in Chinese with English abstract). doi:10.19762/j.cnki.dizhixuebao.2020232
Vermilye, J. M., and Scholz, C. H. (1995). Relation between Vein Length and Aperture. J. Struct. Geology. 17, 423–434. doi:10.1016/0191-8141(94)00058-8
Walmann, T., Malthe-Sørenssen, A., Feder, J., Jøssang, T., Meakin, P., and Hardy, H. H. (1996). Scaling Relations for the Lengths and Widths of Fractures. Phys. Rev. Lett. 77, 5393–5396. doi:10.1103/PhysRevLett.77.5393
Wang, G., Li, J., Wu, A., Zhang, W., and Hu, Q. (2018). A Study of the Thermal Storage Characteristics of Gao Yu Zhuang Formation, A New Layer System of Thermal Reservoir in Rong Cheng Uplift Area, Hebei Province. Acta Geoscientica Sinica 39, 533–541. (in Chinese with English abstract). doi:10.3975/cagsb.2018.071901
Wang, G., and Lin, W. (2020). Main Hydro-Geothermal Systems and Their Genetic Models in China. Acta Geologica Sinica 94, 1923–1937. (in Chinese with English abstract). doi:10.19762/j.cnki.dizhixuebao.2020224
Wang, G., Liu, Y., Zhu, X., and Zhang, W. (2020). The Status and Development Trend of Geothermal Resources in China. Earth Sci. Front. 27, 001–009. (in Chinese with English abstract). doi:10.19762/j.cnki.dizhixuebao.2020235
Wang, G., Zhang, W., Lin, W., Liu, F., Zhu, X., Liu, Y., et al. (2017). Research on Formation Mode and Development Potential of Geothermal Resources in Beijing-Tianjin-Hebei Region. Geology. China 44, 1074–1085. (in Chinese with English abstract). doi:10.12029/gc20170603
Wang, S., Zhang, B., Li, Y., Xing, Y., Yuan, W., Li, J., et al. (2021). Heat Accumulation Mechanism of Deep Ancient Buried hill in the Northeast of Gaoyang Geothermal Field, Xiong’an New Area. Bull. Geol. Sci. Tech. 40, 12–21. (in Chinese with English abstract). doi:10.19509/j.cnki.dzkq.2021.0319
Wang, Z., Jiang, G., Zhang, C., Tang, X., and Hu, S. (2019a). Estimating Geothermal Resources in Bohai Bay Basin, Eastern China, Using Monte Carlo Simulation. Environ. Earth Sci. 78, 355. doi:10.1007/s12665-019-8352-7
Wang, Z., Zhang, C., Jiang, G., Hu, J., Tang, X., and Hu, S. (2019b). Present-day Geothermal Field of Xiongan New Area and its Heat Source Mechanism. Chin. J. Geophys. 62, 4313–4322. (in Chinese with English abstract). doi:10.6038/cjg2019M032
Witherspoon, P. A., Wang, J. S. Y., Iwai, K., and Gale, J. E. (1980). Validity of Cubic Law for Fluid Flow in a Deformable Rock Fracture. Water Resour. Res. 16, 1016–1024. doi:10.1029/WR016i006p01016
Wu, A., Ma, F., Wang, G., Liu, J., Hu, Q., and Miao, Q. (2018). A Study of Deep-Seated Karst Geothermal Reservoir Exploration and Huge Capacity Geothermal Well Parameters in Xiongan New Area. Acta Geologica Sinica 39, 523–532. (in Chinese with English abstract). doi:10.3975/cagsb.2018.071104
Zhang, C., Zhang, X., Zhao, J., Ren, Q., Zhang, J., and Hai, Y. (2002). Study and Review on Crust-Mantle Velocity Structure in Bohai Bay and its Adjacent Areas. Acta Seismologica Sinica 24, 428–435+448. (in Chinese with English abstract). doi:10.3321/j.issn:0253-3782.2002.04.011
Zhang, W., Wang, G., Liu, F., Xing, L., and Li, M. (2019). Characteristics of Geothermal Resources in Sedimentary Basins. Geology. China 46, 255–268. (in Chinese with English abstract). doi:10.12029/gc20190204
Keywords: fractures and heterogeneity, the gaoyuzhuang formation, discrete fracture network, hydro-thermal (TH) coupling, The xiong’an new area
Citation: Yue G, Wang G, Ma F, Zhu X, Zhang H, Zhou J and Na J (2022) Fracture Characteristics and Reservoir Inhomogeneity Prediction of the Gaoyuzhuang Formation in the Xiong’an New Area: Insights From a 3D Discrete Fracture Network Model. Front. Earth Sci. 10:849361. doi: 10.3389/feart.2022.849361
Received: 06 January 2022; Accepted: 19 January 2022;
Published: 17 February 2022.
Edited by:
Dawei Hu, Institute of Rock and Soil Mechanics (CAS), ChinaCopyright © 2022 Yue, Wang, Ma, Zhu, Zhang, Zhou and Na. This is an open-access article distributed under the terms of the Creative Commons Attribution License (CC BY). The use, distribution or reproduction in other forums is permitted, provided the original author(s) and the copyright owner(s) are credited and that the original publication in this journal is cited, in accordance with accepted academic practice. No use, distribution or reproduction is permitted which does not comply with these terms.
*Correspondence: Guiling Wang, aWhlZ3dhbmdndWlsaW5nQHNpbmEuY29t