 Song Xu
 Yetang Wang*
 Yuzhe Wang
 Shanzhong Qi
 Min Zhou
- College of Geography and Environment, Shandong Normal University, Jinan, China
Extensive efforts for quantifying regional glacier mass balance in the Qilian Mountains have been made using the geodetic method, but these estimations were rarely extended back to the period before 2000. This study presents glacier mass budgets in the Turgen Daban Range, over the western Qilian Mountain, from 1966/75 to 2020 by means of the digital elevation models generated by the topographic maps and ASTER images. The results show that the glacier mass decreased by −18.79 ± 12.48 m w.e. during the past 50 years. The average mass loss rate is estimated to be −0.19 ± 0.08 m w.e.a−1 for the 1966/75-2006 period and −0.45 ± 0.17 m w.e.a−1 during 2006–2020, respectively, suggesting a remarkable acceleration of glacier mass loss. This may be attributable to the significant increase in air temperature and the insignificant precipitation increase which cannot offset glacier melting caused by increased temperature. Due to the melting and shrinking of glaciers, the area of glacial lakes increases by 2.83 km2 from 1987 to 2020.
1 Introduction
As the products of climate changes, glaciers are highly sensitive to climatic variations and widely considered as a natural climatic indicator (Oerlemans and Reichert 2000). Under the background of global warming, almost all global glaciers are experiencing considerable ice loss, with a large contribution to the current sea level rise (IPCC 2021), and a significant influence on local water resources and hydrological processes in many regions (Gardelle et al., 2013; Kääb et al., 2015; King et al., 2017). Furthermore, the increased glacier ablation raises the risk of glacier-related hazards such as ice avalanche (Gilbert et al., 2018), outbursts of glacier lakes (Kapitsa et al., 2017; Georg et al., 2020), and downstream flooding (Shangguan et al., 2017), which often result in massive economic loss and even life deaths. Thus, it is essential to carefully monitor glacier changes.
Glacier extent and mass balance changes at a certain time span represent quantitative response of glaciers to climatic fluctuations (Zhang et al., 2010). There is a time lag of a decade or longer between climate change and glacier extent (Winkler et al., 2010). Compared with glacier extent, glacier mass balance is a three-dimensional parameter reflecting the change of ice storage and is more sensitive to climate changes (Zemp et al., 2009). Thus, many attempts have been made for monitoring glacier mass balance.
The traditional glaciological method for the determination of mass balance is to observe the deviation between surface accumulation and melting at specific sites by snow stakes or snow pits several times per year, and then to calculate the mass balance of the whole glacier by interpolating these point values (Zemp et al., 2009). This method is simple and highly accurate but cannot be suitable for the estimation of glacier mass balance at the regional or even larger scale, due to the difficulty of field observations in harsh climatic conditions and rugged terrain. The gravimetry method is also used to measure the glacier changes through the determination of gravity anomalies caused by the Earth’s mass variability. In particular, Gravity Recovery and Climate Experiment (GRACE) twin satellites provide the measurements of gravity field at the global scale. It has been confirmed that GRACE-determined gravity changes are sufficient to examine seasonal or interannual mass balance of the ice sheets (Velicogna 2009; Bamber et al., 2018). However, due to their coarse resolution (∼300 km), a very high uncertainty occurs when they are used to calculate mass changes of mountain glaciers (e.g., Jacob et al., 2012). The geodetic method for the estimation of the glacier mass balance is based on the ice elevation changes during different periods from digital elevation models (DEMs) generated by field investigations and aerial and spaceborne observations. With the rapid development of remote sensing technology, a large amount of DEMs are increasingly available, and as a result, the geodetic method is widely used for the calculation of glacier mass balance (Paul et al., 2015; Brun et al., 2017).
Glaciers over the Qilian Mountain are the resource of most rivers over the Hexi Corridor, providing water supplies for more than 4.5 million population, and thus, their variations have caused widespread concern. Various glacier inventories have been performed by means of in situ measurements and remote sensing-based observations (Sun et al., 2014; Chen et al., 2018). However, the current existing studies focused on the estimation of glacier length or area changes, and quantifications of local or regional mass balance variations are still very limited, especially for the temporal coverage (mostly from 2000 onward). The Turgen Daban Range is located at the southwestern Qilian Mountains. While glacier extent changes on this range have recently been investigated, to our knowledge, variability in the overall glacier mass balance is still undocumented. Glacial lakes replenished by meltwater and meteoric water are widely developed at the glacier terminus of the study area. The glacial lakes expand continuously with the inflow of meltwater. Changes in the total area and counts of glacial lakes are as a function of glacier mass balance. Thus, based on the existing topographic maps, ASTER images, Landsat images, and the first and second Chinese Glacier Inventories (CGIs), we use the geodetic method to explore the glacier elevation and mass balance changes in the Turgen Daban Range between 1966/75 and 2020, and their relationship with climate changes are also discussed.
2 Study Area
The Turgen Daban Range (95°14' ∼ 96°39′E, 37° 54' ∼ 38° 36′N) is located in the western branch of the Qilian Mountains, the northeast edge of the Tibetan Plateau (Figure 1). It is about 120 km in width and stretches in the northwest–southeast direction, with an average altitude of 4,694 m a.s.l. The highest point of the range is Chaidan Mount, and its elevation reaches 5,656 m a.s.l. Mountain glaciers are intensively developed at the top of the mountain, which is a center of glaciation over the Qilian Mountains (Shi 2005). Mainly controlled by the westerlies, this region is characterized by the plateau continental climate, with an annual average temperature of −3.5°C and an annual precipitation of 223 mm, respectively. According to the first Chinese Glacier Inventory, there are 285 glaciers covering an area of 389.01 km2, and they belong to the extreme continental type. More than 70% of the glaciers are smaller than 1 km2, and the resulting mean glacier area is only 1.36 km2. The largest glacier is Dunde ice cap, located at the eastern end of the mountain, with an area of about 60 km2 and a mean ice thickness of 140 m (Guo et al., 2015). Its elevations range from 4,580 m. a.s.l to 5,290 m. a.s.l.
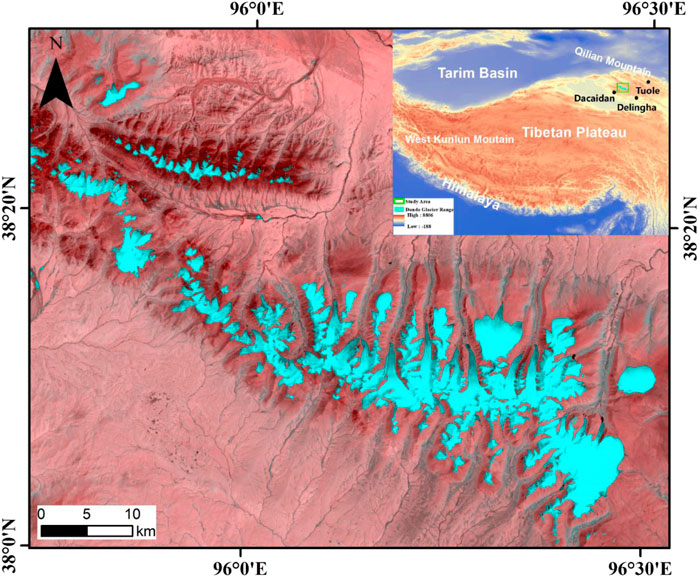
FIGURE 1. Map showing the study area and the distribution of glaciers.
3 Data and Methods
3.1 Data
3.1.1 Topographic Maps
We used twenty-one topographic maps at a scale of 1:50,000, which were produced from aerial stereo pairs during 1966–1975 obtained by the Chinese Military Geodetic Service (CMGS). The references of these maps were the Beijing Geodetic Coordinate System 1954 (BJ54) in horizon and the Yellow Sea 1956 datum (the mean sea level at the Qingdao Tidal Observatory in 1956) in verticality, respectively. The coordinate system of topographic maps was converted to World Geodetic System 1984 (WGS 1984) and Earth Gravity Model 1996 (EGM96) by using the seven-parameter transformation method. The digitalized contours and elevation points were used to construct a triangulated irregular network (TIN), which was then interpolated to a DEM at a resolution of 30 m, called TOPO DEM.
As reported by the Standardization Administration of the People’s Republic of China (General Administration of Quality Supervision Inspection and Quarantine, 2008), the topographic maps have a vertical accuracy of ± 3 m for the regions with a slope of <2°, ± 5 m for the regions with a slope of 2°–6°, ±8 m over the regions with a slope of 6–25°, and ±14 m over the regions with a slope of >25°, with respect to the measured elevation of ground control points (GCPs). We calculated the mean slope of glacierized areas in the Turgen Daban Range (∼15.9°) by means of the TOPO DEM, and thus, the vertical accuracy of the TOPO DEM is considered to be ±8 m.
3.1.2 Advanced Spaceborne Thermal Emission and Reflection Radiometer Digital Elevation Model
The Advanced Spaceborne Thermal Emission and Reflection Radiometer (ASTER) is a multispectral imager launched on the NASA Terra satellite in December 1999. The ASTER sensor covers a spectral range of 14 bands from visible light to thermal infrared. The ASTER sensor provides multispectral imagery between 83°N and 83°S, covering nearly 99% of the global land surface. The visible and near-infrared telescope (VNIR) subsystem includes two independent telescopes, which have the 3N (nadir) and 3B (backward) bands to facilitate the generation of stereo images for creating DEMs.
We use ASTER Level 1A images in 2006/2020 with a resolution of 15 m to generate ASTER DEMs (Table 1). The ASTER Level 1A images consist of instrument data without geometric and radiometric corrections, maintaining the original resolution. These images are accompanied by relevant correction coefficients without map projections. The Level 1A data product also consists of metadata, cloud coverage table, auxiliary data, VNIR data group, SWIR data group, and TIR data group. In order to obtain DEMs from stereoscopic images of ASTER Level 1A, we first extract 3N and 3B band images from ASTER HDF file, and the projection coordinate system is defined as Asia North Albers Equal Area Conic. The control points and tie points are collected to generate epipolar images, which are used to automatically extract DEM. The DEMs generated from ASTER stereoscopic pair in the study area were highly consistent with the TOPO DEM for the stable terrain, which suggests a relatively high accuracy of the produced ASTER DEM.
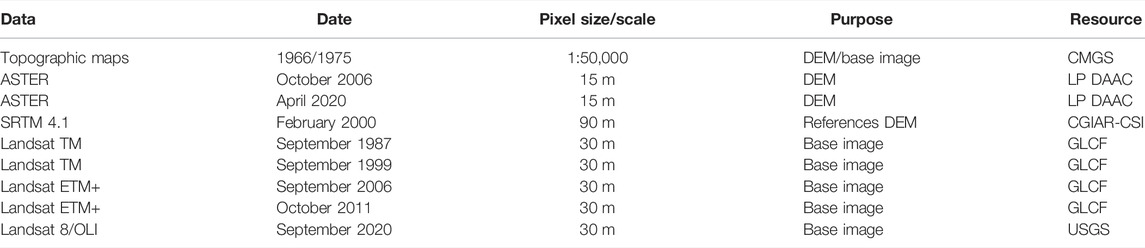
TABLE 1. List of data for the glacier change assessment over the Turgen Daban Range.
3.1.3 Landsat Images
Since the first Landsat satellite was launched in 1972, the Landsat Program has provided abundant satellite image data for the investigation of glacier changes (Jiang et al., 2013). To reduce the interference of snow and cloud cover, we tried to select the images with less cloud and snow, and small mountain shadow over the snow melting period. At last, five Landsat-TM/ETM+/OLI images were selected to extract glacier boundaries during different periods, which are 1 TM image in 1987; three ETM + images in 1999, 2006, and 2011, respectively; and one OLI image in 2020. Their spatial resolutions are 30 m. The product has high accuracy through systematic radiation, geometric, and terrain corrections. We also co-register these images to topographic maps using 20–35 GCPs. Before extracting the glacier boundaries, the coordinates of topographic maps and images are normalized, and their coordinate systems are defined in Asia North Alberts Equal Area Conic projection and WGS 84 ellipsoid. Glacier boundaries in 1966 are digitized from the topographic maps. These images are combined using bands 4, 5, and 7, and the glacier field is indicated by blue color after band combination. By means of visual interpretation, the area and boundary of glaciers in 2006 and 2020 are extracted and corrected by comparing with the first Chinese Glacier Inventory to improve interpretation accuracy. When extracting glacier boundaries by manual visual interpretation, the accuracy of all image interpretations is limited to one pixel.
3.1.4 Meteorological Data
The meteorological records are derived from the weather stations of Tolle (38.80°N, 98.42°E; 3,368.3 m a.s.l), Dachaidan (37.85°N, 95.37°E; 3,174.2 m a.s.l), and Delingha (37.37°N, 97.37°E; 2,982.4 m a.s.l). In this study, we use the daily air temperature and precipitation data, spanning from 1961 to 2018.
3.2 Methods
3.2.1 DEM Co-Registration
Due to the differences between the acquisition methods and processing processes of DEMs, there are errors caused by the horizontal and vertical offsets between different DEMs. In order to ensure the accuracy of the DEM differencing results, it is necessary to correct the spatial matching errors of DEMs from different sources. We first perform the co-registration of DEM data sets before calculating the glacier elevation change. Nuth and Kaab (2011) noted that there is an obvious trigonometric relationship between elevation difference and topographic slope and aspect:
where dh and
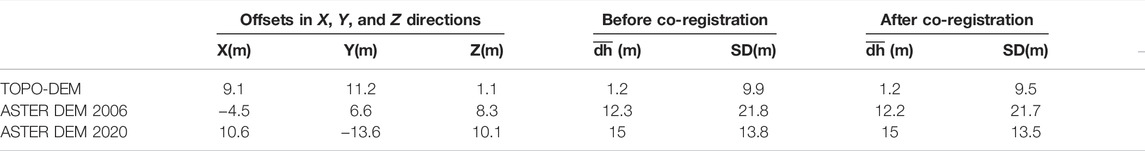
TABLE 2. Offsets in X, Y, and Z directions of the DEM dataset and the uncertainty in DEMs before and after co-registration.
Considering the zoning problem of Mercator projection, all DEMs are converted to the Albers projection of WGS84 reference ellipsoid and are resampled to 30 m resolution. Before co-registration, elevation deviations of 5 and 95% in quantile are limited to eliminate the most extreme outliers. TOPODEM and ASTER DEM are co-registered using SRTM4.1. The offset of the stable off-glacier terrain is calculated by the minimum standard deviation of elevation difference between the two DEMs (Berthier et al., 2006). In order to minimize the spatial matching error, the process is iterated to achieve the final solution until the standard deviation of dh decreasing by less than 2% or the offset less than 1 m.
3.2.2 Correction of Terrain Curvature
The difference in original resolution of DEM data sets leads to vertical deviation between data. Gardelle et al. (2013) have shown that vertical biases caused by resolution strongly correlate with the maximum curvature, and the biases exist no matter whether the terrain is covered with glaciers or not. Therefore, the robust relationship between the vertical biases in off-glacier terrain and the maximum curvature of terrain are used to correct the vertical biases of glacial regions caused by terrain curvature in this study.
3.2.3 Outlier Filtering and Data Gap Filling
Elevation, pixel, low image contrast, terrain slope, aspect and curvature, image noise, and interpolation methods affect the quality and accuracy of remote sensing data (Carlisle 2005; Hoehle and Hoehle 2009; Gardelle et al., 2012). In order to reduce the uncertainty of the calculation of elevation changes, the outliers should be excluded before the determination of the glacier surface elevation changes. First, we exclude the pixels with absolute elevation change over 100 m, which may be stereo matching errors caused by cloud cover and low radiometric contrast (Maurer et al., 2016). Second, steep slopes and shadows often result in stereo matching errors (Pieczonka et al., 2011; Maurer and Rupper 2015), and the deviation is positively correlated with slope changes. Therefore, the pixels with slopes >30° are omitted following Pieczonka et al. (2011), and this also removes the nunataks and rock cliffs in the accumulation regions, which were easily wrongly defined as glacier ice (Maurer et al., 2016). Third, the pixels with absolute elevation change values of more than three standard deviations in each 100 m altitude band are excluded. Due to low radiation contrast, the DEMs created by topographic maps have errors and gaps in the accumulation regions. According to Holzer et al. (2015), we only include the pixels within the quantile range of 31.7 and 68.3% elevation changes in the accumulation area.
As outlier filtering results in a large number of data gaps, it is necessary to fill the data gaps when assessing the volume changes over the entire glacier field. Some methods have been used to fill in missing elevation change data, such as linear interpolation method, a polynomial fit of the elevation changes by the elevation band, and filling with an average value from a surrounding neighborhood. McNabb et al. (2019) compared these methods and concluded that linear interpolation and the local mean hypsometric method are more suitable for filling the voided data when estimating regional glacier total volume changes. The missing data is filled with the average value of elevation changes of the appropriate 100 m elevation band.
3.2.4 Glacier Extent Delineation and Geodetic Mean Elevation Change Calculation
The glacier outlines are extracted by visual interpretation to ensure the accuracy. We visually interpret the glacier outlines in 1966 by using the topographic maps corrected by aerial images, and the interpretation results are corrected in combination with the data of the first China Glacier Inventory to reduce the interpretation error caused by mountain shadow and seasonal snow. Glacier boundaries in 2006 and 2020 are manually revised by visual interpretation using Landsat ETM+/OLI and ASTER images.
To estimate the mass balance of the glaciers, the elevation change value of each grid pixel was multiplied by the pixel area of DEM and then summed. Then the variation in the glacier surface elevation was determined by dividing the obtained change in glacier volume by the glacier area. The conversion of elevation change to mass balance needs to consider the combined ice and snow density. We used a constant density of 850 ± 60 kg m−3 to convert the glacier elevation changes to glacier mass balance (Huss 2013).
3.2.5 Uncertainty Assessment
The uncertainty of elevation change comes from data source errors and DEM elevation relative error. The standard deviation (SD) of mean elevation change in off-glacier areas can be used as an estimate of the uncertainty, which overestimates the actual uncertainty by SD due to ignoring of the influence of spatial autocorrelation between DEMs. Therefore, the uncertainty of elevation change is estimated by the standard deviation of the non-glacierized area, the number of pixels with independent elevation change measurements (Paul et al., 2015) (considering spatial autocorrelation) and the mean absolute difference (Braun et al., 2019) (MAD) between the median elevation changes on and off-glacier:
The nz value represents the number of independent pixel measurements. As the adjacent pixels have strong spatial autocorrelation, the spatial autocorrelation distance should be set in the calculation to eliminate its influence on error evaluation by the following formula:
where nb represents the total number of independent measurements in the given altitude band, r is the pixel resolution (∼30 m), and d is the distance of spatial autocorrelation. The spatial autocorrelation distance may be different with different spatial resolution. Koblet et al. (2010) and Bolch et al. (2011) assumed that the spatial auto-correlation of 20 pixels is negligible. Gardelle et al. (2013) identified auto-correlation distances of 492 ± 72 m for DEMs with 40 m spatial resolution, determined using Moran’s I autocorrelation index, corresponding to nine study sites in the Pamir–Karakoram–Himalaya. Koblet et al. (2010) chose a decorrelation length of 100 m for the DEMs with 5 m spatial resolution. In this study, a conservative value of 600 m was used as the spatial autocorrelation distance, which was determined by semi-variogram analysis (Rolstad et al., 2009; Paul et al., 2015).
Error resulting from the missing pixel is filled by the extrapolation method. The uncertainty of extrapolation (Ue) is also calculated. Maurer et al. (2016) and Maurer et al. (2019) regarded the maximum of the SDs of glacier elevation change in any 100 m elevation band as Ue.
Glacier boundary error cannot be ignored in the estimation of glacier elevation changes, and the uncertainty of glacier extent is estimated according to the formula proposed by Braun et al. (2019):
where Ua is the error of glacier area and P/A is the perimeter-area ratio. Paul et al. (2013) made a comparative analysis of the accuracy of glacier boundary extraction from the remote-sensing image and found that the parameter of perimeter area ratio was a constant value of 5.03 km−1. Then, this parameter was applied to the estimation of uncertainty in glacier areas by Braun et al. (2019). During the conversion from volume to mass, we assume an error of ±60 kg m−3 on the density conversion factor (Huss 2013), that is ±7% of the elevation changes, which was also considered in the overall uncertainty estimate.
The final uncertainty of glacier mass balance is calculated based on systematic and random uncertainty in glacier elevation changes (Uh), the extrapolation uncertainty (Ue), the area uncertainty (Ua), and the ice density error (Ud):
where △M represents the mass balance estimate, △h is the estimated elevation change, a is the glacier area, and
4 Results
There are 285 glaciers with total area of 389 ± 7.9 km2 over the Turgen Daban Range in 1966/75, and they have shrunk to 327.2 ± 6 km2 until 2020, with the shrinkage rate of 0.29% a−1. The area shrinkage rate is estimated to be 0.26% a−1 during 1966–2006, and 0.38% a−1 during 2006–2016, respectively. This suggests an accelerated shrinkage of glaciers from 2006 onward.
We calculate the changes of the surface elevation and mass balance of glaciers over the Turgen Daban Range during the past 50 years through DEM differencing. The glaciers experience significant surface lowering during the period of 1966/75-2020 (Figure 2, Figure 4). The average surface elevation decreases by -12.62 ± 10.08 m from 1966/75 to 2006, and the resulting average elevation change rate is -0.30 ± 0.25 m a−1 (Figure 3A, Figure 4). The mean elevation of glacier surface decreases by −7.65 ± 5.12 m over 2006-2020, and the mean surface lowering rate increases to −0.51 ± 0.34 m a−1 (Figure 3B). This indicates that the glacier surface lowering rate has accelerated since 2006. We estimate that the glacier mass changes are −10.73 ± 8.70 m w.e. and −6.50 ± 4.45 m w.e. for the periods of 1966/75-2006 and 2006-2020, respectively, corresponding to annual mass loss rates of −0.26 ± 0.21 m w.e. and −0.43 ± 0.30 m w.e. for these two periods.
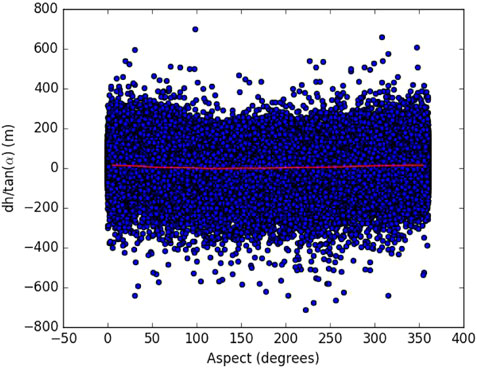
FIGURE 2. Scatterplot of slope standardized elevation differences between TOPODEM and SRTM DEM after co-registration.
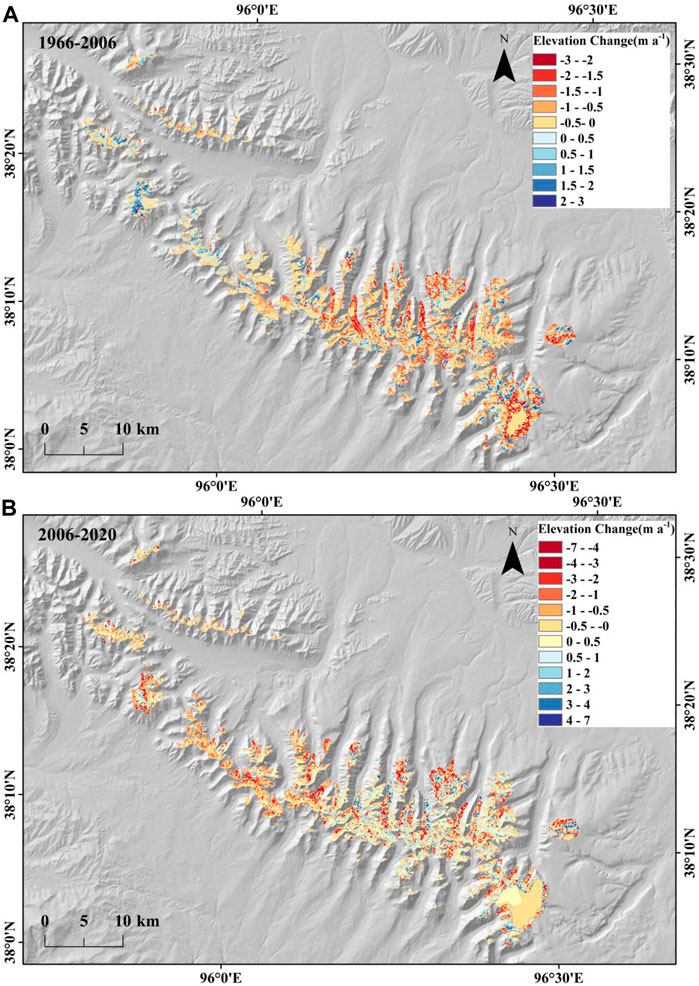
FIGURE 3. Surface elevation changes of glaciers over the Turgen Daban Range between 1966 and 2006 (A) and from 2006 to 2020 (B).
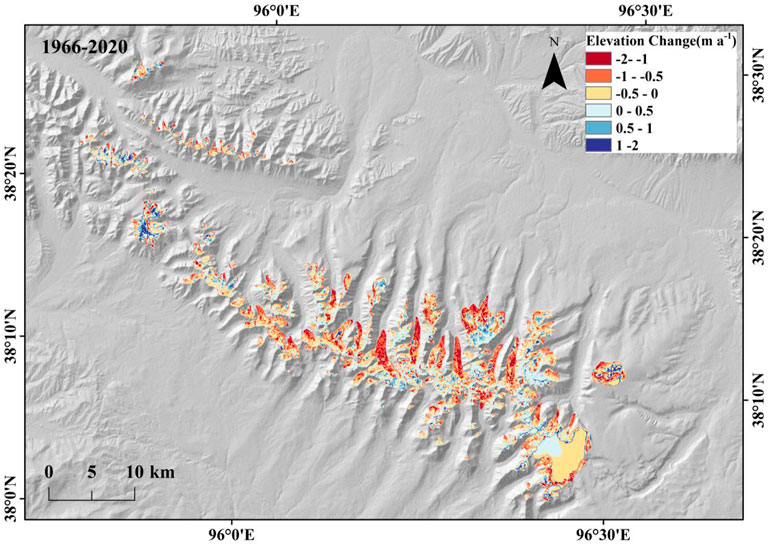
FIGURE 4. Surface elevation changes of glaciers over the Turgen Daban Range from 1966 to 2020.
The DEM differencing for the three time spans 1966/75 to 2006, 2006 to 2020, and 1966 to 2020 show spatiotemporally heterogeneous glacier surface elevation changes in the Turgen Daban Range. The strongest negative elevation change occurs in the lower ablation area (Figure 5). The mean elevation of glacier terminus increases by 142 m from 1966/75 to 2020. For the same period, 77% of the glacier surface lowers. The mean mass loss rate of north-facing glaciers (−0.28 ± 0.21 m w.e.a−1) is slightly higher than that of south-facing glaciers (−0.22 ± 0.21 m w.e.a−1) during the period 1966–2006. However, during 2006–2020, the mean mass loss rate of north-facing glaciers (−0.39 ± 0.30 m w.e.a−1) becomes much lower than that of south-facing glaciers (−0.53 ± 0.30 m w.e.a−1). In recent 15 years, the glacier mass loss has been further intensified, and the glacier changes of the north- and south-facing glaciers are obviously different.
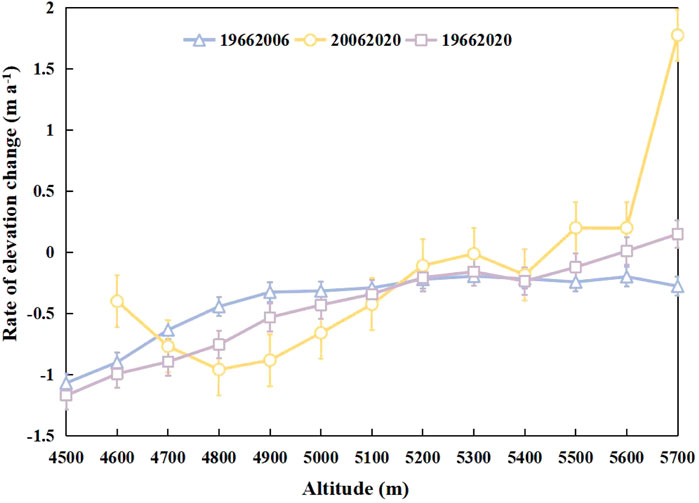
FIGURE 5. Averaged glacier elevation change rate for each 100-m elevation band.
As the largest flat-topped glacier in the Qilian Mountains, Dunde ice cap experiences a mass loss of −0.28 ± 0.23 m w.e.a−1 during 1966–2020, which is slightly lower than the averaged mass loss of the glaciers. Different from the accelerating loss of the overall glacier mass since 2006, the mass balance for Dunde ice cap is estimated to be −0.30 m w.e.a−1 for the 1966-2006 period, higher than that of the 2006-2020 period (−0.21 m w.e.a−1).
5 Discussion
5.1 Climate Changes
Air temperature and precipitation are the main meteorological factors affecting glacier changes. Similarly, the observed glacier mass loss on the Turgen Daban Range during 1966–2020 may be associated with regional air temperature and precipitation changes. Here we collected the data of three meteorological stations, i.e., Tolle, Dachaidan and Delingha, which are close to glacier filed, to analyze the climate changes from 1961 to 2018 in the study area (Figure 6). The averaged records from the three meteorological stations show a warming trend during 1961–2018, with the increasing rates of 0.40°C decade−1, 0.52°C decade−1, and 0.45°C decade−1 at the stations of Tolle, Dachaidan, and Delingha, respectively. In summer (June-August), the warming rates of the three meteorological stations are 0.37°C decade-1, 0.45°C decade-1, and 0.26°C decade-1 (p < 0.05), respectively, which are lower than the corresponding decadal trends of mean annual air temperature. In winter (December-February), the averaged air temperature showed a more significant warming trend, with warming rates of 0.58°C decade-1, 0.74°C decade-1, and 0.82°C decade-1 (p < 0.05), respectively (Figure 6A). Rising temperature causes enhanced melting of glaciers, and increased snowfall leads to mass accumulation. Under the background of rising temperature, the surface elevation of glaciers over this mountain range decreased continuously and the mass loss intensified. As winter air temperature increases, the glacier active layer warms up quicker, resulting in the prolonged melting period of glacier surface. Due to elevated temperature of glacier surface layer, it takes less energy to melt the same amount of ice and snow than before, which enhances the thinning of glaciers (e.g., Wang et al., 2009). From 1961 to 2018, annual precipitation presents the upward trends at the Tolle (16.4 mm decade−1, p > 0.05) and Delingha (25.3 mm decade−1, p > 0.05) Stations, but the trends are not significant. No significant trend is observed at Dachaidan (5.09 mm decade−1, p > 0.05) for the same period (Figure 6B). According to the study on mass-balance sensitivity experiment at Laohugou No. 12 Glacier, if the temperature increased by 1.5°C, which requires a 30% increase in total precipitation to offset the glacial ablation caused by temperature rising (Chen et al., 2017). Furthermore, temperature is considered to be an important factor controlling the precipitation type. Within a certain air temperature range, rising temperatures can result in decrease in snowfall, and some snow is converted into rain. Under the warmer climate, precipitation and amount of rainfall generally show increasing trends in the Tibetan Plateau over 1960-2014, but the snowfall has decreased in the eastern and northeastern Tibetan Plateau (Deng et al., 2017). The decrease in snowfall causes the decline in the glacier’s surface albedo (Wang et al., 2016), which can speed up glacier melting. Thus, over the Turgen Daban Range, glaciers are more sensitive to regional warming, and the snow accumulation caused by increased precipitation cannot compensate for the melting from increased temperature. Relative to the 1966-2006 period, glacier mass loss from 2006 to 2020 is higher, which may be mainly related to increased summer temperature of 1.21°C, 1.58°C, and 1.12°C over 2006-2020 than over 1966-2006 at Tolle, Dachaidan, and Delingha Stations, respectively.
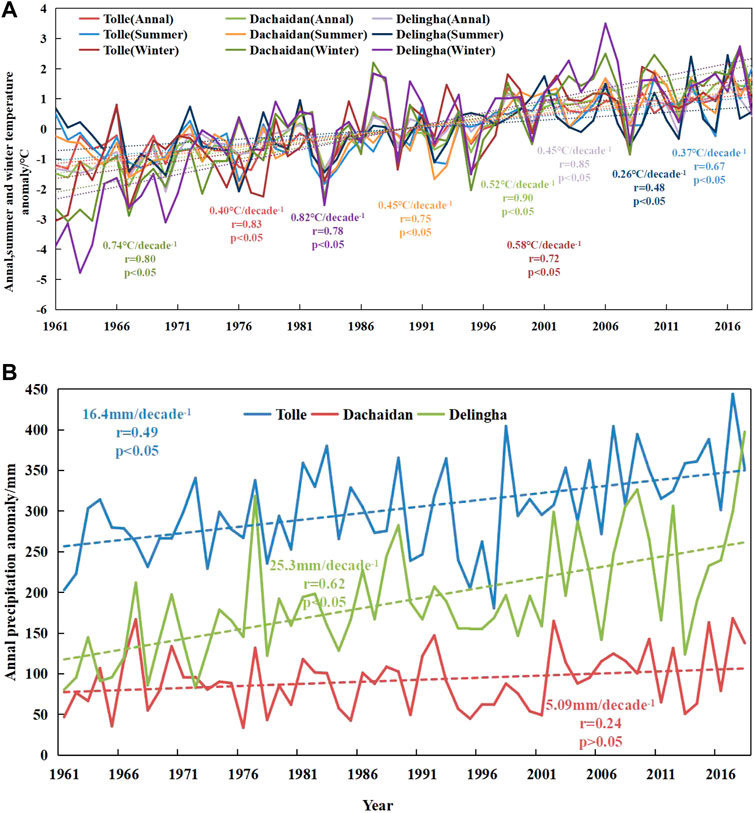
FIGURE 6. Time series of (A) summer, winter and annual mean air temperature and (B) annual precipitation from the three meteorological stations nearest to the Turgen Daban Range from 1966 to 2020.
5.2 The Relationship Between Glacier Surface Mass Balance and Terrain Factors
Terrain factors affect the distribution of water and heat, and cause the redistribution of mass and energy, thus affecting the melting and accumulation of glaciers. In this study, elevation, slope, and aspect data are extracted from SRTM DEM. Then, we calculate the glacier mass balance for the eight orientations: north, northeast, east, southeast, south, southwest, west, and northwest for the 1966/75-2006 and 2006-2020 periods. We also estimate the glacier mass balance in the bins of 5° slope and 500 m elevation, respectively.
Figure 7 shows the glacier mass loss in each aspect over 1966/75-2006, 2006-2020, and 1966-2020, respectively. Obviously, the glaciers in the eight aspects are in a state of mass loss for three periods. Furthermore, the higher mass loss rate happened over 2006-2020. During 1966/75-2006, the loss rates of glaciers in the east and north aspects were higher than those in the west and south aspects, and the highest rate (−0.31 ± 0.21 m w.e.a−1) occurred in the north aspect (Figure 7A). For the 2006-2020 period, the loss rates in all aspects showed an accelerated trend, especially in the south, southwest, and west, reaching −0.56 ± 0.30 m w.e.a−1, −0.83 ± 0.30 m w.e.a−1, and −0.58 ± 0.30 m w.e.a−1, respectively (Figure 7B). From 1966 to 2020, the glacier elevation in each slope direction is declining, and the glacier reserves are constantly losing, but the loss degree is different. The mass losses in the east, southeast and south aspects are the strongest, which are −0.38 ± 0.23 m w.e.a−1, −0.41 ± 0.23 m w.e.a−1, and −0.37 ± 0.23 m w.e.a−1, respectively (Figure 7C). The aspects of glacier mass loss vary obviously. On the whole, the mass loss of the glacier centered on the southeast is the strongest. This distribution may be due to the strong solar radiation on the southeast slope and more precipitation on the northwest slope affected by the westerly circulation (Li 2018).
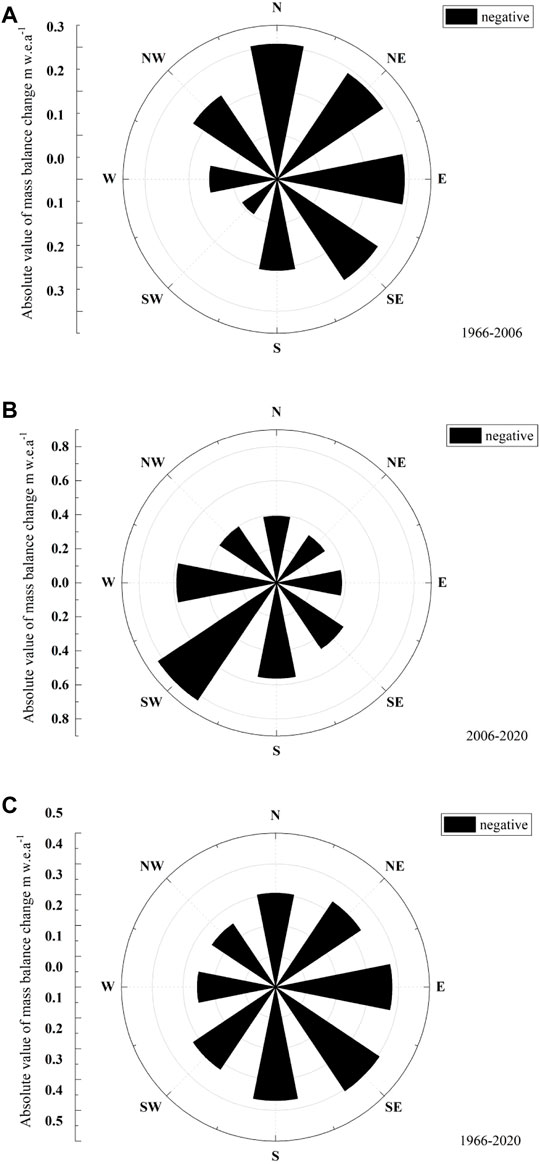
FIGURE 7. Changes in mass balance in different aspects for the (A) 1966/75-2006, (B) 2006-2020 and (C) 1966/75-2020 periods.
Glaciers in the Turgen Daban Range are mainly distributed in the slopes below 45° and peak at 5–20°. There are similar patterns of glacier mass loss in different slopes for the 1966-2006, 2006-2020, and 1966-2020 periods. Glacier mass balance positively correlates with slope. With the increase in slope, the glacial mass loss rate gradually decreases, and the mass loss is strongest between 0° and 30°.
5.3 Changes in the Glacial Lakes
In the process of glacier retreat, a lake basin is easily formed at glacier terminus, which is replenished by ice melt water and glacier ice collapse, and hence, a glacier lake is formed (Figure 8). The glacial lake connected with glacier terminus accelerates the melting of the glacier due to the interaction between the lake water and the glacier ice, and meltwater flows into the glacial lake to expand its area. Some glacial lakes lose supply of meltwater due to the rapid retreat of glacier terminus, and the area of the glacial lake will gradually shrink. In this study, the boundary of glacial lake is manually drawn by visual interpretation based on Landsat images, and the changes of the glacial lake area in different periods are analyzed. The glacial lake area is only 0.24 km2 in 1987. Due to the rapid glacier melting, there are 20 glacier lakes covering 1.33 km2 in area in 1999. From 1997 to 2007, in spite of the decrease in the count of glacier lakes, the total area still increases, and reaches 1.64 km2. In 2011, the glacier area slightly decreases to 1.51 km2. However, from 2011 to 2020, the count and total area of glacial lakes rise rapidly. Until 2020, the count and total area reach 58 and 3.07 km2, respectively. From 1987 to 2020, both the total area and quantity of glacial lakes show the increasing trends (Figure 9). Glacial lakes are highly sensitive to climate change and glacier change, under the background of the increase in meltwater caused by temperature rise, the glacial lake in Turgen Daban Range shows an expanding trend. The increase in the number and area of glacier lakes reflects that glaciers on the Turgen Daban Range have been losing their mass over the last 50 years.
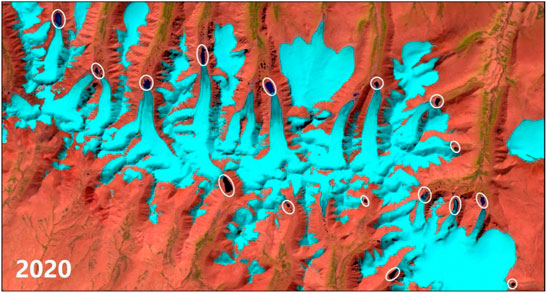
FIGURE 8. Distribution of glacial lakes in the Turgen Daban Range in 2020.
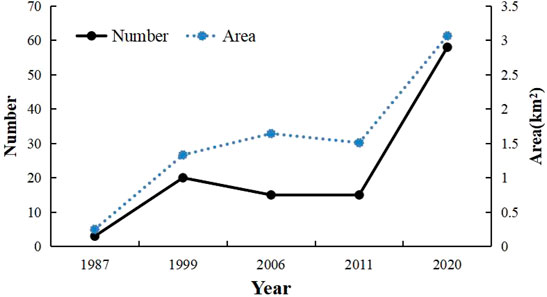
FIGURE 9. Variations of the counts and areas of glacial lakes in the Turgen Daban Range.
5.4 Uncertainty Analysis
Based on the analysis of the mass balance estimation results of the Turgen Daban Range, we find that the uncertainty of glacier mass balance estimation varies greatly among different data sources in the same region. We analyze the impact of uncertainty on the estimation of glacier mass balance. There are many source of uncertainty, such as the difference of spatial resolution of different data, noise in remote sensing imagery, errors generated in extraction of glacier boundary and co-registration, and selection of uncertainty estimation methods.
ASTER DEM used in this study is optical stereo imagery. Steep slopes surrounding this glacier and clouds cover affect the data accuracy and the estimation results. Since the vertical deviation of the ice-free region cannot fully reflect the vertical deviation of glacier, we add the average absolute difference (ADD) between the median elevation change on- and off-glacier into the uncertainty estimation (Berthier and Brun 2019). DEM outlier filtering and null interpolation methods also lead to errors in glacier mass balance estimation. When calculating the final uncertainty, the uncertainty of the final mass balance is the root of the sum of each squared error term, including systematic and random uncertainties in the glacier elevation changes, as well as the uncertainty of the ice density hypothesis.
6 Conclusion
In this study, topographic maps and ASTER DEMs are used to examine variability in the surface elevation and mass balances of glaciers in the Turgen Daban Range of Qilian Mountains over the past 50 years by using the geodetic method. The results show that the mass loss of glaciers during 1966/75-2020 is −22.10 ± 14.53 m w.e., indicating a significant glacier mass loss. The glacial mass loss rate has increased recently, from the mean glacier mass change rate of −0.26 ± 0.21 m w.e.a−1 over 1966/75-2006, and −0.43 ± 0.30 m w.e.a−1 over 2006–2020. The significant glacier mass loss is closely associated with the rising summer air temperature in the study area, which results in glacier melting. Despite the increased annual precipitation, it is not enough to offset the glacier mass loss caused by temperature increase. Furthermore, local terrain and development of glacier lakes also contribute to the negative glacier mass balance during 1966/75-2020.
Data Availability Statement
The raw data supporting the conclusions of this article will be made available by the authors, without undue reservation.
Author Contributions
YW developed the program for DEM automatic co-registration. MZ generated and processed the ASTER DEMs. Song Xu computed the geodetic mass balances for the Turgen Daban Range and for the period from 1966/1975 to 2020. SQ performed the analysis between glacier mass changes and climate. Song Xu and Yetang Wang led the writing of the manuscript. All co-authors contributed to the manuscript. LD and AD performed the analysis between glacier mass changes and climate.
Funding
This work was supported by the National Natural Science Foundation of China (41830644 and 41971081), the National Key Research and Development Program of China (2020YFA0608202), the Strategic Priority Research Program of the Chinese Academy of Sciences (XAD19070103), and the Project for Outstanding Youth Innovation Team in the Universities of Shandong Province (2019KJH011).
Conflict of Interest
The authors declare that the research was conducted in the absence of any commercial or financial relationships that could be construed as a potential conflict of interest.
Publisher’s Note
All claims expressed in this article are solely those of the authors and do not necessarily represent those of their affiliated organizations, or those of the publisher, the editors and the reviewers. Any product that may be evaluated in this article, or claim that may be made by its manufacturer, is not guaranteed or endorsed by the publisher.
References
Bamber, J. L., Westaway, R. M., Marzeion, B., and Wouters, B. (2018). The Land Ice Contribution to Sea Level during the Satellite Era. Environ. Res. Lett. 13 (6), 063008. doi:10.1088/1748-9326/aac2f0
Berthier, E., Arnaud, Y., Kumar, R., Ahmad, S., Wagnon, P., and Chevallier, P. (2007). Remote Sensing Estimates of Glacier Mass Balances in the Himachal Pradesh (Western Himalaya, India). Remote Sensing Environ. 108 (3), 327–338. doi:10.1016/j.rse.2006.11.017
Berthier, E., and Brun, F. (2019). Karakoram Geodetic Glacier Mass Balances between 2008 and 2016: Persistence of the Anomaly and Influence of a Large Rock Avalanche on Siachen Glacier. J. Glaciol. 65 (251), 494–507. doi:10.1017/jog.2019.32
Bolch, T., Pieczonka, T., and Benn, D. I. (2011). Multi-decadal Mass Loss of Glaciers in the Everest Area (Nepal Himalaya) Derived from Stereo Imagery. The Cryosphere 5 (2), 349–358. doi:10.5194/tc-5-349-2011
Braun, M. H., Malz, P., Sommer, C., Farías-Barahona, D., Sauter, T., Casassa, G., et al. (2019). Constraining Glacier Elevation and Mass Changes in South America. Nat. Clim Change 9 (2), 130–136. doi:10.1038/s41558-018-0375-7
Brun, F., Berthier, E., Wagnon, P., Kääb, A., and Treichler, D. (2017). A Spatially Resolved Estimate of High Mountain Asia Glacier Mass Balances from 2000 to 2016. Nat. Geosci 10 (9), 668–673. doi:10.1038/NGEO2999
Carlisle, B. H. (2005). Modelling the Spatial Distribution of DEM Error. Trans. GIS 9 (4), 521–540. doi:10.1111/j.1467-9671.2005.00233.x
Chen, J., Kang, S., Qin, X., Du, W., Sun, W., and Liu, Y. (2017). The Mass-Balance Characteristics and Sensitivities to Climate Variables of Laohugou Glacier No. 12, Western Qilian Mountains, China. Sci. Cold Arid Regions 9 (06), 543–553. doi:10.3724/SP.J.1226.2017.000543
Chen, J., Qin, X., Kang, S., Du, W., Sun, W., and Liu, Y. (2018). Effects of Clouds on Surface Melting of Laohugou Glacier No. 12, Western Qilian Mountains, China. J. Glaciology 64 (243), 89–99. doi:10.1017/jog.2017.82
Deng, H., Pepin, N. C., and Chen, Y. (2017). Changes of Snowfall under Warming in the Tibetan Plateau. J. Geophys. Res. Atmos. 122 (14), 7323–7341. doi:10.1002/2017jd026524
Gardelle, J., Berthier, E., and Arnaud, Y. (2012). Impact of Resolution and Radar Penetration on Glacier Elevation Changes Computed from DEM Differencing. J. Glaciol. 58 (208), 419–422. doi:10.3189/2012JoG11J175
Gardelle, J., Berthier, E., Arnaud, Y., and Kääb, A. (2013). Region-wide Glacier Mass Balances over the Pamir-Karakoram-Himalaya during 1999-2011. The Cryosphere 7 (4), 1263–1286. doi:10.5194/tc-7-1263-2013
General Administration of Quality Supervision Inspection and Quarantine (2008). GB/T12353.1-2008: Compilation Specifications for National Fundamental Scale Maps-Part 1: Compilation Specifications for 1:25000/1:50000/1:100000 Topographic Maps. Beijing: General Administration of Quality Supervision Inspection and Quarantine.
Gilbert, A., Leinss, S., Kargel, J., Kääb, A., Gascoin, S., Leonard, G., et al. (2018). Mechanisms Leading to the 2016 Giant Twin Glacier Collapses Aru Range Tibet. The Cryosphere 12 (9), 2883. doi:10.5194/tc-12-2883-2018
Guo, W., Liu, S., Xu, J., Wu, L., Shangguan, D., Yao, X., et al. (2015). The Second Chinese Glacier Inventory: Data, Methods and Results. J. Glaciol. 61, 357–372. doi:10.3189/2015jog14j209
Höhle, J., and Höhle, M. (2009). Accuracy Assessment of Digital Elevation Models by Means of Robust Statistical Methods. ISPRS J. Photogrammetry Remote Sensing 64 (4), 398–406. doi:10.1016/j.isprsjprs.2009.02.003
Holzer, N., Vijay, S., Yao, T., Xu, B., Buchroithner, M., and Bolch, T. (2015). Four Decades of Glacier Variations at Muztag Ata (Eastern Pamir): a Multi-Sensor Study Including Hexagon KH-9 and Pléiades Data. The Cryosphere 9 (6), 1811. doi:10.5194/tcd-9-1811-2015
Huss, M. (2013). Density Assumptions for Converting Geodetic Glacier Volume Change to Mass Change. The Cryosphere 7 (3), 877–887. doi:10.5194/tc-7-877-2013
IPCC (2021). in Climate Change 2021: The Physical Science Basis. Contribution of Working Group I to the Sixth Assessment Report of the Intergovernmental Panel on Climate Change. Editors V. Masson-Delmotte, P. Zhai, A. Pirani, S. L. Connors, C. Péan, S. Bergeret al. (Cambridge University Press). In Press.
Jacob, T., Wahr, J., Pfeffer, W. T., and Swenson, S. (2012). Recent Contributions of Glaciers and Ice Caps to Sea Level Rise. Nature 482 (7386), 514–518. doi:10.1038/nature10847
Jiang, G., Han, B., Gao, Y., and Yang, C. (2013). Review of 40-year Earth Observation with Landsat Series and Prospects of LDCM. J. Remote Sensing 17 (5), 1033–1048. doi:10.11834/jrs.20132296
Kääb, A., Treichler, D., Nuth, C., and Berthier, E. (2015). Brief Communication: Contending Estimates of 2003-2008 Glacier Mass Balance over the Pamir-Karakoram-Himalaya. The Cryosphere 9 (2), 557–564. doi:10.5194/tc-9-557-2015
Kapitsa, V., Shahgedanova, M., Machguth, H., Severskiy, I., and Medeu, A. (2017). Assessment of Evolution and Risks of Glacier lake Outbursts in the Djungarskiy Alatau, Central Asia, Using Landsat Imagery and Glacier Bed Topography Modelling. Nat. Hazards Earth Syst. Sci. 17 (10), 1837–1856. doi:10.5194/nhess-17-1837-2017
King, O., Quincey, D. J., Carrivick, J. L., and Rowan, A. V. (2017). Spatial Variability in Mass Loss of Glaciers in the Everest Region, central Himalayas, between 2000 and 2015. The Cryosphere 11 (1), 407–426. doi:10.5194/tc-11-407-2017
Koblet, T., Gärtner-Roer, I., Zemp, M., Jansson, P., Thee, P., Haeberli, W., et al. (2010). Reanalysis of Multi-Temporal Aerial Images of Storglaciären, Sweden (1959-99) - Part 1: Determination of Length, Area, and Volume Changes. The Cryosphere 4 (3), 333–343. doi:10.5194/tc-4-333-2010
Li, H. R. (2018). Glacier Changes in Turgen Daban Area of Qilian Mountains in Recent 30 Years. Lanzhou: Lanzhou University.
Maurer, J. M., Rupper, S. B., and Schaefer, J. M. (2016). Quantifying Ice Loss in the Eastern Himalayas since 1974 Using Declassified Spy Satellite Imagery. The Cryosphere 10 (5), 2203–2215. doi:10.5194/tc-10-2203-2016
Maurer, J. M., Schaefer, J. M., Rupper, S., and Corley, A. (2019). Acceleration of Ice Loss across the Himalayas over the Past 40 Years. Sci. Adv. 5 (6), eaav7266. doi:10.1126/sciadv.aav7266
Maurer, J., and Rupper, S. (2015). Tapping into the Hexagon Spy Imagery Database: A New Automated Pipeline for Geomorphic Change Detection. ISPRS J. Photogrammetry Remote Sensing 108, 113–127. doi:10.1016/j.isprsjprs.2015.06.008
McNabb, R., Nuth, C., Kääb, A., and Girod, L. (2019). Sensitivity of Glacier Volume Change Estimation to DEM Void Interpolation. The Cryosphere 13 (3), 895–910. doi:10.5194/tc-13-895-2019
Nuth, C., and Kääb, A. (2011). Co-registration and Bias Corrections of Satellite Elevation Data Sets for Quantifying Glacier Thickness Change. The Cryosphere 5 (1), 271–290. doi:10.5194/tc-5-271-2011
Oerlemans, J., and Reichert, B. K. (2000). Relating Glacier Mass Balance to Meteorological Data by Using a Seasonal Sensitivity Characteristic. J. Glaciol. 46 (1526), 1–6. doi:10.3189/172756500781833269
Paul, F., Barrand, N. E., Baumann, S., Berthier, E., Bolch, T., Casey, K., et al. (2013). On the Accuracy of Glacier Outlines Derived from Remote-Sensing Data. Ann. Glaciol. 54 (63), 171–182. doi:10.3189/2013aog63a296
Paul, F., Bolch, T., Kääb, A., Nagler, T., Nuth, C., Scharrer, K., et al. (2015). The Glaciers Climate Change Initiative: Methods for Creating Glacier Area, Elevation Change and Velocity Products. Remote Sensing Environ. 162, 408–426. doi:10.1016/j.rse.2013.07.043
Pieczonka, T., Bolch, T., and Buchroithner, M. (2011). Generation and Evaluation of Multitemporal Digital Terrain Models of the Mt. Everest Area from Different Optical Sensors. ISPRS J. Photogrammetry Remote Sensing 66 (6), 927–940. doi:10.1016/j.isprsjprs.2011.07.003
Rolstad, C., Haug, T., and Denby, B. (2009). Spatially Integrated Geodetic Glacier Mass Balance and its Uncertainty Based on Geostatistical Analysis: Application to the Western Svartisen Ice Cap, Norway. J. Glaciol. 55 (192), 666–680. doi:10.3189/002214309789470950
Shangguan, D., Ding, Y., Liu, S., Xie, Z., Pieczonka, T., Xu, J., et al. (2017). Quick Release of Internal Water Storage in a Glacier Leads to Underestimation of the Hazard Potential of Glacial Lake Outburst Floods from Lake Merzbacher in Central Tian Shan Mountains. Geophys. Res. Lett. 44 (19), 9786–9795. doi:10.1002/2017GL074443
Shi, Y. F. (2005). Concise Catalogue of Glaciers in China. Shanghai: Shanghai Popular Science Press.
Sun, W., Qin, X., Du, W., Liu, W., and Ren, J. (2014). Ablation Modeling and Surface Energy Budget in the Ablation Zone of Laohugou Glacier No. 12, Western Qilian Mountains, China. Ann. Glaciology 55 (66), 111–120. doi:10.3189/2014aog66a902
Veh, G., Korup, O., and Walz, A. (2020). Hazard from Himalayan Glacier lake Outburst Floods. Proc. Natl. Acad. Sci. U.S.A. 117 (2), 907–912. doi:10.1073/pnas.1914898117
Velicogna, I. (2009). Increasing Rates of Ice Mass Loss from the Greenland and Antarctic Ice Sheets Revealed by GRACE. Geophys. Res. Lett. 36 (19), 158–168. doi:10.1029/2009GL040222
Wang, J., Zhang, M., Wang, S., Ren, Z., Che, Y., Qiang, F., et al. (2016). Decrease in Snowfall/rainfall Ratio in the Tibetan Plateau from 1961 to 2013. J. Geogr. Sci. 26 (9), 1277–1288. doi:10.1007/s11442-016-1326-8
Wang, Y., Hou, S., and Liu, Y. (2009). Glacier Changes in the Karlik Shan, Eastern Tien Shan, during 1971/72-2001/02. Ann. Glaciol. 50 (53), 39–45. doi:10.3189/172756410790595877
Winkler, S., Chinn, T., Gärtner-Roer, I., Nussbaumer, S. U., Zemp, M., and Zumbühl, H. J. (2010). An Introduction to Mountain Glaciers as Climate Indicators With Spatial and Temporal Diversity. Erdkunde 64 (2), 97–118. doi:10.2307/20749413
Zemp, M., Hoelzle, M., and Haeberli, W. (2009). Six Decades of Glacier Mass-Balance Observations: a Review of the Worldwide Monitoring Network. Ann. Glaciol. 50 (50), 101–111. doi:10.3189/172756409787769591
Keywords: glacier mass balance, geodetic method, Turgen Daban range, climatic forcing, glacial lake
Citation: Xu S, Wang Y, Wang Y, Qi S and Zhou M (2022) Glacier Mass Balance Changes Over the Turgen Daban Range, Western Qilian Shan, From 1966/75 to 2020. Front. Earth Sci. 10:848895. doi: 10.3389/feart.2022.848895
Received: 05 January 2022; Accepted: 23 March 2022;
Published: 09 May 2022.
Edited by:
Xichen Li, Institute of Atmospheric Physics (CAS), ChinaReviewed by:
Yong Zhang, Hunan University of Science and Technology, ChinaJizu Chen, Chinese Academy of Sciences (CAS), China
Copyright © 2022 Xu, Wang, Wang, Qi and Zhou. This is an open-access article distributed under the terms of the Creative Commons Attribution License (CC BY). The use, distribution or reproduction in other forums is permitted, provided the original author(s) and the copyright owner(s) are credited and that the original publication in this journal is cited, in accordance with accepted academic practice. No use, distribution or reproduction is permitted which does not comply with these terms.
*Correspondence: Yetang Wang, eWV0YW5nd2FuZ0BzZG51LmVkdS5jbg==; Yuzhe Wang, eXV6aGUud2FuZ0Bmb3htYWlsLmNvbQ==