- 1Geology Department, Faculty of Science, Assiut University, Assiut, Egypt
- 2Geomagnetic and Geoelectric Department, National Research Institute of Astronomy and Geophysics, Helwan, Egypt
- 3Department of Geology and Geophysics, College of Science, King Saud University, Riyadh, Saudi Arabia
- 4Department of Water Management, Faculty of Civil Engineering and Geoscience, Delft University of Technology, Delft, Netherlands
This study used land gravity and airborne magnetic data to investigate the depth to the magmatic chamber and map the heat flow distribution beneath the active volcanoes of Hawaii Island using the Curie point depth (CPD) and gravity modeling. Obtaining some of the ground-based geophysical measurements was problematic due to accessibility limitations; therefore, this study used available data. The CPD and magnetic data were used to map the depth to the bottom of the magnetic layer by calculating the depth to the Curie isotherm (540°C) beneath Hawaii Island. The spectral peak method was used to calculate the depths to the shallow and deep magnetic sources for the entire island, and the CPD was calculated using the centroid method. A two-dimensional density model for two Earth layers was constructed using forward modeling of the gravity data. A large plume of dense intrusive material was observed beneath the three adjacent volcanoes of Mauna Loa, Mauna Kea, and Kilauea, and two small chambers were found to be located beneath the Kohala and Hualalai volcanoes. Based on the gravity modeling results, the depth to the magma layer varied from 0.5 to 10 km, and the heat flow was higher close to the volcanic eruption zones. The current study is informative and cost effective for the world’s most active volcanic areas.
Introduction
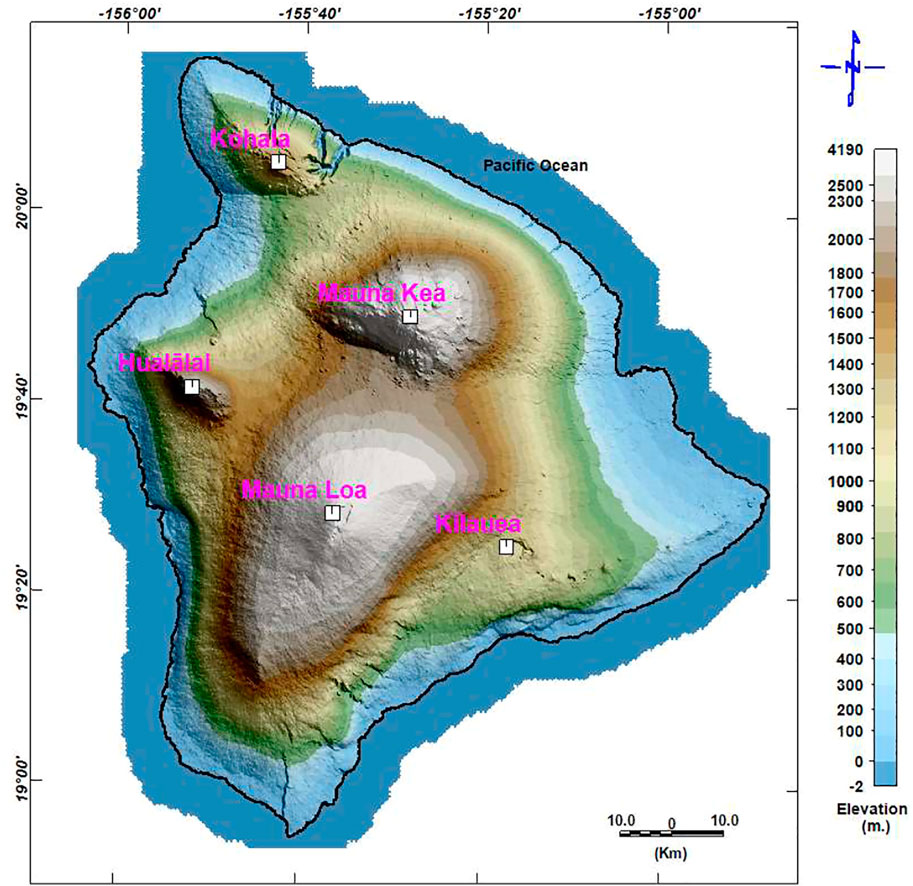
The structural complexity of volcanic islands and their difficult accessibility make geophysical imaging problematic. Moreover, geophysical modeling generally suffers from nonuniqueness in its solutions. This study uses two geophysical techniques to overcome these problems and reduce modeling errors. Despite the accessibility limitations, geophysical modeling techniques of potential data have been used extensively in different geologic settings to provide reliable results on structures and geometries (Green, 1975; Guillen and Menichetti, 1984; Camacho et al., 1997; Li and Oldenburg, 1998; Camacho et al., 2000; Boulanger and Chouteau, 2001; Montesinos et al., 2006; Cella wt al., 2007; Camacho et al., 2011; Marcotte et al., 2014; Barnoud et al., 2016). Figure 1 shows the location and topography of the Hawaiian Island arch system.
Geophysical and structural measurements are used extensively to delineate the three-dimensional (3-D) shape of granitoid plutons (Miller and Tauch, 1989; Vigneresse, 1995a, b; Eguíluz et al., 1999) in different areas. Most previous studies include horizontal map views of intrusions in their results. However, scientific studies assume the widespread concept of the inverted teardrop when considering pluton 3-D geometries (Vigneresse, 1995b) based on structural extrapolations to depth. Most field-based studies use extrapolations to depth without direct evidence to obtain a reasonable approximation when geophysical techniques are employed.
Aeromagnetic datasets are widely used to estimate the Curie point depth (CPD) and assess geothermal resources (Chiozzi et al., 2005; Trifonova et al., 2009; Hsieh et al., 2014). The CPD is considered at the surface at a high temperature of ∼540°C, as measured in situ from holes drilled through the crust and into the still-molten lens of tholeiitic basalt in Kilauea (Zablocki and Tilling, 1976). The CPD surface indicates the bottom of the magnetic layer; this is where paramagnetic minerals are formed from ferromagnetic minerals when they reach the Curie point temperature (Nagata, 1961) or the depth at which nonmagnetic rocks are formed from magnetic rocks (Ravat et al., 2007). Iron sulfides and iron–titanium oxide are the most common ferromagnetic minerals (Rajaram, 2007).
Castro and Brown (1987) have used high-resolution sampling of the 1950 and 1972 flows in Kilauea to identify the intraflow variations of very young basalt flows. The paleomagnetic directions of these samples are different from the direction of Hawaii’s geomagnetic field. This shallow inclination anomaly was attributed to the recording mechanism of subaerial basalts (Castro and Brown, 1987); however, it has since been identified as the nondipole field effect (Cox, 1975). Another paleomagnetic study has identified the lavas in the main part of the Pohue Bay flow and those of the Hawaiian cones to have similar paleomagnetic properties with relatively similar ages (Jurado-Chichay et al., 1993). That study could have identified both younger lava flows, which later utilized the main tube, and an earlier subset of cones, which were formed before the Pohue Bay eruption.
Magnetic data have been analyzed extensively to estimate both the depth to the magnetic basement (Spector and Grant, 1970; Hahn et al., 1976; Garcia-Abdeslem and Ness, 1994) and the Curie isotherm (Blakely, 1988; Okubo and Matsunaga, 1994). According to Spector and Grant (1970), the depth factor controls the shape of the readily averaged power spectrum. Their statement has resulted in a wide interpretation of the average two-dimensional (2-D) power spectrum of magnetic data. Moreover, the depth to the source can be calculated from the slope of the log radially averaged power spectrum.
The thermal structure of the crust in different geologic environments has been widely investigated using magnetic data (Spector and Grant, 1970; Bhattacharyya B. K. and Leu L.-K., 1975, 1977; Byerly and Stolt, 1977; Okubo et al., 1985; Blakely, 1995; Tanaka et al., 1999; Chiozzi et al., 2005; Ross et al., 2006; Trifonova et al., 2009; Gabriel et al., 2011, 2012; Bansal et al., 2013, 2016; Hsieh et al., 2014; Nwankwo and Shehu, 2015; Nwankwo and Abayomi, 2017); the resulting geomagnetic anomalies above the CPD have been used to delineate magnetic structures (Bhattacharyya and Leu, 1975a, b; Byerly and Stolt, 1977; Blakely and Hassanzadeh, 1981; Blakely, 1988; Chiozzi et al., 2005; Trifonova et al., 2009; Hsieh et al., 2014; Idárraga-García and Vargas, 2018; Mohamed Al Deep, 2021).
Flinders et al. (2013) used land and marine gravity data and a 3-D gravity model to calculate the average densities, volumes, and percentages of olivine in the intrusive materials and cumulate cores below the volcanoes in Hawaii. They used an isosurface density of 2.85 g cm−3 to delineate intrusive material, which equated to over 60% of dikes with a density of 2.95 g cm−3. Furthermore, they defined cumulate cores using an isosurface density of 3.00 g cm−3, which corresponded to ∼35% olivine (density: 3.2–3.3 g cm−3) in the intrusive complex (density: 2.85 g cm−3).
The Hawaiian Islands were formed during the past 70 Ma as the Pacific lithospheric plate moved north and then west relative to a melting anomaly. This phenomenon is represented by the hotspot hypothesis, which accounts for the formation of a volcanic chain on the ocean floor. Wilson (1963a, c) proposed that the islands of Hawaii were formed when the seafloor moved over lava sources in the asthenosphere; they limited this theory to the volcanoes and the ridge of the Hawaiian Islands. Subsequently, Wilson’s theory was expanded by Christofferson (1968) to include the Emperor Seamounts. Morgan (1972a, b) suggested that the Hawaiian hotspot and others are thermal plumes of material rising from the deep mantle. Clague and Dalrymple (1987) tested and validated this hypothesis based on a study of the geologic evolution of the Hawaiian–Emperor volcanic chain. In terms of geology, tholeiitic basalts account for >95% of the islands’ rocks (Clague and Darlrymple, 1989).
Geophysical data collected from the ground and from the airborne were commonly employed in groundwater investigations and subsurface geology (e.g., Meneisy and Al Deep, 2020; Mohamed and Abu El Ella, 2021; Al Deep et al., 2021). On the other hand, Global data from the Earth Gravitational Model and the Earth Magnetic Anomaly Grid have been widely used for crustal studies and the depth to the bottom of the magnetic layer (e.g., Idárraga-García and Vargas, 2018; Mohamed and Al Deep, 2021), whereas gravity data from the Gravity Recovery and Climate Experiment mission have been successfully applied for estimating mass transport and distribution in the Earth’s fluid (e.g., Mohamed et al., 2017; Mohamed, 2019; Mohamed, 2020a; Mohamed, 2020b; Mohamed, 2020c; Taha et al., 2021; Mohamed and Gonçalvès, 2021; Mohamed et al., 2021; Mohamed et al., 2022).
The current study aims to characterize the morphology of the magmatic chamber beneath Hawaii Island using gravity and magnetic potential fields. Delineating the geometrical border of the magmatic chamber beneath the island of Hawaii and estimating the CPD, geothermal gradient, and heat flow of the area require the techniques of gravity inversion and spectral analysis of magnetic data. Our method of estimating the CPD to determine the maximum depth to the magnetized rocks calculates the depth to the upper surface of the magma chamber indirectly. Additionally, a two-layer 2-D geological model using the contrast in density between the average density of the solidified rocks and the magma layer is applied using gravity modeling techniques.
Geologic setting of Hawaii Island
Hawaii Island comprises five major shield volcanoes (Figure 2): Mauna Kea (MK), Kohala (Ko), Kilauea (Ki), Mauna Loa (ML), and Hualalai (Hu) (Langenheim and Clague, 1987). Except for some minimal erosion to the northern sides of Ko and MK, these volcanoes have suffered little erosion (Langenheim and Clague, 1987). They progress in age from the southeast end (with its still-active volcanoes) to the northwest end (with its volcanoes dating from 75 to 80 Ma) (Clague and Dalrymple, 1987).
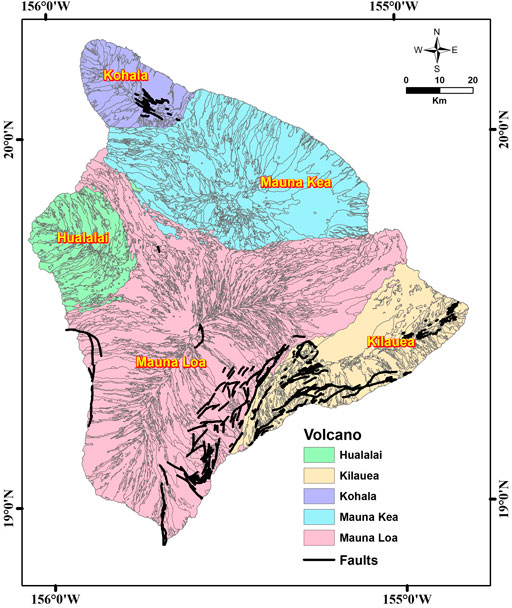
FIGURE 2. Rock compositions of Hawaii Island and the faults in the southern part (source: Stearns and Macdonald, 1946; Wolfe and Morris, 1996a; Wolfe et al., 1997; Kauahikaua et al., 2002; Swanson, 2005).
The ML volcano is the largest on Earth at 97-km long, 48-km wide, and an estimated volume of 70–80 million km3 (Robinson and Eakins, 2006). Its shield-shaped dome rises to 4,167 m above sea level (Figures 1, 2), and its slopes are dotted with a few cinder cones. The caldera of Mokuaweoweo is located on the summit (Macdonald, 1977). ML formed over a period of ∼0.5 million year. During recent years, lava younger than 1,000 year has poured from fissures and a cone on the volcano’s floor and rim, filling depressions and covering about 40% of its surface area (Lockwood and Lipman, 1987). A few weak explosions have occurred. The surface of ML originates mostly from the Holocene (Stearns and Macdonald, 1946; Lipman and Swenson, 1984). Stearns and Macdonald (1946) divided the volcano’s rocks into Pliocene Ninole basalt, Pleistocene Kahuku basalt, and Pleistocene and Holocene Kau basalt (the most recent).
At 4,205 m above sea level, MK is Hawaii’s highest volcano (Figures 1, 2). There have been no eruptions over the past 3,600 years (Porter, 1979a). The configurations of cinder cones indicate the location of less-defined southerly, easterly, and westerly rifts. The volcano’s rocks were divided into two volcanic series by Stearns and Macdonald (1946). The older (Hamakua) series forms a major part of the mountain and represents the shield stage and part of the post-shield stage. The upper part of the mountain (above 3,353 m) comprises a plateau resulting from the Laupahoehoe series filling of a caldera in the Hamakua volcanic series, which represents the rest of the post-shield stage. Porter (1979a, 1979b) redefined the volcano’s two rocks to include glacial deposits; additionally, they were elevated to a group ranking of volcanic and glacial formations.
The last eruptions of the Hu volcano in 1800–1801 occurred from five separate vents (Moore et al., 1987) (Figures 1, 2). The volcano has an approximate diameter of 27 km and a well-defined NW-striking rift zone; its less-well-defined N- and SE-trending rift zones are characterized by widespread cinders and spatter cones (Langenheim and Clague, 1987). Its subaerial surface is represented by the Pleistocene Waawaa Trachyte Member, with short flows of hawaiite and a few flows of alkali basalt lava (Moore et al., 1987). According to detailed mapping and C-14 dating, the volcano’s Holocene lava flows have been divided into four groups: 10–5, 5–3, 3–1, and <1 ka (Moore et al., 1987).
Based on K–Ar analysis, Ko is the oldest Pleistocene (McDougall and Swanson, 1972) and longest inactive volcano in the islands (Lipman, 1980) (Figures 1, 2). It was formed over northwesterly and southwesterly rifts and a weak southwesterly rift (Langenheim and Clague, 1987). Its last eruption was ∼60,000 years ago, and it is considered to be extinct. The volcano’s rocks represent two volcanic series (Stearns and Macdonald, 1946): the older Pololu series (Pololu basalt) (Langenheim and Clague, 1987) of shield-stage tholeiitic basalt and caldera-filling postshield-stage alkalic basalt (Stearns and Macdonald, 1946) and the younger Hawi series (Hawi Volcanics) (Langenheim and Clague, 1987) of differentiated alkalic lava of the postshield stage (Stearns and Macdonald, 1946).
The Ki volcano has an area of 2,500 km2 and rests on the southeast slope of ML (Figures 1, 2). Lava flows from ML pass over the slopes of Ki. The Ki volcano is the youngest in Hawaii and remains very active (Clague and Dalrymple, 1987). Around 70% of its surface is younger than 500 years, and about 90% is younger than 1,100 years (Holcomb, 1987). At the base of a fault escarpment on its mobile south flank, Ki’s older rocks of Hilina basalt are between 100 and 30 kyr old (Easton, 1987). The most recent Puna basalts of the Pleistocene and Holocene (Easton, 1987) represent the younger rocks and are separated from the older ones by Pahala ash.
Data
The land and airborne potential field data used in this study are described below.
Gravity anomaly data
Gravity measurements from the study area were collected as datasets on the deep magmatic structures of the Hawaiian volcanoes. A complete Bouguer anomaly map was constructed from the corrected observed gravity data to build a realistic model for Hawaii relative to the ground surface. The gravity data, which were collected by Kauahikaua (2017), did not contain base station time series records, and there was no time channel for the data points. Therefore, it was assumed that the instrumental drift had been completed. A free air anomaly map was constructed, and a complete Bouguer anomaly map was compiled for use in the gravity inversion calculation.
The first step of the data processing involved calculating the theoretical gravity for the study area by Eq. 1. Provided the data projection was in the WGS84, the same datum was used.
The subtraction of theoretical gravity from the observed data resulted in latitude-corrected data. The formula below (Eq. 2) was used for the latitude correction calculations:
where
The second step involved the calculation of the free air anomaly (
where
A simple Bouguer anomaly map was constructed by subtracting the Bouguer correction, which replaces the air above a datum by the mean density of land. The complete Bouguer correction calculates the terrain correction for the gravity stations and then applies the complete Bouguer correction to the simple Bouguer-corrected data. The terrain correction used topography data obtained from the Shuttle Radar Topography Mission (NASA, 2013).
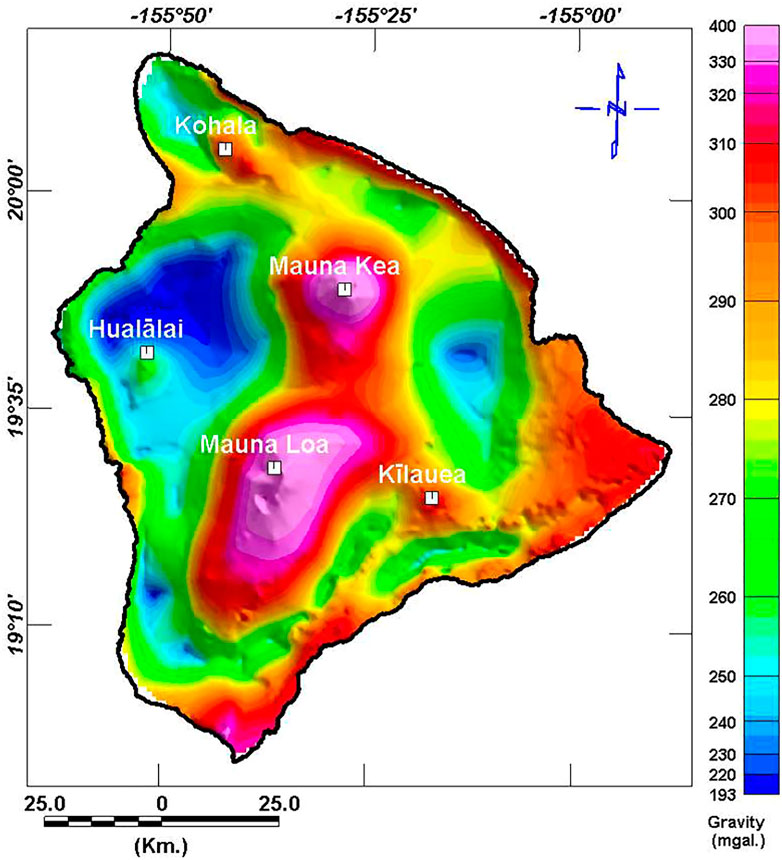
The final complete Bouguer anomaly (Figure 3) was calculated according to Eq. 5:
where
Magnetic anomaly data
The available magnetic data for Hawaii Island comprise four aeromagnetic datasets. The United States Geological Survey’s Hawaii-78-Hawaii data are the only data available with complete coverage of the island; they were collected along the north–south lines by aircraft instruments at a height of 305 m, and magnetic field values and locations were recorded (Godson et al., 1981). The data were collected along longitudinal lines with a spacing of 1.6 km and include latitude, longitude, altitude, and magnetic field values. Some variations in magnetic measurements are caused by rocks with high proportions of magnetic minerals; these anomalies reflect variations in the amount/type of magnetic material and the shape/depth of the rock bodies. The features and patterns of the aeromagnetic anomalies in the Hawaii-78-Hawaii dataset were processed to map the CPD and estimate the geothermal activity in the active volcanic zones based on the high resolution and consistency of the data along the flight lines.
Hildenbrand et al. (1993) used this dataset as well as other data that were obtained along lines normal to the rifts of ML and Ki at a flight height of 90 m (Flanigan et al., 1986). By merging the two datasets, they produced the most comprehensive dataset for the entire island. This is the only difference in our data reduction, as we used aeromagnetic data that provided complete coverage (Hawaii-78-Hawaii) of the island.
The complete dataset was gridded with 0.5-km spacing using the minimum curvature technique, and the dataset was continued upward to 305 m using the Geosoft 8.4 software (Geosoft Oasis Montaj, 2015). The shifted anomalies were adjusted using a reduction-to-pole transformation, while spectral and centroid techniques were used to delineate the shallow and deep sources and define the CPD, which denotes the interface between the magma layer and the overlying magmatic layer. The terrain effect was calculated using a spectral inversion process, which was subsequently removed to estimate the terrain-corrected magnetic field used in the current study.
Results
Identifying the upper surface of the magmatic chamber from magnetic data
Calculating the CPD to determine the maximum depth to the magnetized rocks allows the upper surface of the magma chamber to be delineated indirectly. The rocks in Iki lava lake in Hawaii cannot contain any magnetization above the Curie temperature (540°C) (Zablocki and Tilling, 1976). Thus, for magnetite (the most abundant magnetic mineral), residual magnetism appears below the Curie point of ∼540°C. In this case, the magma beneath Hawaii Island is basic, reflecting higher temperatures of 1,100°C to 1,300°C. The CPD denotes the depth to the bottom of the magnetized rocks, i.e., the depth to the upper surface of the magmatic chamber. As the CPD calculation involves the power spectrum, we calculated the 2-D radial power spectrum for the entire area to provide an overview of the depth distribution in that vicinity.
The spectral peak and centroid methods are commonly used spectral techniques for estimating the depth to the bottom of a magnetic layer (Ravat et al., 2007). The spectral peak method (Spector and Grant, 1970) was used by Shuey et al. (1977) and Connard et al. (1983). The present study also used this method to allocate depth to the top of the magnetized sources along with the centroid method (Bhattacharyya B. K. and Leu L. K., 1975, 1977; Okubo et al., 1985; Tanaka et al., 1999) to determine the centroid of rectangular parallelepiped sources or the depth to the centroid.
Spectral peak method (two-dimensional power spectrum)
The Spector and Grant (1970) equation (after Blakely, 1995) was used to estimate the depths to the bottom and top of the collective magnetic sources from their averaged power spectra:
where F is Fourier power spectrum, k is wavenumber (cycles km–1), Cm is a constant, θm is a magnetization direction factor, θf is a magnetic field direction factor, Mo is the magnetization, Zb is depth to the bottom of the magnetic sources, Zt is depth to the top of the ensemble of magnetic sources, and S2(a, b) is the horizontal dimensions of sources factor.
Figure 4 reveals that the azimuthally averaged log power spectrum, which was calculated using the Geosoft 8.4 software (Geosoft Oasis Montaj, 2015), has two segments reflecting the deeper and shallower sources of the magnetic field. The depth to each zone was calculated from the slope of each segment of the spectrum using Eq. 7:
where h is the depth, and s is the slope of the log power (energy) spectrum.
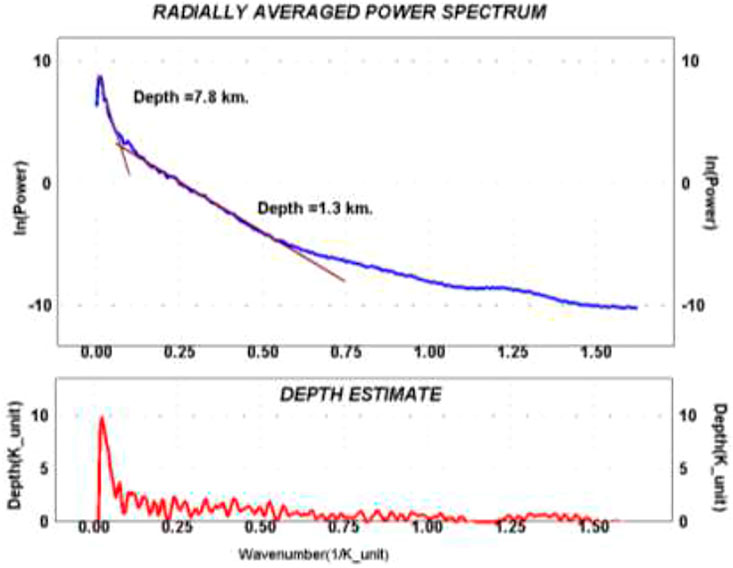
FIGURE 4. Calculated depth from the averaged 2-D power spectrum to magnetic sources that may relate to volcanic cycles with high magnetite content.
The depth of the deeper sources with wavenumbers between 0.0 and 0.0001 cycle km−1 (Figure 4) was calculated at 7.8 km below the flight height, whereas the depth to the shallower sources with wavenumbers between 0.0001 and 0.0007 cycle km−1 was calculated at 1.3 km below the flight height (i.e., 305 m).
Centroid method
Bhattacharyya and Leu (1977) proposed a technique for calculating the centroid of rectangular parallelepiped sources. Tanaka et al. (1999) calculated the CPD map for East and Southeast Asia by dividing the region into subregional data over about 40,000 km2. Blakely (1988) divided the magnetic data map over the Nevada area into subregions with approximate areas of 14,400 km2 and estimated the CPD of the state of Nevada. The CPD in Bulgaria was calculated by Trifonova et al. (2009) using six subregions with a 300-km edge. Hsieh et al. (2014) divided the integrated magnetic anomaly data of Taiwan into square subregions (250 × 250 km2) and calculated the 2-D fast Fourier transform power spectrum for each region to estimate the CPD map. The Curie temperature depths in northern Italy (the Alps and the Po Plain) were calculated by Speranza et al. (2016) by creating windows with a 100-km edge and a 50% overlap between the aeromagnetic data and data from the Earth Magnetic Anomaly Grid two over the study area. Yang et al. (2017) calculated the CPD of Southeast Tibet via a spectral analysis of satellite data magnetic anomalies. Finally, Blakely (1995) presented the power spectral density of the total magnetic field [ϕΔΤ (kx; ky)], as follows:
Equation (8) was reduced to Eq. (9). Assuming that M (x; y) is the layer’s magnetization and a random function of x, y, this indicates that the power-density spectra of the magnetization ϕM (kx, ky) is a constant. Then, the averaged power spectrum of ϕ (|k|) can be written as:
where A is a constant. The depth to the top of the ensemble of magnetic sources (Zt) was derived from the slope of the high wavenumber segment of a radially averaged power spectrum
Additionally, the centroid depth (Z0) could be estimated from the low wavenumber segment of the spectrum (Tanaka et al., 1999):
where B is a constant. Finally, Zb could be calculated from the following formula (Okubo et al., 1985):
According to Blakely (1996), the window size was suggested to be five times that of the CPD. Therefore, the current study applied a moving window to subset the data into square regions with a 40-km edge and an overlap of 25% to generate adequate wavelengths for the power spectrum calculation.
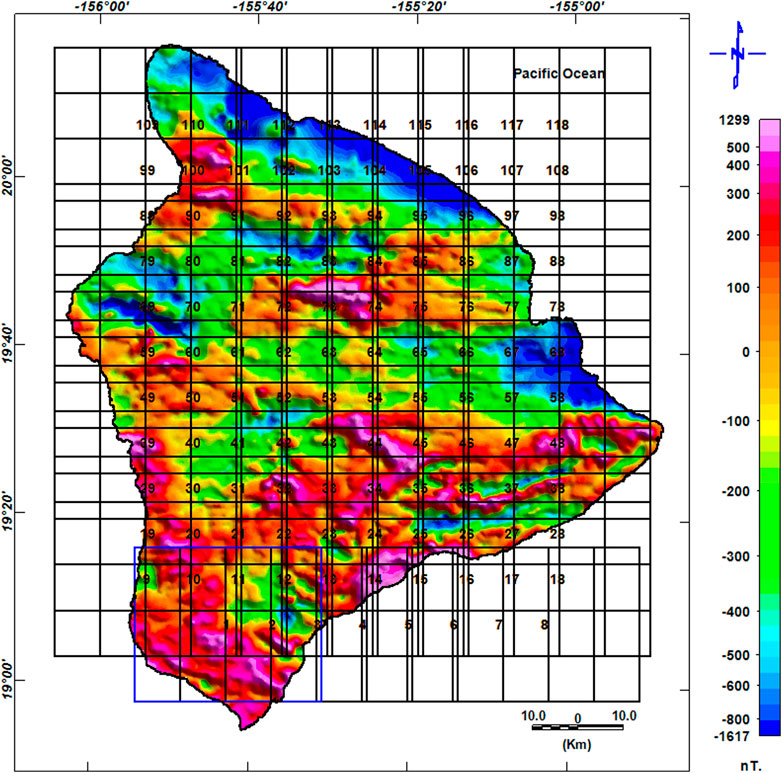
An example of the azimuthally averaged power spectrum for some selected windows is given in Figure 5 while Figure 6 contains a location map of each spectral window. Figure 7 shows the estimated depth to the bottom of the magnetized layer, which varies from 0.93 to 12.4 km below the ground surface when using a 40 × 40 km2 window. Based on the window of 40 × 40 km2, the surface of the magmatic plume was more correlated to the distribution of volcanoes on the surface of the island. Moreover, a large plume was observed beneath the ML, Ki, and MK volcanoes, underneath which uprising magma may be accumulating. Table 1 presents the calculated CPD (using a 40 × 40 km2 window), the calculated geothermal gradient, and the heat flow. The misfit was also calculated (Table 1) using the root mean square errors (RMSEs) of the match between the observed and modeled spectra.
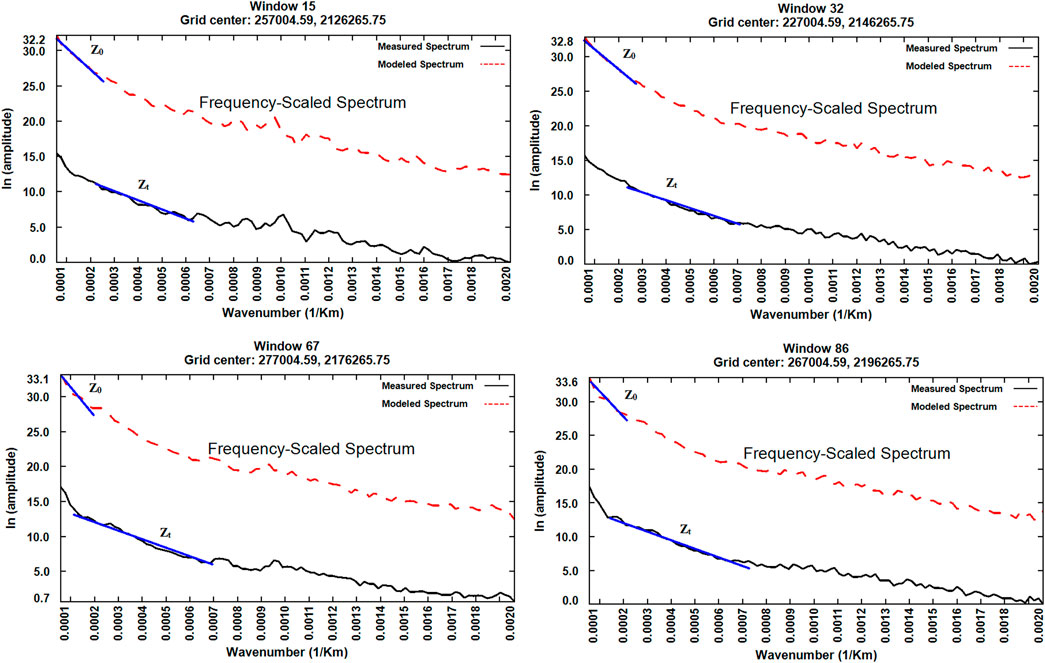
FIGURE 5. Examples of spectra for the estimation of the depth of the top bound (Zt) and the depth of the centroid (Z0) of magnetic sources for different windows.
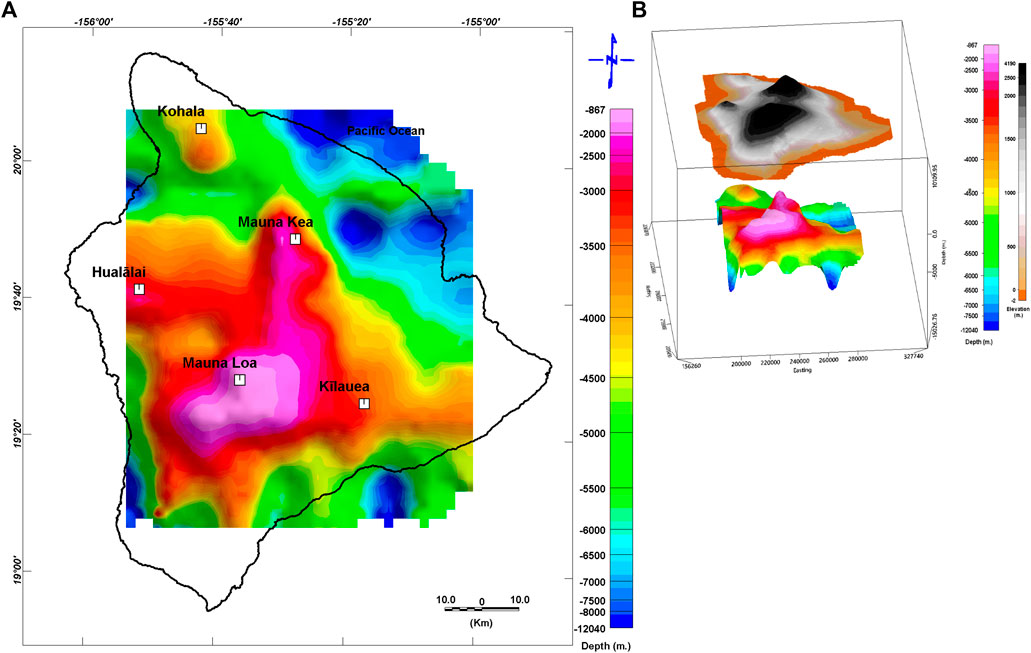
FIGURE 7. (A) The calculated Curie point depth. (B) Three-dimensional representation of the upper surface of the magma chamber, which is correlated with the actual topography of Hawaii Island.
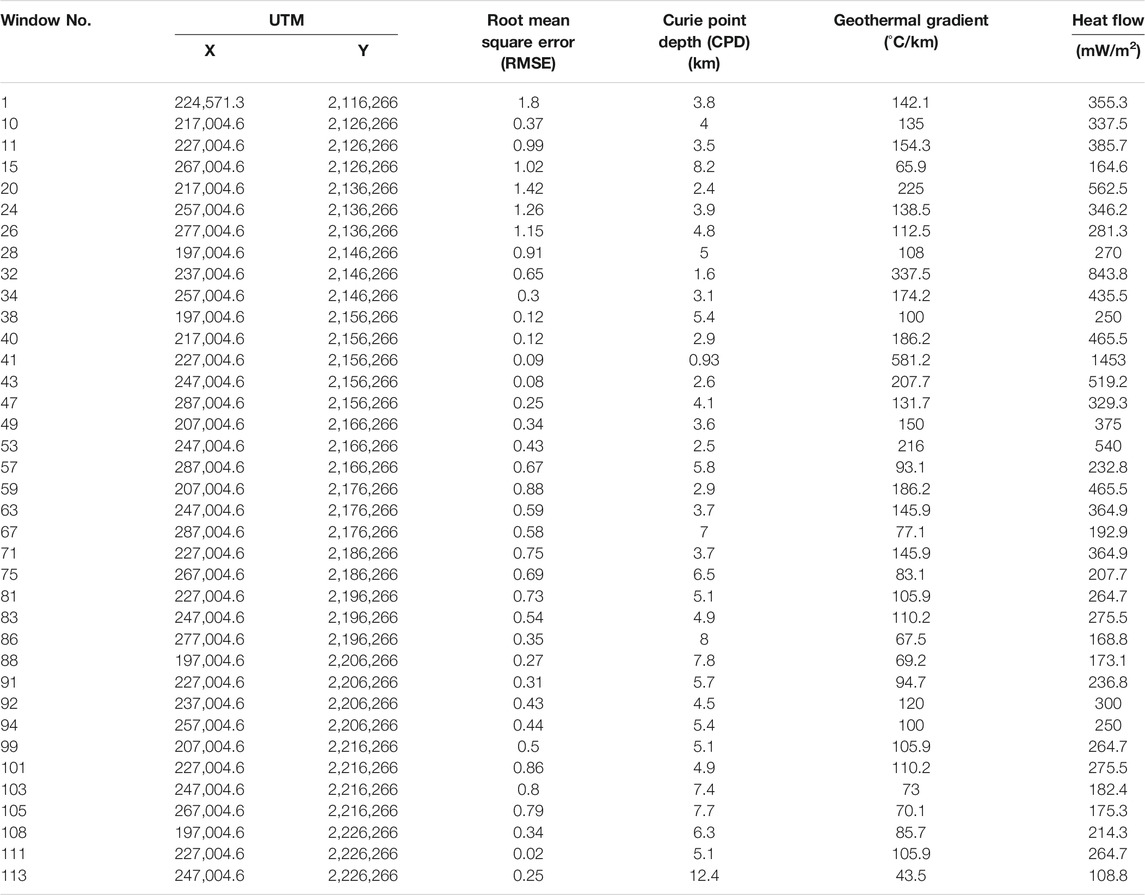
TABLE 1. A sample of the calculated CPD with a 40 × 40 km2 window, the estimated geothermal gradient, and heat flow. The data misfit using the RMSE is also shown.
Morphology of the Magmatic Chamber from the Gravity Data
To construct a more realistic model for Hawaii Island, this section used the 2-D technique of gravity field modeling. The objective was to propose a comprehensive density model of the crust below the island.
Gravity inversion
The gravity data modeling was carried out along profiles (Figure 8) on the complete Bouguer anomaly map using the Intrepid 4.5 geophysics software (Intrepid Geophysics, 2013). This calculation method applies the algorithm presented by Murthy and Rao (1993). Equation 13 provides the gravity anomaly
where G is the universal gravitational constant, rk is the length of the line from the surface to the first point (vertex), rk+1 is the length to the next point, and θk and θk+x are the angles to the body vertices. The term
where
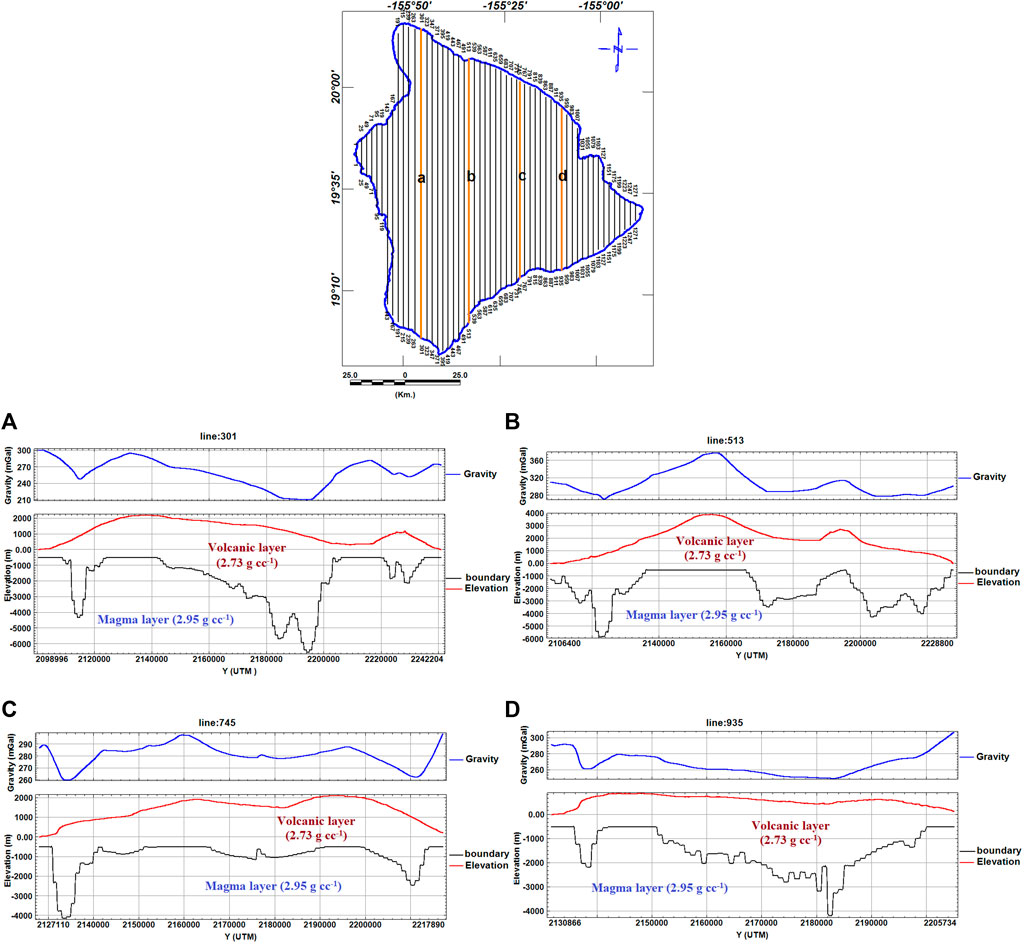
FIGURE 8. Location map of the north–south parallel profiles used to calculate the density inversion model. The orange lines refer to selected 2-D modeled profiles (A–D).
This study constructed a 2-D density model for two Earth layers by forward modeling the gravity data along selected profiles (Figure 8). The two-layer model was constructed based on the density contrast properties of these layers and the assumption that the second layer (magma) was denser. The interface between the two layers was assumed to comprise a sequence of polygonal bodies, and a density contrast value of 0.22 g cc−1 between the two layers was also assumed.
Two-dimensional density models were operated along the profiles (with 1-km line spacing) using the GRAVINV module in the Intrepid 4.5 geophysics software (Intrepid Geophysics, 2013). Each model contained two layers. The first (top) volcanic layer had a density of 2.73 g cc−1, which was averaged for 1,600 core samples obtained at depths between 889 and 3,097 m below sea level near the city of Hilo (Moore, 2001). The densities of the borehole samples are summarized in Table 2. The second magmatic layer was assumed to have a high density of 2.95 g cc−1. As shown in Figures 9, 10, a complete two-layer solution for the gravity modeling was provided along the north–south profiles, which were interpolated across the island of Hawaii. Figure 9 shows the thickness of the first layer based on the north–south parallel profiles in Figure 8, which equals the depth of the second (magma) layer in Figure 10. Figure 10 depicts very steep vertical rising magmatic plumes, which resemble those calculated by the magnetic method. The Zt value varied from 500 m to over 10 km. Compared with the actual volcanic activity conditions on Hawaii Island, these calculated depths were very reasonable. However, the edge effect meant that the outer rim of the model could not be considered.

TABLE 2. Pillow lava layers intercalated by hyaloclastite from the Hilo borehole and their densities [Source: (Moore, 2001)].
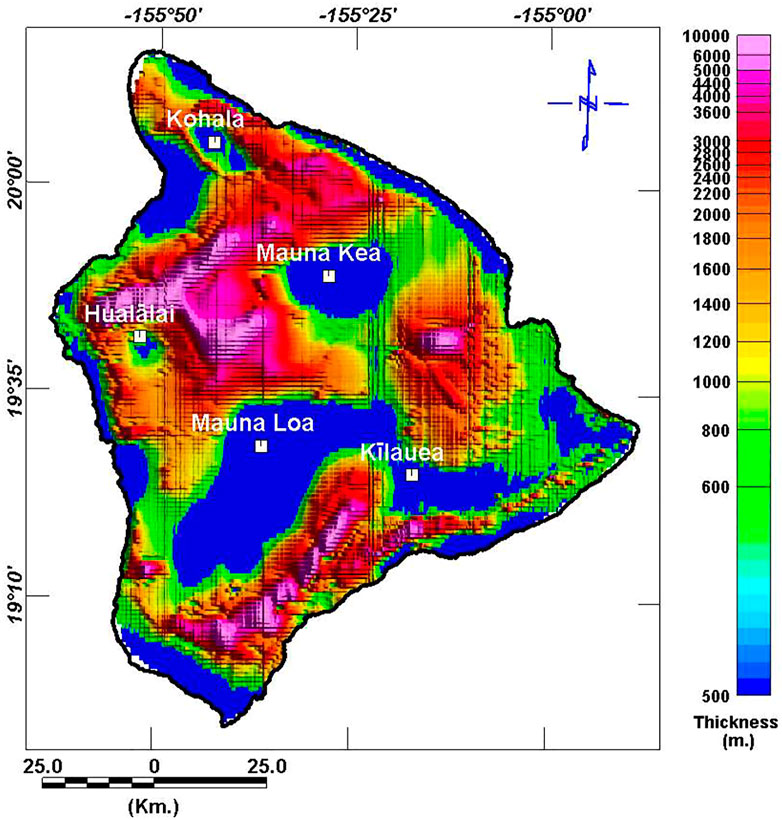
FIGURE 9. Thickness of the first layer based on the north–south parallel profiles in Figure 8.
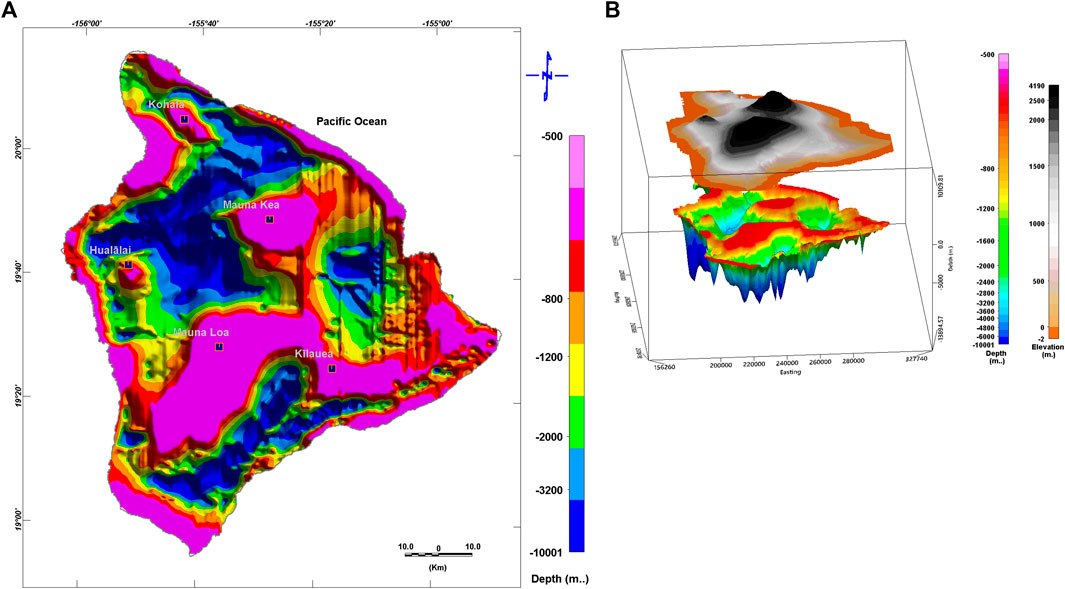
FIGURE 10. (A) Calculated depth to the magma using density variation inversion. (B) Three-dimensional representation of the magma’s upper surface correlated with the actual topography of Hawaii Island. The generated model was influenced by the edge effect.
Geothermal gradient and heat flow
The geothermal gradient (dt/dz) from the Earth’s surface to the CPD was estimated using Eq. (15) (Tanaka et al., 1999):
The heat flow (q) was calculated using Eq. 16 (Okubo et al., 1985):
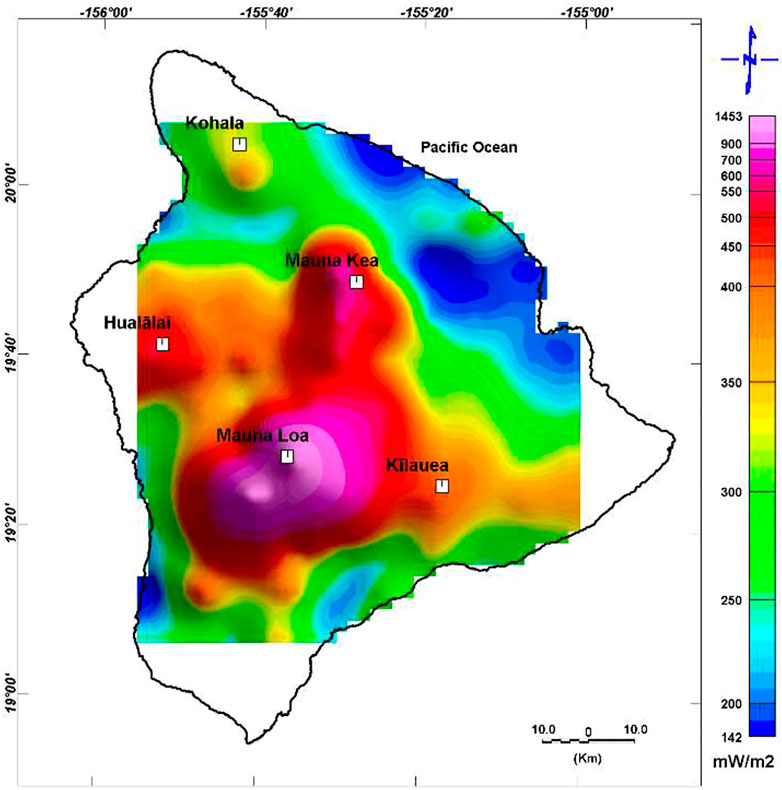
This study used h = 2.5 W/m°C as the value for igneous rocks (Springer, 1999). As can be seen in Table 1, the dt/dz varied from 43.5 to 581.1 °C km−1. Figure 11 presents the estimated heat flow, which ranges between 108.8 and 1,453 mW/m2 close to the volcanic eruption zone of ML. As geological constraints strongly influence CPDs (Ross et al., 2006), in the volcanic zones, the CPDs are shallower than 10 km (Obande et al., 2014). According to Table 1 and Figure 11, Hawaii Island has high geothermal potential energy proximal to the volcanic eruption zones with shallower CPDs as well as high geothermal gradient and heat flows. The data in Table 1 show window no. 213 to have the lowest heat flow, while the flow is highest in window no. 141.
Discussion and conclusion
Investigating the morphology of the magmatic chamber beneath Hawaii Island as an example of an island arc system enhances the current understanding of plate tectonics theory. However, the growth and movement directions of these magmatic diapirs require a time-lapse investigation. Herein, we utilized the available potential data to better understand the morphology of the magmatic chamber, estimate the CPD, and calculate the heat flow.
This study successfully applied airborne geophysical data to characterize the morphology of the magmatic chamber beneath Hawaii Island and estimate the depths to the deeper sources; these varied from 7.8 km below the flight height to shallower sources estimated to be 1.3 km deep. The Curie point is located from shallow depths (<1 km) at and proximal to the ML volcano to 12 km close to the northeastern part of the MK volcano region below the ground surface.
The results of the gravity data inversion revealed the existence of very steep vertical rising magmatic plumes, reflecting the dense intrusive material of basaltic and ultramafic rocks underlying the volcanoes. The results corresponded well with those calculated using the magnetic method. The depth to the top of the second (magma) layer varied from 500 m to about 10 km. An inverse relation was identified between the heat flow and the CPD, whereby a decrease in heat flow corresponded with an increase in the CPD. The highest value of 1,453 mW/m2 occurred at the shallowest CPD (0.93 km) in window no. 141, while the lowest value of 108.8 mW/m2 was correlated with the highest CPD (12.4 km) in window no. 213. According to Jessop et al. (1976), these anomalous geothermal conditions are related to heat flows of between 80 and 100 mW/m2.
The results of this study are in good agreement with the previous 3-D gravity models used by Kauahikaua et al. (2000), who studied the magmatic structures within basaltic volcanoes and defined the structures related to seismic hazards and landslides on the island of Hawaii. Their results revealed the existence of dense cumulates and intrusions beneath the summits of every volcano.
Information on the magmatic properties of subsurface rocks was provided by Hildenbrand et al. (1993), who applied the spectral depth technique to aeromagnetic data. Two shallow magnetic zones were identified at a depth of 1 km. Additionally, using the spectral inversion of the magnetic data, they defined a deep magnetic horizon at 10.5 km below the flight height. The results of the current study correspond well with those of Hildenbrand et al. (1993), as our interpretation revealed shallow and deep magnetic sources to be located at 1.3 and 8 km below the flight height, respectively. Based on the CPD estimations, the bottom of the magnetized layer varied between 0.93 and 12.4 km in depth, while the gravity inversion technique indicated a depth of 0.5–10 km below the ground surface.
The existence of large magmatic plumes of dense cumulates and intrusions beneath the summits of the MK, ML, and Ki active volcanoes in this study was confirmed by the presence of higher-velocity regions near the active volcanoes containing dense intrusive materials, such as olivine cumulates (Thurber, 1984; Hill and Zucca, 1987; Okubo et al., 1997). However, a 3-D P-wave velocity model run by Park et al. (2007) for the southeastern part of Hawaii Island produced higher crustal seismic velocity values of 7.0–7.4 km/s. These higher values indicate the dominance of dense olivine cumulates mixed with extrusive and intrusive basaltic rocks in the high-velocity regions underlying the summits and rift regions of the active areas of Ki and ML. In the study of Park et al. (2007), the lower-velocity regions south of the Hilina and along the Kao’iki fault zones were attributed to thick accumulations of volcaniclastic sediments.
Using more than one geophysical dataset provides adequate confidence in the calculated results to overcome the problem of nonuniqueness. The calculated upper surface of the magma chamber delineated about five diapirs, three of which (ML, MK, and Ki) were grouped in one large plume of dense basic and ultrabasic materials. Compared with other studies, the integrated approach presented herein provides an in-depth understanding of the geometry of the magmatic chamber using an indirect CPD estimation to calculate the depth to the chamber’s upper surface. Finally, the new gravity model for Hawaii Island, which incorporates advanced software, corresponds well with the results of the magnetic data.
Key points
Estimates the depth to the bottom of the magnetized rocks based on calculating the Curie point depth beneath Hawaii Island.
Characterizes the morphology of the magmatic chamber beneath Hawaii Island using the gravity inversion technique.
Estimates the geothermal gradient and heat flow associated with the active volcanoes of Hawaii Island.
Data Availability Statement
The aeromagnetic field data (Hawaii-78-Hawaii, Godson et al., 1981) can be found at http://mrdata.usgs.gov/geophysics/surveys/geophysics2/HI/HI_1071.jpg and http://mrdata.usgs.gov/geophysics/surveys/geophysics2/HI/HI_1071.zip. The gravity measurements for Hawaii Island (Kauahikaua, 2017) can be found at https://doi.org/10.5066/F7V1230Q.
Author Contributions
All authors listed have made a substantial, direct, and intellectual contribution to the work and approved it for publication.
Conflict of Interest
The authors declare that the research was conducted in the absence of any commercial or financial relationships that could be construed as a potential conflict of interest.
Publisher’s Note
All claims expressed in this article are solely those of the authors and do not necessarily represent those of their affiliated organizations, or those of the publisher, the editors, and the reviewers. Any product that may be evaluated in this article, or claim that may be made by its manufacturer, is not guaranteed or endorsed by the publisher.
Acknowledgments
The authors would like to thank especially the staff members of U.S. Geological Survey and Hawaiian Volcano Observatory for providing the aeromagnetic field data (Hawaii-78-Hawaii, Godson et al., 1981) and making it available online. Deep thanks to Jim Kauahikaua for collecting the gravity measurements for the Hawaii Island that were published in Kauahikaua (2017) and making it available online. Deep thanks and gratitude also to the Researchers Supporting Project number (RSP-2021/351), King Saud University, Riyadh, Saudi Arabia for funding this research article.
References
Al Deep, M., Araffa, S. A. S., Mansour, S. A., Taha, A. I., Mohamed, A., and Othman, A. (2021). Geophysics and Remote Sensing Applications for Groundwater Exploration in Fractured Basement: A Case Study from Abha Area, Saudi Arabia. Journal of African Earth Sciences 184 (1), 104368.
Bansal, A. R., Anand, S. P., Rajaram, M., Rao, V. K., and Dimri, V. P. (2013). Depth to the Bottom of Magnetic Sources (DBMS) from Aeromagnetic Data of central India Using Modified Centroid Method for Fractal Distribution of Sources. Tectonophysics 603, 155–161. doi:10.1016/j.tecto.2013.05.024
Bansal, A. R., Dimri, V. P., Kumar, R., and Anand, S. P. (2016). “Curie Depth Estimation from Aeromagnetic for Fractal Distribution of Sources,” in Fractal Solutions for Understanding Complex Systems in Earth Sciences. Editor V. P. Dimri (Switzerland: Springer International Publishing), 19–31. doi:10.1007/978-3-319-24675-8_2
Barnoud, A., Coutant, O., Bouligand, C., Gunawan, H., and Deroussi, S. (2016). 3-D Linear Inversion of Gravity Data: Method and Application to Basse-Terre Volcanic Island, Guadeloupe, Lesser AntillesGeophysical Journal International. Geophys. J. Int. 205 (1), 562–574. doi:10.1093/gji/ggw030
Bhattacharyya, B. K., and Leu, L.-K. (1975a). Analysis of Magnetic Anomalies over Yellowstone National Park: Mapping of Curie point Isothermal Surface for Geothermal Reconnaissance. J. Geophys. Res. 80, 4461–4465. doi:10.1029/jb080i032p04461
Bhattacharyya, B. K., and Leu, L. K. (1977). Spectral Analysis of Gravity and Magnetic Anomalies Due to Rectangular Prismatic Bodies. Geophysics 42, 41–50. doi:10.1190/1.1440712
Bhattacharyya, B. K., and Leu, L. K. (1975b). Spectral Analysis of Gravity and Magnetic Anomalies Due to Two‐dimensional Structures. Geophysics 40, 993–1013. doi:10.1190/1.1440593
Blakely, R. J. (1995). Potential Theory in Gravity and Magnetic Applications. Cambridge: Cambridge University Press.
Blakely, R. J. (1996). Potential Theory in Gravity and Magnetic Applications. Cambridge: Cambridge University Press, 464.
Blakely, R. J. (1988). Curie Temperature Isotherm Analysis and Tectonic Implications of Aeromagnetic Data from Nevada. J. Geophys. Res. 93 (B10), 11817–11832. doi:10.1029/JB093iB10p11817
Blakely, R. J., and Hassanzadeh, S. (1981). Estimation of Depth to Magnetic Source Using Maximum Entropy Power Spectra, with Application to the Peru-Chile Trench. Geol. Soc. Am. Mem. 154, 667–682. doi:10.1130/mem154-p667
Boulanger, O., and Chouteau, M. (2001). Constraints in 3D Gravity Inversion. Geophys. Prospect. 49, 265–280. doi:10.1046/j.1365-2478.2001.00254.x
Byerly, P. E., and Stolt, R. H. (1977). An Attempt to Define the Curie point Isotherm in Northern and central Arizona. Geophysics 42, 1394–1400. doi:10.1190/1.1440800
Camacho, A. G., Fernández, J., and Gottsmann, J. (2011). A New Gravity Inversion Method for Multiple Subhorizontal Discontinuity Interfaces and Shallow Basins. J. Geophys. Res. 116, B02413. doi:10.1029/2010JB008023
Camacho, A. G., Montesinos, F. G., and Vieira, R. (1997). A Three-Dimensional Gravity Inversion Applied to São Miguel Island (Azores). J. Geophys. Res. 102 (B4), 7717–7730. doi:10.1029/96jb03667
Camacho, A. G., Montesinos, F. G., and Vieira, R. (2000). Gravity Inversion by Means of Growing Bodies. Geophysics 65 (1), 95–101. doi:10.1190/1.1444729
Castro, J., and Brown, L. (1987). Shallow Paleomagnetic Directions from Historic Lava Flows, Hawaii. Geophys. Res. Lett. 14 (12), 1203–1206. doi:10.1029/gl014i012p01203
Cella, F., Fedi, M., Florio, G., Grimaldi, M., and Rapolla, A. (2007). Shallow Structure of the Somma-Vesuvius Volcano from 3D Inversion of Gravity Data. J. Volcanology Geothermal Res. 161, 303–317. doi:10.1016/j.jvolgeores.2006.12.013
Chiozzi, P., Matsushima, J., Okubo, Y., Pasquale, V., and Verdoya, M. (2005). Curie-point Depth from Spectral Analysis of Magnetic Data in central-southern Europe. Phys. Earth Planet. Interiors 152, 267–276. doi:10.1016/j.pepi.2005.04.005
Christofferson, E. (1968). The Relationship of Sea-Floor Spreading in the Pacific to the Origin of the Emperor Seamounts and the Hawaiian Island Chain (abst.,). Am. Geophys. Union Trans. 49, 214.
Clague, D. A., and Dalrymple, G. B. (1987). Chapter I. The Hawaiian-Emperor Volcanic Chain. Part I. Geologic Evolution. USGS Profesisonal Paper 1350, 5–54.
Clague, D. A., and Dalrymple, G. B. (1989). “Tectonic, Geochronologayn, and Origin of the Hawaiian-Emperorv Olcanic Chain,” in The Eastern Pacific Ocean and Hawaii, the Geology of North America. Editors E. K. Winterer, D . M. Hussonga, and R. W. Decker (Boulder, Colo: Geological Society of America), 188–217.
Connard, G., Couch, R., and Gemperle, M. (1983). Analysis of Aeromagnetic Measurements from the Cascade Range in central Oregon. Geophysics 48, 376–390. doi:10.1190/1.1441476
Cox, A. (1975). The Frequency of Geomagnetic Reversals and the Symmetry of the Nondipole Field. Rev. Geophys. 13 (3), 35–52. doi:10.1029/rg013i003p00035
Easton, R. M. (1987). Volcanism in Hawaii. Stratigraphy of Kilauea Volcano. U.S. Geol. Surv. Prof. Pap. 1350, 243–260.
Eguíluz, L., Apraiz, A., and Abalos, B. (1999). Structure of the Castillo Granite, Southwest Spain: Variscan Deformation of a Late Cadomian Pluton. Tectonophysics 18 (6), 1041–1063.
Flanigan, V. J., Long, C. K., Rohret, D. H., and Mohr, P. J. (1986). Aeromagnetic Map of the Rift Zones of Kilauea and Mauna Loa Volcanoes, Island of Hawaii, Hawaii, U.S. Geol. Surv. Reston, VA: Misc. Field Invest. Map. MF–1845A.
Flinders, A. F., Ito, G., Garcia, M. O., Sinton, J. M., Kauahikaua, J., and Taylor, B. (2013). Intrusive dike Complexes, Cumulate Cores, and the Extrusive Growth of Hawaiian Volcanoes. Geophys. Res. Lett. 40, 3367–3373. doi:10.1002/grl.50633
Gabriel, G., Bansal, A. R., Dressel, I., Dimri, V. P., and Krawczyk, C. M. 2011. Curie Depths Estimation in Germany: Methodological Studies for Derivation of Geothermal Proxies Using New Magnetic Anomaly Data. 218(1):494–507. 10.1093/gji/ggz166
Gabriel, G., Dressel, I., Vogel, D., and Krawczyk, C. M. (2012). Depths to the Bottom of Magnetic Sources and Geothermal Prospectivity in Southern Germany. First Break 30, 39–47. doi:10.3997/1365-2397.2012001
Garcia-Abdeslem, J., and Ness, G. E. (1994). Inversion of the Power Spectrum from Magnetic Anomalies. Geophysics 59, 391–401.
Geosoft Oasis Montaj, v.8.2.4 (2015). Geosoft Software for the Earth Sciences. Toronto, Canada: Geosoft Inc.
Godson, R. H., Zablocki, C. J., Pierce, H. A., Frayser, J. B., Mitchell, C. M., and Sneddon, R. A. (1981). Aeromagnetic Map of the Island of Hawaii: USGS Geophysical Investigation Map GP-946, Scale 1:250,000. Data available online at https://catalog.data.gov/dataset/airborne-geophysical-survey-hawaii-78-hawaii.
Green, W. R. (1975). Inversion of Gravity Profiles by Use of a Backus‐gilbert Approach. Geophysics 40 (5), 763–772. doi:10.1190/1.1440566
Guillen, A., and Menichetti, V. (1984). Gravity and Magnetic Inversion with Minimization of a Specific Functional. Geophysics 49 (8), 1354–1360. doi:10.1190/1.1441761
Hahn, A., Kind, E. G., and Mishra, D. C. (1976). Depth Estimation of Magnetic Sources by Means of Fourier Amplitude Spectra*. Geophys. Prospect 24, 287–306. doi:10.1111/j.1365-2478.1976.tb00926.x
Hildenbrand, T. G., Rosenbaum, J. G., and Kauahikaua, J. P. (1993). Aeromagnetic Study of the Island of Hawaii. J. Geophys. Res. 98 (B3), 4099–4119. doi:10.1029/92jb02483
Hill, D. P., and Zucca, J. J. (1987). Geophysical Constraints on the Structure of Kilauea and Mauna Loa Volcanoes and Some Implications for Seismomagmatic Processes. U.S. Geol. Surv. Prof. Pap. 1350, 903–917.
Holcomb, R. T. (1987). Volcanism in Hawaii. Eruptive History and Long-Term Behavior of Kilauea Volcano. U.S. Geol. Surv. Prof. Pap. 1350, 261–350.
Hsieh, H.-H., Chen, C.-H., Lin, P.-Y., and Yen, H.-Y. (2014). Curie point Depth from Spectral Analysis of Magnetic Data in Taiwan. J. Asian Earth Sci. 90, 26–33. doi:10.1016/j.jseaes.2014.04.007
Idárraga-García, J., and Vargas, C. A. (2018). Depth to the Bottom of Magnetic Layer in South America and its Relationship to Curie Isotherm, Moho Depth and Seismicity Behavior. Geodesy and Geodynamics 9 (1), 93–107.
Intrepid Geophysics (2013). Intrepid Geophysics, 110/3 Male Street, Brighton Vic 3186 Australia. Data available online at www.intrepid-geophysics.com.
Jessop, A. M., Hobart, M. A., and Sclater, J. G. (1976). The Wsorld Heat Flow Data Collection 1975. Can.Earth Phys. Branch, Geotherm. Ser. 5, 125.
Jurado-Chichay, Z., Urrutia-Fucugauchi, J., and Rowland, S. K. (1993). A Paleomagnetic Study of the Pohue Bay Flow and its Associated Coastal Cones, Mauna Loa Volcano, Hawaii: Constraints on Their Origin and Temporal Relationships. Phys. Earth Planet. Interiors 97, 269–277.
Kauahikaua, J., Cashman, K. V., Clague, D. A., Champion, D., and Hagstrum, J. T. (2002). Emplacement of the Most Recent Lava Flows on Hualalai Volcano, Hawaii. Bull. Volcanology 64, 229–253.
Kauahikaua, J. (2017). Gravity Data for Island of Hawai`i.Csv. Geospatial Data Presentation Form: Tabular Data. Reston, VA: USGS. doi:10.5066/F7V1230Q
Kauahikaua, J., Hildenbrand, T., and Webring, M. (2000). Deep Magmatic Structures of Hawaiian Volcanoes, Imaged by Three-Dimensional Gravity Models. Geology 28 (10), 883–886. doi:10.1130/0091-7613(2000)028<0883:dmsohv>2.3.co;2
Langenheim, V. A. M., and Clague, D. A. (1987). Chapter 1. The Hawaiian-Emperor Volcanic Chain. Part II. Stratigraphic Framework of Volcanic Rocks of the Hawaiian Islands. USGS Profesisonal Paper 1350.
Li, Y., and Oldenburg, D. W. (1998). 3-D Inversion of Gravity Data. Geophysics 63 (1), 109–119. doi:10.1190/1.1444302
Lipman, P. W., and Swenson, A. (1984). Generalized Geologic Map of the Southwest Rift Zone of Mauna Loa Volcano, Hawaii. United States Geological Survey Miscellaneous Investigations Map 1-1312, Scale 1:100,000.
Lipman, P. W. (1980). The Southwest Rift Zone of Mauna Loa: Implications for Structural Evolution of Hawaiian Volcanoes. Am. J. Sci. 280-A, 752–776.
Lockwood, J. P., and Lipman, P. W. (1987). Holocene Eruptive History of Mauna Loa Volcano, Hawaii. USGS Prof. paper 1350, 509–535.
Macdonald, G. A., 1977. Geologic Map of the Mauna Loa Quadrangle, Hawaii. United States Geological Survey,Geologic Quadrangle Map, GQ-897, scale I: 24,000.
Marcotte, D., Shamsipour, P., Coutant, O., and Chouteau, M. (2014). Inversion of Potential fields on Nodes for Large Grids. J. Appl. Geophys. 110, 90–97. doi:10.1016/j.jappgeo.2014.09.003
McDougall, I., and Swanson, D. A. (1972). Potassium-Argon Ages of Lavas from the Hawi and Pololu Volcanic Series, Kohala Volcano, Hawaii. Geol. Soc. America Bull. 83, 3731–3738. doi:10.1130/0016-7606(1972)83[3731:paolft]2.0.co;2
Meneisy, A. M., and Al Deep, M. (2020). Investigation of Groundwater Potential Using Magnetic and Satellite Image Data at Wadi El Amal, Aswan, Egypt. Egypt. J. Remote Sens. Space Sci.. doi:10.1016/j.ejrs.2020.06.006
Miller, H. G., and Tuach, J. (1989). Gravity and Magnetic Signatures of the Ackley Granite Suite, southeastern Newfoundland: Implications for Magma Emplacement. Can. J. Earth Sci. 26, 2697–2709. doi:10.1139/e89-229
Mohamed, A. (2019). Hydro-Geophysical Study of the Groundwater Storage Variations Over the Libyan Area and its Connection to the Dakhla Basin in Egypt. J. African Earth Sci. 157, 103508. doi:10.1016/j.jafrearsci.2019.05.016
Mohamed, A. (2020a). Gravity Based Estimates of Modern Recharge of the Sudanese Area. J. African Earth Sci. 163, 103740. doi:10.1016/j.jafrearsci.2019.103740
Mohamed, A. (2020b). Gravity Applications in Estimating the Mass Variations in the Middle East: A Case Study from Iran. Arab J Geosci. 13, 364. doi:10.1007/s12517-020-05317-7
Mohamed, A. (2020c). Gravity Applications to Groundwater Storage Variations of the Nile Delta Aquifer. J. Appl. Geophys. 182, 104177. doi:10.1016/j.jappgeo.2020.104177
Mohamed, A., Abdelrahman, K., and Abdelrady, A. (2022). Application of Time-Variable Gravity to Groundwater Storage Fluctuations in Saudi Arabia. Front. Earth Sci. 10, 873352. doi:10.3389/feart.2022.873352
Mohamed, A., and Abu El Ella, E. M. (2021). Magnetic Applications to Subsurface and Groundwater Investigations: A Case Study from Wadi El Assiuti, Egypt. Int. J. Earth Sci. 12, 77–101. doi:10.4236/ijg.2021.122006
Mohamed, A., and Al Deep, M. (2021). Depth to the Bottom of the Magnetic Layer, Crustal Thickness, and Heat Flow in Africa: Inferences from Gravity and Magnetic Data. J. African Earth Sci. 179, 104204.
Mohamed, A., and Gonçalvès, J. (2021). Hydro-Geophysical Monitoring of the North Western Sahara Aquifer System's Groundwater Resources Using Gravity Data. J. African Earth Sci. 178, 104188. doi:10.1016/j.jafrearsci.2021.104188
Mohamed, A., Ragaa Eldeen, E., and Abdelmalik, K. (2021). Gravity Based Assessment of Spatio-Temporal Mass Variations of the Groundwater Resources in the Eastern Desert, Egypt. Arab. J. Geosci. 14, 500. doi:10.1007/s12517-021-06885-y
Mohamed, A., Sultan, M., Ahmed, M., Yan, E., and Ahmed, E. (2017). Aquifer Recharge, Depletion, and Connectivity: Inferences from GRACE, Land Surface Models, and Geochemical and Geophysical Data. Geol. Soc. Am. 129, 534–546. doi:10.1130/B31460.1
Mohamed, A., and Al Deep, M. (2021). Depth to the Bottom of the Magnetic Layer, Crustal Thickness, and Heat Flow in Africa: Inferences from Gravity and Magnetic Data. J. Afr. Earth Sci. 179, 104204. doi:10.1016/j.jafrearsci.2021.104204
Montesinos, F. G., Arnoso, J., Benavent, M., and Vieira, R. (2006). The Crustal Structure of El Hierro (Canary Islands) from 3-D Gravity Inversion. J. Volcanology Geothermal Res. 150, 283–299. doi:10.1016/j.jvolgeores.2005.07.018
Moore, J. G. (2001). Density of basalt Core from Hilo Drill Hole, Hawaii. J. Volcanology Geothermal Res. 112 (1), 221–230. doi:10.1016/S0377-0273(01)00242-6
Moore, R. B., Clague, D. A., Rubin, M., and Bohrson, W. A. (1987). Chapter 20. Hualalai Volcano: A Preliminary Summary of Geologic, Petrologic, and Geophysical Data. USGS Profesisonal Paper 1350.
Morgan, W. J. (1972a). Deep Mantle Convection Plumes and Plate Motions. Am. Assoc. Pet. Geologists Bull. 56, 203–213. doi:10.1306/819a3e50-16c5-11d7-8645000102c1865d
Morgan, W. J. (1972b). Plate Motions and Deep Mantle Convection. Geol. Soc. America Memoir 132, 7–22. doi:10.1130/mem132-p7
Nasa, J. P. L. (2013) Topography Mission Global 1 Arc Second [Data Set]. NASA EOSDIS Land Processes DAAC. doi:10.5067/MEaSUREs/SRTM/
Nwankwo, L. I., and Shehu, A. T. (2015). Evaluation of Curie-point Depths, Geothermal Gradients and Near-Surface Heat Flow from High-Resolution Aeromagnetic (HRAM) Data of the Entire Sokoto Basin, Nigeria. J. Volcanology Geothermal Res. 305, 45–55. doi:10.1016/j.jvolgeores.2015.09.017
Nwankwo, L. I., and Sunday, A. J. (2017). Regional Estimation of Curie-point Depths and Succeeding Geothermal Parameters from Recently Acquired High-Resolution Aeromagnetic Data of the Entire Bida Basin, north-central Nigeria. Geoth. Energ. Sci. 5, 1–9. doi:10.5194/gtes-5-1-2017
Obande, G. E., Lawal, K. M., and Ahmed, L. A. (2014). Spectral Analysis of Aeromagnetic Data for Geothermal Investigation of Wikki Warm Spring, north-east Nigeria. Geothermics 50, 85–90. doi:10.1016/j.geothermics.2013.08.002
Okubo, P. G., Benz, H. M., and Chouet, B. A. (1997). Imaging the Crustal Magma Sources beneath Mauna Loa and Kilauea Volcanoes, Hawaii. Geol 25, 867–870. doi:10.1130/0091-7613(1997)025<0867:itcmsb>2.3.co;2
Okubo, Y., Graf, R. J., Hansen, R. O., Ogawa, K., and Tsu, H. (1985). Curie point Depths of the Island of Kyushu and Surrounding Areas, Japan. Geophysics 50 (3), 481–494. doi:10.1190/1.1441926
Okubo, Y., and Matsunaga, T. (1994). Curie point Depth in Northeast Japan and its Correlation with Regional thermal Structure and Seismicity. J. Geophys. Res. 99, 363–437. doi:10.1029/94jb01336
Park, J., Morgan, J. K., Zelt, C. A., Okubo, P. G., Peters, L., and Benesh, N. (2007). Comparative Velocity Structure of Active Hawaiian Volcanoes from 3-D Onshore-Offshore Seismic Tomography. Earth Planet. Sci. Lett. 259, 500–516. doi:10.1016/j.epsl.2007.05.008
Porter, S. C. (1979a). Hawaiian Glacial Ages. Quat. Res. 12, 161–187. doi:10.1016/0033-5894(79)90055-3
Porter, S. C. (1979b). Quaternary Stratigraphy and Chronology of Mauna Kea, Hawaii: A 380,000-yr Record of Mid-Pacific Volcanism and Ice-Cap Glaciation. Geol. Soc. America Bull. Part 90, 980–1093. doi:10.1130/gsab-p2-90-980
Radhakrishna Murthy, I. V., and Rama Rao, P. (1993). Inversion of Gravity and Magnetic Anomalies of Two-Dimensional Polygonal Cross Sections. Comput. Geosciences 19 (9), 1213–1228. doi:10.1016/0098-3004(93)90026-2
Rajaram, M. (2007). “Encyclopedia of Geomagnetism and Paleomagnetism,” in Encyclopedia of Geomagnetism and Paleomagnetism. Editors D. Gubbins, and E. Herrero-Bervera (Dordrecht: Springer). doi:10.1007/978-1-4020-4423-6
Ravat, D., Pignatelli, A., Nicolosi, I., and Chiappini, M. (2007). A Study of Spectral Methods of Estimating the Depth to the Bottom of Magnetic Sources from Near-Surface Magnetic Anomaly Data. Geophys. J. Int. 169, 421–434. doi:10.1111/j.1365-246x.2007.03305.x
Robinson, J. E., and Eakins, B. W. (2006). Calculated Volumes of Individual Shield Volcanoes at the Young End of the Hawaiian Ridge. J. Volcanology Geothermal Res. 151 (1), 309–317. doi:10.1016/j.jvolgeores.2005.07.033
Ross, H. E., Blakely, R. J., and Zoback, M. D. (2006). Testing the Use of Aeromagnetic Data for the Determination of Curie Depth in California. Geophysics 71, L51–L59. doi:10.1190/1.2335572
Shuey, R. T., Schellinger, D. K., Tripp, A. C., and Alley, L. B. (1977). Curie Depth Determination from Aeromagnetic Spectra. Geophys. J. Int. 50, 75–101. doi:10.1111/j.1365-246X.1977.tb01325.x
Spector, A., and Grant, F. S. (1970). Statistical Models for Interpreting Aeromagnetic Data. Geophysics 35 (2), 293–302. doi:10.1190/1.1440092
Speranza, F., Minelli, L., Pignatelli, A., Gilardi, M., and Gilardi, M. (2016). Curie Temperature Depths in the Alps and the Po Plain (Northern Italy): Comparison with Heat Flow and Seismic Tomography Data. J. Geodynamics 98, 19–30. doi:10.1016/j.jog.2016.03.012
Springer, M. (1999). Interpretation of Heat-Flow Density in the Central Andes. Tectonophysics 306 (3), 377–395. doi:10.1016/s0040-1951(99)00067-0
Stearns, H. T., and Macdonald, G. A. (1946). Geology and Groundwater Resources of the Island of Hawaii: Hawaii Division of Hydrogeology. Bulletin 9, 363.
Swanson, D. A. (2005). Age Determination by D.A. Swanson on Basis of Detailed Tephra Stratigraphic Studies for Lava-Flow Units Shown. Wolfe and Morris.
Taha, A. I., Al Deep, M., and Mohmed, A. (2021). Investigation of Groundwater Occurrence Using Gravity and Electrical Resistivity Methods: A Case Study from Wadi Sar. Arab. J. Geosci. 14, 334. doi:10.1007/s12517-021-06628-z
Tanaka, A., Okubo, Y., and Matsubayashi, O. (1999). Curie point Depth Based on Spectrum Analysis of Magnetic Anomaly Data in East and Southeast Asia. Tectonophysics 306 (3e4), 461e470. doi:10.1016/S0040-1951(99)00072-4
Thurber, C. H. (1984). Seismic Detection of the summit Magma Complex of Kilauea Volcano, Hawaii. Science 223, 165–167. doi:10.1126/science.223.4632.165
Trifonova, P., Zhelev, Z., Petrova, T., and Bojadgieva, K. (2009). Curie point Depths of Bulgarian Territory Inferred from Geomagnetic Observations and its Correlation with Regional thermal Structure and Seismicity. Tectonophysics 473, 362–374. doi:10.1016/j.tecto.2009.03.014
Vigneresse, J. L. (1995a). Control of Granite Emplacement by Regional Deformation. Tectonophysics 249, 173–186. doi:10.1016/0040-1951(95)00004-7
Vigneresse, J. L. (1995b). Crustal Regime of Deformation and Ascent of Granitic Magma. Tectonophysics 249, 187–202. doi:10.1016/0040-1951(95)00005-8
Wilson, J. T. (1963a). A Possible Origin of the Hawaiian Islands. Can. J. Phys. 41, 863–870. doi:10.1139/p63-094
Wilson, J. T. (1963c). Evidence from Islands on the Spreading of Ocean Floors. Nature 197, 536–538. doi:10.1038/197536a0
Wolfe, E. W., and Morris, J. (1996a). Geologic Map of the Island of Hawaii: USGS Miscellaneous Investigations Series Map I-2524-A, Scale 1:100000, 3 Sheets.
Wolfe, E. W., Wise, W. S., and Dalrymple, G. B. (1997). The Geology and Petrology of Mauna Kea Volcano, Hawaii-A Study of Postshield Volcanism. U.S. Geol. Surv. Prof. Paper 1557, 129.
Yang, K., Xing, J., Gong, W., Li, C., and Wu, X. (2017). Curie Point Depth from Spectral Analysis of Magnetic Data in the Southeast Tibet. Earth 6 (5), 88–96. doi:10.11648/j.earth.20170605.15
Keywords: magmatic chamber, gravity inversion, Curie depth point, geothermal gradient, heat flow, Hawaii Island
Citation: Mohamed A, Al Deep M, Abdelrahman K and Abdelrady A (2022) Geometry of the Magma Chamber and Curie Point Depth Beneath Hawaii Island: Inferences From Magnetic and Gravity Data. Front. Earth Sci. 10:847984. doi: 10.3389/feart.2022.847984
Received: 03 January 2022; Accepted: 28 January 2022;
Published: 28 March 2022.
Edited by:
Amin Beiranvand Pour, INOS University Malaysia Terengganu, MalaysiaCopyright © 2022 Mohamed, Al Deep, Abdelrahman and Abdelrady. This is an open-access article distributed under the terms of the Creative Commons Attribution License (CC BY). The use, distribution or reproduction in other forums is permitted, provided the original author(s) and the copyright owner(s) are credited and that the original publication in this journal is cited, in accordance with accepted academic practice. No use, distribution or reproduction is permitted which does not comply with these terms.
*Correspondence: Ahmed Mohamed, YWhtZWRtb2hhbWVkQGF1bi5lZHUuZWc=
 Ahmed Mohamed
 Mohamed Al Deep
 Kamal Abdelrahman
 Ahmed Abdelrady