 Zhiguo Rao
 Yiping Tian
95% of researchers rate our articles as excellent or good
Learn more about the work of our research integrity team to safeguard the quality of each article we publish.
Find out more
REVIEW article
Front. Earth Sci. , 21 February 2022
Sec. Quaternary Science, Geomorphology and Paleoenvironment
Volume 10 - 2022 | https://doi.org/10.3389/feart.2022.845650
This article is part of the Research Topic Integration of Records and Simulations in Paleoclimatology View all 7 articles
The temperature history of the Holocene is intensely debated, with both proxy seasonality effects and climate model sensitivity being proposed as possible reasons for the “Holocene temperature conundrum”. However, possible human impacts on terrestrial proxies are often not adequately considered, especially for the late Holocene. Based on a review of pollen-based and pollen-dominated temperature records on regional, continental and global scales, we propose that pollen may be a poor indicator of temperature change in late Holocene, mainly as a result of the impacts of intensified human activities on terrestrial vegetation. Thus, we suggest that possible human impacts on terrestrial Holocene temperature records should be carefully evaluated; and also that more Holocene temperature records are obtained from areas without significant direct human impacts, or that proxies that are insensitive to human impacts are used for late Holocene climatic reconstruction.
During the past decade or so, the temperature history of the Holocene has been intensely debated. In 2013, based mainly on marine records (∼80%), a stacked record (hereafter termed MR13) was used to indicate a warmer stage of global mean annual temperature during 10–5 ka, followed by a cooling trend, and that an overall long-term cooling trend occurred during the Holocene (Marcott et al., 2013). In 2014, simulated global mean annual temperature records estimated using different climate models were proposed to show an overall long-term warming trend during the Holocene (Liu et al., 2014). Subsequently, the reconstructed long-term cooling and simulated long-term warming trends during the Holocene came to be known as the “Holocene temperature conundrum” (Liu et al., 2014), which has been much debated ever since. Both the sensitivity of the climate models and the seasonality of the proxy reconstructions were originally proposed as the most plausible reasons for the “Holocene temperature conundrum” (Liu et al., 2014).
However, subsequent reconstructed and stacked Holocene temperature records present a confusing picture. Ice wedge and stalagmite δ18O records, respectively from the Siberian Arctic (Meyer et al., 2015) and the southern Ural Mountains (Baker et al., 2017), have been proposed as indicators of winter temperature changes, which suggest an overall Holocene long-term warming trend. On the regional scale, the stacked Holocene temperature records for the latitudinal bands of 90–70°N, 70–50°N and 50–30°N show pronounced long-term cooling trends, but those for the latitudinal bands of 30–10°N and from 10°N to 10°S show no apparent long-term trends (Routson et al., 2019). Recently, 44 marine records from the region of 40°N to 40°S, together with a new method to determine possible seasonality, were used to produce a stacked record of seasonal and mean annual sea surface temperature (MASST, hereafter termed BS21). The seasonal and mean annual temperature records show overall long-term cooling and warming trends, respectively (Bova et al., 2021). On the global scale, based mainly on terrestrial records (∼70% of the total), a recent stacked record of Holocene global mean surface temperature (hereafter termed Temperature 12K) shows a warming trend from the last deglaciation to the mid-Holocene, with the warmest interval at ∼6.5 ka, which was followed by a long-term cooling trend in the late Holocene (Kaufman et al., 2020a). Most recently, on the global scale, based on 539 globally distributed marine records and using paleoclimate data assimilation method, the stacked global mean surface temperature record (ΔGMST, hereafter termed OM21) shows a slightly but steadily warming of ∼0.5°C since ∼9 ka in the early Holocene (Osman et al., 2021).
Fossil pollen data have long been used to reconstruct the temperature history of the Holocene. For example, pollen records from China have been adopted as evidence to support the traditional viewpoint of a mid-Holocene Megathermal that was followed by a cooling trend in the late Holocene (Shi et al., 1994). Regional pollen data from Europe have also been used for Holocene temperature reconstruction (e.g., Davis et al., 2003; Mauri et al., 2015). More importantly, pollen records are typically incorporated within the abovementioned regional and global stacked Holocene temperature records (e.g., Routson et al., 2019; Kaufman et al., 2020a, b). The accelerated development of human civilization during the Holocene, and the resulting intensification of human impacts on Earth’s surface environment, are well known (e.g., Stephens et al., 2019), including impacts on the terrestrial vegetation (e.g., Mottl et al., 2021). We therefore suggest that in addition to possible seasonality signals in proxy reconstructions and limitations in model simulations (Zhang et al., 2022), the possible impacts of human activity on the terrestrial proxy reconstructions should also be carefully considered. Given that Holocene pollen records from locations such as polar regions and high mountains are not necessarily significantly impacted by human activity, we now address the issue of human impacts on pollen records on progressively larger spatial scales, from regional to continental and global.
Based on paleoclimatic records obtained in China since the 1970s, which are mainly pollen records, the concept of a mid-Holocene Megathermal in China was proposed in the early 1990s (Shi et al., 1994). Specially, the interval of ∼8.3 – 3 ka was proposed as the mid-Holocene Megathermal, with ∼7.2 – 6 ka as the Megathermal Maximum, which was followed by a long-term cooling trend during the late Holocene. This viewpoint has had a wide and long-standing influence on the Chinese academic community, and doubtless it has made a large historical contribution to promoting studies of Holocene climate change. However, as was stated in the original paper (Shi et al., 1994), and as indicated by recent results (e.g., Cheng et al., 2018; Li F. et al., 2020; Chen et al., 2020), there are uncertainties regarding the supporting pollen evidence.
Notably, the cited supporting pollen records (Figures 1A–I) are mainly from the monsoonal humid region of China (Figure 1J; Chen et al., 2008). Moreover, it was clearly stated in the original paper that “human activities during the Neolithic also had considerable effects on natural vegetation in some places” (in fifth sentence in third paragraph in page 354) (Shi et al., 1994). As demonstrated by Figures 1K,L, for both the Neolithic Age (∼10–4 ka) and the Bronze Age after ∼4 ka (Sun et al., 2019), there is a dense distribution of archaeological sites in monsoonal humid China (Dong et al., 2020), indicating that the environment of the region was potentially strongly influenced by human activity, especially during the late Holocene. A recent high-resolution pollen record from the northern South China Sea demonstrates that the pattern of Holocene pollen changes is unusual compared with that during the previous four peak interglacial. This suggests that the natural vegetation in southern China was substantially and possibly permanently altered by human activities after ∼6 – 5 ka (Cheng et al., 2018). Similarly, a recent quantitative reconstruction of anthropogenic changes in land cover in China, using a novel methodology, demonstrated that cultivated land has been a significant component of the land cover in monsoonal humid China since ∼3 ka (Figure 1J; Li F. et al., 2020). Considering that the natural vegetation of monsoonal humid China has been significantly modified by human activities from the late Holocene onwards, the late Holocene cooling trend in the region, as inferred from pollen data, is questionable. Notably, warmer stages in the early and late Holocene, with a colder stage in the mid-Holocene, are proposed based on recent pollen data from the Bohai Bay in northern China (Chen et al., 2020), which is quite different from the concept of a mid-Holocene Megathermal. Based on pollen evidence of an abrupt decrease in Quercus and increase in secondary coniferous forest, it is suggested that the late Holocene vegetation in the nearby Shandong Peninsula was strongly influenced by human activities (Chen et al., 2020).
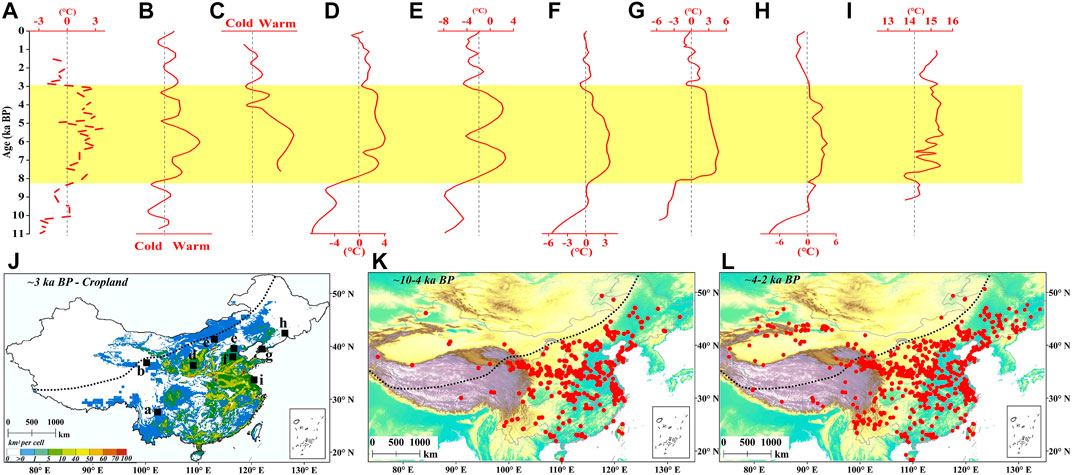
FIGURE 1. (A–I), Pollen-based Holocene temperature records from monsoonal humid China which support a mid-Holocene Megathermal and a long-term cooling trend during the late Holocene (Shi et al., 1994). (J), Spatial distribution of the pollen-based Holocene temperature records shown in the upper column (represented by the same codes). The dashed black line represents the modern monsoonal limit (Chen et al., 2008), and the background colors represent the proportion of cultivated lands at ∼3 ka (Li F. et al., 2020). (K, L), Spatial distribution of Chinese archaeological sites for the intervals of ∼10–4 ka and ∼4–2 ka, respectively (Dong et al., 2020).
Based on sedimentary pollen data from 642 sites in North America and Europe (Figure 2A), the composite Holocene mean annual temperature record of Marsicek et al. (2018) (hereafter termed MJ18), at a continental scale, indicates abrupt warming during ∼11–10 ka, further warming during ∼10–6 ka, the warmest interval during ∼6–4 ka, and a slight cooling trend since ∼4 ka (Figure 2B). The overall long-term Holocene warming trend in MJ18 is consistent with the previously-reported climate model simulation results (Liu et al., 2014), but the slight cooling trend since ∼4 ka in MJ18 is not consistent with this simulated trend (Liu et al., 2014).
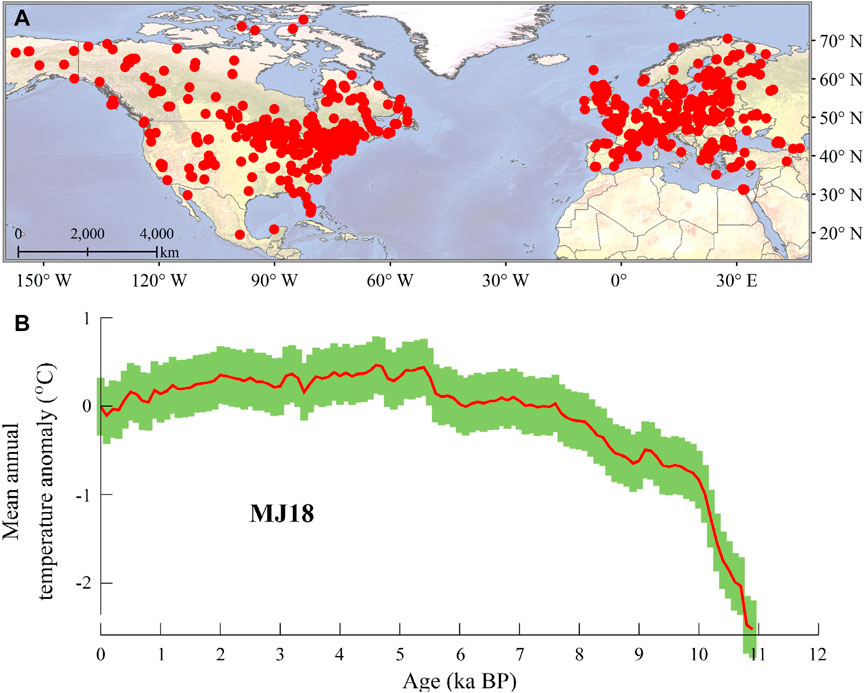
FIGURE 2. Spatial distribution of pollen records in North America and Europe (A) and the corresponding regional stacked mean annual temperature record (B); Marsicek et al., 2018.
Based on 3,980 calibrated 14C ages from 632 globally-distributed lakes, records of sedimentation rates demonstrate that soil erosion in the lake watersheds, spanning a substantial portion of the Earth’s terrestrial surface, increased significantly after ∼4 ka (Jenny et al., 2019). Additionally, based on 43,669 pollen data from these lakes, a decrease in tree cover was found to have occurred simultaneously, beginning at ∼4 ka in most lake watersheds. These changes in sedimentation rate and vegetation cover are proposed to have been caused mainly by anthropogenic land clearance that resulted in increased soil erosion. It is noteworthy that ∼88% of the 632 globally-distributed lakes are located in North America and Europe (Jenny et al., 2019). Therefore, on the one hand, the pollen data from 642 sites in North America and Europe were used to compile MJ18 (Marsicek et al., 2018), which shows a slight cooling trend since ∼4 ka (Figure 2B); while on the other hand, the decreased tree cover in most lake watersheds in North America and Europe since ∼4 ka was attributed to anthropogenic deforestation (Jenny et al., 2019). These observations highlight the uncertainties involved in interpreting late Holocene pollen data from North America and Europe as an indicator of temperature changes. Arguably, the pollen-based slight cooling trend since ∼4 ka, which largely parallels the decrease in tree pollen, is quite possibly not a genuine climate signal and is instead a result of human activities (Li Y. et al., 2020).
Based on 1,319 Holocene records from 679 globally-distributed sites (Figure 3A), a composite global mean surface temperature record (hereafter termed Temperature 12K) (Figure 3B) was developed (Kaufman et al., 2020a). Among the 679 sites, 470 (i.e., ∼70% of the total) are terrestrial sites, and more importantly, of the 1,319 records, 785 (∼60%) are pollen records (Kaufman et al., 2020b). Considering that there are 9 pollen records in the 359 marine records, the percentage of pollen records in the terrestrial records exceeds 80% (Kaufman et al., 2020b), with the majority of the pollen records from North America and Europe and the remainder from other continents, including Asia, Oceania, Africa and South America (Figure 3A). Therefore, the terrestrial records are dominated by pollen records and Temperature 12K is dominated by terrestrial records; i.e. the pattern of Holocene temperature change in Temperature 12K (Figure 3B) is largely determined by pollen records.
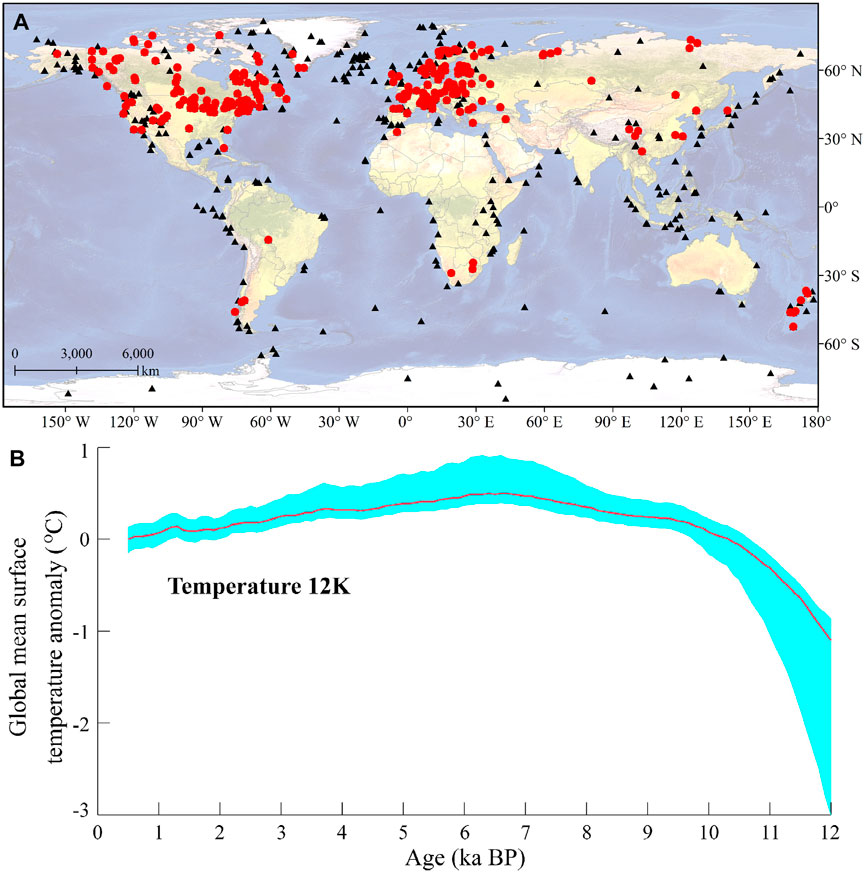
FIGURE 3. Spatial distribution of 1,319 selected global records (A) (note that most of them are pollen records, represented by red dots) and the corresponding stacked global mean surface temperature record (B); Kaufman et al., 2020a.
As demonstrated by Temperature 12K (Figure 3B), the global mean surface temperature shows a pattern of relatively rapid warming during ∼12–10 ka, moderate warming during ∼10–7 ka, the warmest interval at ∼6.5 ka, and long-term cooling after ∼6 ka. Based on the research of more than 250 archaeologists, a recent empirical assessment on a global scale suggested that since ∼3 ka the land cover of the Earth’s surface was largely transformed by pastoralists, farmers and hunter-gatherers (Stephens et al., 2019), highlighting the potentially significant damage to the natural vegetation in regions of intensive human activities in the late Holocene. Most recently, changes in the rates of vegetation composition for all continents since 18 ka were reconstructed (Mottl et al., 2021). The records are based on newly-developed statistical methods and 1,181 pollen records from globally-distributed sites, which largely replicate the distribution of the pollen records that were used to generate Temperature 12K; most of the records are from North America and Europe with the rest from Asia, Oceania, Africa and South America (Mottl et al., 2021). The results demonstrate a worldwide acceleration of rates of change of vegetation composition during ∼4.6–2.9 ka, which was unprecedented in both magnitude and extent since 18 ka. More importantly, for all continents, the rates of vegetation compositional change in the late Holocene equal or exceed that during the last deglaciation, which were suggested to have been dominantly driven by human activity and climate change, respectively. That is, the extent of human modification of terrestrial ecosystems in the late Holocene quite possibly exceeds the climate-driven transformation of terrestrial environments during the last deglaciation (Mottl et al., 2021). Therefore, the late Holocene long-term cooling trend in Temperature 12K (Kaufman et al., 2020a), which is largely determined by globally-distributed pollen data, arguably resulted from human activities.
On various spatial scales, including regional, continental and global, sedimentary pollen data have been widely used to reconstruct the temperature history of the Holocene. Most of these records indicate a long-term cooling trend during the late Holocene (Figures 1–3). However, new pollen and paleoenvironmental data from monsoonal humid China (e.g., Cheng et al., 2018; Li F. et al., 2020; Chen et al., 2020), North America and Europe (e.g., Jenny et al., 2019) and on a global scale (e.g., Stephens et al., 2019; Mottl et al., 2021), all emphasize the significant impacts of humans on the natural vegetation in the late Holocene. In principle, the observed vegetation changes could be the result of climate change and/or human activities. However, for the late Holocene, given the well-documented intensification of human activity, we suggest that possible human impacts on the natural vegetation—and thus on the reconstructed temperature history inferred from vegetation changes—should not be ignored.
From another perspective it is widely accepted that the global mean temperature is closely related to global ice volume and the associated sea-level changes, and that atmospheric greenhouse gases (GHG) and insolation respectively are the most important internal and external drivers of global climate change. The global stacked ice-volume equivalent sea-level record (Lambeck et al., 2014) increases rapidly from the last deglaciation to the mid-Holocene but shows no obvious trend during the late Holocene (Figure 4A). The areal extent of the Laurentide ice sheet (LIS) in mid-to high latitudes of the Northern Hemisphere (Dyke, 2004), as a possible index of global ice volume, decreased rapidly from the last deglaciation to the mid-Holocene, but with no expansion in the late Holocene (Figure 4B). Radiative forcing by GHG (CO2, CH4 and N2O) (Köhler et al., 2017) decreased slightly during ∼11–7 ka, then increased slightly, and was followed by a rapid large-amplitude post-industrial increase (Figure 4C). The mean annual insolation radiative forcing (Berger, 1978) was more moderate and increased smoothly during the Holocene (Figure 4D). Based on this evidence, we suggest that the proposed overall long-term cooling trend during the Holocene, as demonstrated by MR13 (Marcott et al., 2013; Figure 4E) is questionable. Conversely, the proposed overall long-term warming trend during the Holocene, as demonstrated by OM21 (Osman et al., 2021; Figure 4F) and BS21 (Bova et al., 2021; Figure 4G), which is proposed to be of global significance, is more reasonable. That is, there are inconsistencies between MR13 (Figure 4E) and the records of sea-level, LIS areal extent, GHG and annual insolation radiative forcing that shown in Figures 4A–D; but, OM21 and BS21 (Figures 4F,G) provide better matches to the records shown in Figures 4A–D.
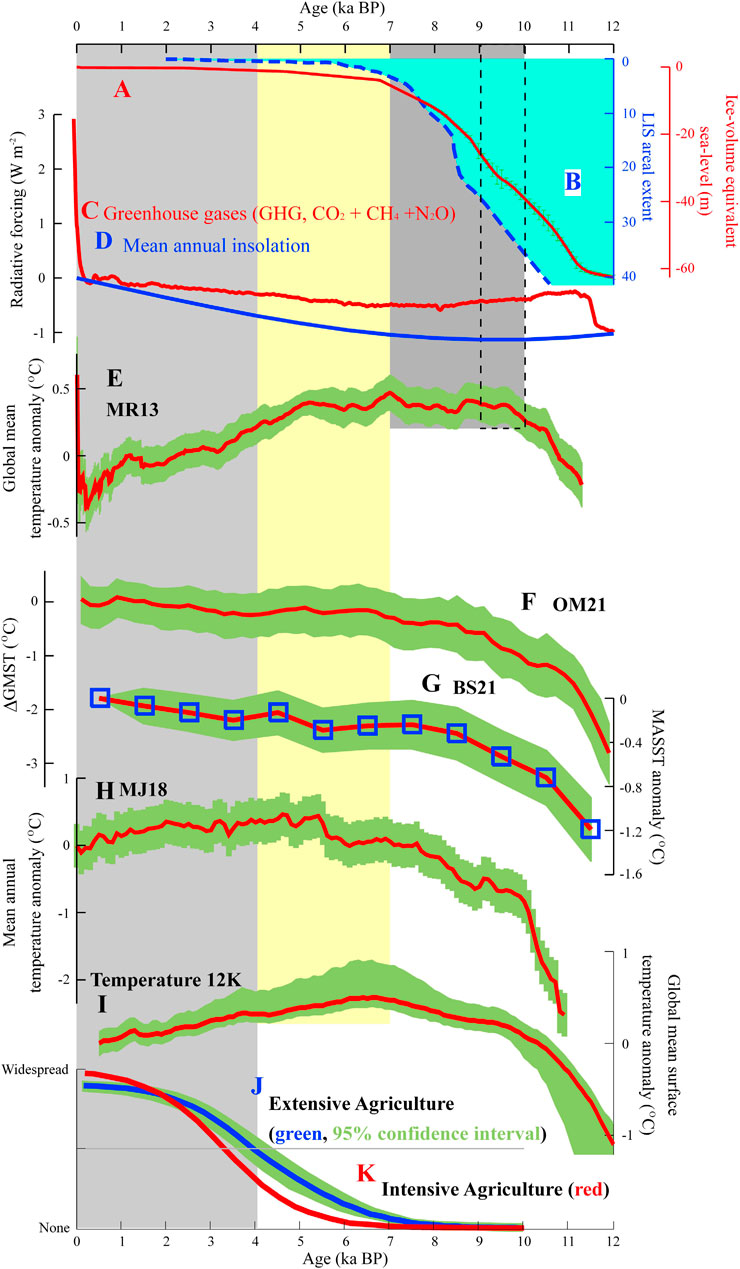
FIGURE 4. Comparison of selected Holocene paleotemperature and paleoenvironmental records: (A), Globally stacked ice-volume equivalent sea-level (Lambeck et al., 2014); (B), LIS areal extent (Dyke, 2004); (C), GHG radiative forcing (Köhler et al., 2017); (D), mean annual insolation radiative forcing (Berger, 1978); (E), MR13 temperature stack (Marcott et al., 2013); (F), OM21 temperature stack (Osman et al., 2021); (G), BS21 temperature stack (Bova et al., 2021); (H), MJ18 temperature stack (Marsicek et al., 2018); (I), Temperature 12K record (Kaufman et al., 2020a); (J), Globally estimated spatial expansion of the extensive agriculture (Stephens et al., 2019); (K), Globally estimated spatial expansion of the intensive agriculture (Stephens et al., 2019).
Notably, the warming trends from the last deglaciation to the mid-Holocene that evident in pollen-based MJ18 (Marsicek et al., 2018; Figure 4H) and pollen-dominated Temperature 12K (Kaufman et al., 2020a; Figure 4I) are consistent with OM21 (Osman et al., 2021; Figure 4F) and BS21 (Bova et al., 2021; Figure 4G), with the areal extent of the LIS (Dyke, 2004; Figure 4B), and with the global stacked ice-volume equivalent sea-level record (Lambeck et al., 2014; Figure 4A). This consistency supports the reliability of pollen data as an indicator of temperature change from the last deglaciation to the mid-Holocene. However, the long-term late Holocene cooling trends evident in pollen-based MJ18 and pollen-dominated Temperature 12K are inconsistent with OM21 and BS21, and with records of mean annual insolation and GHG radiative forcing, LIS areal extent, and global stacked ice-volume equivalent sea-level. This raises a question regarding the reliability of the pollen data as an indicator of temperature change during the late Holocene. Notably, as indicated by the globally estimated spatial expansions of both the extensive agriculture (Figure 4J) and intensive agriculture (Figure 4K), the human activities and their impacts on terrestrial surface environment were significantly intensified in the late Holocene (Stephens et al., 2019), supporting our suspicious about the above-mentioned pollen-based and pollen-dominated late Holocene temperature records.
Reference to the stacked Holocene temperature records for different latitudinal bands (Routson et al., 2019; Figure 5) reveals only two pollen records among the 20 records for the latitudinal band of 90–70°N (Figure 5A). However, the warmest Holocene interval of ∼10–8 ka in the stacked temperature record for this latitudinal band (90–70 °N; Figure 5B) is questionable, due to the large remnant terrestrial ice sheets at mid-to high latitudes of the Northern Hemisphere during ∼10–8 ka (Figure 4B). For the latitudinal bands of 70–50 and 50–30 °N, there are 47 and 23 pollen records among the 103 and 65 adopted records, respectively (Figure 5A); however, for the latitudinal bands of 30–10 °N and 10 °N to 10 °S, there are only 1 and 0 pollen records among the 22 and 26 adopted records, respectively (Figure 5A). We therefore question the validity of the proposed different Holocene temperature patterns for these latitudinal bands (i.e. long-term cooling trends for 70–50 and 50–30 °N and no apparent trends for 30–10 °N and 10 °N to 10 °S) (Figures 5C–F), and instead suggest that the patterns are determined by the different proxies used. That is, the long-term Holocene cooling trends for 70–50 (Figure 5C) and 50–30 °N (Figure 5D) are largely determined by pollen records (Figure 5A). These results further highlight the uncertainties in the late Holocene cooling trends indicated by pollen data (Figure 5). Notably, for the relevant stacked Holocene temperature of both global (Kaufman et al., 2020a; Figure 3A) and different latitudinal bands (Routson et al., 2019; Figure 5A), the most important portion of pollen records are from North America and Europe. At the same time, both the intensified human activities, especially that in the late Holocene in Europe (Ruddiman et al., 2016, 2020), and the possible anthropogenic deforestation in the late Holocene in North America and Europe (Jenny et al., 2019), have been repeatedly emphasized.
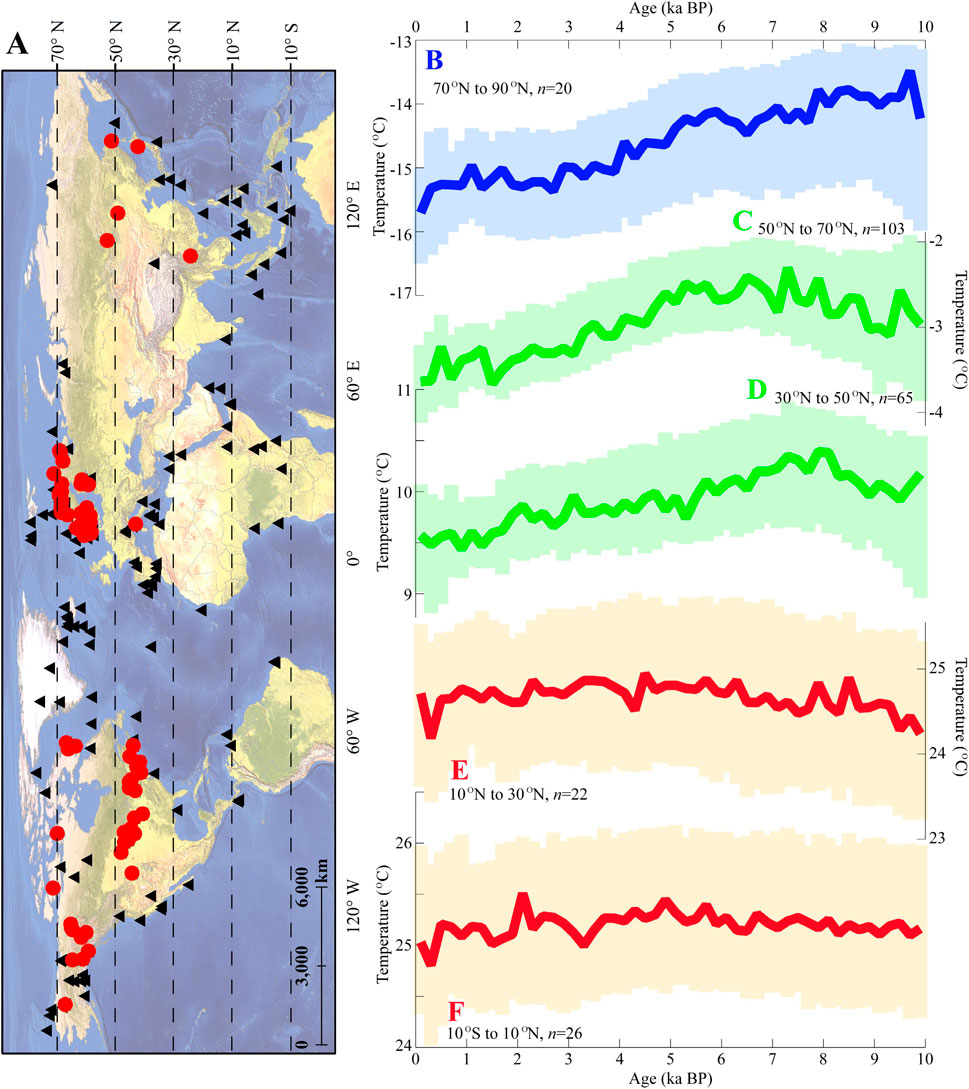
FIGURE 5. Spatial distribution of the adopted records (the pollen records are represented by red dots) (A) and the corresponding stacked Holocene temperature records for different latitudinal bands (B–F); Routson et al., 2019.
Temperature history is a major component of Holocene paleoclimatic studies because it largely determines our understanding of: 1) the driving mechanisms of Holocene climate change; 2) human-environment interactions during the Holocene; and 3) the historical background of ongoing global anthropogenic warming. Moreover, the two alternative trends—overall long-term warming or cooling during the Holocene—provide a quite different historical context for policy making designed to address ongoing climate change. The most significant discrepancies in the existing Holocene temperature records are in the late Holocene (Figure 4), which was also the interval of the unprecedented intensification of human activities. Therefore, we suggest that it is both necessary and appropriate to evaluate human impacts on late Holocene temperature records.
The impact of human activity on late Holocene terrestrial temperature reconstructions may exist not only in pollen data but also in other indicators that are sensitive to human activity. One example is fossil animals. The animal fossils discovered at mid-Holocene archaeological sites in monsoonal, humid central–north China, with the corresponding animals only being found today in South China or in south of China, such as Elephus maximus, Rhinoceras sondaicus and Alligator sinensis, have also been used as indicators of a cooling trend from the mid-Holocene to the late Holocene (Shi et al., 1994). A recent study found that for the past two millennia the range contraction and extinction of five megafauna (Asiatic elephants, rhinoceroses, tigers, Asiatic black bears, and brown bears) that were historically widespread in China, was dominantly caused by humans and not by climate change (Teng et al., 2020). This highlights the possible human impacts on late Holocene temperature histories inferred from animal fossils.
Given the importance of temperature history of the Holocene, and the Holocene temperature conundrum, we propose the following: 1) more terrestrial reconstructions could be obtained from areas without significant direct impacts from human activities, such as the polar regions and high mountains (Li Y. et al., 2020); 2) in the areas that are profoundly impacted by human activities, more terrestrial reconstructions could be obtained using proxies that are not significantly and directly impacted by human activities, such as possible organic and isotopic proxies (Zhang et al., 2022).
Finally, regarding the term of “late Holocene” that used in this paper, obviously, the significant human impacts on terrestrial surface environment were quite possibly asynchronously occurred in different regions. From a global perspective and considering the recent evidence of different spatial extents from regional (e.g., Jenny et al., 2019; Dong et al., 2020) to global (e.g., Stephens et al., 2019; Mottl et al., 2021), we roughly define the “late Holocene” as the last ∼4 ka (Figures 1K,L; Figures 4J,K).
Recent paleoenvironmental reconstructions for the late Holocene emphasize the significant effects of human activities on the natural vegetation in monsoonal humid China, North America, Europe and elsewhere. Consideration of the evidence of forcing by global ice volume and sea-level, GHGs, and insolation, together with other Holocene temperature records, leads us to question the reliability of the long-term cooling trends during the late Holocene evident in pollen-based or pollen-dominated temperature records from monsoonal humid China, North America, Europe and elsewhere.
We propose that vegetation change during the late Holocene was dominantly influenced by human activities and not climate change. Thus, pollen data may not be a reliable indicator of the temperature history of the late Holocene. Given that the same problem may also exist for other terrestrial proxies, we appeal for a careful evaluation of the possible impacts of human activity on terrestrial temperature records, which may provide new insights into the Holocene temperature conundrum. Finally, we suggest that paleoclimatic reconstructions from areas and using proxies with minimum direct impacts from human activities may provide a better understanding of Holocene temperature history.
Briefly, the contributions from the individual co-authors are: ZR lead the study and the writing of the MS; YT, KG, SW, HG and ZF collect the published data; LZ and YL participate the analyse of the data and the writhing of the MS, YT and YL participate the preparation of several figures.
This work was supported by the National Natural Science Foundation of China (Grant Nos. 42171156, 42001080).
The authors declare that the research was conducted in the absence of any commercial or financial relationships that could be construed as a potential conflict of interest.
All claims expressed in this article are solely those of the authors and do not necessarily represent those of their affiliated organizations, or those of the publisher, the editors, and the reviewers. Any product that may be evaluated in this article, or claim that may be made by its manufacturer, is not guaranteed or endorsed by the publisher.
We thank Jan Bloemendal for improving the English.
Baker, J. L., Lachniet, M. S., Chervyatsova, O., Asmerom, Y., and Polyak, V. J. (2017). Holocene Warming in Western continental Eurasia Driven by Glacial Retreat and Greenhouse Forcing. Nat. Geosci 10, 430–435. doi:10.1038/ngeo2953
Berger, A. (1978). Long-term Variations of Daily Insolation and Quaternary Climatic Changes. J. Atmos. Sci. 35, 2362–2367. doi:10.1175/1520-0469(1978)035<2362:ltvodi>2.0.co;2
Bova, S., Rosenthal, Y., Liu, Z., Godad, S. P., and Yan, M. (2021). Seasonal Origin of the thermal Maxima at the Holocene and the Last Interglacial. Nature 589, 548–553. doi:10.1038/s41586-020-03155-x
Chen, F., Yu, Z., Yang, M., Ito, E., Wang, S., Madsen, D. B., et al. (2008). Holocene Moisture Evolution in Arid central Asia and its Out-of-phase Relationship with Asian Monsoon History. Quat. Sci. Rev. 27, 351–364. doi:10.1016/j.quascirev.2007.10.017
Chen, J. X., Shi, X. F., Liu, Y. G., Qiao, S. Q., Yang, S. X., Yan, S. J., et al. (2020). Holocene Vegetation Dynamics in Response to Climate Change and Hydrological Processes in the Bohai Region. Clim. Past 16, 2509–2531. doi:10.5194/cp-16-2509-2020
Cheng, Z., Weng, C., Steinke, S., and Mohtadi, M. (2018). Anthropogenic Modification of Vegetated Landscapes in Southern China from 6,000 Years Ago. Nat. Geosci 11, 939–943. doi:10.1038/s41561-018-0250-1
Davis, B. A. S., Brewer, S., Stevenson, A. C., and Guiot, J. (2003). The Temperature of Europe during the Holocene Reconstructed from Pollen Data. Quat. Sci. Rev. 22, 1701–1716. doi:10.1016/s0277-3791(03)00173-2
Dong, G., Li, R., Lu, M., Zhang, D., and James, N. (2020). Evolution of Human-Environmental Interactions in China from the Late Paleolithic to the Bronze Age. Prog. Phys. Geogr. Earth Environ. 44, 233–250. doi:10.1177/0309133319876802
Dyke, A. S. (2004). An Outline of North American Deglaciation with Emphasis on central and Northern Canada. Dev. Quat. Sci. 2, 373–424. doi:10.1016/s1571-0866(04)80209-4
Jenny, J.-P., Koirala, S., Gregory-Eaves, I., Francus, P., Niemann, C., Ahrens, B., et al. (2019). Human and Climate Global-Scale Imprint on Sediment Transfer during the Holocene. Proc. Natl. Acad. Sci. USA 116, 22972–22976. doi:10.1073/pnas.1908179116
Kaufman, D., McKay, N., Routson, C., Erb, M., Dätwyler, C., Sommer, P. S., et al. (2020a). Holocene Global Mean Surface Temperature, a Multi-Method Reconstruction Approach. Sci. Data 7, 201. doi:10.1038/s41597-020-0530-7
Kaufman, D., McKay, N., Routson, C., Erb, M., Davis, B., Heiri, O., et al. (2020b). A Global Database of Holocene Paleotemperature Records. Sci. Data 7, 115. doi:10.1038/s41597-020-0445-3
Köhler, P., Nehrbass-Ahles, C., Schmitt, J., Stocker, T., and Fischer, H. (2017). A 156 Kyr Smoothed History of the Atmospheric Greenhouse Gases CO2, CH4, and N2O and Their Radiative Forcing. Earth Syst. Sci. Data 9, 363–387. doi:10.5194/essd-9-363-2017
Lambeck, K., Rouby, H., Purcell, A., Sun, Y., and Sambridge, M. (2014). Sea Level and Global Ice Volumes from the Last Glacial Maximum to the Holocene. Proc. Natl. Acad. Sci. 111, 15296–15303. doi:10.1073/pnas.1411762111
Li, F., Gaillard, M.-J., Cao, X., Herzschuh, U., Sugita, S., Tarasov, P. E., et al. (2020a). Towards Quantification of Holocene Anthropogenic Land-Cover Change in Temperate China: a Review in the Light of Pollen-Based REVEALS Reconstructions of Regional Plant Cover. Earth-Science Rev. 203, 103119. doi:10.1016/j.earscirev.2020.103119
Li, Y., Tian, Y., Guo, H., Wei, S., Cao, J., Huang, C., et al. (2020b). Complex "human−vegetation−climate" Interactions in the Late Holocene and Their Significance for Paleotemperature Reconstructions. Proc. Natl. Acad. Sci. USA 117, 5568–5570. doi:10.1073/pnas.1922325117
Liu, Z., Zhu, J., Rosenthal, Y., Zhang, X., Otto-Bliesner, B. L., Timmermann, A., et al. (2014). The Holocene Temperature Conundrum. Proc. Natl. Acad. Sci. 111, E3501–E3505. doi:10.1073/pnas.1407229111
Marcott, S. A., Shakun, J. D., Clark, P. U., and Mix, A. C. (2013). A Reconstruction of Regional and Global Temperature for the Past 11,300 Years. Science 339, 1198–1201. doi:10.1126/science.1228026
Marsicek, J., Shuman, B. N., Bartlein, P. J., Shafer, S. L., and Brewer, S. (2018). Reconciling Divergent Trends and Millennial Variations in Holocene Temperatures. Nature 554, 92–96. doi:10.1038/nature25464
Mauri, A., Davis, B. A. S., Collins, P. M., and Kaplan, J. O. (2015). The Climate of Europe during the Holocene: a Gridded Pollen-Based Reconstruction and its Multi-Proxy Evaluation. Quat. Sci. Rev. 112, 109–127. doi:10.1016/j.quascirev.2015.01.013
Meyer, H., Opel, T., Laepple, T., Dereviagin, A. Y., Hoffmann, K., and Werner, M. (2015). Long-term winter Warming Trend in the Siberian Arctic during the Mid- to Late Holocene. Nat. Geosci 8, 122–125. doi:10.1038/ngeo2349
Mottl, O., Flantua, S. G. A., Bhatta, K. P., Felde, V. A., Giesecke, T., Goring, S., et al. (2021). Global Acceleration in Rates of Vegetation Change over the Past 18,000 Years. Science 372, 860–864. doi:10.1126/science.abg1685
Osman, M. B., Tierney, J. E., Zhu, J., Tardif, R., Hakim, G. J., King, J., et al. (2021). Globally Resolved Surface Temperatures since the Last Glacial Maximum. Nature 599, 239–244. doi:10.1038/s41586-021-03984-4
Routson, C. C., McKay, N. P., Kaufman, D. S., Erb, M. P., Goosse, H., Shuman, B. N., et al. (2019). Mid-latitude Net Precipitation Decreased with Arctic Warming during the Holocene. Nature 568, 83–87. doi:10.1038/s41586-019-1060-3
Ruddiman, W. F., Fuller, D. Q., Kutzbach, J. E., Tzedakis, P. C., Kaplan, J. O., Ellis, E. C., et al. (2016). Late Holocene Climate: Natural or Anthropogenic? Rev. Geophys. 54, 93–118. doi:10.1002/2015rg000503
Ruddiman, W. F., He, F., Vavrus, S. J., and Kutzbach, J. E. (2020). The Early Anthropogenic Hypothesis: A Review. Quat. Sci. Rev. 240, 106386. doi:10.1016/j.quascirev.2020.106386
Shi, Y. F., Kong, Z. C., Wang, S. M., Tang, L. Y., Wang, F. B., Yao, T. D., et al. (1994). The Climatic Fluctuation and Important Events of Holocene Megathermal in China. Sci. China Ser. B 3, 353–365. doi:10.1360/zb1992-22-12-1300
Stephens, L., Fuller, D., Boivin, N., Rick, T., Gauthier, N., Kay, A., et al. (2019). Archaeological Assessment Reveals Earth's Early Transformation through Land Use. Science 365, 897–902. doi:10.1126/science.aax1192
Sun, Q., Liu, Y., Wünnemann, B., Peng, Y., Jiang, X., Deng, L., et al. (2019). Climate as a Factor for Neolithic Cultural Collapses Approximately 4000 Years BP in China. Earth-Science Rev. 197, 102915. doi:10.1016/j.earscirev.2019.102915
Teng, S. N., Xu, C., Teng, L., and Svenning, J.-C. (2020). Long-term Effects of Cultural Filtering on Megafauna Species Distributions across China. Proc. Natl. Acad. Sci. USA 117, 486–493. doi:10.1073/pnas.1909896116
Keywords: Holocene, temperature, pollen, human impacts, terrestrial record
Citation: Rao Z, Tian Y, Guang K, Wei S, Guo H, Feng Z, Zhao L and Li Y (2022) Pollen Data as a Temperature Indicator in the Late Holocene: A Review of Results on Regional, Continental and Global Scales. Front. Earth Sci. 10:845650. doi: 10.3389/feart.2022.845650
Received: 30 December 2021; Accepted: 28 January 2022;
Published: 21 February 2022.
Edited by:
Yu Li, Lanzhou University, ChinaReviewed by:
Feng Qin, Institute of Geographic Sciences and Natural Resources Research (CAS), ChinaCopyright © 2022 Rao, Tian, Guang, Wei, Guo, Feng, Zhao and Li. This is an open-access article distributed under the terms of the Creative Commons Attribution License (CC BY). The use, distribution or reproduction in other forums is permitted, provided the original author(s) and the copyright owner(s) are credited and that the original publication in this journal is cited, in accordance with accepted academic practice. No use, distribution or reproduction is permitted which does not comply with these terms.
*Correspondence: Zhiguo Rao, cmFvemhnQGh1bm51LmVkdS5jbg==; Yunxia Li, bGl5eEBodW5udS5lZHUuY24=
Disclaimer: All claims expressed in this article are solely those of the authors and do not necessarily represent those of their affiliated organizations, or those of the publisher, the editors and the reviewers. Any product that may be evaluated in this article or claim that may be made by its manufacturer is not guaranteed or endorsed by the publisher.
Research integrity at Frontiers
Learn more about the work of our research integrity team to safeguard the quality of each article we publish.