- 1Department of Civil Chemical Environmental and Materials Engineering, Alma Mater Studiorum University of Bologna, Bologna, Italy
- 2Research Institute for Geo-Hydrological Protection, Italian National Research Council, Padova, Italy
- 3Department of Earth Systems Analysis, Faculty of Geo-Information Science and Earth Observation (ITC), University of Twente, Enschede, Netherlands
In this study, a new tool for quantitative, data-driven susceptibility zoning (SZ) is presented. The SZ plugin has been implemented as a QGIS plugin to maximize its operational use within the geoscientific community. QGIS is in fact a commonly used open-source geographic information system. We have scripted the plugin in Python, and developed it as a collection of functions that allow one to pre-process the input data, calculate the susceptibility, and then estimate the quality of the classification results. The susceptibility zoning can be carried out via a number of classifiers including weight of evidence, frequency ratio, logistic regression, random forest, support vector machine, and decision tree. The plugin allows one to use any kind of mapping units, to fit the model, to test it via a k-fold cross-validation, and to visualize the relative receiving operating characteristic (ROC) curves. Moreover, a new classification method of the susceptibility index (SI) has been implemented in the SZ plugin. A typical workflow of the SZ plugin is described, and its application for landslide susceptibility zoning in Northeast India is reported. The data of the predisposing factors used are open, and the analysis has been carried out using a logistic regression and weight of evidence models. The corresponding area under the curve of the relative ROC curves reflects an optimal model prediction capacity. The user-friendly graphical interface of the plugin has allowed us to perform the analysis efficiently in few steps.
1 Introduction
The measure of how much a specific area is prone to natural hazards is called susceptibility. It does not evaluate when or how often the given hazard may occur (Guzzetti et al., 2006), but it provides the expected locations where such processes may take place in the future. Mathematically, the susceptibility is the estimation of the likelihood of spatial occurrence of natural hazard evaluated on the basis of terrain and environmental conditions (Brabb, 1985). In most cases, this likelihood can be obtained via rigorous probabilistic models, although other tools are also able to convey similar information without relying on complex multivariate statistics (e.g., Ciurleo et al., 2017; Lombardo et al., 2020a). All these methods fall under the definition of data-driven models, and they empirically classify a landscape, labeling it as prone or not prone to slope failures. The way a classifier specifically works is to weigh the contribution of each predisposing factor to the occurrence of natural hazards, taking into account the presence/absence proportion of past records, given other predisposing factors in the model. The basic idea behind data-driven models is that “the past is the key to the future” (Carrara et al., 1995). Thus, an area that has been affected by natural hazards in the past under certain circumstances may undergo similar environmental stresses and suffer from analogous hazards in the future. Therefore, the statistical analysis of susceptibility is based on a spatial dataset of past events, which acts as the dependent variable of any given model, together with a set of geo-environmental factors acting as explanatory variables.
This study presents the susceptibility zoning (SZ) plugin, a new tool for susceptibility analysis integrated within one of the most common open-source GIS platforms, QGIS (QGIS Development Team, 2022). Specifically, the SZ plugin is a collection of functions implemented as a QGIS plugin, supporting a number of preprocessing requirements, as well as the susceptibility mapping and validation itself. Moreover, the plugin is equipped with a series of plotting routines aimed at exploring and interpreting each model components as well as estimating the predictive ability of the model when dealing with unknown data.
A number of tools for susceptibility zoning are already available in the literature, including LSAT (ArcGIS toolbox) (Torizin, 2012; Polat, 2021), BSA tool (ArcMap tool) (Jebur et al., 2015), LAND-SE (R script) (Rossi and Reichenbach, 2016), frmod (Python script) (Dávid, 2021), and GeoFIS (standalone) (Osna et al., 2014). The SZ plugin, to our knowledge, is the first tool that enables susceptibility routines within QGIS.
This study describes in detail the SZ plugin graphical user interface together with all its functions and provides a sample application to landslide susceptibility in Northeast India. A previous version of this plugin (v0.1) was already published in 2020 by Titti and Sarretta (2020), but here we have extended the available options encompassing other modeling approaches within the same plugin, and we have equipped the SZ plugin with a suite of plotting and performance evaluation tools. The current version (v1.0) is available in the following GitHub repository CNR-IRPI-Padova/SZ.
2 Plugin Description
The SZ plugin has been developed specifically for landslide susceptibility zoning; however, it can be used to map any kind of susceptibility. The code has been written in Python and developed as a QGIS plugin. QGIS is a software for geographic information system (GIS) that is completely open-source and supported by a large community of users and developers. A positive consequence of this open approach is that anyone can develop their own plugin to address specific needs. Hundreds of plugins are freely available from official and non-official repositories, but none has focused on susceptibility modeling.
In order to better integrate the plugin with the graphical user interface (GUI) of QGIS and simplify its usability, the SZ plugin can be accessed from the QGIS processing toolbox, the main element of the processing GUI. In detail, the SZ plugin is a collector of QGIS processing scripts. Some functions can pre-process data according to the asset required by the core model functions, which can estimate and validate the susceptibility using a suite of possible models. These include the following: weight of evidence (WoE, Hussin et al., 2016), frequency ratio (FR, Arabameri et al., 2019), logistic regression (LR, Lombardo et al., 2020b), random forest (RF, Catani et al., 2013), support vector machine (SVM, Lin et al., 2017), and decision trees (DT, Yeon et al., 2010). The evaluation of the results and the classification of the final map proposed are based on the receiving operating characteristic (ROC) curves (Section 3.2).
Working mainly with vector layers, the SZ plugin allows one to use any shapes or form of the mapping unit. In landslide susceptibility, the most common ones consist in grid cells (Reichenbach et al., 2018), terrain units (Van Westen et al., 1997), unique condition units (UCU, Ermini et al., 2005), slope units (Alvioli et al., 2016), geo-hydrological units (Zêzere et al., 2017), topographic units (Eeckhaut et al., 2009), and administrative units (Lombardo et al., 2019).
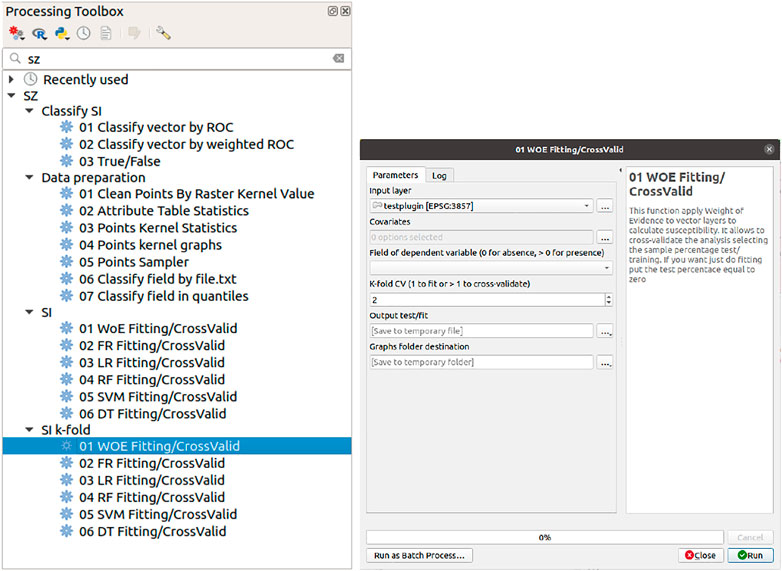
Figure 1 shows the GUI of the plugin inside QGIS, listing the implemented functions, which are separated into four groups: Data preparation, SI, SI k-fold, and Classify SI.
“Data preparation” includes pre-processing functions for vector data. “SI” and “SI k-fold” are the core groups, which allow users to choose among a number of possible statistical models. “SI” and “SI k-fold” allow one to fit or cross-validate (CV) the selected model. If a cross-validation is selected, the “SI” function uses a binomial sampler splitting the dataset randomly into train and test samples, while, the “SI k-fold” function uses the k-fold cross-validation (Section 3.1) method where the user can choose the number of subsamples. “Classify SI,” instead, provides performance metrics to evaluate the goodness-of-fit or predictive skills in case of cross-validation. The former case returns a single performance value, whereas the latter provides summary statistics for the number of cross-validations opted by the user.
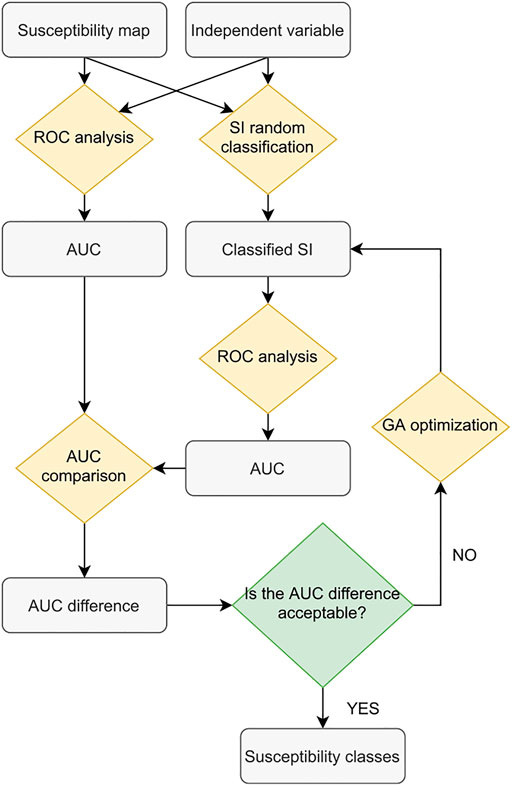
It must be stresses that to maximize the model performance, its assessment offers a new ROC-based classification method which selects the cutoffs required to build the ROC curves to maximizes the relative area under the curve (AUC). Details are reported in Section 3.2.
2.1 Functions’ Description
The sub-section of the SZ plugin called “Data preparation” is useful to pre-process and set the data to be used by the “SI” and “SI k-fold” functions. These functions are as follows:
• Clean points by raster kernel value: it is a filter function that removes all the points of a layer that do not satisfy the minimum value selected in a fixed neighborhood. The values of the neighborhood are collected from an overlapping raster layer.
• Attribute table statistics: this function detects, field by field, the unique values and lists the ID of the feature which reports the same value. Moreover, it produces histograms of the unique values frequency using the Plotly library.
• Points kernel statistics: it calculates the effective, maximum, minimum, standard deviation, sum, average, and maximum range value of the point neighborhood.
• Points kernel graphs: the results of the previous function are plotted by this function as frequency graphs.
• Points sampler: this function randomly samples the vector points according to the train/test scheme selected by the user.
• Classify field by file.txt: to apply the WoE or FR method, the covariates should be cut in a number of classes. This function classifies the vector fields according to the bin limiting values that the operator may choose. These need to be reported in a text file.
• Classify field in quantiles: if the operator does not wish to provide the bin limiting values, the vector fields can be classified according to any quantile representation (i.e., deciles, quartiles).
“SI” and “SI k-fold” functions applies WoE, LR, DT, RF, or FR to calculate susceptibility. They require a polygonal layer which includes one field per each covariate and one field with the dependent variable (number of landslides, tornado, and floods) per mapping unit. The “SI” function allows to cross-validate the results selecting the sample percentage of training and test or allowing one to fit the model to the whole dataset, whereas the “SI k-fold” function allows to cross-validate the results with a k-fold method (Section 3.1) or also fit the model to the whole dataset.
The functions produce vectors of training/testing or fitting results and report in a text file the relative weights or regression coefficients (depending on the model the user has chosen). Also, it produces a graph of the ROC curves with the associated AUCs. The close the AUC is to 1, the higher the capacity of the given model is to suitably classify the study area into stable or unstable conditions. The ROC analysis as well as all the probabilistic models available within the SZ plugin (LR, DT, RF, and SVM) is based on the library Scikit-learn (Pedregosa et al., 2011). As for bivariate statistical models (WoE and FR), they have been implemented manually and added to the collection because they are largely used in the literature from many years (van Westen et al., 2000).
The last group of functions is “Classify SI” which includes “01 Classify vector by ROC,” “02 Classify vector by weighted ROC,” and “03 True/False”. Using genetic algorithms (GA) the 01 and 02 “Classify SI” functions classify the susceptibility index (SI) into the indicated number of classes through the reconstruction of the segmented ROC curve in order to maximize the AUC (for more details Section 3.2).
The only difference between the “01 Classify vector by ROC” and the “02 Classify vector by weighted ROC” is the use of weighted ROC curve. The weights can be established among the input vector fields.
“03 True/False” produces a map of mapping units labeled as follows: True Positive, True Negative, False Positive, and False Negative according to a selected cutoff of the susceptibility index.
2.2 Software Availability
The SZ plugin has been implemented in Python 3. It requires many dependencies such as: Numpy, Scipy, GDAL, Scikit-learn (Pedregosa et al., 2011), Pandas (The pandas development team, 2019), Matplotlib (Hunter, 2007), and Plotly (Inc., 2015). The version of SZ plugin used in this study is the v1.0 (Titti et al., 2021b). The latest version of the SZ plugin is always available on the GitHub repository CNR-IRPI-Padova/SZ.
The plugin has been tested with QGIS 3.16 on Ubuntu 20.04 and Windows 11. To support and increase the usability of the plugin a video tutorial has been published at: https://www.youtube.com/watch?v=XpsiCkVF11s (last access 2022/02/03).
3 Background
To understand the functionalities of the plugin, the explanation on how the plugin handles the cross-validation, performance assessment, and susceptibility index is reported hereafter. Moreover, the Section 4 shows the application of the tool to landslide susceptibility zoning using the WoE and LR.
3.1 Cross-Validation
Validation routines involve the test of the performance of a data-driven model with respect to unknown data. Ideally, the unknown data should belong to a temporal replicate of the modeled process. However, geomorphological studies often lack of multitemporal inventories. Thus, testing the model performance most of the times requires the implementation of cross-validation routines. These are commonly performed by splitting the entire input dataset into two subsets, one used for training the given data-driven model and the other one to test. This structure revolves around considering a subsample of the whole dataset in the same way as one would consider future landslide occurrences, thus offering the chance to compare locations labeled to be stable/unstable with respect to a set of actual stable/unstable instances.
The literature reports few ways to extract the testing subset. The most common in the geomorphological literature is to extract a random sample from the full dataset. Most of the times this is done just once (Arabameri et al., 2020); in this case, most of the variability of a study area is disregarded. In other cases, the random samples are extracted, without any constraint, a large number of times with the purpose of depicting the potential variability of a test site (Amato et al., 2019). In fewer cases, the variability of a given study area is accounted for by extracting samples that are constrained to be selected just once across replicates, leading to two-fold (Yeon et al., 2010), five-fold (Dang et al., 2019), or ten-fold (Lombardo and Tanyas, 2021) cross-validations. All the examples mentioned before adopt a cross-validation scheme where the extraction, constrained or unconstrained, is randomized in space. However, this operation is statistically appropriate only if one assumes that the presence/absence label assigned to a given mapping unit of choice is independent from the labels of the surrounding mapping units. In other words, these procedures assume that there is no spatial structure in the data other than the one captured by the selected explanatory variables. This is an acceptable assumption for medium (e.g., slope units) to large (e.g., catchments) mapping units, but it is not valid for fine mapping units such as grid-cells. In such cases, the most appropriate way to implement cross-validation routines is to constrain the testing subsets in space, each one being representative of a specific sector of the study area. In turn, this operation ensures that any residual spatial structure in the data, not captured by the explanatory variables, would not affect the validation estimates. In other words, the testing is free or as free as possible from any spatial effect that may bias the performance toward results that are forcefully better than what they should be. This operation is commonly referred to as spatial-cross validation (e.g., Petschko et al., 2014).
Out of the cross-validation schemes described above, the current version of the SZ plugin offers two options. The first is a cross-validation where the train/test split is performed just once as per the majority of cases in the geoscientific literature (“SI” functions). This is achieved by using the train_test_split function in Scikit-learn. The second is a k-fold cross-validation where from the whole dataset, the test data is randomly extracted according to number (k) of mutually exclusive subsets (“SI k-fold” functions). The training data is represented by the complementary subsets. In other words, if k is equal to 10, then ten non-overlapping test sub-samples (each one made of 10% of the total mapping units) are created to test the prediction skill of the model and the ten complementary 90% subsets are used to calibrate the model instead. Thus, the union of the ten 10% subsets returns the whole study area, in such case the resulting susceptibility map would have been generated by fully predicted instances. Any test sample is balanced in terms of presence/absence. The presence/absence proportion of the test sample is equal to the proportion of presence/absence of the complete dataset. The spatial-cross validation is not implemented in the current version of the SZ plugin, but it is part of the development plan for the subsequent versions.
3.2 Performance Assessment
The model performance is evaluated via the receiving operating characteristic (ROC) curves and their relative AUC (Chung and Fabbri, 2003; Fawcett, 2006).
Each mapping unit of a susceptibility map can be labeled as True Positive (TP), True Negative (TN), False Positive (FP), and False Negative (FN) unit (Rahmati et al., 2019) according to the presence/absence of the dependent variable (landslides in our application) and to positive/negative (stable/unstable) label assigned. After sorting the susceptibility index by descending order, the spectrum of susceptibility values can be split into two categories, prone or not, to the occurrence of the hazard. The susceptibility cutoffs, which assign the binary label (stable/unstable), are assigned continuously until the lowest value of susceptibility. The ROC curve then plots the relation between TPrate and FPrate as follows:
3.3 Susceptibility Index Classifier
In the literature, several methods have been used to segment the susceptibility index into discrete classes. The continuous spectrum of susceptibility values has been sliced into quantiles; other cases report their classification on the number of landslides per class or on the ratio between the landslide area and the surface area of each class in comparison to the entire study area (Lombardo et al., 2020a). The SZ plugin proposes a new genetic algorithm-based classifier.
The genetic algorithm (GA) is an iterative meta-heuristic algorithm based on the numerical reproduction of Charles Darwin’s natural selection theory (Chatterjee et al., 1996). The meta-heuristic algorithms are designed to explore the search space from several points of view and to get the solution as near as possible to the optimal (Said et al., 2014).
A GA near-optimal solution is reached through the iterative delineation of the best object selected from a group of admissible solutions which are evolved by operators such as crossover, mutation, inversion, and others (Chatterjee et al., 1996). The quality evaluation of the solutions is indicated by the fitness function that assigns a score or fitness determining the minimum requirement for potential solutions (Mitchell, 1995). During the iterations, the best subsequent population is selected and the worst excluded to avoid future reproduction (Razali, 2015). The result may be an exception of the population (as unexpected genetic mutation) or the effect of continuous and slow improvements.
The idea behind the new GA tool featured in the SZ plugin is to classify the SI into a number of classes, by optimizing their respective boundaries. These represent cutoffs necessary to build the ROC curve and to maximize the relative AUC. Maximization of the AUC of the segmented ROC is the fitness function of the iterative meta-heuristic algorithm. Figure 2 shows the classifier workflow. The ROC curve maybe weighted or none.
4 Application to Landslide Susceptibility
The SZ plugin was born from the necessity of specific functions not available in QGIS with the goal of producing a landslide susceptibility map of South Asia using the WoE method (Titti et al., 2021a) in the context of the Belt and Road Initiative (Lei et al., 2018). After that, several other applications have supported the SZ plugin development. Among these, in Titti et al. (2021c), the classifier (“Si classify” functions) of the plugin was built to reclassify the landslide susceptibility in Tajikistan. Subsequent experiments have then stimulated the development of additional functions, leading to the current version of the SZ plugin.
Here, we present the current set of functionalities offered through the SZ plugin in the context of landslide susceptibility, although we recall that these can be used even outside the geomorphological context. The selected study area corresponds to the north-eastern sector of India, including Assam, Manipur, Meghalaya, Mizoram, Nagaland, and Tripura (Figure 3). This area has been selected because it appears to be one of the areas most susceptible to landslides in South Asia, according to the analysis conducted by Titti et al. (2021a). In their study, the authors’ goal was to highlight regions mostly prone to landslides across countries involved into the Belt and Road Initiative. The application presented here and the analysis conducted in Tajikistan (Titti et al., 2021c) follow an analogous criterion.
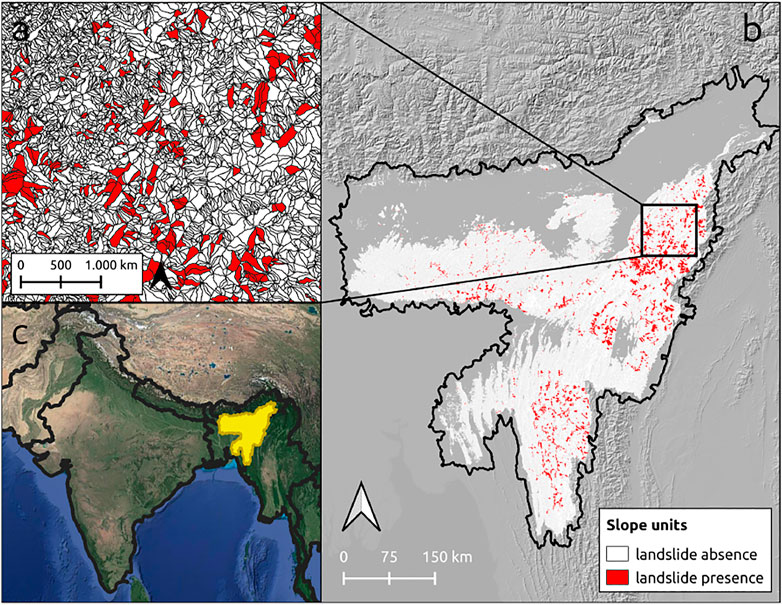
FIGURE 3. Study area and relative slope units of the SZ plugin application to landslide susceptibility (Map data panel c ©Google). Panel b shows in white and red the slope units investigated after the exclusion of the alluvial plains. The red zones represent the unstable slope units, whereas the white zones represent the stable ones.
All the data used in the application presented here are open-data. The landslide inventory used for the analysis was provided by the Geological Survey of India and is available at the Bhukosh website (https://bhukosh.gsi.gov.in, accessed 15 November 2021). It is an open database developed to evaluate the spatial distribution of natural hazards in India. In the selected study area, it includes 5,759 Landslide Identification Points (LIP). The catalog includes landslides triggered by rainfall, anthropogenic activity, road/slope cut, quarrying, toe erosion, and ground motion.
Slope units have been used as the reference mapping unit. A slope unit is a terrain unit derivable from a DEM, under the constraint of internal aspect homogeneity in areas defined between ridges and streamlines (Alvioli et al., 2020). The shapes have been calculated using r.slopeunits, a tool developed in GRASS GIS by Alvioli et al. (2016). In this case, we parameterized r.slopeunits with a flow accumulation threshold of 5,000,000 m2, a minimum unit area of 500,000 m2, and a circular variance of 0.3. The alluvial plains have been excluded from the analysis because considered not susceptible a priori. As a result, 124,553 slope units were generated with a maximum surface extension of 27 km2, a mean of 1 km2, and a standard deviation of 1.1 km2.
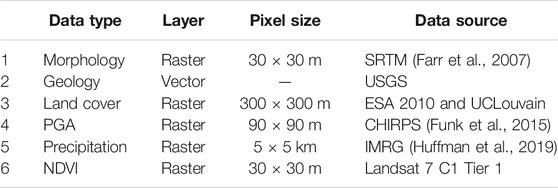
All the data used as a predisposing factor are also open data. They consist of lithology, land cover, slope, plan curvature (tangent to the contour line), profile curvature (tangent to the slope line), relative relief (maximum elevation range in a circular neighborhood of 1 km of radius), peak ground acceleration (PGA), annual rainfall, Normalized Difference Vegetation Index (NDVI), and area of each mapping unit (Table 1 for the respective data sources).
The landslide susceptibility zoning of the study area is carried out using Weight of Evidence (WoE) and Logistic Regression (LR) methods. The Weights of Evidence technique is a bivariate statistical approach (Bonham-Carter et al., 1988; Bonham-Carter, 1990). It quantifies how prone an event occurrence is according to the proportion of presence/absence for each predisposing factor class. The WoE assigns two weights per class: W+ and W−. The weights represent, respectively, the positive and negative influence of the predisposing factors on a potential natural hazard. They are calculated by the following:
where M1 is the number of mapping units where both the factor class and the event are present; M2 is the number of mapping units where the factor class is absent, while the event is present; M3 is the number of mapping units where the factor class is present, while the event is absent; M4 is the number of mapping units where both the factor class and the event are absent. The weight contrast (Wf) is the final weight assigned to each class factor. It evaluates the relation between the spatial distribution of the causes and the spatial distribution of the events (Dahal et al., 2008).
The local sum of the factor weight contrasts produces the Susceptibility Index (SI), as follows:
The second model tested is the logistic regression. It is an extension of the classical linear regression analysis. The latter commonly requires a continuous target variable (y), whose estimation is achieved as a linear combination of n input covariates (x), as follows:
where β0 is the intercept and βi are the covariate coefficients.
However, the above scheme is not suitable to model a discrete target variable. In such cases, and specifically for a target variable that can take only two discrete values, a logistic regression represents the most common solution. Its structure takes a vector (y) reporting a series of zero and one. The zero conventionally conveys the absence of a given process in space, time or both, whereas one conveys the opposite case where the process is present. The model still linearly regresses, this time the odd ratio (Szumilas, 2010), with respect to n input covariates x. The use of the logit link function, which then transforms this quantity into a probability (Menard, 2002), commonly referred to the actual occurrence of the process of interest, as follows:
As a result, one can interpret an increase in the estimated regression coefficients as a linear increase or decrease of the probability P(y = 1), determined by the sign of βi.
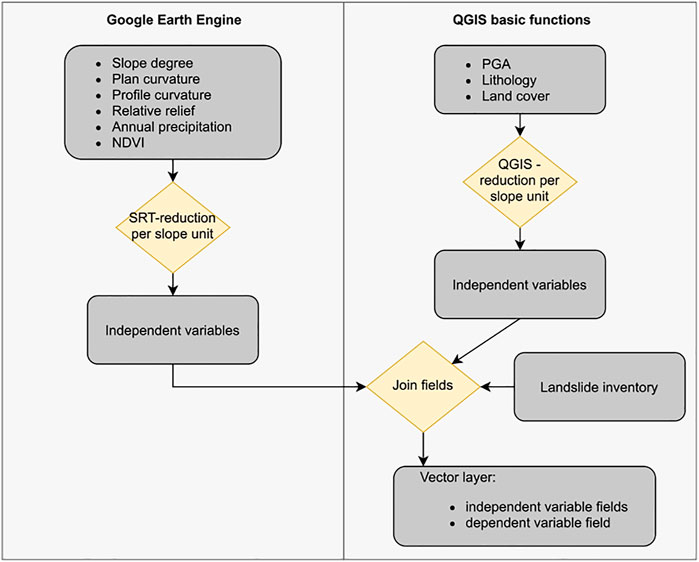
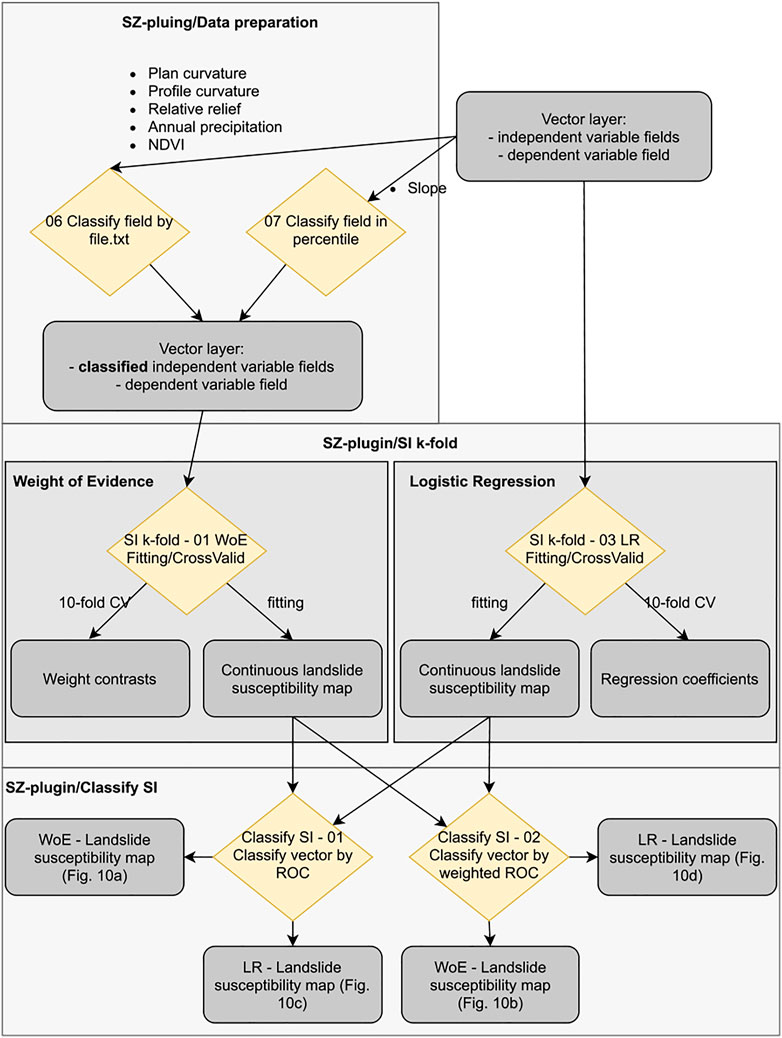
The application and validation of the WoE and LR results are described in detail by the schema in Figure 5. The data preprocess, instead, is described in Figure 4. Flowcharts outline step by step how the SZ plugin functions have been used to carry out the landslide susceptibility map of the Northeast India.
As described in Figure 4, the average per mapping unit of slope, plan curvature, profile curvature, relative relief, annual precipitation, and NDVI have been calculated using a script implemented by us in Google Earth Engine (GEE) (Gorelick et al., 2017) called the spatial reduction tool (SRT). Using the TAGEE package for terrain analysis developed by Safanelli et al. (2020), the SRT allows to calculate terrain variables that are DEM derived such as slope, elevation, aspect, northness, eastness, mean curvature, Gaussian curvature, minimal curvature, maximal curvature, shape index, horizontal curvature, and vertical curvature. Moreover, the SRT allows one to calculate the relative relief and collect data from various databases such as precipitation, temperature, and NDVI. Finally, the SRT spatially reduces the pixel based variables into their mean and standard deviation per selected mapping unit. Notably, any shape can be used as a reference mapping unit (Titti and Lombardo, 2022).
As regards other predictors, the majority of the continuous variable (PGA) and the majority of the categorical variables (lithology and land cover), per mapping units, have been calculated using QGIS basic functions and aggregated in one vector layer.
The next steps are described in Figure 5. To verify the quality of the landslide inventory and to avoid mistakes related to the landslides survey, the landslide catalog has been filtered using the function “01 Clean points by raster kernel value” assuming a minimum slope degree of 8°in a neighborhood of 500 m of radius. One landslide only has been deleted. Then the resulting inventory attributes has been investigated using the following functions: “02 Attribute table statistics,” that is, to know the landslide triggers; then “03 Points kernel statistics” and “04 Points kernel graphs” to plot the frequency distribution of the effective, maximum, minimum, standard deviation, sum, average, and maximum range value for a specific thematic map of the LIP neighborhood. To provide an example of the functions “03 Points kernel statistics” and “04 Points kernel graphs,” Figure 6A shows the cumulative effective PGA value across LIPs, whereas Figure 6B depicts the cumulative average PGA value in a LIP around of 5 km × 5 km.
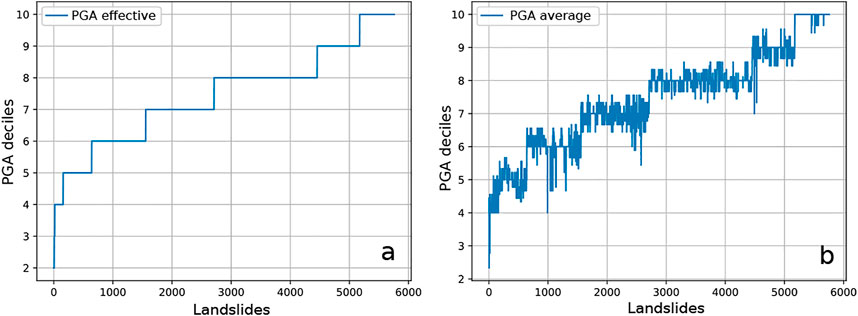
FIGURE 6. Results of the functions “03 Points kernel statistics” and “04 Points kernel graphs.” (A) Cumulative effective LIP PGA value; (B) cumulative average PGA value in a LIP around of 5 km × 5 km.
The landslide susceptibility zoning of the study area is carried out using the methods WoE and LR. To apply the WoE, the variables need to be classified. This step is done by using the functions “06 Classify field by file.txt” and “07 Classify field in percentile”. The slope has been classified in eight classes: 0°, 1 + 3°, 4 + 6°, 7 + 10°, 11 + 15°, 16 + 20°, 21 + 30°, and
After that, the susceptibility can be modeled with WoE. At the beginning the reference map has been built fitting the entire dataset with an AUC equal to 0.79, then the model has been 10-fold cross-validated. The relative ROC curves are visible in Figure 7A with an AUC mean equal to 0.8 and variability measured with a standard deviation equal to 0.07. Both the runs were tested by using “SI k-fold: 01 WoE Fitting/CrossValid,” selecting different input parameters. The weight contrasts of the slope, relative relief, area and annual precipitation resulting from the cross-validation are reported in Figure 8.
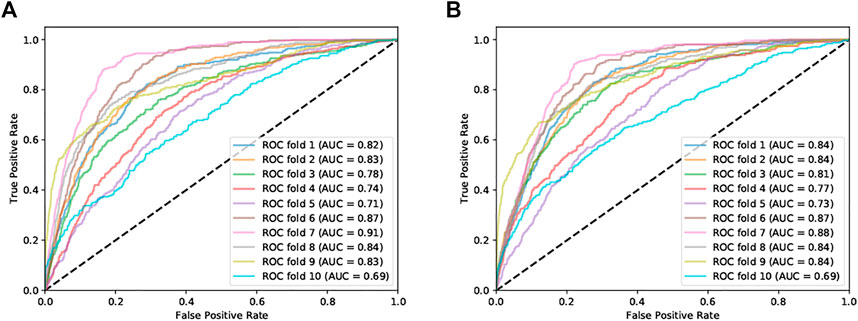
FIGURE 7. ROC curves of the 10-fold cross-validation. (A) ROC of the WoE cross-validation and (B) ROC of the LR cross-validation.
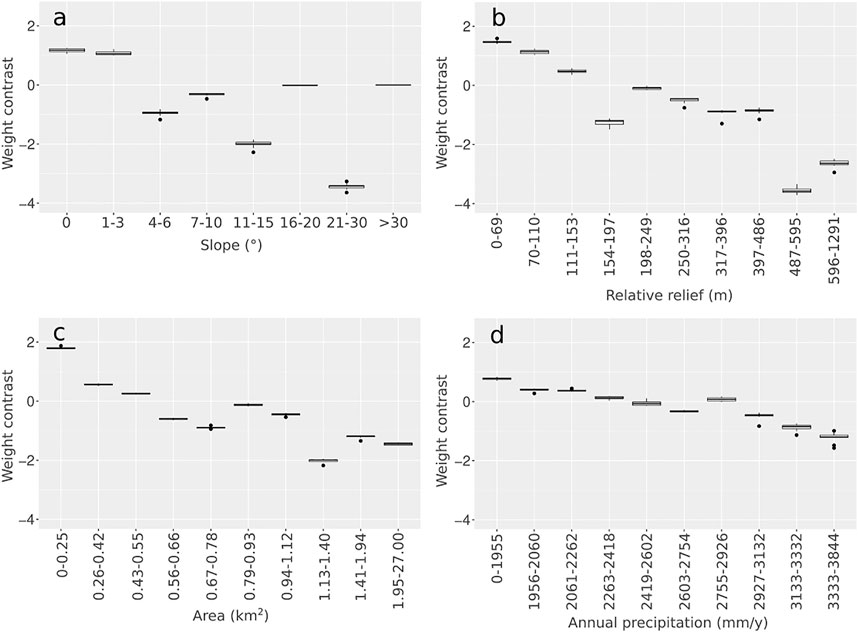
FIGURE 8. Boxplots from the WoE 10-fold cross-validation weight contrast of (A) slope, (B) relative relief, (C) area, and (D) annual precipitation.
To apply the LR method, the categorical covariates have been processed to generate one variable per category, measuring the percentage of surface covered by each category with respect to the extent of each slope units. Then to avoid multi-collinearity issues (the sum of all percentage classes always returns 100%, thus being a linear combination by definition), the most representative class across all slope units has been removed. This operation should sufficiently perturb the dependence structure among the remaining classes, ensuring that a linear combination of their respective values would not yield the same result.
Finally, the susceptibility can be modeled, first by fitting the complete dataset (AUC = 0.81) and then through a 10-fold cross-validation (AUC mean equal to 0.81 and standard deviation equal to 0.06). Both analyses have been carried out via the “SI k-fold: 03 LR Fitting/CrossValid”. The ROC curves of the cross-validation are shown in Figure 7B, whereas the regression coefficients are reported in Figure 9.
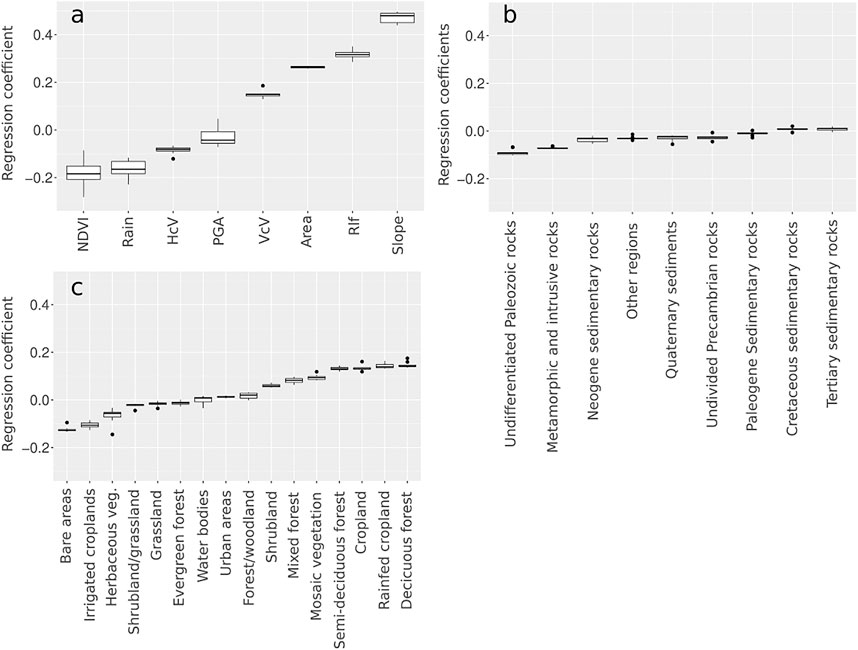
FIGURE 9. Boxplots from the LR 10-fold cross-validation regression coefficients of (A) continuous covariates, (B) lithology, and (C) land cover.
To make the maps suitable for stakeholders and end users involved in land planning, the final maps have been classified into four classes by using the “01 Classify vector by ROC” (Figures 11A,C) and “02 Classify vector by weighted ROC” functions (Figures 11B,D). The latter classification has been weighted according to the slope units’ area.
Figure 10 shows the result of the function “Classify SI/03 True/False” which maps the distribution of the true-positive, true-negative, false-positive, and false-negative mapping units respect to a cutoff value equal to the median of the LR susceptibility index.
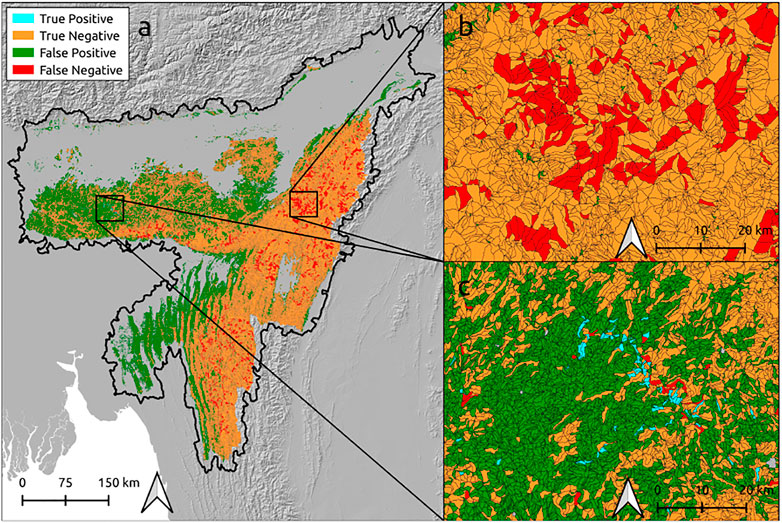
FIGURE 10. True-positive, true-negative, false-positive, and false-negative mapping units with respect to a cutoff value equal to the median of the LR susceptibility index.
In Figure 11, it is evident that the susceptibility patterns produced by WoE and LR are quite similar. Differences become more visible when using the weighted and non-weighted classifiers. In both models (WoE and LR), the “very high” class covers a larger area in the non-weighted-classified map than in the weighted ones. The “very high” class in the WoE non weighted-classified map covers the 31% of the total surface mapped (130,736 km2) and the 14% in the weighted ones. The LR classified maps have given a similar response to the classification: 31 and 12% of the total surface mapped for the non-weighted-classified map and weighted-classified map, respectively.
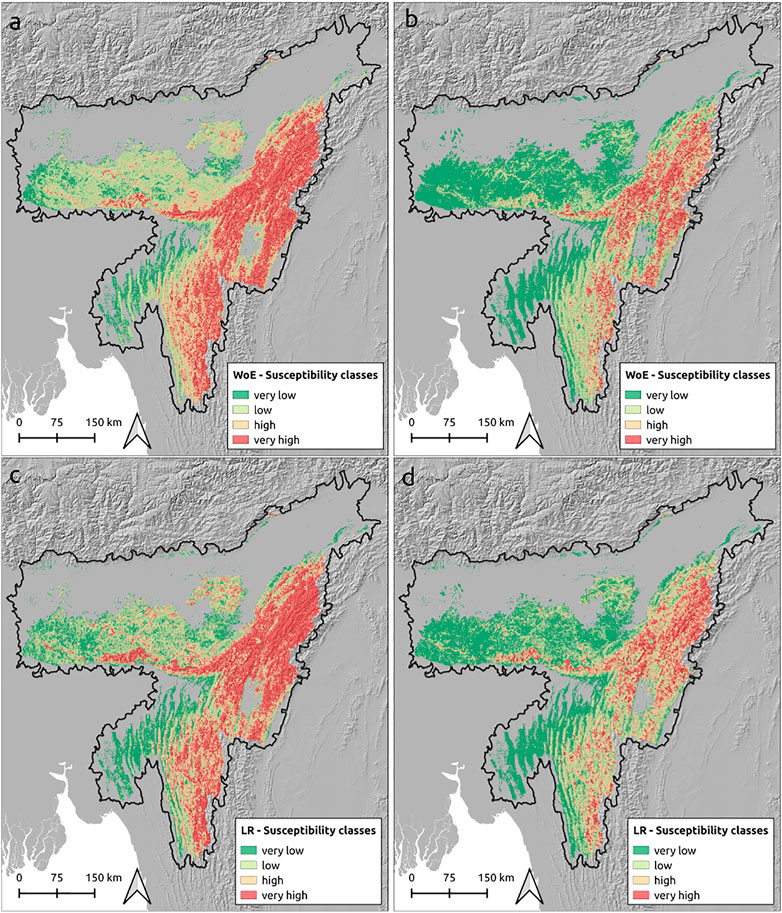
FIGURE 11. Landslide susceptibility maps classified using the WoE and the LR model. (A) Classifier has maximized the AUC of the ROC curve derived from the WoE map; (B) classifier has maximized the AUC of the area-weighted ROC curve derived from the WoE map; (C) classifier has maximized the AUC of the ROC curve derived from the LR map; (D) classifier has maximized the AUC of the area-weighted ROC curve derived from the LR map.
We reported additional references about the predisposing factors and landslide inventory as follows: lithology (https://catalog.data.gov accessed 2021-08-23), land cover (http://due.esrin.esa.int, accessed 2021-04-15), PGA (https://sedac.ciesin.columbia.edu, accessed 2021-04-15), annual precipitation from Climate Hazards Group InfraRed Precipitation with Station data (CHIRPS), and NDVI from Landsat Seven Collection 1 Tier 1 composites for 32-day period provided by U.S. Geological Survey, landslide inventory (https://bhukosh.gsi.gov.in, accessed 2021-11-15).
The effective reduced data and the outputs of the application described above are downloadable from the GitHub repository CNR-IRPI-Padova/SZ.
5 Conclusion
A new plugin for landslide susceptibility zoning is introduced here. The SZ plugin is a collection of processing scripts in Python which runs as part of the QGIS platform. This framework has been chosen to maximize the accessibility to our plugin. QGIS is the most widely used open-source GIS environment.
The implemented functions have been organized into four groups: “Data preparation,” “SI” (susceptibility index), “SI k-fold,” and “Classify SI,” which allow one to carry out a complete susceptibility analysis from the data preprocessing and the prediction analysis to the reclassification of the susceptibility index. The susceptibility can be generated using six different classifiers: weight of evidence, frequency ratio, support vector machine, decision tree, random forest, and logistic regression. The statistical models may be applied to fit the input dataset or cross-validate the final map. In particular, the latter can be done by a simple random split in test/train samples or by a k-fold method. Both are completed by a receiving operating characteristic (ROC) analysis for performance assessment. Finally, a GA-based (genetic algorithms) classifier has been implemented to classify the susceptibility index.
Many libraries in R and other libraries such as Scikit-learn in Python are probably the best solutions to perform susceptibility with statistical models, but they require a good knowledge in coding. Overall, the tool proposed can simplify the access to statistical assessments of susceptibility for users who are not familiar in coding or for those who wish to achieve results rapidly.
In this study, the version 1.0 of the SZ plugin has been presented to the geoscientific community. Several improvements and new functionalities are under development which will be uploaded with the further versions of the plugin.
Data Availability Statement
The datasets presented in this study can be found in online repositories. The names of the repository/repositories and accession number(s) can be found in the article/Supplementary Material.
Author Contributions
Software conceptualization: GT; software development: GT; software fine-tuning: GT, AS, SC, and LL; application and data curation: GT and LL; figures: GT; writing—original manuscript draft: GT; and writing—review and editing: GT, LL, AS, SC, AP, and LB. All authors have read and agreed to the published version of the manuscript.
Conflict of Interest
The authors declare that the research was conducted in the absence of any commercial or financial relationships that could be construed as a potential conflict of interest.
The handling editor declared a past co-authorship with one of the authors LB.
Publisher’s Note
All claims expressed in this article are solely those of the authors and do not necessarily represent those of their affiliated organizations, or those of the publisher, the editors, and the reviewers. Any product that may be evaluated in this article, or claim that may be made by its manufacturer, is not guaranteed or endorsed by the publisher.
References
Alvioli, M., Guzzetti, F., and Marchesini, I. (2020). Parameter-free Delineation of Slope Units and Terrain Subdivision of italy. GEOMORPHOLOGY 358, 107124. doi:10.1016/j.geomorph.2020.107124
Alvioli, M., Marchesini, I., Reichenbach, P., Rossi, M., Ardizzone, F., Fiorucci, F., et al. (2016). Automatic Delineation of Geomorphological Slope Units with R. Slopeunits V1. 0 and Their Optimization for Landslide Susceptibility Modeling. Geoscientific Model. Develop. 9, 3975+3991. doi:10.5194/gmd-9-3975-2016
Amato, G., Eisank, C., Castro-Camilo, D., and Lombardo, L. (2019). Accounting for Covariate Distributions in Slope-Unit-Based Landslide Susceptibility Models. A Case Study in the alpine Environment. Eng. Geology. 260, 105237. doi:10.1016/j.enggeo.2019.105237
Arabameri, A., Chen, W., Loche, M., Zhao, X., Li, Y., Lombardo, L., et al. (2020). Comparison of Machine Learning Models for Gully Erosion Susceptibility Mapping. Geosci. Front. 11, 1609+1620. doi:10.1016/j.gsf.2019.11.009
Arabameri, A., Pradhan, B., and Lombardo, L. (2019). Comparative Assessment Using Boosted Regression Trees, Binary Logistic Regression, Frequency Ratio and Numerical Risk Factor for Gully Erosion Susceptibility Modelling. Catena 183, 104223. doi:10.1016/j.catena.2019.104223
Bonham-Carter, G. F., Agterberg, F. P., and Wright, D. F. (1988). Integration of Geological Datasets for Gold Exploration in nova scotia. Photogrammetric Eng. Remote Sensing 54, 1585+1592.
Bonham-Carter, G. F., Agterberg, F. P., and Wright, D. F. (1990). Weights of Evidence Modeling: a New Approach to Mapping mineral Potential. Stat. Appl. earth Sci., 171+183.
Brabb, E. E. (1985). “Innovative Approaches to Landslide hazard and Risk Mapping,” in International Landslide Symposium Proceedings, Canada, August 23-31, 1985 (Japan Landslide Society), 17+22.1
Carrara, A., Cardinali, M., Guzzetti, F., and Reichenbach, P. (1995). “GIS Technology in Mapping Landslide hazard,” in Geographical Information Systems in Assessing Natural Hazards. Editors A. Carrara, and F. Guzzetti (Dordrecht, Netherlands: Springer), 135–175. doi:10.1007/978-94-015-8404-3_8
Catani, F., Lagomarsino, D., Segoni, S., and Tofani, V. (2013). Landslide Susceptibility Estimation by Random Forests Technique: Sensitivity and Scaling Issues. Nat. Hazards Earth Syst. Sci. 13, 2815+2831. doi:10.5194/nhess-13-2815-2013
Chatterjee, S., Carrera, C., and Lynch, L. A. (1996). Genetic Algorithms and Traveling Salesman Problems. Eur. J. Oper. Res. 93, 490+510. doi:10.1016/0377-2217(95)00077-1
Chung, C.-J. F., and Fabbri, A. G. (2003). Validation of Spatial Prediction Models for Landslide Hazard Mapping. Nat. Hazards 30, 451–472. doi:10.1023/B:NHAZ.0000007172.62651.2b
Ciurleo, M., Cascini, L., and Calvello, M. (2017). A Comparison of Statistical and Deterministic Methods for Shallow Landslide Susceptibility Zoning in Clayey Soils. Eng. Geology. 223, 71+81. doi:10.1016/j.enggeo.2017.04.023
Dávid, G. (2021). Frmod, Frequency Ratio Modeller. Available at: https://github.com/gerzsd/frmod, Accessed: : 2021-10-15
Dahal, R. K., Hasegawa, S., and Nonomura, A. (2008). Gis-based Weights-Of-Evidence Modelling of Rainfall-Induced Landslides in Small Catchments for Landslide Susceptibility Mapping. Environ. Geology. 54, 311+324. doi:10.1007/s00254-007-0818-3
Dang, V.-H., Dieu, T. B., Tran, X.-L., and Hoang, N.-D. (2019). Enhancing the accuracy of rainfall-induced landslide prediction along mountain roads with a GIS-based random forest classifier. Bulletin of Engineering Geology and the Environment 78, 2835+2849. doi:10.1007/s10064-018-1273-y
Eeckhaut, M., Reichenbach, P., Guzzetti, F., Rossi, M., and Poesen, J. (2009). Combined landslide inventory and susceptibility assessment based on different mapping units: an example from the Flemish Ardennes, Belgium. Natural Hazards and Earth System Sci. 9, 507+521. doi:10.5194/nhess-9-507-2009
Ermini, L., Catani, F., and Casagli, N. (2005). Artificial Neural Networks Applied to Landslide Susceptibility Assessment. geomorphology 66, 327+343. doi:10.1016/j.geomorph.2004.09.025
Farr, T. G., Rosen, P. A., Caro, E., Crippen, R., Duren, R., Hensley, S., et al. (2007). The Shuttle Radar Topography mission. Rev. Geophys. 45. doi:10.1029/2005RG000183
Fawcett, T. (2006). An Introduction to Roc Analysis. Pattern Recognition Lett. 27, 861+874. doi:10.1016/j.patrec.2005.10.010
Funk, C., Peterson, P., Landsfeld, M., Pedreros, D., Verdin, J., Shukla, S., et al. (2015). The Climate Hazards Infrared Precipitation with Stations—A New Environmental Record for Monitoring Extremes. Scientific data 2, 1+21. doi:10.1038/sdata.2015.66
Gorelick, N., Hancher, M., Dixon, M., Ilyushchenko, S., Thau, D., and Moore, R. (2017). Google Earth Engine: Planetary-Scale Geospatial Analysis for Everyone. Remote Sensing Environ. 202, 18+27. doi:10.1016/j.rse.2017.06.031
Guzzetti, F., Reichenbach, P., Ardizzone, F., Cardinali, M., and Galli, M. (2006). Estimating the Quality of Landslide Susceptibility Models. Geomorphology 81, 166+184. doi:10.1016/j.geomorph.2006.04.007
Huffman, G., Stocker, E., Bolvin, D., Nelkin, E., and Jackson, T. (2019). “GPM IMERG Final Precipitation L3 1 Day 0.1 Degree X 0.1 Degree V06,” in Tech. rep., Goddard Earth Sciences Data and Information Services Center (GES DISC. Editor A Savtchenko, and M. D. Greenbelt.
Hunter, J. D. (2007). Matplotlib: A 2d Graphics Environment. Comput. Sci. Eng. 9, 90+95. doi:10.1109/MCSE.2007.5510.1109/mcse.2007.55
Hussin, H. Y., Zumpano, V., Reichenbach, P., Sterlacchini, S., Micu, M., van Westen, C., et al. (2016). Different Landslide Sampling Strategies in a Grid-Based Bi-variate Statistical Susceptibility Model. Geomorphology 253, 508+523. doi:10.1016/j.geomorph.2015.10.030
Jebur, M., Pradhan, B., Shafri, H., Yusoff, Z., and Tehrany, M. S. (2015). An Integrated User-Friendly Arcmap Tool for Bivariate Statistical Modelling in Geoscience Applications. Geoscientific Model. Develop. 8, 881+891. doi:10.5194/gmd-8-881-2015
Lei, Y., Peng, C., Regmi, A. D., Murray, V., Pasuto, A., Titti, G., et al. (2018). An International Program on Silk Road Disaster Risk Reduction+a Belt and Road Initiative (2016+2020). J. Mountain Sci. 15, 1383+1396. doi:10.1007/s11629-018-4842-4
Lin, G.-F., Chang, M.-J., Huang, Y.-C., and Ho, J.-Y. (2017). Assessment of Susceptibility to Rainfall-Induced Landslides Using Improved Self-Organizing Linear Output Map, Support Vector Machine, and Logistic Regression. Eng. Geology. 224, 62+74. doi:10.1016/j.enggeo.2017.05.009
Lombardo, L., Bakka, H., Tanyas, H., van Westen, C., Mai, P. M., and Huser, R. (2019). Geostatistical Modeling to Capture Seismic-Shaking Patterns from Earthquake-Induced Landslides. J. Geophys. Res. Earth Surf. 124, 1958+1980. doi:10.1029/2019jf005056
Lombardo, L., Opitz, T., Ardizzone, F., Guzzetti, F., and Huser, R. (2020a). Space-time Landslide Predictive Modelling. Earth-Science Rev. 209, 103318. doi:10.1016/j.earscirev.2020.103318
Lombardo, L., and Tanyas, H. (2021). From Scenario-Based Seismic hazard to Scenario-Based Landslide hazard: Fast-Forwarding to the Future via Statistical Simulations. Stochastic Environ. Res. Risk Assess.. doi:10.1007/s00477-021-02020-1
Lombardo, L., Tanyas, H., and Nicu, I. C. (2020b). Spatial Modeling of Multi-hazard Threat to Cultural Heritage Sites. Eng. Geology. 277, 105776. doi:10.1016/j.enggeo.2020.105776
Mitchell, M. (1995). Genetic Algorithms: An Overview. Complexity 1, 31+39. doi:10.1002/cplx.6130010108
Osna, T., Sezer, E. A., and Akgun, A. (2014). Geofis: an Integrated Tool for the Assessment of Landslide Susceptibility. Comput. Geosciences 66, 20+30. doi:10.1016/j.cageo.2013.12.016
Pedregosa, F., Varoquaux, G., Gramfort, A., Michel, V., Thirion, B., Grisel, O., et al. (2011). Scikit-learn: Machine Learning in python. J. Machine Learn. Res. 12, 2825+2830.
Petschko, H., Brenning, A., Bell, R., Goetz, J., and Glade, T. (2014). Assessing the Quality of Landslide Susceptibility Maps+case Study Lower Austria. Nat. Hazards Earth Syst. Sci. 14, 95+118. doi:10.5194/nhess-14-95-2014
Polat, A. (2021). An Innovative, Fast Method for Landslide Susceptibility Mapping Using Gis-Based Lsat Toolbox. Environ. Earth Sci. 80, 1+18. doi:10.1007/s12665-021-09511-y
QGIS Development Team (2022). QGIS Geographic Information System. QGIS Association. Available at: https://www.qgis.org.
Rahmati, O., Kornejady, A., Samadi, M., Deo, R. C., Conoscenti, C., Lombardo, L., et al. (2019). Pmt: New Analytical Framework for Automated Evaluation of Geo-Environmental Modelling Approaches. Sci. total Environ. 664, 296+311. doi:10.1016/j.scitotenv.2019.02.017
Razali, N. M. (2015). An Efficient Genetic Algorithm for Large Scale Vehicle Routing Problem Subject to Precedence Constraints. Proced. - Soc. Behav. Sci. 195, 1922. doi:10.1016/j.sbspro.2015.06.203
Reichenbach, P., Rossi, M., Malamud, B. D., Mihir, M., and Guzzetti, F. (2018). A Review of Statistically-Based Landslide Susceptibility Models. Earth-Science Rev. 180, 60+91. doi:10.1016/j.earscirev.2018.03.001
Rossi, M., and Reichenbach, P. (2016). Land-se: a Software for Statistically Based Landslide Susceptibility Zonation, Version 1.0. Geoscientific Model. Develop. 9, 3533+3543. doi:10.5194/gmd-9-3533-2016
Safanelli, J. L., Poppiel, R. R., Ruiz, L. F. C., Bonfatti, B. R., Mello, F. A. d. O., Rizzo, R., et al. (2020). Terrain Analysis in Google Earth Engine: A Method Adapted for High-Performance Global-Scale Analysis. ISPRS Int. J. Geo-Information 9. doi:10.3390/ijgi9060400
Said, G., Mahmoud, A., and El Horbaty, E. (2014). A Comparative Study of Meta-Heuristic Algorithms for Solving Quadratic Assignment Problem. Int. J. Adv. Comput. Sci. Appl. 5, 1+6. doi:10.14569/ijacsa.2014.050510
Szumilas, M. (2010). Explaining Odds Ratios. J. Can. Acad. Child Adolesc. Psychiatry 19 (3), 227–229.
Titti, G., Borgatti, L., Zou, Q., Cui, P., and Pasuto, A. (2021a). Landslide Susceptibility in the belt and Road Countries: continental Step of a Multi-Scale Approach. Environ. Earth Sci. 80, 1+18. doi:10.1007/s12665-021-09910-1
Titti, G., Sarretta, A., and Lombardo, L. (2021b). Cnr-irpi-padova/sz: Sz Plugin. doi:10.5281/zenodo.5693351
Titti, G., van Westen, C., Borgatti, L., Pasuto, A., and Lombardo, L. (2021c). When Enough Is Really Enough? on the Minimum Number of Landslides to Build Reliable Susceptibility Models. Geosciences 11, 469. doi:10.3390/geosciences11110469
Torizin, J. (2012). “Landslide Susceptibility Assessment Tools for Arcgis 10 and Their Application,” in Proceedings of 34th IGC, Brisbane, August 2012, 5+10.
Van Westen, C. J., Rengers, N., Terlien, M., and Soeters, R. (1997). Prediction of the Occurrence of Slope Instability Phenomenal through GIS-Based hazard Zonation. Geologische Rundschau 86, 404+414. doi:10.1007/s005310050149
van Westen, C. J., Soeters, R., and Sijmons, K. (2000). Digital Geomorphological Landslide hazard Mapping of the Alpago Area, Italy. Int. J. Appl. Earth Observation Geoinformation 2, 51+60. doi:10.1016/s0303-2434(00)85026-6
Yeon, Y.-K., Han, J.-G., and Ryu, K. H. (2010). Landslide Susceptibility Mapping in Injae, Korea, Using a Decision Tree. Eng. Geology. 116, 274+283. doi:10.1016/j.enggeo.2010.09.009
Keywords: SZ plugin, susceptibility, Northeast India, QGIS, landslide
Citation: Titti G, Sarretta A, Lombardo L, Crema S, Pasuto A and Borgatti L (2022) Mapping Susceptibility With Open-Source Tools: A New Plugin for QGIS. Front. Earth Sci. 10:842425. doi: 10.3389/feart.2022.842425
Received: 23 December 2021; Accepted: 04 February 2022;
Published: 02 March 2022.
Edited by:
Gioachino Roberti, Minerva Intelligence, CanadaReviewed by:
Milad Janalipour, K. N. Toosi University of Technology, IranGaetano Pecoraro, University of Salerno, Italy
Copyright © 2022 Titti, Sarretta, Lombardo, Crema, Pasuto and Borgatti. This is an open-access article distributed under the terms of the Creative Commons Attribution License (CC BY). The use, distribution or reproduction in other forums is permitted, provided the original author(s) and the copyright owner(s) are credited and that the original publication in this journal is cited, in accordance with accepted academic practice. No use, distribution or reproduction is permitted which does not comply with these terms.
*Correspondence: Giacomo Titti, Z2lhY29tby50aXR0aTJAdW5pYm8uaXQ=
 Giacomo Titti
 Alessandro Sarretta
 Luigi Lombardo
 Stefano Crema
 Alessandro Pasuto2