- 1School of Environmental and Biological Engineering, Henan University of Engineering, Zhengzhou, China
- 2Henan Engineering Laboratory of Comprehensive Treatment Technology for Environmental Geohazards in Coal Mine, Zhengzhou, China
- 3Engineering Research Center of Soil Pollution Detection and Controlling in Coal Producing Area of Henan Province, Zhengzhou, China
Pore is the main adsorption and desorption space of coalbed methane (CBM). Pore size configuration and connectivity affect the adsorption/desorption hysteresis effect. Using tectonically deformed coal (TDC) and original structure coal of medium- and high-rank coal as the research objects, through the N2/CO2 adsorption experiment to analyze the pore size distribution and connectivity of different scales. We investigate the control mechanism of heterogeneous evolution in the key pore scales against adsorption/desorption hysteresis characteristics during coal metamorphism and deformation by combining the CH4 isothermal adsorption/desorption experiment under 30°C equilibrium moisture. The findings indicate that the super micropores (<2 nm) are mainly combination ink bottle-shaped pores and have worse connectivity as the degree of metamorphism and deformation increases. The super micropores occupy the vast majority of pore volume and specific surface area; its pore size distribution curve change presents an “M” bimodal type and is mainly concentrated in two pore segments of 0.45–0.70 nm and 0.70–0.90 nm. The effect of ductile deformation exerts a significantly greater effect on super micropores than brittle deformation. The exhibited adsorption–desorption characteristics are the result of the combined effect of the unique pore structure of the TDCs and different moisture contents. The presence of a large number of super micropores is the most important factor influencing the degree of gas desorption hysteresis. The “ink-bottle effect” is the primary cause of gas desorption hysteresis. For CBM development, some novel methods to increase desorption and diffusion rate at the super micropores scale should be considered.
Introduction
Coalbed methane (CBM) is a significant clean energy resource, as an unconventional natural gas and mainly adsorbed in coal. CBM is primarily composed of methane. To meet the “double carbon target”, coal mine methane emissions must be reduced, which necessitates the advancement of efficient CBM mining technology. China has an abundance of CBM reserves. According to studies, the total CBM resources with a burial depth of less than 2,000 m are approximately 36.82 × 10¹² m3, where the CBM resources of medium- and high-rank coal reservoirs are about 22.12 × 10¹² m3, accounting for about 60% of the total CBM resources, and reservoirs of medium- and high-rank coal have relatively high gas content (Qin et al., 2018). Tectonically deformed coals (TDCs) are compositionally and structurally transformed by tectonic stresses that occurred extensively during the geological period in the selected regions (Song et al., 2020a). Coal has very different internal pore structures when subjected to different tectonic stresses. Coal deformation types are classified as brittle deformation, brittle-ductile deformation, and ductile deformation, involving more than ten series of TDCs such as fragmented coal, flax seed coal, scaled coal, and mylonitized coal (Ju et al., 2004; Jiang et al., 2010; Cheng and Lei, 2021). Different tectonic deformation mechanisms have significant effects on the nanopore structure and macromolecular structure of coal (Hou et al., 2012; Pan et al., 2015; Hou et al., 2017; Cheng et al., 2020). TDC has a larger total pore volume (TPV) and total specific surface area (TSSA) than original structure coal (OSC). Pore volume (PV) is mainly contributed by macropores and mesopores. Specific surface area (SSA) is mainly contributed by micropores, where mylonitized coal has the biggest PV and SSA at different pore size stages (Meng et al., 2015; Li et al., 2019a; Mou et al., 2021). In the brittle deformation stage, structural deformation causes the complex micropore structure of coal and poor pore connectivity, and a simple mesopore structure is due to the loss of functional groups and the shrinkage of some mesopore structures under stress. There is still a significant difference in micropore structure during the ductile deformation stage, and the difference in mesopore structure changes from weak to strong, which is related to the formation of large quantities of intermolecular pores, defects, and air pores under the action of strong tectonic stress (Guo et al., 2019; Song et al., 2020b). The brittle deformation coal, while there are more small open pores in ductile deformation coal. Due to poor pore connectivity, the gas adsorption capacity of coal increases, with gas diffusion capacity decreasing (Song et al., 2017a; Song et al., 2020b; Yan et al., 2021). The inner surface of coal pores became rougher as structural deformation increased, the pore structure tended to become more complex as the fractal dimension increased, and the pore structure displayed multi-fractal characteristics, according to fractal theory (Niu et al., 2017; Niu et al., 2019; Wang et al., 2020a). Studies have shown that ductile deformation coal has a higher pore fractal dimension than brittle deformation coal, showing more complex pore structure and increased heterogeneity, which results in increased adsorption capacity, enhanced micropore capillary condensation effect, and prominent desorption hysteresis loop (Zhang et al., 2014a; Wang and Li, 2016; Li et al., 2017). Through low-temperature N2 adsorption (LTAN) and low-pressure CO2 adsorption (LPCA) experiments, Hu et al. (2020) and Cheng et al. (2020) found that super micropore structures smaller than 2 nm accounted for the majority of the total pore specific surface, while methane adsorption capacity increased with the increase of micropore PV and micropore SSA, concluding that super micropore structures smaller than 2 nm were the dominant factor affecting methane adsorption capacity. The production of CBM mainly goes through the processes of drainage depressurization–desorption–diffusion–seepage (Lin et al., 2016; Gao et al., 2020). Maximizing the desorption of gas adsorbed inside the pore space is the most important factor in achieving maximum capacity in CBM wells. One of the most important factors affecting CBM recovery efficiency and the design of a CBM drainage system is the desorption characteristics of CBM (He et al., 2020). Previous studies have shown that the adsorption and desorption of CBM in coal are not fully reversible in most cases, and there is a hysteresis (lag) in adsorption and desorption (Wang et al., 2014; Wang et al., 2016; Ma et al., 2020). In the CBM desorption process, desorption hysteresis is defined as a phenomenon in which the desorption process lags behind the adsorption process due to physicochemical effects like temperature, pressure, moisture, and pore capillary condensation phenomena (Wang et al., 2014; Lin et al., 2016; Xu et al., 2021). Based on the results of previous studies, desorption hysteresis is controlled by various factors with one or more dominant factors for any given coals (Zhang and Liu, 2017; Hou et al., 2020). The physical composition of the coal rock, thermal maturity, pore structure distribution, reservoir temperature, water content, and other factors all have an impact on the desorption hysteresis effect (Wang et al., 2014; Hou et al., 2020; Xu et al., 2021). Methane adsorption/desorption processes in TDCs are not consistent with OSC. Different degrees of desorption hysteresis effects develop in different types of TDCs (Song et al., 2012). The desorption hysteresis mechanisms proposed in the literature include the following: gas adsorbed into the coal matrix or dissolved into the residual moisture (Busch et al., 2003; Wang et al., 2016), irreversible deformation (swelling/shrinkage) (Wang et al., 2020b; He et al., 2020), or thermodynamic (energy barrier) limits on accessibility to pore throats (Ma et al., 2012; Liu et al., 2021). The explanations for the hysteresis mechanism are all directly or indirectly related to the pore structure distribution (Wang et al., 2014; Wang et al., 2016; Xu et al., 2021). The key pore scales influencing the generation of hysteresis in gas desorption from coal, on the other hand, are still poorly understood. The influence of the nonuniform evolution of super micropores smaller than 2 nm on the hysteresis characteristics of adsorption and desorption in TDC is still poorly understood, and the relationship between the pore distribution of super micropores smaller than 2 nm and the hysteresis characteristics of adsorption and desorption is mostly analyzed qualitatively.
Therefore, the author takes medium- and high-rank TDCs and OSC as the research objects conduct CH4 isothermal adsorption/desorption experiments and uses LTNA and LPCA experiments to analyze the pore size distribution (PSD), pore shape (PS) connectivity, PV, SSA, and fractal characteristic of different scales, especially the distribution characteristics of <2-nm super micropores. On a microscopic level, the author discusses the control mechanism of heterogeneous evolution in pore structure during coal deformation against CH4 adsorption/desorption hysteresis characteristics, which is important for understanding the nature of gas adsorption and desorption, and provides a theoretical basis for CBM exploration and development in medium- and high-rank TDCs and OSC distribution areas.
Experimental Samples and Experimental Methods
Experimental Samples
Jiaozuo Coalfield and Pingdingshan Coalfield are the main distribution areas of medium- and high-rank CBM resources, with CBM resources exceeding 10–100 billion cubic meters (Cheng and Pan, 2020). China’s coal-bearing basins have a complicated structural evolution. The Late Paleozoic coal-bearing basins of the North China Plate, which have undergone multiple stages of tectonic stress superimposition and transformation such as compression, tension and shear, face deformation, and destruction of coal seam structure, form various types of TDCs widely distributed in Jiaozuo and Pingdingshan mining areas. Therefore, the experimental coal samples were collected from high-rank anthracite (No. WYM) of the Zhongma Mine in Jiaozuo Mining District, as well as medium-rank fat coal (No. FM) of the 12th mine in Pingdingshan Mining District, Henan Province, where both OSC and TDCs are developed in the Late Paleozoic Shanxi Formation coal seam. Concerning the coal structure classification plan in China’s national standard (GB/T 30050-2013), samples of OSC, fragmented coal, flax seed coal, and mylonitized coal were collected. TDC samples correspond to three deformation series: weak brittle deformation coal (WBDC), strong brittle deformation coal (SBDC), and strong ductile deformation coal (SDDC). As shown in Table 1, a 20-g air-dried base coal sample smaller than 0.2 mm was chosen for maximum vitrinite reflectance measurement and industrial analysis following China’s national standards GB/T6948-2008, GB/T212-2008, and so on.
At present, a series of approaches to sort the pore structures in the coal reservoir have been put forward based on the physical adsorption property and capillary condensation theory (Song et al., 2020b; Mou et al., 2021). To better understand the effects of pore structure on gas adsorption capacity and flow capability, this work employs a combined classification for coal pore size from the International Union of Pure and Applied Chemistry (IUPAC) (Thommes et al., 2015; Wang et al., 2021a) and Hodot (Li et al., 2015; Li et al., 2020): supermicropores (<2 nm), micropores (2–10 nm), mesopores (10–50 nm), and macropores (50–100 nm).
Low-Temperature N2 Adsorption Experiment
Experimental Instruments and Methods
The LTNA experiment used the QuadraWin SI SSA and pore size analyzer produced by Quantachrome, United States, with a pore size test range of 0.35–500 nm. The instrument is designed according to the isothermal adsorption principle of the “static adsorption capacity method”. The coal sample was crushed before selecting a coal sample with a particle size of 0.17–0.25 mm. Weigh 3 g on a balance, dry it in the oven, and degas each sample under vacuum. Heat it for 12 h at 105°C. N2 was injected under pressure at a low temperature of 77 K after the coal sample had cooled (Niu et al., 2019). Finally, the instrument supporting software can be used to calculate the PSD, PV, and SSA of the sample for various pore sizes using the BJH, BET, and DFT methods (Li et al., 2019b; Zhang et al., 2019).
Experimental Results
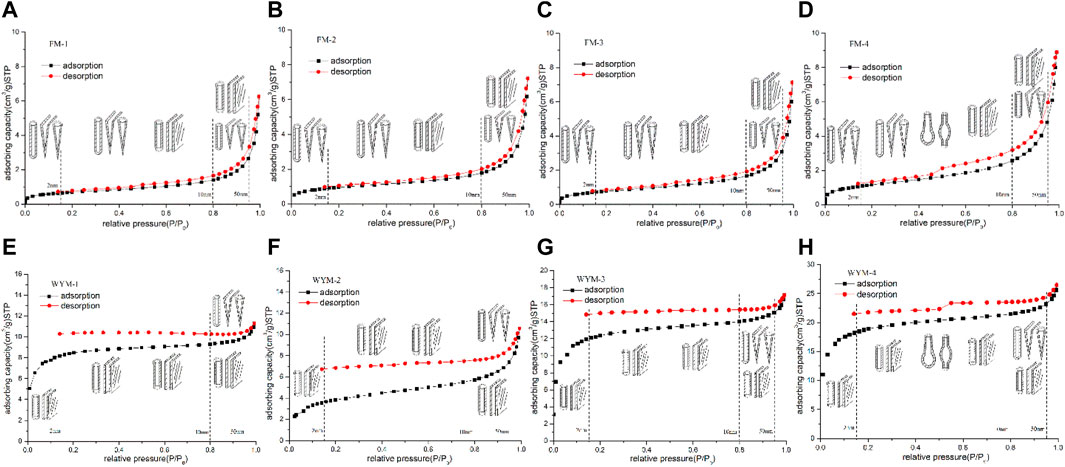
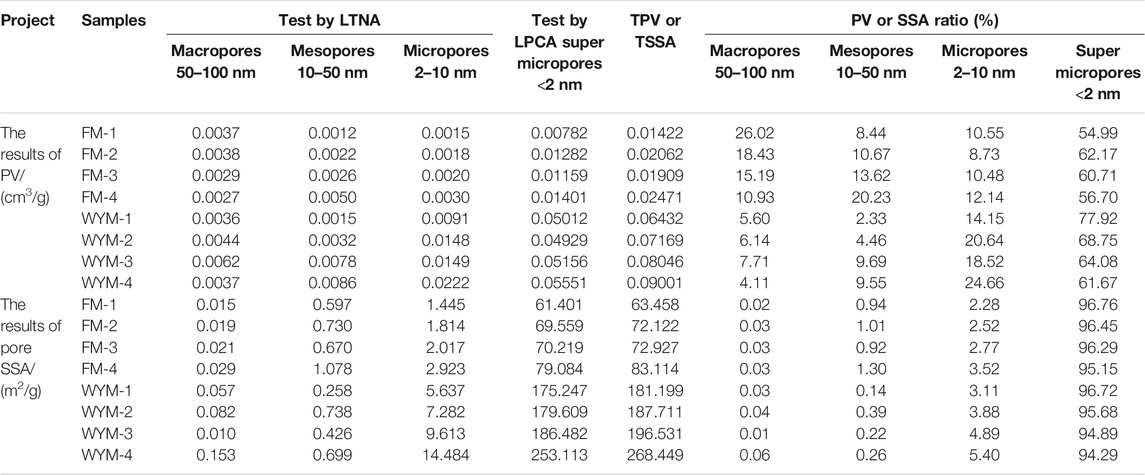
The adsorption isotherm is a concentrated representation of the measurement results of the LTNA experiment, which can reflect the characteristics of PS and PSD in coal. As is shown in Figure 1. The measurement results of PV and SSA of eight samples are shown in Table 2.
Low-Pressure CO2 Adsorption Experiment
Experimental Instruments and Methods
The LPCA experiment has a similar principle to the LTNA experiment. The QuadraWin SI type SSA and pore size analyzer produced by Quantachrome, United States, was used, and the pore size measurement range was 0.35–2.0 nm. Select sample 2–4 g with a particle size of 0.17–0.25 mm. The experimental process is mainly divided into three steps: drying, degassing, and adsorption–desorption measurement, which is the same as N2 adsorption. The temperature at which CO2 adsorption was measured was 273 K, and the maximum equilibrium pressure was 0.12 MPa. The relative pressure varied between 0 and 0.035 because the saturated vapor pressure of CO2 was 3.48 MPa at this temperature and pressure. Since it is difficult for N2 molecules to enter pores <2 nm, while CO2 molecules can enter pores with a minimum diameter of about 0.35 nm, CO2 adsorption was used to study the distribution of super micropores with pore size <2 nm (Pajdak et al., 2019).
Experimental Results
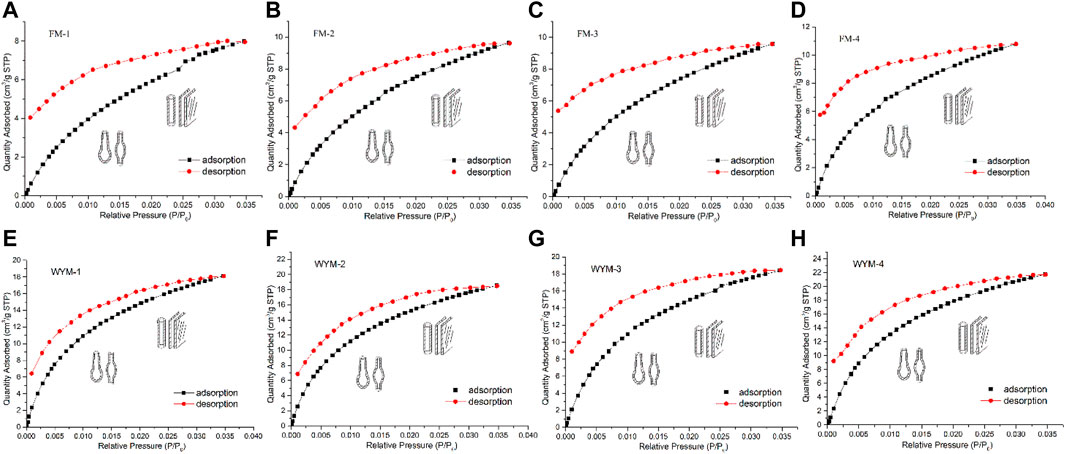
The measurement results of PV and SSA of eight samples are shown in Table 2, and the CO2 adsorption isotherms of the coal samples are shown in Figure 2.
CH4 Isothermal Adsorption/Desorption Experiment
Experimental Instruments and Methods
The isotherm adsorption/desorption experiment adopted the IS-300 isotherm adsorption/desorption instrument produced by Terra Tek, United States. Sample pretreatment is the preparation of samples with equilibrium moisture (Me/%). First, the test samples were crushed to 0.17–0.25 mm, and then a small sprayer was used to spray distilled water on the coal sample for pre-wetting. After a thorough mixture, spread the pre-wet coal sample flat in a low-flat open pan and place it in a thermostat with a temperature of 30°C and relative humidity of 97%–98%. Every day, the samples were weighed until the sample weight remained essentially unchanged after 2 days. Then, under 30°C equilibrium moisture, conduct an isothermal adsorption/desorption experiment. The experiment used CH4 as the adsorbate gas, which had a purity of 99.99%. The maximum pressure in the experiment was 12 MPa, while the equilibrium pressure was 10 MPa. Six equilibrium adsorption pressure points and nine desorption pressure points were set, with the equilibrium time of each pressure point at 12 h.
Experimental Results
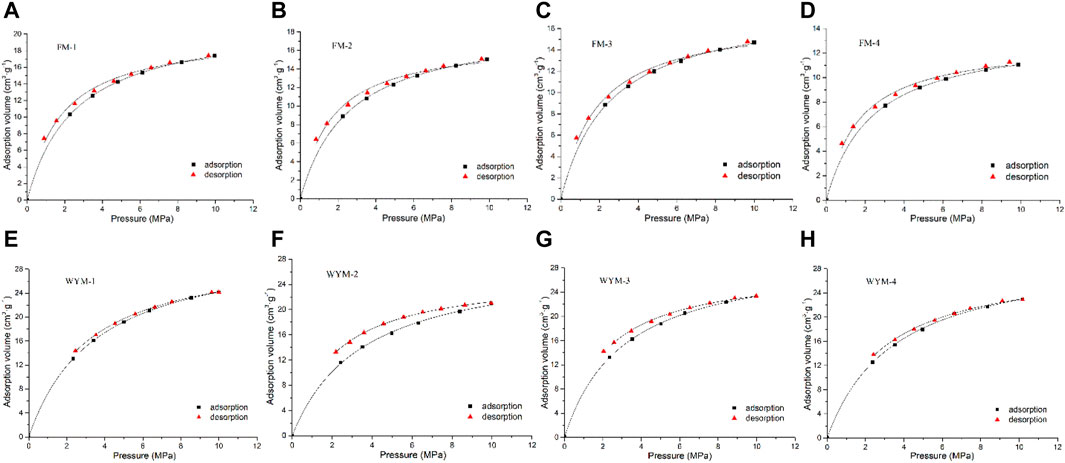
The isothermal adsorption/desorption curve measured in the experiment is shown in Figure 3. The Langmuir adsorption model is widely used to characterize the adsorption behavior of CH4 (Meng et al., 2015; Hou et al., 2020). According to GB/T 19560-2008, under certain temperature and adsorbate, the adsorption capacity of coal against CH4 gas can be described by Langmuir equation, which is
where P is the gas pressure (MPa); V is the adsorption capacity under pressure P (cm3/g); VL is the maximum adsorption capacity, also known as Langmuir volume (cm3/g); and PL is the Langmuir pressure (MPa), which refers to the pressure value when the adsorption capacity reaches 1/2 of VL.
Generally speaking, VL reflects the ultimate adsorption capacity of coal reservoirs, while PL represents the difficulty level of gas desorption. Smaller PL, greater VL, and higher curvature of the adsorption isotherm mean stronger gas adsorption capacity (Wang et al., 2014; Xu et al., 2021). According to Eq. 1, the VL, PL, and the correlation coefficient, R2, of the adsorption curve and the desorption curve are calculated respectively, as shown in Table 3.
Results and Discussion
Pore Shape Analysis
Due to the different physical properties of porous media solids and adsorbed gas, the gas adsorption isotherms of porous media solids present different types. The gas adsorption isotherms of porous solid solids have been summarized and concluded by the IUPAC, and they have been divided into eight isotherm types (I–VI) (Thommes et al., 2015). Coal is a complex disordered carbon material with super micropores to macropores, according to the IUPAC standard. The adsorption process can be divided into micropore filling, single-layer adsorption, multi-layer adsorption, and capillary condensation (Hu et al., 2020; Liu et al., 2021).
The LTNA isotherms of fat OSC and different types of TDCs are shown in Figures 1A–D. It can be seen that the shape of the adsorption isotherm is a combination of type II and IV(a) curves. When the relative pressure (P/P0) < 0.8, the curve rises slowly, transiting from micropore filling and monolayer adsorption to multi-molecular layer adsorption. As the P/P0 increases, the adsorption capacity increases slowly. When the P/P0 > 0.8, capillary agglomeration occurs and the gas adsorption capacity increases sharply, indicating that the coal contains a considerable number of micropores and super micropores. As shown in Figures 1E–H, it can be seen that the shape of anthracite adsorption isotherm is also a combination of type II and IV(a) curves. The adsorption curve almost linearly rises at the lower P/P0 (0–0.15), indicating micropore filling. It has a higher proportion of super micropores than medium-rank fat coal. As the P/P0 increases, the number of molecules arranged in the monolayer of the micropores increases, and multi-layer adsorption occurs where surface tension is concentrated, with the adsorption layer thicker and the curve rising. When the P/P0 exceeds 0.8, capillary condensation appears in the mesopores, with adsorption capacity gradually increasing. SDDC samples has significantly greater adsorption capacity than SBDC, WBDC, and OSC under the condition of dry coal sample, as measured by the total adsorption capacity of the longitudinal axis, which is consistent with the analysis results in the literature (Cheng and Hu, 2021).
According to the IUPAC classification standard, the hysteresis loop in the gas adsorption isotherm can be divided into six categories (H1–H5) (Thommes et al., 2015). The nano-scale PS in coal can be predicted by the hysteresis loop pattern in the gas adsorption isotherm, which is also a widely used practice at present (Li et al., 2019b; Song et al., 2020b; Mou et al., 2021). As shown in Figure 1, after the adsorption process ends, desorption begins and the adsorption loop of each coal sample produces a certain “hysteresis loop”. The adsorption loops of OSC (FM-1, Figure 1A), WBDC (FM-2, Figure 1B), and SBDC (FM-3, Figure 1C) samples for medium-rank fat coal are a combination of type H1 and H4 curves. Whereas the adsorption loop in the mesopore stage is of the H1 type, the adsorption loop in the micropore stage is of the H4 type, which is consistent with OSC, fragmented coal findings in the literature (Song et al., 2017b). Under P/P0 < 0.8, the adsorption and desorption curves are almost parallel, belonging to the H4 type due to the filling of micropores. After P/P0 > 0.8, the adsorption and desorption curves present an obvious upward trend. Because of the mesoporous multi-molecular layer adsorption, the curves rise sharply as P/P0 approaches 1.0, indicating that they are of the H1 type. The hysteresis loop as a whole is small and close to the reversible adsorption and desorption state. The PS corresponds to a cylindrical pore with one end closed, a wedge-shaped pore with one end closed and a tapered pore with one end closed. Meanwhile, it contains some cylindrical pores open at both ends and parallel plate-shaped pores open on four sides (Guo et al., 2017). The adsorption loop of fat SDDC is also a combination of type H1 and H4 curves. The desorption curve exhibits a clear inflection point when the FM-4’s P/P0 is approximately 0.5. The desorption branch rapidly decreases when the P/P0 is slightly lower than the inflection point, indicating that there are many ink bottle-shaped pores similar to the H1 type with one end open (Jiang et al., 2011). For high-rank anthracite (Figures 1E–H), the adsorption and desorption curves are irreversible, almost parallel within the entire relative pressure range and corresponding to cylindrical pores open at both ends and parallel plate-shaped holes open on four sides. The PS of fat coal differs significantly from this. The most obvious thing is that the hysteresis loop does not close at low P/P0. This is not the case with medium-rank fat coal. Similar occurrences have been reported in the literature (Nie et al., 2015; Zhang et al., 2019). It shows that high-rank anthracite has greater residual adsorption capacity than medium-rank fat coal, with more developed super micropores and micropores not easy to desorb. Table 2 also confirms this analysis result. As a result, during the adsorption process, gas molecules enter super micropores, causing inelastic expansion and deformation of the coal matrix or gas molecules in pores with similar widths to adsorbate molecules to exhibit irreversible absorption. It can be seen from Figure 1 that, under the same deformation degree, as the metamorphism increases, the semi-closed pores in the micropore stage evolve into open pores, resulting in better pore connectivity.
Figure 2 shows the CO2 adsorption isotherms of eight samples at 273 K. The shape of the CO2 adsorption isotherm is also a combination of type II and IV(a) curves. As P/P0 increases, coal samples have a higher CO2 adsorption capacity. It can be seen from Figure 2 that regardless of fat coal or anthracite, there is no overlapping in the adsorption curve and desorption curve. The adsorption loop is the type H4 curves. A desorption hysteresis loop is also present, with pore shapes corresponding to cylindrical pores open on both ends, parallel plate-shaped pores open on four sides, and ink bottle-shaped pores. Analysis suggests that “ink bottle-shaped pores” at the super micropore (<2 nm) segment can be regarded as a combination of a smaller-size cylindrical pore open at both ends and a spherical pore (plant tissue pore, air pore, and macromolecular structure pore). Literature (Efremov and Fenelonov, 1989; Sang et al., 2005; Song et al., 2017b) also believes that such “combination ink bottle-shaped pores” may be more dominant.
The Pore Volume, Specific Surface Area, and Pore Size Distribution
The Pore Volume and Specific Surface Area
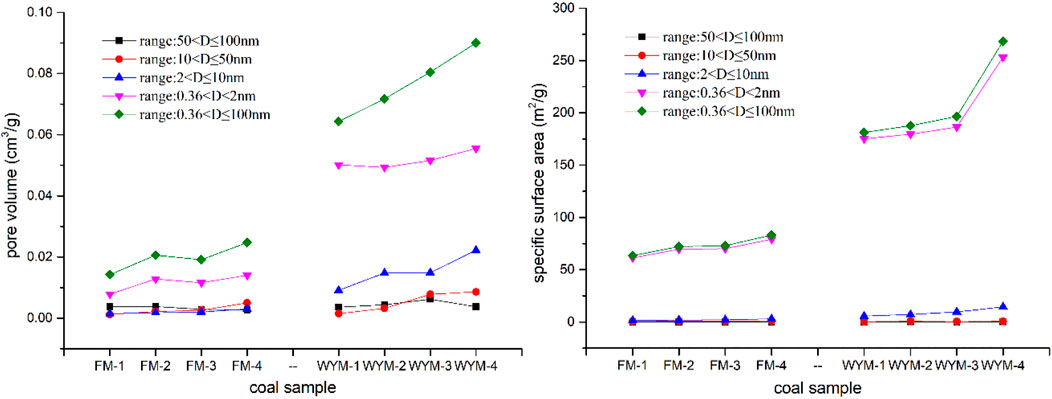
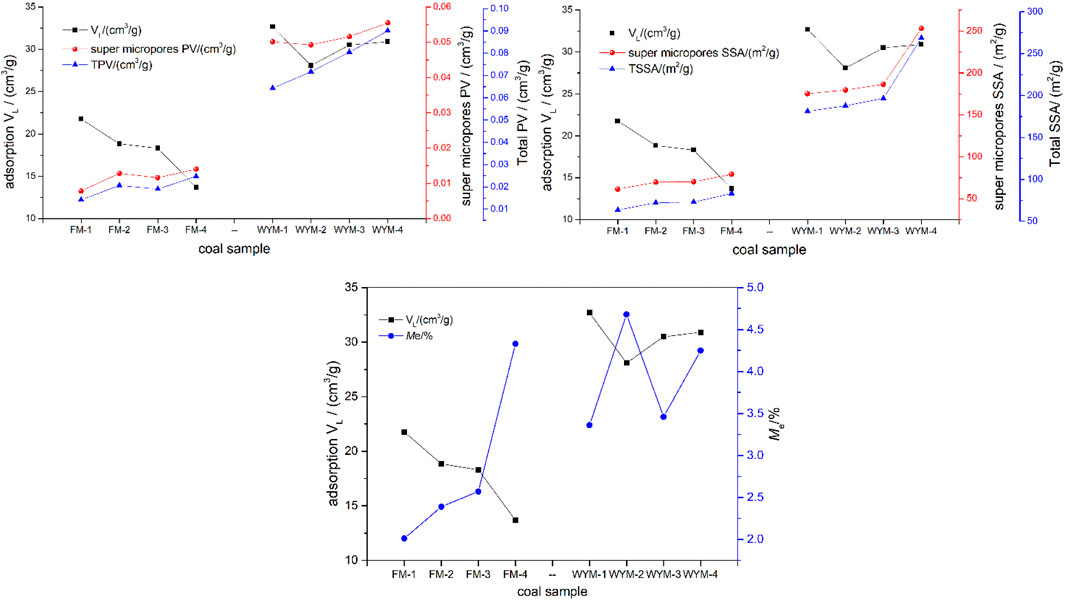
The LTNA and LPCA method can be used to quantitatively characterize PV, SSA, and PSD of coal. Due to the N2 activation and diffusion effect, N2 cannot enter super micropores <2 nm. As a result, the LTNA method is suitable for the measurement of pores with a pore size of 2–100 nm (Wang et al., 2021b; Yan et al., 2021). CO2 molecules are smaller than N2 molecules, which have a faster diffusion rate, with high saturation pressure (P0 = 26,142 mm Hg) at 273 K, making it easier to collect micropore filling data at a lower relative pressure. Therefore, the CO2 adsorption curve at 273 K can provide PSD information of samples with super micropores <2 nm (Cheng et al., 2020; Wang et al., 2021b). The PV and SSA results of super micropores, micropores, mesopores, and macropores are shown in Table 2 and Figure 4.
From Table 2 and Figure 4, the TPV of fat coal ranges from 0.01422 to 0.02471 cm3/g, and the proportion of super micropores ranges from 54.99% to 62.17%. The TPV of anthracite ranges from 0.06432 to 0.09001 cm3/g, and the proportion of super micropores ranges from 61.67% to 77.92%. The TSSA of fat coal ranges from 63.458 to 83.114 m2/g, and the proportion of super micropores ranges from 95.15% to 96.76%. The TSSA of anthracite ranges from 181.199 to 268.4449 m2/g, and the proportion of super micropores ranges from 94.29 to 96.97%. The super micropores occupy the vast majority of PV and SSA, with SSA being more prominent. With increasing deformation and metamorphism degree, mesopore PV and micropore PV increase. With increasing deformation and metamorphism degree, micropore SSA and super micropore SSA and TSSA increase. Metamorphism has a greater impact on PV and SSA than deformation.
Pore Size Distribution Characteristics
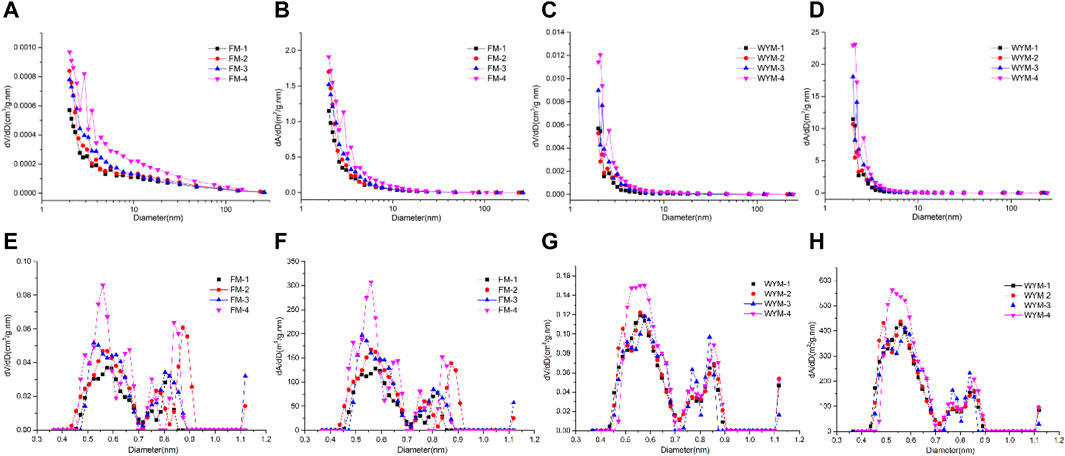
Figures 5A–D show the changes of PV and SSA per unit pore segment as measured by the LTNA method. For medium-rank fat coal, when the pore size D < 100 nm, dV/dD increases significantly with the increasing deformation degree, and SDDC (FM-4) exhibits the most significant change (Figure 5A). When D < 10 nm, dA/dD increases significantly with the increasing deformation degree, and SDDC (FM-4) exhibits the most significant change (Figure 5B). For high-rank anthracite, when D < 10 nm, dV/dD and dA/dD increase rapidly as the pore size decreases and the SDDC (WYM-4) exhibits the highest growth rate (Figures 5C,D). According to the findings, the deformation effect is more pronounced on the PV and SSA of various types of TDCs, as well as the OSC of medium-rank fat coal. However, when viewed along the longitudinal axis, the dV/dD and dA/dD increase rates of high-rank anthracite are more than 10 times those of medium-rank fat coal when deformed to the same degree, indicating an inherited development based on metamorphism from medium-rank fat coal to high-rank anthracite. That is, as the metamorphism and deformation degree increase, the coal pore structure exhibits the characteristics of differential and inherited evolution.
Figures 5E–H show the change of dV/dD and dA/dD as measured by the LPCA experiment. When D < 2 nm, dV/dD and dA/dD curve change presents an “M” bimodal type, the left peak contains a slightly larger range of pore sizes than the right peak, and the increments of dV/dD and dA/dD are mainly concentrated in the two pore segments of 0.45–0.70 nm and 0.70–0.90 nm, but the dV/dD and dA/dD of medium-rank fat coal fluctuate greatly in the pore segment 0.70–0.90 nm. When D < 2 nm, dV/dD and dA/dD first increase and then decrease as the pore size decreases, followed by an increase and further decrease, showing the most significant changes in SDDC (FM-4, WYM-4). The increase rate of dV/dD and dA/dD of anthracite under the same deformation degree is more than 2–3 times that of fat coal, as measured by the magnitude of the longitudinal axis. The effect of metamorphism on the dV/dD and dA/dD of the super micropore is reduced when compared to the 10-fold growth rate of micropore (Figures 5A–D), whereas the effect of deformation on super micropores is increased, where ductile deformation exerts a significantly greater effect on super micropores than brittle deformation.
Heterogeneous Fractal Characteristics
Fractal Calculation Model
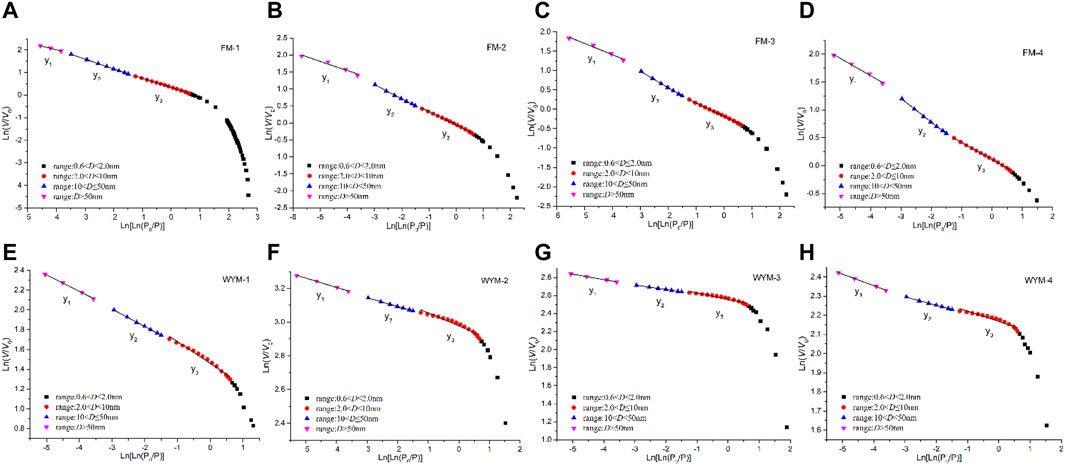
Studies have shown that, due to the complexity and randomness of the pore structure in coal, there are obvious statistical fractal characteristics. Fractal dimension d value is generally between 2 and 3 (Song et al., 2020b; Mou et al., 2021). The fractal dimension calculation based on the experimental data of LTNA mainly targets the adsorption pores (2 < D < 100 nm). According to the measurement results of the LTNA data, the fractal FHH model is selected for calculation (Song et al., 2017a; He et al., 2020), as shown in Eq. 2:
where P is the equilibrium pressure of gas adsorption, MPa; P0 is the saturated vapor pressure of gas adsorption, MPa; V is the volume of gas molecules adsorbed at equilibrium pressure P, cm3/g; and di is the fractal dimension of the ith pore segment, dimensionless. By plotting a scatter diagram with
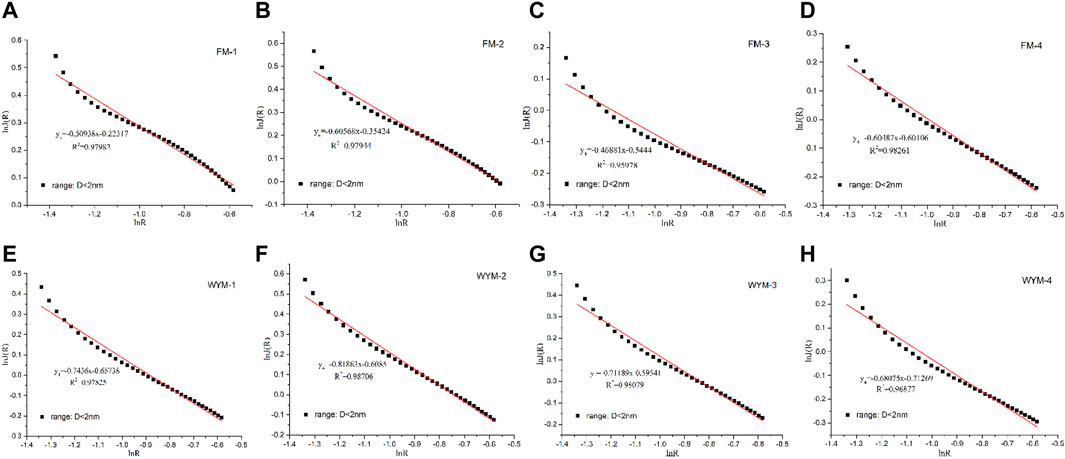
The fractal of super micropores is characterized based on the LPCA experiment. Jaroniec et al. found that the PSD function J(x) and the pore radius x display an obvious linear relationship in the double logarithmic curve under the scale of 0.1–2.0 nm, as shown in Eq. 3 (Jaroniec et al., 1993):
where x is the radius of super micropores, nm; and d4 is the fractal dimension, dimensionless.
If the pore radius x of the super micropore meets x = x(z), where x(z) is a monotonically increasing function of z, then:
where z is the reciprocal of characteristic energy E0. F(z) is the normalized distribution function of z, and Gamma function is usually used to express the heterogeneity of super micropore:
where ρ and v are the relevant parameters of the F(z) distribution function; ρ is a scale parameter, kJ/mol; and v is a shape parameter, which is dimensionless. ρ > 0, v > 0, Γ(x) is a Gamma function, and its expression is:
According to the D–R equation (Nie et al., 2015), the micropore filling degree θ1 can be calculated. Jaroniec et al. proposed that the adsorption characteristics of micropores in heterogeneous solids obey the following integral form (Jaroniec et al., 1990):
where β is the CO2 affinity coefficient, β = 0.38, and z is the function of the characteristic energy E0 in the D–R equation.
By combining Eq. 5 and Eq. 7, we get:
Since z is a function of the characteristic energy E0, E0 is related to the super micropore size x. Therefore, F(z) and J(x) present a certain functional relationship. Stoeckli et al. found the following relationship between x and z (Stoeckli et al., 1989):
By combining Eqs 4, 5, 9, we obtain the expression of J(x):
Variation Characteristics of Fractal Dimension
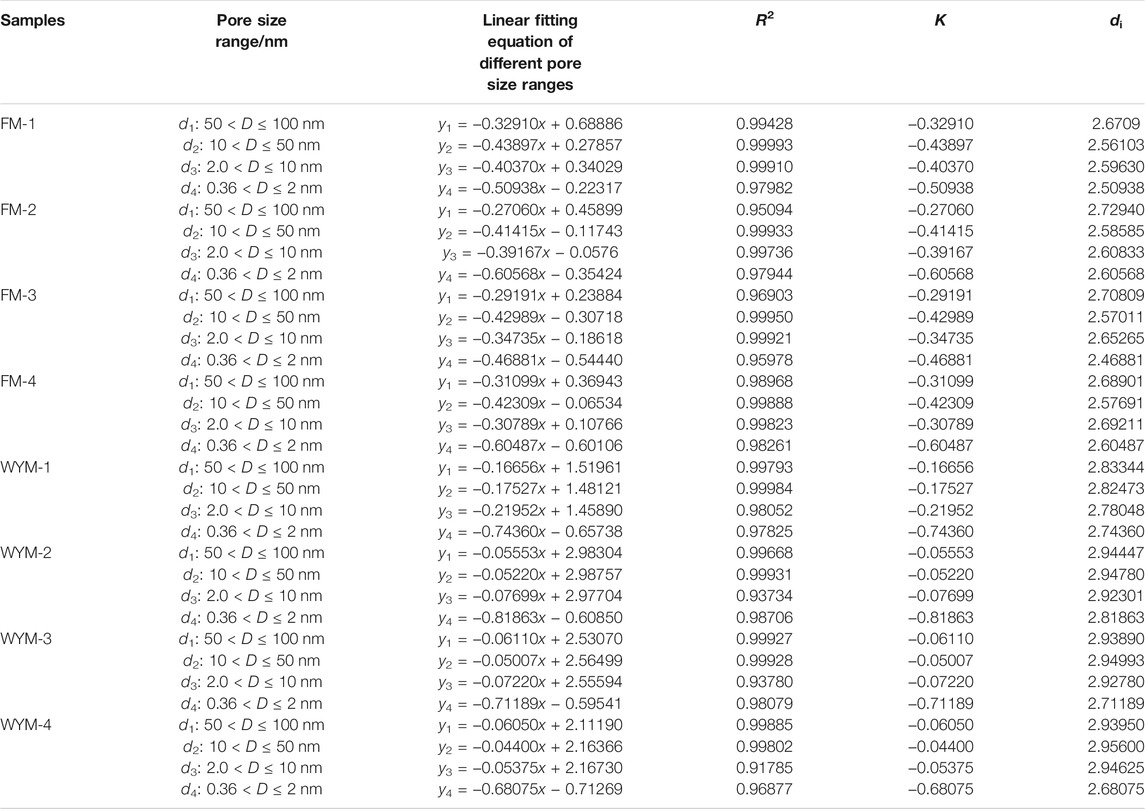
According to Eqs 2–10, Figures 6, 7 show the statistical relationship of eight samples based on LTNA and LPCA experiment data. Fractal dimensions of macropores (50–100 nm), mesopores (10–50 nm), micropores (2–10 nm), and super micropores (<2 nm) are recorded as d1, d2, d3, and d4, respectively, as shown in Table 4.
The variation in di value of different pore segments with metamorphism and deformation is shown in Table 4. It can be seen that the fractal dimension of anthracite ranges from 2.681 to 2.956 and that of fat coal ranges from 2.469 to 2.729, indicating that the pore complexity and surface roughness increase with the increasing metamorphism degree. The pore complexity and surface roughness of micropores (d3) increase with the increasing deformation degree. It can be seen that fractal dimensions of macropores (d1), mesopores (d2), and super micropores (d4) present different change laws from PV and SSA (Figure 4). The analysis shows that brittle and ductile deformation have an all-around influence on the pore complexity and surface roughness. Fractal dimension is a comprehensive manifestation of changes in PV, SSA, and PS.
Adsorption and Desorption Hysteresis Characteristics
Adsorption and Desorption Characteristics
As shown in Figure 3, the isothermal adsorption–desorption curve of eight samples presents a very similar change trend on the whole. The adsorption capacity increases as pressure increases; the rate of growth is faster at lower pressure and significantly slower at higher pressure. Table 3 shows that the adsorption and desorption isotherm data of eight samples fit well with the Langmuir equation, and the correlation coefficient R2 is greater than 98.60%, indicating that the adsorption and desorption characteristics of the eight samples concerning CH4 obey the Langmuir equation, and thus it is reasonable to use this equation for description. Fu et al. conducted isothermal adsorption experiments on the 184 medium-rank coal samples (Ro,max = 0.65%–2.50%) under Me conditions and concluded that when the maximum pressure and maximum temperature are not higher than 12 MPa and 50°C, CH4 adsorption by medium-rank coal accords with the Langmuir equation (Fu et al., 2008). It can be seen from Table 3 that the Ad-VL value in the adsorption process of TDCs and OSC of fat coal is between 13.68 and 21.77 cm3/g; Ad-PL value ranges between 2.36 and 2.57 MPa. The maximum adsorption capacity Ad-VL of medium-rank fat coal decreases as the degree of deformation increases, whereas Ad-PL value increases and then decreases as the degree of deformation increases. The De-VL value ranges between 12.93 and 20.16 cm3/g in the desorption process; the De-PL value ranges between 1.64 and 1.84 MPa, presenting the same change law as the adsorption process. The Ad-VL value in the adsorption process of TDCs and OSC of anthracite ranges between 28.08 and 32.68 cm3/g; the Ad-PL value varies between 3.08 and 3.53 MPa. The utmost adsorption capacity Ad-VL of TDCs and OSC of anthracite first decreases and then increases as the deformation degree increases, while the Ad-PL value first increases, then decreases, and then increases as the deformation degree increases. The De-VL value of the desorption curve ranges between 25.56 and 31.34 cm3/g; the De-PL value varies between 2.03 and 2.94 MPa, presenting the same change law as the adsorption process. The De-VL and De-PL values fitted by the desorption curve are smaller than the Ad-VL and Ad-PL values fitted by the adsorption curve. This test result is consistent with previous research findings (Zhang et al., 2014b). According to Hu et al., the CH4 adsorption capacity of coal is determined by both micropore volume distributions and external surface areas (Hu et al., 2020). To investigate the relationship between Ad-VL and pore structure and equilibrium moisture, according to Tables 2, 3, we calculated the relationship between Ad-VL and PV and SSA of super micropore with the highest proportion, TPV and TSSA, as shown in Figure 8.
It can be seen from Figure 8 that the maximum adsorption capacity Ad-VL of eight samples is not strictly positively correlated with the super micropore PV, super micropore SSA, TPV, and TSSA. It can be seen that at 30°C, the Me content of fat coal is in increasing order as that of FM-1 (OSC), FM-2 (WBDC), FM-3 (SBDC), and FM-4 (SDDC). As the degree of deformation increases, so does the Me content of coal. The Me content of anthracite increases in the same order as that of WYM-1 (OSC), WYM-3 (SBDC), WYM-4 (SDDC), and WYM-2 (WBDC). As the degree of deformation increases, the Me content of coal tends to first increase, then decrease, and then increase. Studies have shown a competitive adsorption relationship between Me and CH4 on the matrix surface. Me occupies the effective adsorption sites on the coal matrix surface, resulting in decreased methane adsorption. Less than a 1% increase of water saturation in the matrix can reduce adsorption capacity by 25%, and 5% equilibrium moisture saturation will even cause a 65% loss of adsorption capacity (Krooss et al., 2002; Qin et al., 2005; Zhang et al., 2014a). The experiment results show that tectonic stress changes the pore structure of different metamorphic and deformed coals, resulting in different Me contents and thus varying methane adsorption. According to the results of the analysis, the adsorption–desorption characteristics of medium- and high-rank TDCs and OSC are the result of the combined effect of the TDC’s unique pore structure and different moisture contents.
Adsorption and Desorption Hysteresis Evaluation Model
In engineering practice, the mining of CBM involves a desorption process. As a result, it is critical to concentrate on the issue of CBM desorption and the concept of desorption hysteresis. Wang et al. proposed a quantitative evaluation index for understanding the effect of absorption hysteresis—improved hysteresis index (IHI value). As shown in Figure 9 and Eq. 11, the adsorption and desorption hysteresis evaluation model can be used to calculate the degree of adsorption and desorption hysteresis quantitatively (Wang et al., 2014; Wang et al., 2016).
where IHI is the improved hysteresis index, dimensionless; Ahy is the measured area of the hysteresis area; Ahf is the ideally completely irreversible hysteresis area; and Asf is the ideally completely irreversible adsorption area. When IHI = 0, adsorption and desorption are completely reversible; when IHI approaches 1, adsorption and desorption tend to be completely irreversible.
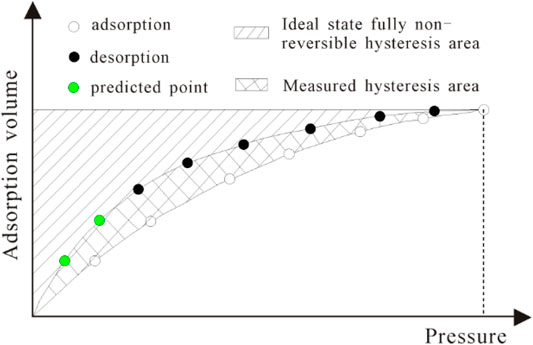
FIGURE 9. Illustration of improved hysteresis index (IHI) (Wang et al., 2016).
In this experiment, the adsorption/desorption isotherm has relatively poor consistency, the adsorption/desorption is irreversible, and there is a desorption hysteresis (Figure 3). According to Eq. 11, the IHI values of eight samples were calculated. At the same time, we calculated the error in Langmuir volume VL solved by adsorption data and desorption data, with results shown in Table 3.
As shown in Table 3, under 30°C equilibrium moisture, the IHI value of fat coal tends to first increase, then decrease, and then increase with the increase of the deformation degree; under 30°C equilibrium moisture, the IHI value of anthracite tends to first increase and then decrease with the increase of deformation degree. The IHI value follows the same relative error change trend as the Langmuir volume VL, which is calculated using adsorption and desorption data. As a result, increasing moisture reduces total adsorption capacity first, while moisture in the coal also hinders methane molecule desorption, resulting in a higher IHI (Wang et al., 2014; Hou et al., 2020; Xu et al., 2021).
The Effect of Pore Structure on the Hysteresis Characteristics of Adsorption and Desorption
Coal contains pore structures of different genesis, sizes, shapes, and connectivity, including pores of different genesis such as primary pores, exogenous pores, metamorphic pores, mineral pores, pores with different pore sizes ranging from super micropores (<2 nm) to macropores (>100 nm), and pores of different shapes such as ink bottle-shaped pores, flat-shaped pores, cylindrical pores, and slit-shaped pores (Song et al., 2020b; Mou et al., 2021). The decrease in external pressure breaks the dynamic balance of adsorption/desorption in CBM wells during pressure reduction and desorption. CH4 adsorbed in macropores and mesopores of the coal matrix is first desorbed, followed by CH4 desorbed in micropores and super micropores due to the concentration difference. Studies have shown that ink bottle-shaped pores have the strongest adsorption capacity against methane, followed by slit plate-shaped pores, cylindrical pores, and wedge-shaped pores (Wu et al., 1991; Ma et al., 2020). “Ink bottle-shaped pores” of the super micropore (<2 nm) segment can be regarded as a combination of a smaller-sized cylindrical pore open at both ends and a spherical pore (Efremov and Fenelonov, 1989; Sang et al., 2005; Song et al., 2017b). Such combination flask pore is likely to exist in large quantities, and the small pore throat (concentrated in the two pore segments of 0.45–0.70 nm and 0.70–0.90 nm) has a great binding capacity against methane, making desorption more difficult.
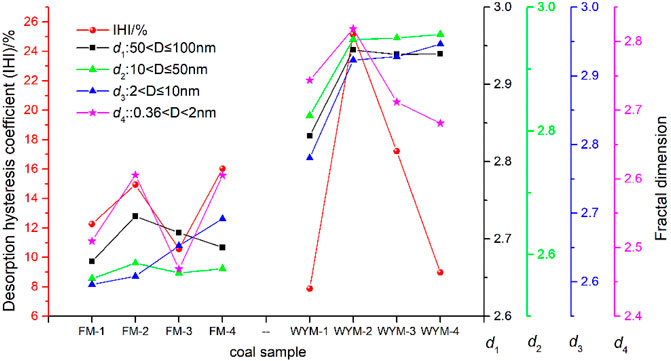
As shown in Figure 10, it can be seen that the IHI value of different types of TDCs and OSC has the same change trend as super micropore (<2 nm) fractal dimension d4, indicating that IHI is closely related to the complexity and irregularity of super micropores. The presence of large quantities of super micropores is the key factor affecting the degree of gas desorption hysteresis. By analyzing the explanation of this phenomenon in different documents and combining the discussion of the experimental results (Ma et al., 2012; Wang et al., 2014; Wang et al., 2016; Pan et al., 2019; He et al., 2020; Xu et al., 2021), it is believed that the key reason for the hysteresis of gas desorption in medium and high-rank coal lies in the “ink-bottle effect”, which specifically includes blockage of pore throat due to various reasons, such as capillary condensation blockage of adsorbed gas (Figure 11A), condensation blockage of water molecules (Figure 11B), impurity blockage (Figure 11C), gas cavitation effect (Figure 11D), adsorption deformation (coal matrix adsorption-induced expansion deformation) (Figure 11E), and pore network effect of the desorption path (Figure 11F). As a result, in addition to increasing the permeability of coal fractures, some novel methods for increasing desorption and diffusion rate at the super micropore scale should be considered for CBM development.
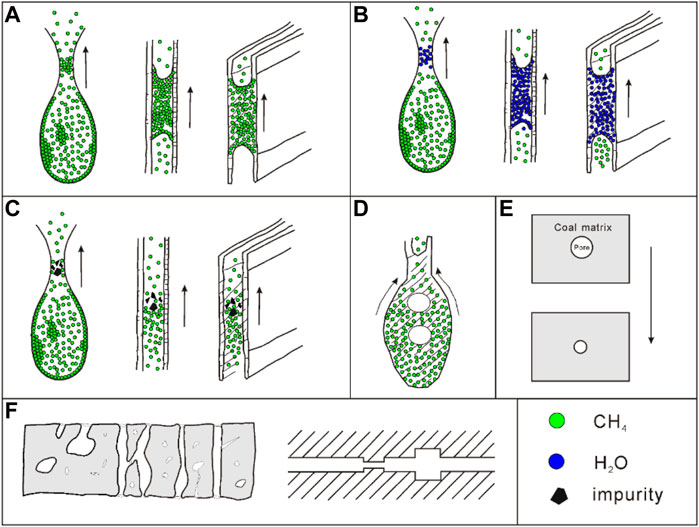
FIGURE 11. Schematic diagram of the mechanism affecting the hysteresis of adsorption and desorption. [Blockage (A-C); Gas cavitation effect (D); Adsorption deformation (E), Pore network effect (F)].
Conclusion
(1) Multi-scale PS analysis of medium- and high-rank fat coal and anthracite shows that the shape of N2/CO2 adsorption isotherm is a combination of type II and IV(a) curves, and the adsorption loop is a combination of type H1 and H4 curves. Super micropores are mainly “combination ink bottle-shaped pores”, which contain a certain number of open pores. As the degree of metamorphism and deformation increases, pores with D > 2 nm have better connectivity, while pores with D < 2 nm have poorer connectivity.
(2) The super micropores occupy the vast majority of PV (54.99%–77.92%) and SSA (94.29%–96.97%), and are more pronounced in the SSA. The micropore SSA and super micropore SSA and TSSA increase with the increase of deformation and metamorphism degree. When D < 2 nm, the PSD curve change presents an “M” bimodal type, mainly concentrated in two pore segments of 0.45–0.70 nm and 0.70–0.90 nm, and there is a reduced effect of metamorphism on the dV/dD and dA/dD of the super micropore, while there is an increased effect of deformation, where ductile deformation exerts a significantly greater effect on super micropores than brittle deformation.
(3) Fractal dimension of anthracite ranges from 2.681 to 2.956, fat coal ranges from 2.469 to 2.729, and the pore complexity and surface roughness increase with the increasing metamorphism degree. The fractal dimension (d3) of micropores increases as the degree of deformation increases. The results show that both brittle and ductile deformation have an impact on pore complexity and surface roughness. Fractal dimension is a comprehensive manifestation of changes in PV, SSA, and PS.
(4) Under Me conditions, Ad-VL does not show a strict positive correlation with super micropore PV and SSA, TPV, and TSSA. The adsorption–desorption characteristics are the result of the combined effect of the TDC’s unique pore structure and different moisture contents. The IHI value has the same change trend as super micropore (<2 nm) fractal dimension d4, which is closely related to the complexity and irregularity of super micropores.
(5) The presence of a large number of super micropores is the most important factor influencing the degree of gas desorption hysteresis. The “ink-bottle effect” has been identified as the primary cause of coal gas desorption hysteresis, which includes pore throat blockage due to a variety of factors [capillary condensation blockage of adsorbed gas, condensation blockage of water molecules, impurity blockage, gas cavitation effect, adsorption deformation (coal matrix adsorption-induced expansion deformation), and pore network effect of the desorption path]. Some novel methods to increase desorption and diffusion rate at the super micropore scale should be considered for the CBM development.
Data Availability Statement
The original contributions presented in the study are included in the article/Supplementary Material, further inquiries can be directed to the corresponding authors.
Author Contributions
JR: Methodology, Visualization, Data Curation, Formal Analysis, Writing—Original Draft, Writing—Review and Editing; HW: Methodology, Data Curation, Formal Analysis; BL: Methodology, Data Curation, Formal Analysis; FC: Data Curation, Formal Analysis; JL: Supervision, Investigation; ZS: Conceptualization, Methodology, Supervision, Funding Acquisition.
Funding
This study was sponsored by the National Natural Science Foundation of China (Nos. 42002185 and 41872169), the National Natural Science Foundation of Henan province (No. 202300410099), the Key Research Project of Higher Education in Henan Province (No. 18A440008), and the Postdoctoral Science Foundation China (No. 2018M642747).
Conflict of Interest
The authors declare that the research was conducted in the absence of any commercial or financial relationships that could be construed as a potential conflict of interest.
Publisher’s Note
All claims expressed in this article are solely those of the authors and do not necessarily represent those of their affiliated organizations, or those of the publisher, the editors, and the reviewers. Any product that may be evaluated in this article, or claim that may be made by its manufacturer, is not guaranteed or endorsed by the publisher.
References
Busch, A., Gensterblum, Y., and Krooss, B. M. (2003). Methane and CO2 Sorption and Desorption Measurements on Dry Argonne Premium Coals: Pure Components and Mixtures. Int. J. Coal Geology. 55 (2), 205–224. doi:10.1016/s0166-5162(03)00113-7
Cheng, Y. P., and Hu, B. (2021). Main Occurrence Form of Methane in Coal: Micropore Filling. J. China Coal Soc. 46 (9), 2933–2948.
Cheng, Y. P., and Lei, Y. (2021). Causality between Tectonic Coal and Coal and Gas Outbursts. J. China Coal Soc. 46 (1), 180–198.
Cheng, Y., and Pan, Z. (2020). Reservoir Properties of Chinese Tectonic Coal: A Review. Fuel 260, 116350. doi:10.1016/j.fuel.2019.116350
Cheng, G., Jiang, B., Li, M., Liu, J., and Li, F. (2020). Effects of Pore Structure on Methane Adsorption Behavior of Ductile Tectonically Deformed Coals: An Inspiration to Coalbed Methane Exploitation in Structurally Complex Area. J. Nat. Gas Sci. Eng. 74, 103083. doi:10.1016/j.jngse.2019.103083
Efremov, D. K., and Fenelonov, V. B. (1989). Adsorption-desorption Hysteresis in Porous Networks. React. Kinet Catal. Lett. 40 (1), 177–183. doi:10.1007/bf02235158
Fu, X. H., Qin, Y., Quan, B., Fan, B. H., and Wang, K. X. (2008). Study of Physical and Numerical Simulations of Adsorption Methane Content on Middle-Rank Coal. Acta Geologica Sinica 82 (10), 1368–1371.
Gao, Z., Ma, D., Chen, Y., Zheng, C., and Teng, J. (2020). Study for the Effect of Temperature on Methane Desorption Based on Thermodynamics and Kinetics. ACS omega 6 (1), 702–714. doi:10.1021/acsomega.0c05236
Guo, X., Huan, X., and Huan, H. (2017). Structural Characteristics of Deformed Coals with Different Deformation Degrees and Their Effects on Gas Adsorption. Energy Fuels 31 (12), 13374–13381. doi:10.1021/acs.energyfuels.7b02515
Guo, D. Y., Guo, X. J., and Li, D. Q. (2019). Effects of Tectonic Deformation on Micropore-Mesopore of Bituminous Deformed Coal. J. China Coal Soc. 44 (10), 3135–3144.
He, X., Cheng, Y., Hu, B., Wang, Z., Wang, C., Yi, M., et al. (2020). Effects of Coal Pore Structure on Methane‐coal Sorption Hysteresis: An Experimental Investigation Based on Fractal Analysis and Hysteresis Evaluation. Fuel 269, 117438. doi:10.1016/j.fuel.2020.117438
Hou, Q., Li, H., Fan, J., Ju, Y., Wang, T., Li, X., et al. (2012). Structure and Coalbed Methane Occurrence in Tectonically Deformed Coals. Sci. China Earth Sci. 55 (11), 1755–1763. doi:10.1007/s11430-012-4493-1
Hou, Q., Han, Y., Wang, J., Dong, Y., and Pan, J. (2017). The Impacts of Stress on the Chemical Structure of Coals: a Mini-Review Based on the Recent Development of Mechanochemistry. Sci. Bull. 62 (13), 965–970. doi:10.1016/j.scib.2017.06.004
Hou, X., Liu, S., Zhu, Y., and Yang, Y. (2020). Experimental and Theoretical Investigation on Sorption Kinetics and Hysteresis of Nitrogen, Methane, and Carbon Dioxide in Coals. Fuel 268, 117349. doi:10.1016/j.fuel.2020.117349
Hu, B., Cheng, Y., He, X., Wang, Z., Jiang, Z., Wang, C., et al. (2020). New Insights into the CH4 Adsorption Capacity of Coal Based on Microscopic Pore Properties. Fuel 262, 116675. doi:10.1016/j.fuel.2019.116675
Jaroniec, M., Lu, X., Madey, R., and Choma, J. (1990). Evaluation of Structural Heterogeneities and Surface Irregularities of Microporous Solids. Mater. Chem. Phys. 26 (1), 87–97. doi:10.1016/0254-0584(90)90049-g
Jaroniec, M., Gilpin, R. K., and Choma, J. (1993). Correlation between Microporosity and Fractal Dimension of Active Carbons. Carbon 31 (2), 325–331. doi:10.1016/0008-6223(93)90037-b
Jiang, B., Qu, Z. H., Wang, G. G., and Li, M. (2010). Effects of Structural Deformation on Formation of Coalbed Methane Reservoirs in Huaibei coalfield, China. Int. J. Coal Geology. 82 (3-4), 175–183. doi:10.1016/j.coal.2009.12.011
Jiang, W. P., Song, X. Z., and Zhong, L. W. (2011). Research on the Pore Properties of Different Coal Body Structure Coals and the Effects on Gas Outburst Based on the Low-Temperature Nitrogen Adsorption Method. J. China Coal Soc. 36 (4), 609–614.
Ju, Y. W., Jiang, B., Hou, Q. L., and Wang, G. L. (2004). The New Structure-Genetic Classification System in Tectonically Deformed Coals and its Geological Significance. J. China Coal Soc. 29 (5), 513–517.
Krooss, B. M., van Bergen, F., Gensterblum, Y., Siemons, N., Pagnier, H. J. M., and David, P. (2002). High-pressure Methane and Carbon Dioxide Adsorption on Dry and Moisture-Equilibrated Pennsylvanian Coals. Int. J. Coal Geology. 51 (2), 69–92. doi:10.1016/s0166-5162(02)00078-2
Li, W., Liu, H., and Song, X. (2015). Multifractal Analysis of Hg Pore Size Distributions of Tectonically Deformed Coals. Int. J. Coal Geology. 144-145, 138–152. doi:10.1016/j.coal.2015.04.011
Li, F. L., Jiang, B., Song, Y., and Tang, Z. (2017). Nano Scale Pore Structure and Fractal Characteristics of Low-Medium Metamorphic Tectonically Deformed Coal. Nat. Gas Geosci. 28 (1), 173–182.
Li, Y., Zhang, Y. G., Zhang, L., and Hou, J. L. (2019a). Characterization on Pore Structure of Tectonic Coals Based on the Method of Mercury Intrusion, Carbon Dioxide Adsorption and Nitrogen Adsorption. J. China Coal Soc. 44 (4), 1188–1196.
Li, Z., Liu, D., Cai, Y., Wang, Y., and Teng, J. (2019b). Adsorption Pore Structure and its Fractal Characteristics of Coals by N2 Adsorption/desorption and FESEM Image Analyses. Fuel 257, 116031. doi:10.1016/j.fuel.2019.116031
Li, L., Liu, D., Cai, Y., Wang, Y., and Jia, Q. (2020). Coal Structure and its Implications for Coalbed Methane Exploitation: A Review. Energy Fuels 35 (1), 86–110. doi:10.1021/acs.energyfuels.0c03309
Lin, Y. B., Jia, X. M., and Ma, D. M. (2016). Research on CBM Desorption Hysteresis Effects and its Evaluation Methods. Coal Sci. Technology 44 (S1), 160–163.
Liu, D., Zou, Z., Cai, Y., Qiu, Y., Zhou, Y., and He, S. (2021). An Updated Study on CH4 Isothermal Adsorption and Isosteric Adsorption Heat Behaviors of Variable Rank Coals. J. Nat. Gas Sci. Eng. 89, 103899. doi:10.1016/j.jngse.2021.103899
Ma, D. M., Ma, W., and Lin, Y. B. (2012). Desorption Hysteresis Characteristics of CBM. J. China Coal Soc. 37 (11), 1885–1889.
Ma, D. M., Gao, Z., Chen, Y., Zhang, H., Shao, K., Zhang, Z. C., et al. (2020). Differences in Methane Adsorption and Desorption Characteristics of Low, Medium and High Rank Coal Reservoirs at Different Temperatures. Reservoir Eval. Development 10 (4), 17–24.
Meng, Z. P., Liu, S. S., Wang, B. Y., Tian, Y. D., and Wu, J. (2015). Adsorption Capacity and its Pore Structure of Coals with Different Coal Body Structure. J. China Coal Soc. 40 (8), 1865–1870.
Mou, P., Pan, J., Niu, Q., Wang, Z., Li, Y., and Song, D. (2021). Coal Pores: Methods, Types, and Characteristics. Energy Fuels 35 (9), 7467–7484. doi:10.1021/acs.energyfuels.1c00344
Nie, B., Liu, X., Yang, L., Meng, J., and Li, X. (2015). Pore Structure Characterization of Different Rank Coals Using Gas Adsorption and Scanning Electron Microscopy. Fuel 158, 908–917. doi:10.1016/j.fuel.2015.06.050
Niu, Q., Pan, J., Cao, L., Ji, Z., Wang, H., Wang, K., et al. (2017). The Evolution and Formation Mechanisms of Closed Pores in Coal. Fuel 200 (15), 555–563. doi:10.1016/j.fuel.2017.03.084
Niu, Q., Pan, J., Jin, Y., Wang, H., Li, M., Ji, Z., et al. (2019). Fractal Study of Adsorption-Pores in Pulverized Coals with Various Metamorphism Degrees Using N2 Adsorption, X-ray Scattering and Image Analysis Methods. J. Pet. Sci. Eng. 176, 584–593. doi:10.1016/j.petrol.2019.01.107
Pajdak, A., Kudasik, M., Skoczylas, N., Wierzbicki, M., and Teixeira Palla Braga, L. (2019). Studies on the Competitive Sorption of CO2 and CH4 on Hard Coal. Int. J. Greenhouse Gas Control. 90, 102789. doi:10.1016/j.ijggc.2019.102789
Pan, J., Wang, S., Ju, Y., Hou, Q., Niu, Q., Wang, K., et al. (2015). Quantitative Study of the Macromolecular Structures of Tectonically Deformed Coal Using High-Resolution Transmission Electron Microscopy. J. Nat. Gas Sci. Eng. 27, 1852–1862. doi:10.1016/j.jngse.2015.11.012
Pan, J., Lv, M., Hou, Q., Han, Y., and Wang, K. (2019). Coal Microcrystalline Structural Changes Related to Methane Adsorption/desorption. Fuel 239, 13–23. doi:10.1016/j.fuel.2018.10.155
Qin, Y., Song, Q. Y., and Fu, X. H. (2005). Discussion on Reliability for Co-mining the Coalbed Gas and normal Petroleum and Natural Gas: Adsorption Effect of Deep Coal Reservoir under the Condition of Balanced Water. Nat. Gas Geosci. 16 (4), 492–498.
Qin, Y., Moore, T. A., Shen, J., Yang, Z. B., Shen, Y. L., and Wang, G. (2018). Resources and Geology of Coalbed Methane in China: a Review. Int. Geology. Rev. 60 (5-6), 777–812. doi:10.1080/00206814.2017.1408034
Sang, S. X., Zhu, Y. M., Zhang, S. Y., Zhang, J., and Tang, J. X. (2005). Solid-gas Interaction Mechanism of Coal-Adsorbed Gas (Ⅰ): Coal Pore Structure and Solid-Gas Interaction. Nat. Gas Industry 25 (1), 13–15.
Song, Z. M., Liu, G. F., Yang, X. N., and Zhang, Z. X. (2012). Adsorption-desorption Characteristic on Deformed Coal under the Conditions of High Temperature and Pressure and Equilibrium Water. J. Mining Saf. Eng. 29 (4), 591–595.
Song, Y., Jiang, B., Li, F. L., and Liu, J. G. (2017a). Structure and Fractal Characteristic of Micro- and Meso-Pores in Low, Middle-Rank Tectonic Deformed Coals by CO2 and N2 Adsorption. Microporous Mesoporous Mater. 253, 191–202.
Song, Y., Jiang, B., and Liu, J. G. (2017b). Nanopore Structural Characteristics and Their Impact on Methane Adsorption and Diffusion in Low to Medium Tectonically Deformed Coals: Case Study in the Huaibei Coal Field. Energy & Fuels 31 (7), 6711–6723.
Song, D., Ji, X., Li, Y., Zhao, H., Song, B., and He, K. (2020a). Heterogeneous Development of Micropores in Medium-High Rank Coal and its Relationship with Adsorption Capacity. Int. J. Coal Geology. 226, 103497. doi:10.1016/j.coal.2020.103497
Song, Y., Jiang, B., Li, M., Hou, C. L., and Xu, S. C. (2020b). A Review on Pore-Fractures in Tectonically Deformed Coals. Fuel 278, 118248.
Stoeckli, H. F., Ballerini, L., and De Bernardini, S. (1989). On the Evolution of Micropore Widths and Areas in the Course of Activation. Carbon 27 (3), 501–502. doi:10.1016/0008-6223(89)90088-2
Thommes, M., Kaneko, K., Neimark, A. V., Olivier, J. P., Rodriguez-Reinoso, F., Rouquerol, J., et al. (2015). Physisorption of Gases, with Special Reference to the Evaluation of Surface Area and Pore Size Distribution (IUPAC Technical Report). Pure Appl. Chem. 87 (9-10), 1051–1069. doi:10.1515/pac-2014-1117
Wang, C. X., and Li, S. G. (2016). Pore Structure Characteristics and its Influence on Gas Desorption of Low Rank Coal. J. Xi’an Univ. Sci. Technology 36 (3), 308–314.
Wang, K., Wang, G., Ren, T., and Cheng, Y. (2014). Methane and CO2 Sorption Hysteresis on Coal: A Critical Review. Int. J. Coal Geology. 132, 60–80. doi:10.1016/j.coal.2014.08.004
Wang, G. D., Ren, T. X., Qi, Q. X., Wang, K., and Zhang, L. (2016). Mechanism of Adsorption-Desorption Hysteresis and its Influence on Deep CBM Recovery. J. China Coal Soc. 41 (1), 49–56.
Wang, K., Pan, J., Wang, E., Hou, Q., Yang, Y., and Wang, X. (2020a). Potential Impact of CO2 Injection into Coal Matrix in Molecular Terms. Chem. Eng. J. 401, 126071. doi:10.1016/j.cej.2020.126071
Wang, X., Zhang, D., Su, E., Jiang, Z., Wang, C., Chu, Y., et al. (2020b). Pore Structure and Diffusion Characteristics of Intact and Tectonic Coals: Implications for Selection of CO2 Geological Sequestration Site. J. Nat. Gas Sci. Eng. 81, 103388. doi:10.1016/j.jngse.2020.103388
Wang, Z., Fu, X., Deng, Z., and Pan, J. (2021a). Investigation of Adsorption-Desorption, Induced Strains and Permeability Evolution during N2-ECBM Recovery. Nat. Resour. Res. 30, 3717–3734. doi:10.1007/s11053-021-09884-8
Wang, Z., Fu, X., Hao, M., Li, G., Pan, J., Niu, Q., et al. (2021b). Experimental Insights into the Adsorption-Desorption of CH4/N2 and Induced Strain for Medium-Rank Coals. J. Pet. Sci. Eng. 204, 108705. doi:10.1016/j.petrol.2021.108705
Wu, J., Jin, K. L., Tong, Y. D., and Qian, R. D. (1991). Theory of Coal Pores and its Application in Evaluation of Gas Outburst Proneness and Gas Drainage. J. China Coal Soc. 16 (3), 86–95.
Xu, W., Li, J., Wu, X., Liu, D., and Wang, Z. (2021). Desorption Hysteresis of Coalbed Methane and its Controlling Factors: a Brief Review. Front. Earth Sci. 15 (2), 224–236. doi:10.1007/s11707-021-0910-0
Yan, J., Meng, Z., and Li, G. (2021). Diffusion Characteristics of Methane in Various Rank Coals and the Control Mechanism. Fuel 283, 118959. doi:10.1016/j.fuel.2020.118959
Zhang, R., and Liu, S. (2017). Experimental and Theoretical Characterization of Methane and CO2 Sorption Hysteresis in Coals Based on Langmuir Desorption. Int. J. Coal Geology. 171, 49–60. doi:10.1016/j.coal.2016.12.007
Zhang, S., Tang, S., Qian, Z., Pan, Z., and Guo, Q. (2014a). Evaluation of Geological Features for Deep Coalbed Methane Reservoirs in the Dacheng Salient, Jizhong Depression, China. Int. J. Coal Geology. 133, 60–71. doi:10.1016/j.coal.2014.09.002
Zhang, X. H., Yao, H. F., Li, W., Wang, X. J., and Yan, J. W. (2014b). Fractal Characteristics of Nano-Pore Structure in Tectonically Deformed Coals in Hancheng Mining Area. Coal Geology. Exploration 42 (5), 4–8.
Keywords: tectonically deformed coal, low-pressure CO2 adsorption, pore structure, adsorption/desorption hysteresis, ink-bottle effect
Citation: Ren J, Weng H, Li B, Chen F, Liu J and Song Z (2022) The Influence Mechanism of Pore Structure of Tectonically Deformed Coal on the Adsorption and Desorption Hysteresis. Front. Earth Sci. 10:841353. doi: 10.3389/feart.2022.841353
Received: 22 December 2021; Accepted: 17 January 2022;
Published: 18 February 2022.
Edited by:
Jienan Pan, Henan Polytechnic University, ChinaReviewed by:
Zhenzhi Wang, China University of Mining and Technology, ChinaHaichao Wang, Xinjiang University, China
Copyright © 2022 Ren, Weng, Li, Chen, Liu and Song. This is an open-access article distributed under the terms of the Creative Commons Attribution License (CC BY). The use, distribution or reproduction in other forums is permitted, provided the original author(s) and the copyright owner(s) are credited and that the original publication in this journal is cited, in accordance with accepted academic practice. No use, distribution or reproduction is permitted which does not comply with these terms.
*Correspondence: Jiangang Ren, cmVuamlhbmdhbmcyMDA1QDEyNi5jb20=; Zhimin Song, c29uZ3poaW1pbjE5NjFAaG90bWFpbC5jb20=
 Jiangang Ren
 Hongbo Weng1
 Feng Chen
