- Geology Department, Portland State University, Portland, OR, United States
The 7.1 Ma Rattlesnake Tuff (RST) of eastern Oregon is a widespread and voluminous (>300 km3) ignimbrite composed of 99% crystal poor (≤1%) high-silica rhyolite (HSR) and <1% dacites. Basaltic andesitic to basaltic inclusions within dacites are samples of underpinned mafic magmas. The RST HSR is comprised of five increasingly evolved compositional Groups (E–A), and HSR pumices range from white to dark grey, often co-mingled in spectacular banded pumices. Previously, Groups were interpreted as rhyolites generated by crystal fractionation within a single reservoir, where more evolved rhyolite melts formed from relatively less evolved rhyolite parents. To reassess compositional HSR Groups and their implications for tapping a single or multiple rhyolite reservoirs as well as reevaluating the petrological relationships among groups, we focus on large banded pumices for geochemical analysis. Statistical analysis of existing and new data verified these five compositional Groups and gaps, best characterized by variations in Ba, Eu/Eu*, Eu, FeO*, Hf, and Zr. Wet-liquidus temperatures, storage temperatures, and storage pressures calculated for all HSR Groups indicate similar pre-eruptive conditions (∼6.1–7.5 km depth; storage temperatures of ∼805–895°C). Differentiation trends, trends in storage pressure and temperature, and lack of crystal-rich tuff or country rock corroborate existing models for HSRs that involve a single, density-stratified magma reservoir prior eruption. Density differences are sufficient to prevent convection between layers of HSRs in a single reservoir when water content increases from 2–4 wt% from Groups E–A. However, if HSRs do not represent a liquid line, it is possible to generate HSRs through batch melting of various regional country rock. Yet, HSRs would still accumulate within the same storage zone, where density variations kept HSRs from mixing until eruption when these banded pumices formed. In either scenario, our study underscores the significance of water content and density variations for accumulating rhyolite magmas in a contiguous magma body without mixing. This has implications for other compositionally heterogenous rhyolitic ignimbrites where natural samples do not provide comparable evidence to argue for pre-eruptive confocal storage of different rhyolite magmas as is the case for the Rattlesnake Tuff.
1 Introduction
Studying the violent, explosive caldera eruptions within bimodal volcanic provinces provides valuable insight into the complex magma plumbing systems involved. Debate and discussion continues around the magmatic and tectonic processes responsible for generating both the mafic and silicic volcanism of the 12–0 Ma High Lava Plains (HLP) in eastern Oregon, with the peculiar northwest-younging trend of rhyolite volcanism being a topic of several recent studies. Generally, the primary factor of debate among proposed models for HLP volcanism is whether it is associated with a deep-sourced mantle plume (e.g., Jordan et al., 2004; Camp, 2019), or whether it is more upper-mantle or tectonics driven phenomena (e.g., Ford et al., 2013; Hawley et al., 2019). Others have proposed models that ascribe HLP volcanism to a combination of both aforementioned processes (e.g., Swenton and Streck, in press, 2022). In any case, detailed analyses of caldera eruptions within bimodal provinces like the HLP has provided valuable insight into the intricacies of the convoluted magmatic plumbing systems and the production of voluminous, compositionally heterogeneous rhyolites (e.g., Isom, 2017; Sales, 2018). The 7.05 ± 0.1 Ma (Streck and Grunder, 1995; Jordan et al., 2004) Rattlesnake Tuff (RST) is one of the three voluminous and widespread ignimbrites that erupted in Oregon after 12 Ma, and it is included within the HLP silicic volcanic trend. The spectacularly banded high-silica rhyolite (HSR) pumices of the RST provide rare and valuable insight into the pre-eruptive magma configuration and co-eruptive processes that created the RST. Understanding the multifaceted petrogenetic processes responsible for generating significant compositional heterogeneity among the RST can be applied to other heterogeneous rhyolitic ignimbrites across the HLP and other bimodal provinces worldwide.
Streck and Grunder (2008) compiled geochemical data from MacLean (1994), Streck and Grunder (1997; 1999), Johnson and Grunder (2000), and Jordan, (2002) and determined that of the 286 rocks analyzed, at least 93% were of either mafic or felsic composition, the other 7% intermediates. Regional basalts in and around the HLP that erupted after 15.0 Ma west of the 0.706 Sr isopleth were grouped as high-aluminum olivine tholeiites (HAOTs), containing higher Ni, higher Mg numbers, and lower concentrations of incompatible elements compared to Snake River Plain olivine tholeiites (SROTs) east of the 0.706 Sr isopleth (Hart et al., 1984). The 87Sr/86Sr isopleth is interpreted as representing the boundary between accreted terrane and the North American craton (e.g., Pierce et al., 2002). The ∼13.9–13.1 Ma (Lees, 1994; Hooper et al., 2002; Camp et al., 2003; Camp and Ross, 2004) Tims Peak Basalts are considered the oldest known HAOTs. HAOTs have been described as younging westward towards the Cascade Volcanic Arc and Newberry volcano (<4 Ma) (Hart et al., 1984; Christiansen et al., 2002; Camp and Ross, 2004), but Trench et al. (2012; 2013) explain that mafic volcanism has been episodic but continuous (no discernable age progression) across the entire HLP since 8 Ma. Conversely, silicic volcanism within the HLP province displays a northwest-younging age progression (e.g., Walker, 1974; MacLeod et al., 1976; McKee and Walker, 1976; Jordan et al., 2004; Ford et al., 2013) paralleling the northwest trending Brothers Fault Zone (Jordan, 2002; Jordan et al., 2004) and mirroring the northeast-younging trend of adjacent Yellowstone–Snake River Plain (YSRP) silicic volcanism. Some of the oldest rhyolite centers in the easternmost HLP trend include the rhyolites of Iron Point (11.85 ± 0.06 Ma), Sacramento Butte (11.84 ± 0.06 Ma), and Visher Creek (11.46 ± 0.02 Ma) (Swenton and Streck, in press, 2022). It has recently been discovered that <∼12 Ma HLP silicic volcanism is composed of two distinct eruptive episodes (12.1–9.6 Ma and 9.0–5.1 Ma), and eruption of the RST occurred within the later eruptive episode (Swenton and Streck, in press, 2022).
The RST is a widespread, variably welded ignimbrite sheet with an estimated eruption volume of ∼300 km3 (DRE) which does not include any intra-caldera tuff or fallout deposits (Figure 1) (Streck and Grunder, 1995). The caldera source for the RST is not structurally exposed but is inferred to be from an ∼20 km diameter caldera that is now Capehart Lake within the western Harney Basin (Streck and Grunder, 1995). Tuff exposure thicknesses are mostly uniform (15–30 m) within the eastern HLP province and north into the Blue Mountains province (Streck and Grunder, 1995). Present day exposures of the RST span semicontinuously over 9,250 km2, but original eruptive coverage estimates are a minimum of 35,000 km2 (Streck and Grunder, 1995). It should be noted that recent mapping of newly discovered outcrops of the RST extend the original distribution significantly towards the NE and, thus, all distribution and volume estimated need to be updated. The minimal variation in unit thickness is attributed to lack of significant topographic relief at the time of eruption and very energetic eruptions leading to a low aspect ratio (low average thickness over a wide areal extent) ignimbrite (Streck and Grunder, 1995).
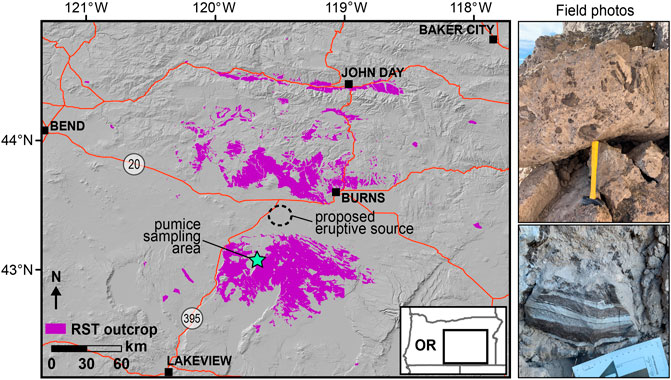
FIGURE 1. Map showing extent of known outcrops of the Rattlesnake Tuff (RST) in eastern Oregon and sampled pumices in situ. Banded pumices can be found throughout the RST, but the sampling area for this study is a location where the pumices are large and most abundant. Mapping compilation is from the Oregon Department of Geology and Mineral Industries (DOGAMI), Streck and Grunder (1995), Isom and Streck (2016), Isom (2017), Cruz and Streck (2017), and more recent mapping from EdMap projects completed by Rachel Sweeten, while affiliated with Portland State University, Portland, OR. New outcrops found by Streck are also included. Proposed source for the RST is from Streck and Grunder (1995). Highways 20 and 395 are labeled.
The RST is a crystal poor rhyolite comprised of pumices and glass shards (Streck and Grunder, 1997). Over 99% of the RST is high-silica rhyolite (HSR; >75 wt% SiO2), with sparse (<1%) dacite pumices and <<0.1% basaltic inclusions (Streck and Grunder, 1995) (Figure 2). The tuff is one cooling unit that ranges from non-welded to densely-welded, with tuff displaying rheomorphic flow features within 40–60 km of the inferred eruptive source (Streck and Grunder, 1995). Streck and Grunder (1997) analyzed primarily non-banded rhyolite pumices and glass shards and determined that the RST is comprised of five distinct high-silica rhyolites. The five groups (A, B, C, D, and E) become increasingly evolved, where E is the least evolved and A is the most evolved with respect to parameters such as silica content, incompatible trace element concentrations, and parameters of feldspar fractionation. These metaluminous to borderline peralkaline HSRs are distinguished by variations in Fe, Ti, LREE, Ba, Eu, Rb, Zr, Hf, Ta, and (Streck and Grunder, 1997). Streck and Grunder (1997) interpreted these groups to represent five distinct rhyolites, four of which were generated by crystal fractionation occurring at the magma chamber roof and walls, where these processes caused a series of more evolved rhyolite melts to form from relatively less evolved rhyolite parents within the magma chamber, resulting in a density and compositionally zoned magma chamber and the compositional clustering observed in rhyolites. Furthermore, the least evolved of the rhyolites was thought to be the product of partial melting of a mafic protolith with high Ba/Rb ratio (Streck, 2002). Homogeneous and banded pumices range from more evolved and aphyric to less evolved with ∼1% alkali feldspar, Fe-rich clinopyroxene, titanomagnetite, ± quartz and fayalite phenocrysts, and the trace phases apatite, zircon, and chevkinite (Streck and Grunder, 1997; 1999). Based on mafic mineral assemblages, oxygen fugacity is at QFM, and oxidation conditions increase from Group E to Group A (Streck and Grunder, 1997).
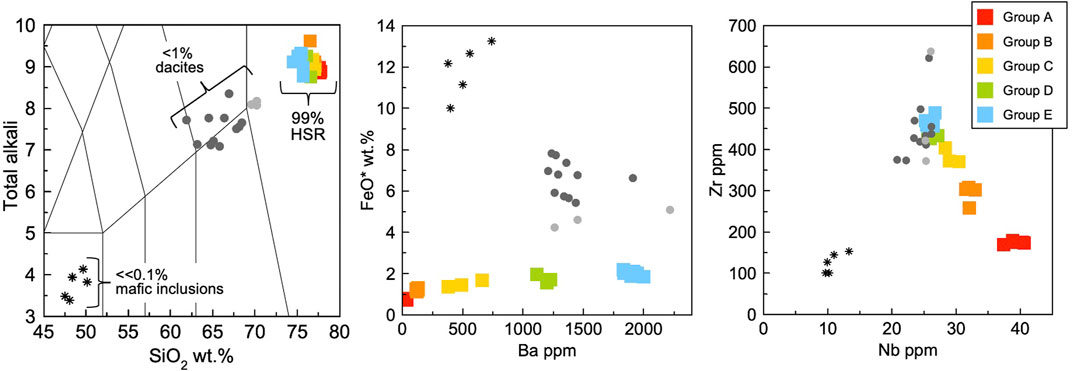
FIGURE 2. Original Rattlesnake Tuff (RST) high-silica rhyolite (HSR), dacite pumices (that are variably banded), and mafic inclusions from Streck and Grunder (1997, 1999). The RST is comprised of 99% HSR, <1% variably dacite pumices, and <<0.1% mafic, basaltic and basaltic-andesitic inclusions found within the dacites.
Streck and Grunder (2008) build upon the model they previously proposed by assessing petrogenetic processes responsible for generating crystal-poor rhyolites in bimodal provinces like the HLP, and they found that rather than these rhyolites being derived from granodioritic mush as other studies may suggest (i.e., Bachmann and Bergantz, 2004; Hildreth, 2004), their compositional diversity can be explained by subtle variations in crustal composition and degrees of partial melting of the mafic crust from which the least evolved rhyolites were derived.
The subalkaline to mildly alkalic dacite pumices are primarily banded, vitric, and black, with varying amounts of high-silica rhyolite bands throughout (Streck and Grunder, 1999; 2008). Basaltic inclusions <3 cm in length are found almost exclusively within the dacite pumices and dacite bands within rhyolite pumices (Streck and Grunder, 1999). The three types of basaltic inclusions (crystal-poor, crystal-rich, and cumulus) are determined to be co-magmatic because 1) the ellipsoidal shape and quenched rinds indicating they were liquid when incorporated, 2) mingling textures with the host pumice, 3) the presence of plagioclase phenocrysts with quenched textures in a glassy groundmass, and 4) the basaltic inclusions being compositionally, texturally, and mineralogically similar, indicating they are magmatically related (Streck and Grunder, 1999). Evidence of a petrogenetic history involving protracted crystal fractionation and cyclic recharge was recorded in the crystal-rich basaltic inclusions (Streck and Grunder, 1999). The geochemistry of the basaltic inclusions within the RST homogeneous dacite pumices indicates they are too enriched in incompatible elements to be incorporated HAOT basalt. Rather, the underpinning of primitive HAOT magma and subsequent periods of crystal fractionation, mafic recharge, and some rhyolite magma assimilation produced an enriched basaltic andesite ponded beneath the rhyolite reservoir (Streck and Grunder, 1999). Dacite pumices are a result of disturbing the density boundary between the rhyolites and the basaltic andesites during eruption of the RST (Streck and Grunder, 1999). Streck and Grunder (1999) found that equilibrium phenocrysts in the dacite pumices were rare, suggesting that the basaltic andesite and rhyolite mixing was shortly prior to eruption. Streck and Grunder (1997) focused their investigation on the non-banded (homogeneous) dacite pumices, and such a detailed geochemical, mineralogical, and petrological study had not yet been performed on the banded HSR pumices of the RST.
Globally, rhyolites exist that are comprised of multiple cooling units of notably different compositions or of one unit that possesses a compositional gradient. Modeling the intricate magma plumbing systems responsible for generating these rhyolites has been a popular topic of recent research. Several studies relate compositional complexities to the tapping of multiple separate and distinct melt lenses throughout the duration of rhyolite eruption (e.g., Shane et al., 2008; Ellis and Wolff, 2012; Cooper et al., 2012; 2016; Bégué et al., 2014), while others attribute compositional heterogeneities to a single, large magma reservoir that may contain large-scale internal zoning (e.g., Streck and Grunder, 1997; Hildreth and Wilson, 2007; Ukstins Peate et al., 2008; Gregg et al., 2012, 2015; Caricchi et al., 2014) or crystal-rich and crystal-poor melt lenses (e.g., Cashman and Giordano, 2014; Szynamowski et al., 2019). The RST is an example of one of these voluminous, compositionally heterogeneous rhyolites that has been the subject of several studies, but there was insufficient data to make definitive statements on its pre-eruptive magma configurations. Previous studies have focused on homogeneous HSR pumices, and the significantly low crystallinity of the HSRs had made certain detailed geochemical analyses on phenocrysts difficult, if not impossible. However, in this study, we provide new pre-eruptive insights by conducting detailed analyses on the strikingly banded HSR pumices. These banded pumices contain at least two of the distinct HSR magmas, constituting them as physical evidence of the pre-eruptive magma mingling, and thus provide substantial additional insight into the complexities of large silicic magma reservoirs and the production of voluminous, compositionally heterogeneous rhyolites. We contribute critical evidence to support or negate preexisting models of RST HSR petrogenesis that either involve a single, zoned, large silicic magma reservoir or the tapping of multiple, distinct silicic magma batches, which can be used as a case study in deciphering complex HSR magma systems around the world, especially those in bimodal systems.
2 Materials and Methods
2.1 Collecting High-Silica Rhyolite Pumices
Large (greater than ∼20 cm) banded HSR pumices with at least two visibly different bands were the targets when collecting pumice samples for analysis. An outcrop ∼21 km E of the junction of Highway 395 and ∼85 km SSW of Burns, OR, hosts an abundance of glassy, relatively fresh banded HSR pumices (Figure 1). This location is close to (<60 km away from) the approximated eruptive center. Few other outcrops of RST are known to contain such large, fresh, and glassy banded pumices, so we exclusively sampled this outcrop.
Fifteen banded pumices were collected based on size, visible variation in color of bands, and width of bands. Pumices with wider bands were preferred for easier separation, though pumices with mm-sized, multicolored bands were common. Banded pumices ranged in their appearance from having multiple shades of light grey to white, multiple shades of medium grey, shades of dark grey and light grey, or several different shades of grey. Two homogeneous white pumices of different textures were also collected for analysis to compare to data from previous studies. The largest unbanded and banded pumices of glassy RST are on the order of 1 m in size. A granitic lithic fragment found within the outcrop of RST in the sample area and obsidian from a pristine densely welded vitrophyre from the area near the Silver Creek location described by Streck and Grunder (1995) was also included for bulk rock analysis.
2.2 Geochemical Analysis of Banded and Homogeneous Pumices
All 17 pumices were lightly crushed, and the largest bands in the banded pumices were separated based on visible differences in color and possibly texture as compared to surrounding bands. A numbering system was implemented to keep track of different bands of the same sample. A decimal and a number were placed after each original sample ID, where “.1” was considered the lightest appearing band, and each darker band received an increasing number after the decimal. For example, there were three band separates analyzed for sample VS20-122H, so the lightest grey material was given the sample ID of VS20-122H.1, the medium grey material was VS20-122H.2, and the darkest grey material of that sample was labeled VS20-122H.3. Samples were analyzed for ten major and minor element concentrations and 17 trace elements in parts per million (ppm) at Washington State University’s (WSU) Geoanalytical Laboratory. Each sample was powdered at WSU using a low trace element tungsten carbide shatterbox. Powdered forms of each sample are placed in a high temperature oven to vaporize any organic or secondary volatile contents (unrelated to magmatic volatile content) in each sample and to produce a ‘dry’ powder. The percent loss on ignition (LOI) is the weight percent of these volatiles removed during this process. Lower LOI values generally equate to lower secondary water content and thus to data that are more representative of the original composition at the time of emplacement. Major, minor, and some trace element concentrations were measured using WSU’s ThermoARL X-ray fluorescence (XRF) spectrometer using methods described in Johnson et al. (1999). More trace element compositions were determined using WSU’s Inductively coupled plasma-mass spectrometer (ICP-MS).
2.3 Recalculating Geochemical Data on Pumices From Previous Studies
Streck and Grunder (1997) gathered compositional data from RST HSR pumices using XRF and Instrumental Neutron Activation Analysis (INAA). Five pumices analyzed in Streck and Grunder (1997) were reanalyzed again in this study as a measure of comparison. When plotting results from this study with geochemical data from Streck and Grunder (1997) of the same samples, several elements displayed noticeable offsets. When comparing Nb, Pb, Rb, Sr, and Zr, it is preferred to compare old XRF values to new ICP-MS values, because the INAA method cannot be used for analyzing such elements or lead to much lower precision as compared to elemental concentrations determined by XRF. Percent differences were calculated for all measured elements and oxides where possible. Those with a percent different greater than ∼5% were deemed candidates for recalculation, except when the measured concentrations were <0.05 wt% for oxides or <6 ppm for minor and trace elements (Table 1). Zr, Nb, Pb, and Sr XRF, as well as Ce INAA values from Streck and Grunder (1997) were plotted against new data from this study, and linear regression lines were calculated. The equation from each individual regression line was used to recalculate the old XRF or INAA data for that particular element (Supplementary Appendix A).
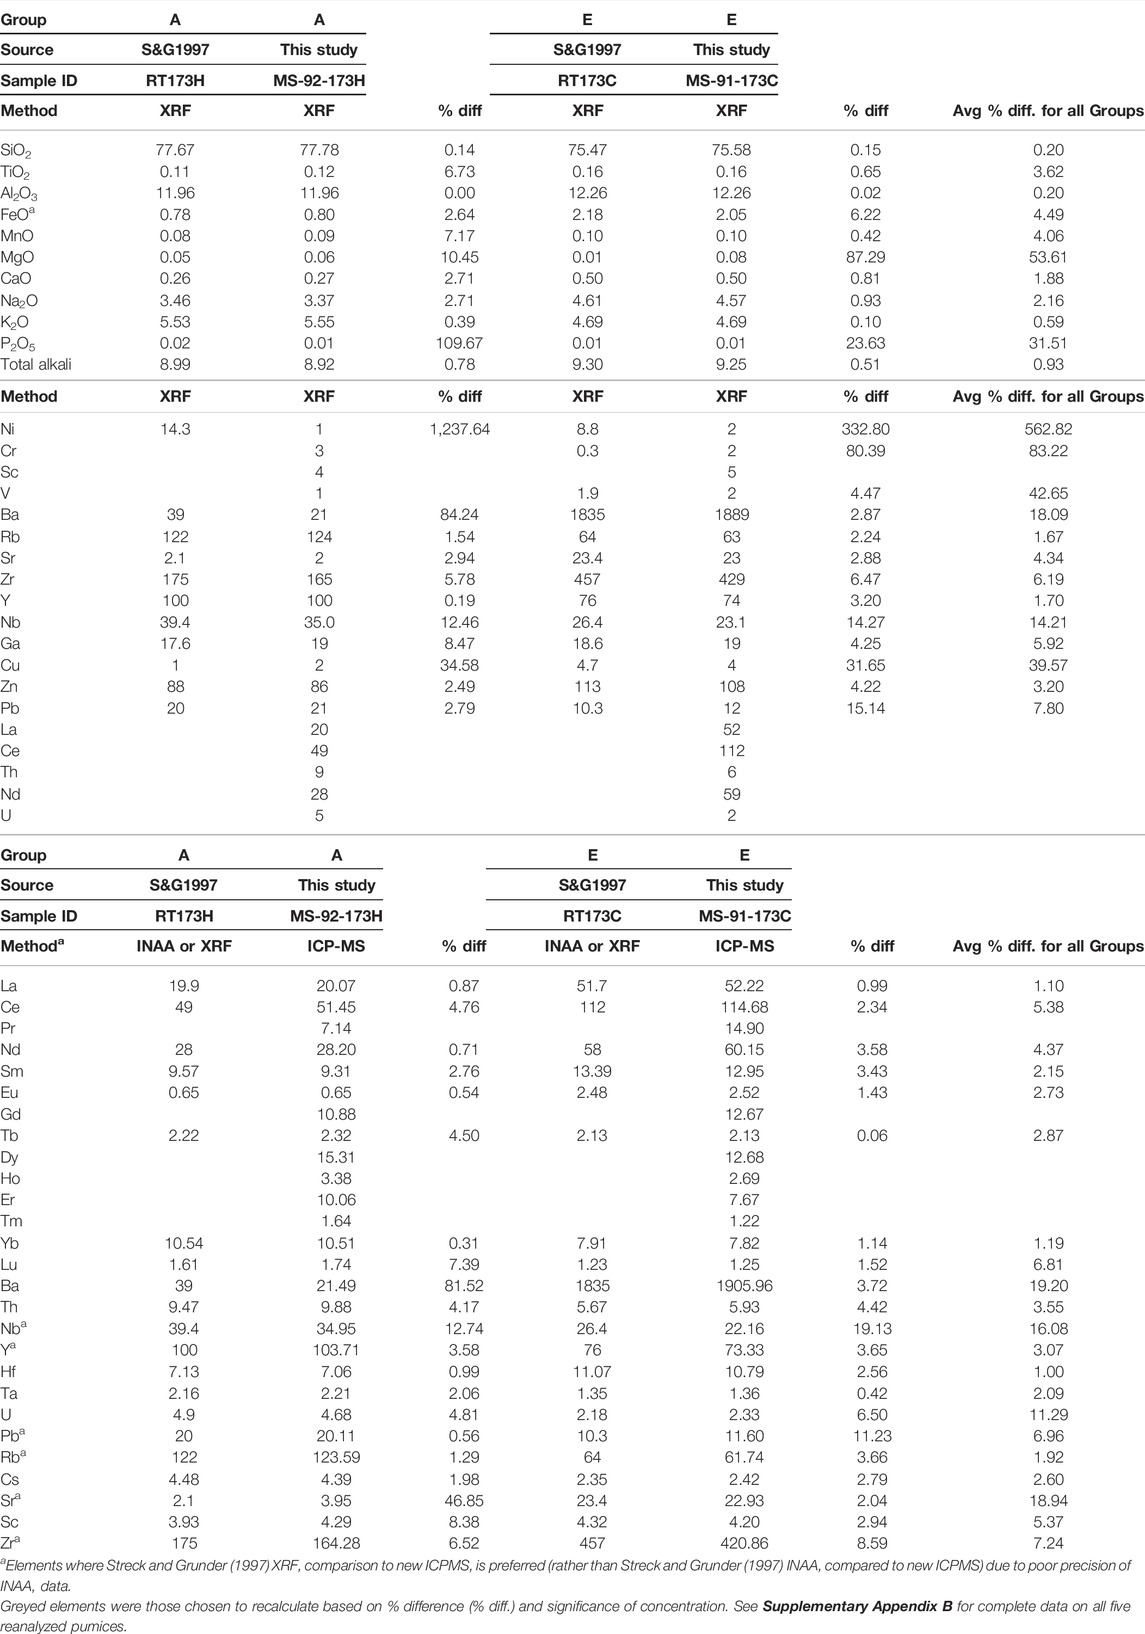
TABLE 1. Examples of recalculations to Streck and Grunder (1997) XRF and INAA data.
2.4 Statistical Analyses of High-Silica Rhyolites by Geochemical Composition and Determining Most Influential Parameters
A kmeans cluster analysis was performed using R Studio on all HSR pumice samples from this study and samples of interest from Streck and Grunder (1997). We used recalculated geochemical data from Streck and Grunder (1997). XRF and INAA analyses conducted by Streck and Grunder (1997) did not measure detectable amounts of some oxides and elements that recent XRF and ICP-MS analysis are able to detect, such as P2O5 (XRF), Cr (XRF), and As (INAA). There were also no data reported for elements such as Pr, Gd, Dy, Ho, Er, and Tm, and several samples (i.e., RT219A; RT62A; RT173I; RT173L) did not have measurable Ba, Nb, Y, Pb, Rb, Sr, and Zr INAA data. Because kmeans clustering analysis cannot be conducted when cells in a given spreadsheet are empty (there is no numerical value for that element or oxide), the aforementioned missing elements and oxides were excluded from the analysis, as well as the samples with a significant number of missing values. A principal component analysis (PCA) was then conducted on the same data to determine which elements and oxides have the strongest influence on differentiating the samples, and thus, differentiating each cluster. Elements and oxides with PC1 values >1.5 or < −1.5 were considered the most significant factors in distinguishing samples, and those with PC2 values >2.0 or < -2.0 were also considered. The significance of this subset of elements and oxides was verified by observable differentiation in scatterplots. See Supplementary Appendix C1 for the data spreadsheet used and Supplementary Appendix C2 for the script used in R Studio to conduct both the kmeans clustering and PCA analyses.
2.5 Temperature and Pressure Calculations
Wet liquidus temperatures were calculated for each HSR group using Rhyolite-MELTS software (Gualda et al., 2012). Wet liquidus temperatures were calculated from 1–5 wt% H2O at 200 MPa and 1–4 wt% H2O at 150 MPa. Water content ranges were chosen based on the experimentally determined water solubility in rhyolitic melts at ∼850°C (Wallace and Anderson, 2015). Rhyolite-MELTS software was unable to generate wet liquidus temperatures for any Group composition at 150 MPa and 5 wt% H2O, likely because such water content is not soluble at depths as shallow as 150 MPa.
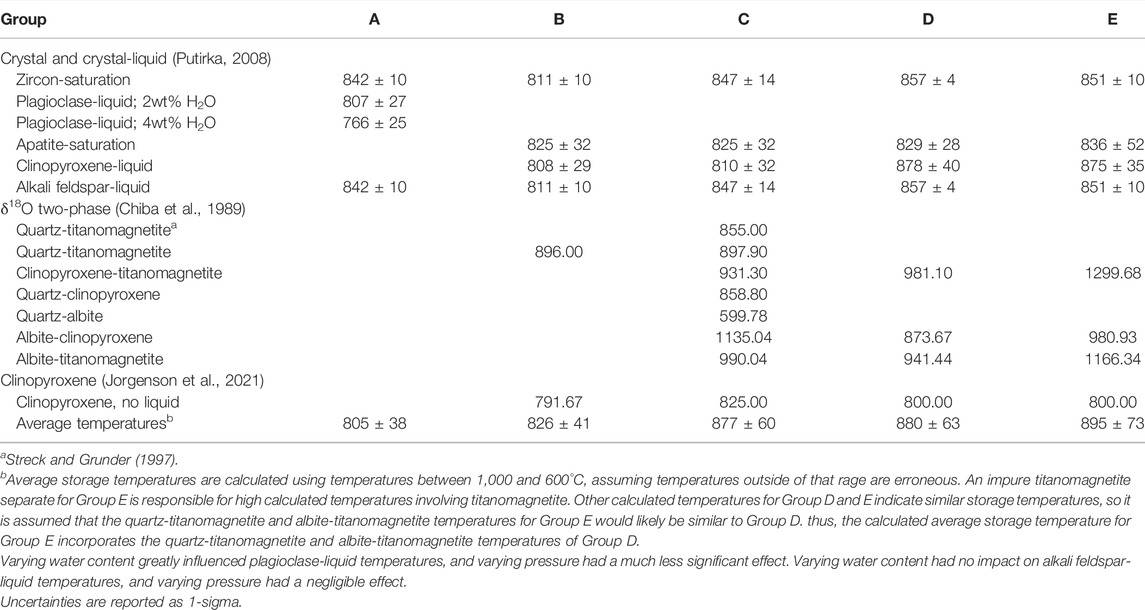
Storage temperatures were calculated using various equations from Putirka (2008), such as the plagioclase-liquid, alkali feldspar-liquid, clinopyroxene-liquid, and zircon-saturation geothermometers. Appropriate geothermometers for each Group were chosen based on mineral assemblages determined by Streck and Grunder (1997). RST HSRs have euhedral phenocryst phases (Streck and Grunder, 1997), and there is homogeneity within phases (Streck and Grunder, 2008), suggesting these crystals were in equilibrium with the host melt and, thus, are deemed acceptable phases for geothermometers that involved crystal and liquid compositions (e.g., Putirka, 2008). Mineral compositions determined by Streck and Grunder (1997) were used where required, including the clinopyroxene-liquid, plagioclase-liquid and alkali feldspar-liquid geothermometers. Whole rock compositions for all samples within a Group were used where a liquid or glass composition was required, such as the clinopyroxene-liquid, plagioclase-liquid, alkali feldspar-liquid, and zircon-saturation geothermometers. Water content (wt% H2O) does not influence results for alkali feldspar-liquid temperatures, so 2 wt% H2O was entered into the calculation spreadsheet but essentially acted as a placeholder. However, water content does make a notable difference in plagioclase-liquid temperatures. It should be noted that HSR Group A is aphyric, but Streck and Grunder (1997) found and analyzed three plagioclase phenocrysts. The single plagioclase-liquid temperature reported for Group A comes from the average of temperatures calculated at 2 wt% and 4 wt% H2O. For the zircon-saturation geothermometer, the calculated maximum temperature represents the crystallization temperature if the sample does not contain zircon or if it is unknown whether the sample contains zircon. If the sample is known to contain zircon, the calculated minimum temperature represents the crystallization temperature. Streck and Grunder (1997) determined that zircon is present in all HSR Groups except for Group A.
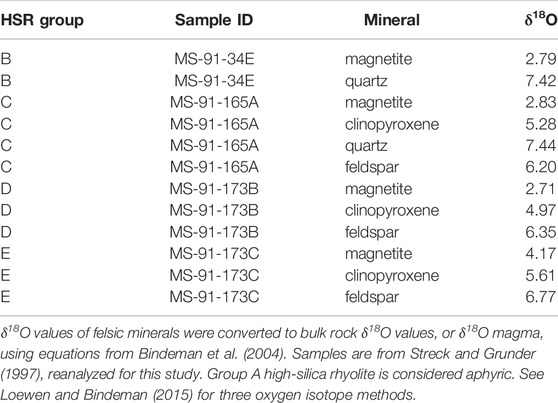
Mineral separates of quartz, feldspar, titanomagnetite, and clinopyroxene from each Group were targets for three oxygen isotope analysis using University of Oregon’s Laser fluorination line with 35W Newwave CO2 IR laser run in O2 mode. Oxygen isotope values were gathered to calculate storage temperatures. Samples chosen for this analysis are from Streck and Grunder (1997), including MS-91-34E (Group E), MS-91-165A (Group C), MS-91-173B (Group D), and MS-91-173C (Group E). No phenocrysts were analyzed from Group A because it is aphyric. Titanomagnetite was separated and analyzed for Groups B-E, clinopyroxene and feldspar were analyzed for Groups C-E, and quartz was analyzed for Groups B and C. Temperatures were calculated using the equation and appropriate coefficient (A) from Chiba et al. (1989) for quartz-titanomagnetite (qtz-tmt), quartz-clinopyroxene (qtz-cpx), quartz-albite (qtz-alb), albite-clinopyroxene (alb-cpx), albite-titanomagnetite (alb-tmt), and clinopyroxene-titanomagnetite (cpx-tmt). It should be noted that coefficients from Chiba et al. (1989) were experimentally determined under higher pressure (15–16 kbar) conditions than what we estimate for the RST HSR magmas, so these are considered in addition to several other geothermometers when determining magma storage temperatures.
Storage pressures were calculated using SiO2 wt%, K2O wt%, and Na2O wt%, representing quartz, albite, and orthoclase components. CIPW normative values for the average composition were calculated using the CIPW normative value calculator from Bolte et al. (2015). These values were plotted on a haplogranitic Qtz-Ab-Or ternary diagram (Holtz et al., 1992) to determine the storage pressures and equivalent storage depth for each Group.
3 Results
3.1 Recalculated Geochemical Data From Previous Studies
At first glance, plotting the original XRF and ICP-MS data from Streck and Grunder (1997) with our new XRF and ICP-MS data showed significant offset between several elements, most notably Zr and Nb, where older XRF concentrations for each element were consistently higher than new ICP-MS concentrations (Figure 3). Results from calculating the percent difference (% diff.) between XRF and INAA data from Streck and Grunder (1997) and our new XRF and ICP-MS data determined that Zr, Nb, Ce, Pb, Sr, and Zr were elements that needed to be recalculated (Table 1). Ba was not recalculated, because the large difference of 84% is only observed within the Group with the lowest concentration of Ba, Group A. The percent difference of Ba in Groups B–E ranges from only 2.9–0.2%. See Supplementary Appendix A for full recalculation methods and all recalculated values. These recalculated values are used from this point forward in the study unless otherwise noted.
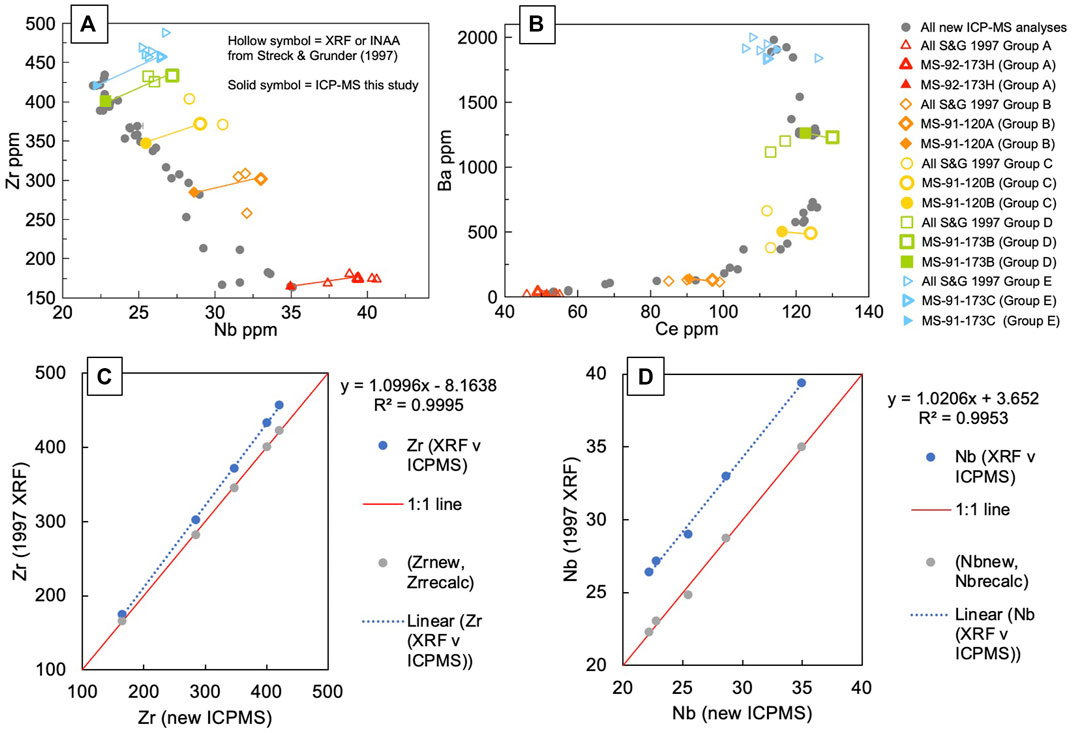
FIGURE 3. (A,B) Original XRF and INAA data from Streck and Grunder (1997) plotted with new ICP-MS data from this study for comparison. Streck and Grunder (1997) Zr, Nb, Ce, Pb, and Sr XRF and INAA data were recalculated based on their significant percent difference when compared to new ICP-MS data of five select samples from Streck and Grunder (1997) reanalyzed in this study (connected by tie lines). Error bars (2-sigma) for the new ICP-MS data are too small to be visible beyond the data point for nearly all analyses. (C,D) Zr and Nd examples of linear regression plots comparing old and new data to display offset and generate a recalculation equation. Blue points use Streck and Grunder (1997) data and new data, and grey points use recalculated Streck and Grunder (1997) data and new data. Recalculated data are used in all analysis after this point. See Supplementary Appendix A for full recalculations and plots.
3.2 High-Silica Rhyolite General Geochemistry
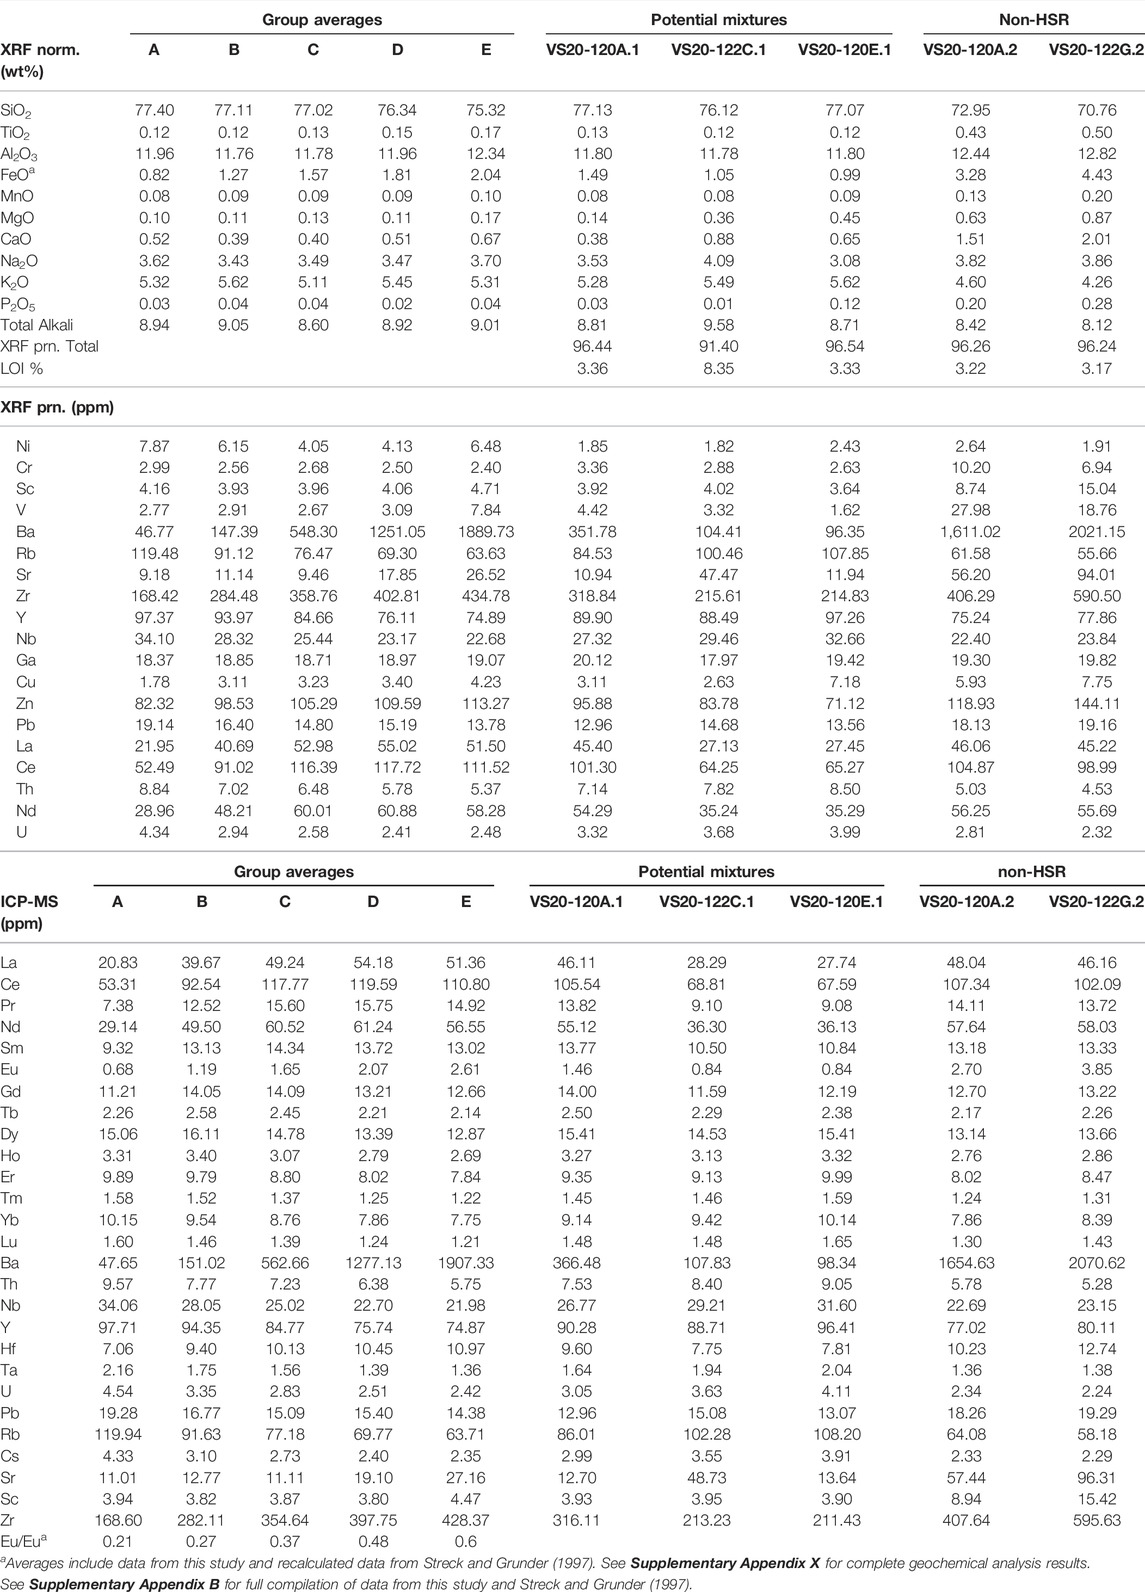
Based on the XRF and ICP-MS results, all 17 samples analyzed, including the two homogeneous pumices, are high-silica rhyolites (>75 wt% SiO2), except two band separates (VS20-120A.2 and VS20-122G.2) that had between 70 and 73 wt% SiO2. These may be a mixture of a dacite magma or mafic component in the system and, thus, are excluded from analyses to focus on HSR petrogenesis.
In accordance with Streck and Grunder (1997), the majority of the HSRs appeared to be broadly segregated into groups with compositional gaps, which is readily apparent with respect to FeO*, Ba, Nb, and Zr compositions. Major element oxides other than FeO* do not prove to be useful in segregating Groups, and the trace element variability among all HSRs analyzed is astounding. See Supplementary Appendix B for full XRF and ICP-MS results.
3.3 Identifying Initial Outliers and Potential Mixtures
Based on scatterplots of numerous elements and oxides, combined with re-examining the hand sample from which the material was separated, it was clear that some separates were accidental physical mixtures of two or more Groups during the preparation process (Figure 4). It is beneficial to exclude these samples from the dataset entered into the statistical analyses, because they will blur the geochemical distinction parameters that would otherwise be clear in generating clusters.
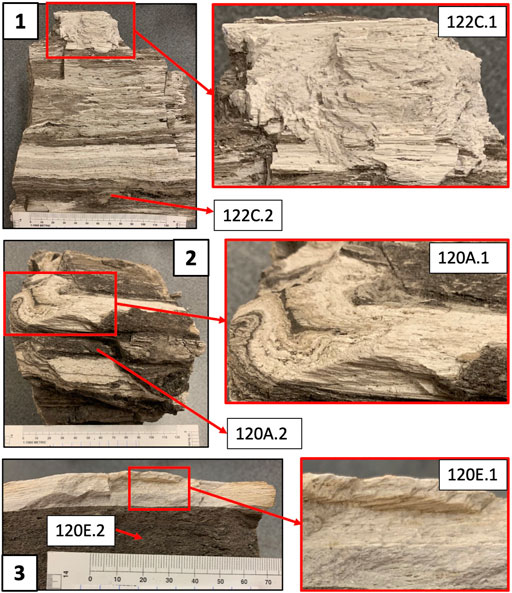
FIGURE 4. Samples VS20-122C (1), VS20-120A (2), and VS20-120E (3), with an analyzed separates that turned out to be an accidental physical mixture of two high-silica rhyolite compositions in the separation process. This was determined after preliminary observations in the geochemical data combined with reexamination of the hand sample photos taken prior to separation.
Plotting geochemical data from VS20-120E.1 suggested it may be a mixture of Groups A and B. Two band separates were analyzed from sample VS20-120E. Upon closer examination of the hand sample from which the bands were separated, the separate labeled as the lighter material (VS20-120E.1) seems to include material of possibly two different magmas; one appears slightly lighter and more stretched than the other.
Band separate VS20-120E.2, the darkest band analyzed from sample VS20-120E.2, appeared to be a potential mixture of D and E with some parameters like Ba and Eu/Eu*, but it plotted with strong similarity to Group D with respect to elements like Nb and Zr. The dark grey material targeted for this band separate appears homogeneous, and calculated mixing proportions range dramatically. Thus, we conclude that this band separate is not likely to be a mixture of multiple magmas, and it is likely a Group D HSR magma.
Scatterplots of geochemical data from VS20-122C.1 suggested it could be a mixture of Groups A and B, but with a number of outlying concentrations with various elements and oxides. Two band separates were analyzed from sample VS20-122C. The pumice from which the material was separated has thinner, more convoluted banding relative to other pumices analyzed, making physical isolation of one color or texture of material difficult.
Sample VS20-120A.1 consistently plots between Groups B and C on element and oxide scatterplots, but usually slightly more similarly to Group B. The hand sample of this pumice has relatively thin and convoluted banding, so isolation of a single composition was difficult in the preparation process.
3.4 Statistical Compositional Grouping of High-Silica Rhyolites and Determining Most Distinguishing Parameters
To objectively determine how these HSRs would be grouped based on composition, a PCA was first conducted on all samples (excluding the aforementioned outliers). This resulted in the samples being placed into eight clusters (Figure 5; Supplementary Appendix C). In accordance with findings from Streck and Grunder (1997), the PCA determined that the most influential factors (PC1 > 1.5) in distinguishing the HSRs were Ba, Eu/Eu*, Eu, FeO*, Hf, Zr, with Cs, Nb, Rb, Ta, Th, Y, and Yb also being identified as significant factors (PC1 < -1.5). Scatterplots verify the significance of these parameters in clustering the samples.
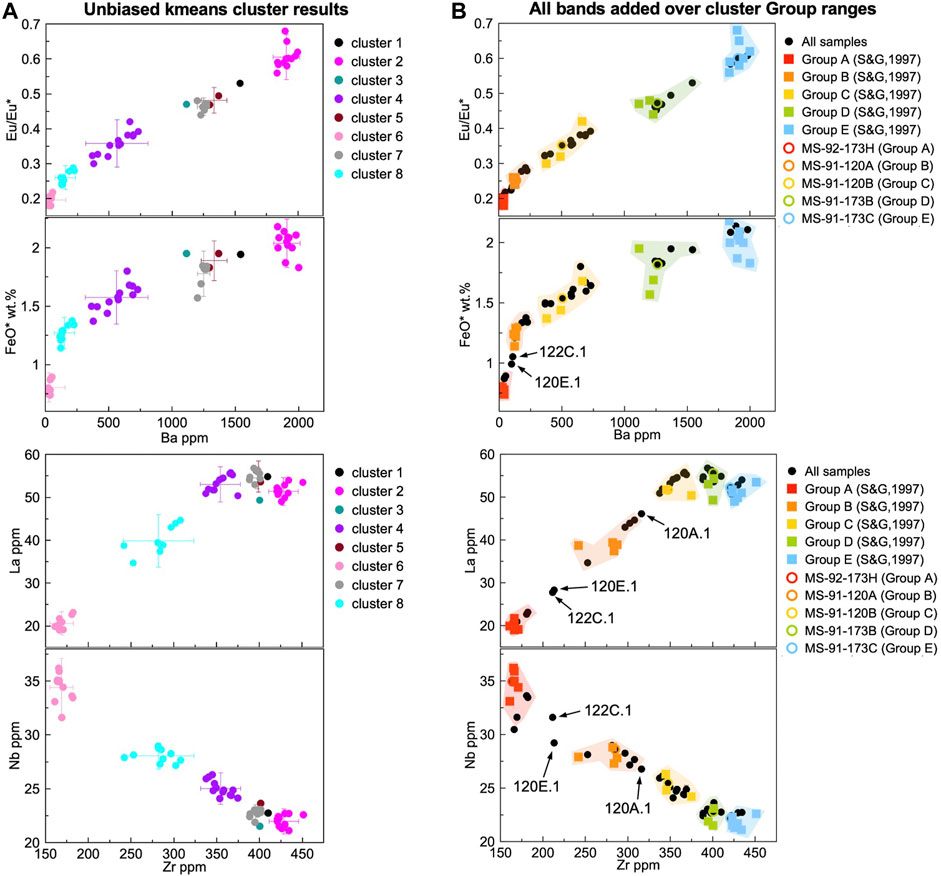
FIGURE 5. (A) Results of kmeans cluster analysis of RST high-silica rhyolites (HSRs) using R Studio when number of desired clusters in undefined. Analysis placed samples into eight clusters, where all samples originally postulated to be Group E were placed into cluster 2, Group D were placed into cluster 7, Group C were placed into cluster 4, Group B were placed into cluster 8, and Group A were placed into cluster 2. The obsidian fragment included in this analysis was categorized into cluster 2. Samples identified as outliers or potential mixtures were excluded from kmeans cluster analysis, because they were deemed as “impure” with respect to a HSR composition. Error bars (2-sigma) are shown for clusters that included two or more samples. (B) Assigning each sample from this study and Streck and Grunder (1997) into a HSR Group, including mixture separates from this study. Colored squares are analyses from Streck and Grunder (1997) and colored hollow circles highlight the reanalysis of those same samples from this study. See Supplementary Appendix C for R script, kmeans clustering and principal component analysis (PCA) plots, and full kmeans clustering results. Error bars (2-sigma) are mostly too small to be visible beyond the data points.
A kmeans cluster analysis without presetting the desired number of clusters resulted in HSRs being placed into eight clusters (Figure 5; Supplementary Appendix C). As the PCA indicated, the primary components that influenced cluster formation were Ba, Eu/Eu*, FeO*, Zr, and Nb. All 11 samples categorized into cluster 6 were those identified as Group A by Streck and Grunder (1997) and samples from this study with the lowest Ba (10–51 ppm), Eu/Eu* (0.18–0.22), FeO* (0.74–0.89 wt%), and Zr (161–182 ppm), and the highest Nb (31.6–36.2 ppm). This also includes homogeneous white pumice VS20-122J, obsidian sample RNL 1903. All samples within cluster 6 are considered Group A HSRs. Granite lithic fragment MS-20-05 was not included in the kmeans cluster analysis, but it possesses compositional similarity to Group A and will be categorized as such.
All 10 samples categorized into cluster 8 were those identified as Group B in Streck and Grunder (1997) and samples from this study with 115–225 ppm Ba, 0.24–0.29 Eu/Eu*, 1.14–1.38 wt% FeO*, 242–308 ppm Zr, and 27.2–29.0 ppm Nb. All samples within cluster 8 are considered Group B HSRs.
All 13 samples categorized into cluster 4 were those identified as Group C in Streck and Grunder (1997) and samples from this study with 367–730 ppm Ba, 0.30–0.42 Eu/Eu*, 1.37–1.80 wt% FeO*, 338–375 ppm Zr, and 24.1–26.3 ppm Nb. This also includes homogeneous light grey pumice VS20-120H. All samples within cluster 4 are considered Group C HSRs.
Two of the three “Group D” samples from Streck and Grunder (1997) that could be included in the kmeans cluster analysis were included in cluster 7, as well as six other samples from this study. Compositions for samples within cluster 7 are 1,201–1,274 ppm Ba, 0.44–0.48 Eu/Eu*, 1.57–1.85 wt% FeO*, 389–401 ppm Zr, and 21.9–23.0 ppm Nb. All samples within cluster 7 are considered Group D HSRs. Two samples from this study were categorized into cluster 5, including VS20-122H.3 with 1,370 ppm Ba, 0.49 Eu/Eu*, 1.95 wt% FeO*, 401 ppm Zr, and 23.6 ppm Nb, and VS20-122A.2 with 1,298 ppm Ba, 0.47 Eu/Eu*, 1.83 wt% FeO*, 397 ppm Zr, and 22.8 ppm Nb. VS20-120E.2 is the only sample within cluster 1, with 1,541 ppm Ba, 0.53 Eu/Eu*, 1.94 wt% FeO*, 410 ppm Zr, and 22.8 ppm Nb. Sample RT4A, originally identified as a ‘Group D’ sample in Streck and Grunder (1997), is the only sample categorized within cluster 3. RT4A has 1116 ppm Ba, 0.47 Eu/Eu*, 1.95 wt% FeO*, 400 ppm Zr, and 21.5 ppm Nb.
Slight variances in the compositions of VS20-120E.2, RT4A, VS20-122H.3, and VS20-122A.2 provide an explanation for why the statistical analysis essentially categorized these samples as separate and distinct groups and how this can be reconciled. RT4A was originally categorized as a Group D HSR in Streck and Grunder (1997). The PCA identified Ba as one of the top five most influential components for distinguishing rhyolites. Both VS20-120E.2 and RT4A plot with striking similarity to Group D samples in almost all compositional parameters, except for Ba, where there are slight variations (∼85–270 ppm difference). The broad similarity but variance in one critical element may be the cause for RT4A and VS20-120E.2 being isolated from all other Groups. Cluster 5 consisted of only two samples: VS20-122H.3 and VS20-122A.2. With respect to the most distinguishing parameters (e.g., Zr, Eu/Eu*, Nb), these samples plot similarly to Group D. These samples only vary slightly from Group D composition with respect to a few elements, such as Ta, TiO2, FeO*, and Ba. As with samples VS20-120E.2 and RT4A, these few and slight variations may have been sufficient to result in a categorization as a separate cluster in the analysis. We conclude that the four samples distributed among kmeans clusters 1, 3, and 5 should be combined with those in cluster 7, and all should be considered Group D HSRs.
All 12 samples categorized into cluster 2 were those classified as Group E in Streck and Grunder (1997) and samples from this study with the highest Ba (1835–1999 ppm), Eu/Eu* (0.56–0.68), FeO* (1.83–2.18 wt%), and Zr (420–451 ppm), and the lowest Nb (21.1–22.7 ppm). All samples within cluster 2 are considered Group E HSRs.
3.5 High-Silica Rhyolite Pumices in This Study
In total, there are 12 samples classified as Group A, 11 as Group B, 14 as Group C, 14 as Group D, and 12 as Group E (Figure 5). Samples VS20-120E.1 and VS20-122C.1 are classified as mixtures of Group A and B magmas, and sample VS20-120A.1 is considered a mixture of B and C magmas with some possible contamination of the low-silica VS20-120A.2 magma. The two homogeneous pumices included in this study possess compositions that strongly represent a single HSR Group type: VS20-120H, a light grey, minimally stretched pumice is composed of Group C magma, and VS20-122J, a white, super stretched pumice, is composed of Group A magma.
Individual banded pumices contain at least two and as many as four HSR magma types (Figure 6; Supplementary Appendix D). For example, VS20-122B contains bands of Group C and D magmas, VS20-120C contains Group A, C, and E magmas, and VS20-122E contained Group B, C, D, and E magmas. As previously mentioned, material was separated from a pumice and considered a unique band relative to the other bands in an individual sample if it possessed a discernable difference in color and/or texture. Each analyzed separate did, in fact, represent a distinctly different composition to other bands within that sample, except for the accidental physical mixtures.
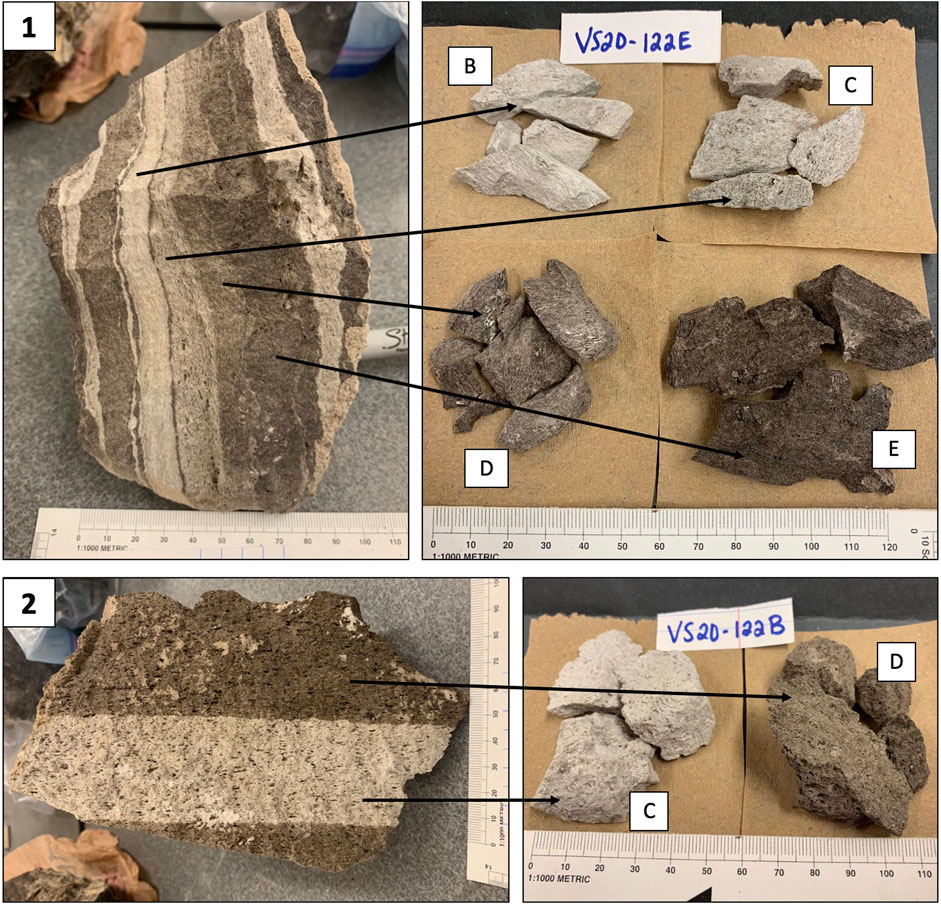
FIGURE 6. Examples of high-silica rhyolite (HSR) Group compositions assigned to separates from two different samples. All banded pumices analyzed contained magmas of at least two and up to four HSR Groups. (1) VS20-122E was the only pumice that contained four different HSR magmas (B–E). (2) VS20-122B is an example of one pumice that contained two HSR magmas (C,D). With respect to all pumices, HSR magmas contained within a single pumice were not always consecutive e.g., (A–C). See Supplementary Appendix D for all pumice samples annotated with assigned Groups.
3.6 Analyzing High-Silica Rhyolites as Groups
Average compositions (Table 2) were used in mass balance equations to produce mixing lines based on mixing proportions in intervals of 10% from 90–10% (Figure 7) as one possible test to determine whether mixing of endmember Groups can produce intermediate Groups (i.e., mixing of Group C and Group A to produce Group B). These calculations failed to produce intermediate compositions, most notably with concentrations of La, Sm, Ba, FeO*, Eu/Eu*, TiO2, and Al2O3. Band separates previously identified as outliers or potential mixtures, including VS20-120E.1, VS20-122C.1, and VS20-120A.1, notably fell on or near some of these mixing lines. However, because standard mixing lines are calculated based only on the concentrations of two elements at a time, they alone are not enough to conclusively state whether these outlier analyses are or are not simply mixtures of multiple Groups.
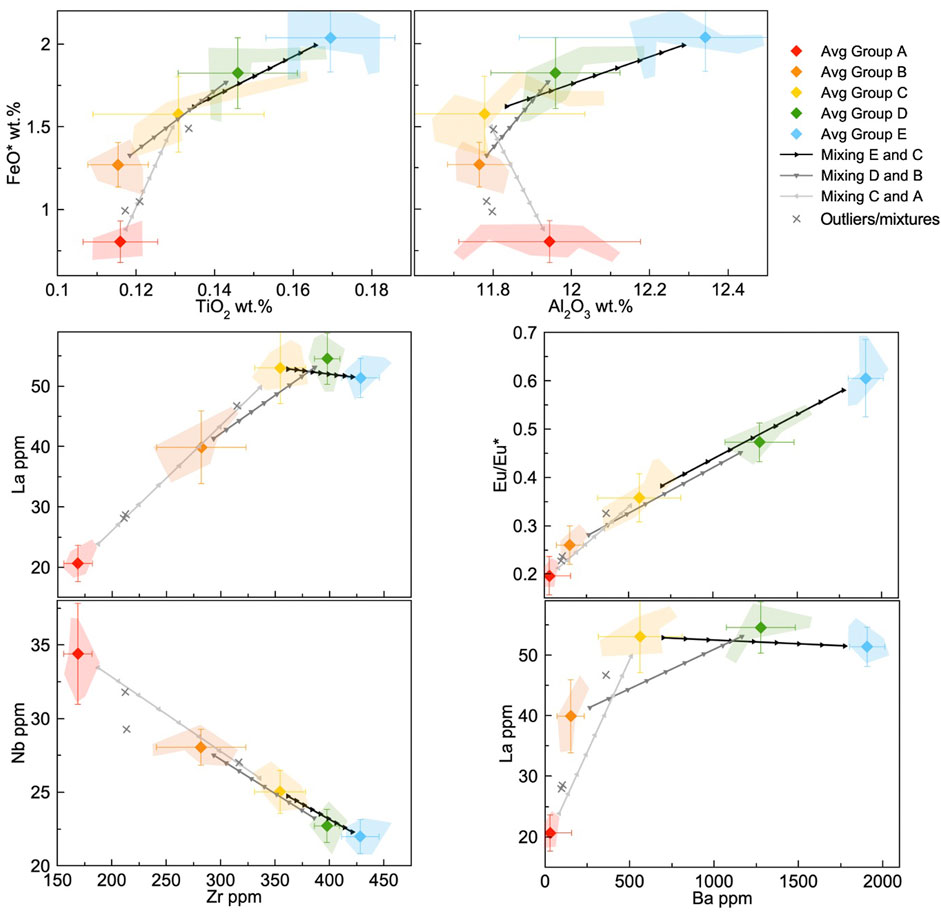
FIGURE 7. Mixing lines calculated using average Group compositions to display how intermediate Groups are not mixtures of adjacent endmember Groups (e.g., Group B magma is not a mixture of Group C and A magmas). Colored polygons represent extent of compositions for each Group. The failure to produce Groups via mixing is most notable in trends observed with FeO* vs. TiO2, FeO* vs. Al2O3, La vs. Zr, and La vs. Ba. Error bars (2-sigma) are shown for each Group.
In order to determine whether these outliers are, in fact, some mixture of two Groups, a simple mixing equation was arranged to calculate the potential mixing proportion of each element
where Cmix is the element concentration of the potential mixture, CX is element concentration of one endmember composition in the mixture, and CY is the element concentration of the other endmember composition in the mixture. This equation is arranged such that the resulting value is the percent of CX in the mixture. The calculated average composition for each Group was used to address each sample of interest. If a sample is a mixture of two endmember components, the calculated proportions of each element should be similar (within ∼10%).
It should be noted that mixing proportion calculations, though a common method for determining the likelihood and proportions of mixture between two materials, do not provide meaningful results when the two materials of interest possess great similarity. Especially for trace elements of low concentrations (<10 ppm), small variations will result in a wide range of mixing proportions. For example, Group A has an average of 2.25 ppm Tb and 4.55 ppm U, and Group B has an average of 2.62 ppm Tb and 3.36 ppm U. When calculating the mixing of A and B to make VS20-122C.1 with 2.29 ppm Tb and 3.63 ppm U, the resulting proportions are low for Tb (∼10%) and are high for U (∼79%). With this noted, we report all results, and it is apparent that La, Ce, Nd, Sm, Eu, Hf, and Zr are most consistently within a ± 10% range of mixing proportions calculated for each given sample.
Calculated mixing proportions for VS20-120E.1 vary widely overall from ∼10 to 85%. However, of the 21 trace elements analyzed, 14 (La, Ce, Nd, Sm, Eu, Tb, Th, Hf, Ta, U, Rb, Cs, Sc, and Zr) fall within the range of an ∼27–45% proportion of Group A mixed with Group B.
Mixing proportions calculated for VS20-122C.1 also range widely from ∼10 to 80%. Of the 21 trace elements analyzed, seven (La, Ce, Nd, Sm, Eu, Hf, and Zr) fall within the range of an ∼27–41% proportion of Group A mixed with Group B. Five other trace elements (Lu, Ba, Th, Rb, and Cs) fall within the range of ∼62–71% proportion of A mixed with B.
Calculated mixing proportions for VS20-120A.1 overall range between ∼18 and 67%, with 9 of 21 trace elements calculated to have an ∼52–67% proportion of Group C mixed with Group B, including La, Ce, Nd, Sm, Eu, Tb, Ba, Ta, and U. Calculating mixing proportions to test if VS20-120A.1, instead, could be a mixture of A and D also displayed large overall variance (∼18–80%) but slightly better results, where 11 of the 21 trace elements (La, Ce, Nd, Th, Nb, Hf, Ta, U, Rb, Cs, and Zr) ranged between 64 and 80% proportion of Group A mixing with Group D. As mentioned previously, compositional analysis of VS20-120A.2 revealed that it is not a HSR, with only ∼73 wt% SiO2. Inability to generate a reasonable mixing proportion of any magma types to generate VS20-120A.1 may be because it is a product of mixing with a non-HSR magma, possibly such as a dacite magma.
3.7 Pressure and Temperature Calculations
Wet liquidus temperatures were calculated using the average composition of rhyolites within each Group. Temperatures determined using Rhyolite-MELTS (Gualda et al., 2012) when conditions varied from 150 to 200 MPa and 1–5 wt% H2O show mostly a decrease in calculated range overall from Group E to Group A, where Group E temperatures range from ∼850 to 970°C, from ∼833 to 970°C for Group D, ∼812–975°C for Group C, ∼790–980°C for Group B, and ∼768–990°C for Group A (Figure 8). Varying water content has a greater impact on calculated wet liquidus temperatures than varying pressure. The lowest water contents produce the highest temperatures for each Group. At 1 wt% H2O at both 200 and 150 MPa, the overall trend shows a decrease in temperature from Group A to Group E. At 2 wt% H2O at both 200 and 150 MPa, there is no discernable trend in wet liquidus temperatures from Group A to Group E. With 3–5 wt% at pressures where applicable, the trend shows a general increase in temperature from Group A to Group E.
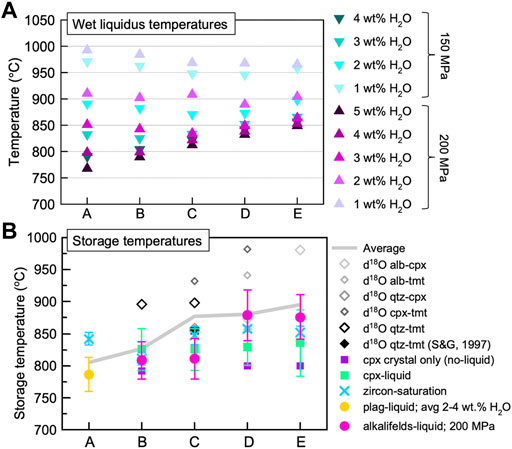
FIGURE 8. Calculated temperatures for Rattlesnake Tuff (RST) high-silica rhyolites. (A) Wet liquidus temperatures at 200 and 150 MPa and various water contents were determined using Rhyolite-MELTS software (Gualda et al., 2012). (B) Crystal-liquid and zircon saturation storage temperatures were calculated using equations from Putirka (2008). The clinopyroxene (cpx crystal only) temperatures were calculated using a geothermometer and R script developed by Jorgenson et al. (2021). δ18O temperatures were calculated using coefficients and equations from Chiba et al. (1989). Group A is considered aphyric, but a plagioclase-liquid temperature was calculated using the composition of one plagioclase grain from Streck and Grunder (1997). Calculated zircon-saturation maximum temperatures are reported for Groups B-E because they are known to contain zircon, and a minimum is used for Group A because presence of zircon within Group A is not known. Alkali feldspar-liquid temperatures are used for Groups A-E because Streck and Grunder (1997) reported these Groups contained Na-sanidine to anorthoclase composition feldspars. Groups B-E contain clinopyroxene and titanomagnetite that were analyzed for oxygen isotopes. Group E titanomagnetite produced an anomalously high δ18O and subsequent clinopyroxene-titanomagnetite (cpx-tmt) temperature of ∼1300°C, so this temperature is considered erroneous and is not included here. See Table 3 for all plotted temperatures and Table 4 for all oxygen isotope results.
Calculations from the Putirka (2008), δ18O, and Jorgenson et al. (2021) geothermometers yielded average storage temperatures for all Groups from ∼600 to 1,300°C, with temperatures increasing from Group A to Group E (Figure 8; Table 3). Pressure variations had little impact on the resulting temperature when using the plagioclase-liquid geothermometer for Group A, so the calculations were performed at 200 MPa. Considering all calculated temperatures, temperatures range from 787 to 842°C for Group A, 792–896°C for Group B, 811–1,135°C for Group C, 600–981°C for Group D, and 800–1,300°C for Group E. All δ18O results are considered accurate except for the titanomagnetite value for Group E (Table 4). δ18O of titanomagnetite for Groups B, C, and D were 2.79‰, 2.83‰, and 2.71‰, respectively, and was 4.17‰ for Group E. The relatively high δ18O value for Group E is likely due to an impure titanomagnetite separate.
Plotting CIPW normative values for average Group compositions on the Qtz-Ab-Or ternary diagram resulted in a wide range of pressures (Figure 9), with Groups A and C at ∼200 MPa (∼7 km depth), Groups B and D at ∼500 MPa (∼17 km depth), and Group E at ∼600 MPa (∼21 km depth). The obsidian sample categorized as Group A (sample RNL 1903) and the granitic lithic fragment (sample MS-20-05) with a similar composition to Group A were also plotted on the Qtz-Ab-Or ternary and yielded pressures of ∼175–200 MPa (∼5–7 km depth). XRF analysis of the obsidian sample had a significantly low percent loss-on-ignition (LOI ∼ 0.6%), so the nearly 1:1 Na/K ratio is considered as a representation of the true Na/K ratio for Group A. Therefore, the pressure estimates for the granite and obsidian samples are interpreted as more accurate for Group A. All high-silica rhyolite pumices have higher LOI (∼2-4%) and variable Na/K ratios and thus are likely affected by alkali exchange (cf. Streck and Grunder, 1997). Hence, this skewing of the Na/K ratio is assumed to be the case for all RST HSRs, so Na/K ratios were adjusted to 1:1 for each Group average and plotted on the same Qtz-Ab-Or ternary. After these adjustments, Group B and C are also at ∼200 MPa (∼7 km depth), but Group D remained at ∼500 MPa (∼17 km depth), and Group E remained at ∼600 MPa (∼21 km depth).
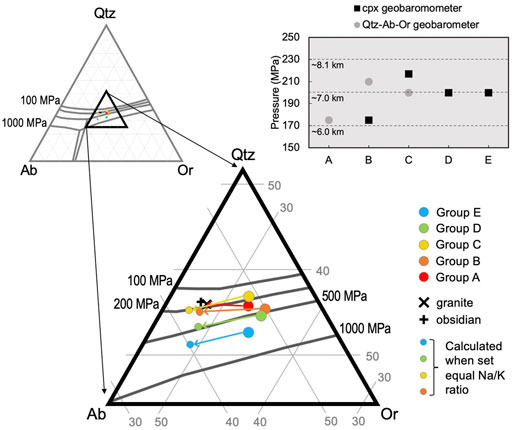
FIGURE 9. Quartz-albite-orthoclase (Qtz-Ab-Or) ternary geobarometer (Holtz et al., 1992) and clinopyroxene geobarometer (Jorgenson et al., 2021) results for Rattlesnake Tuff (RST) high-silica rhyolite (HSR) Groups. Large colored circles in the Qtz-Ab-Or ternary results when plotting CIPW normative compositions for each HSR Group. The obsidian sample with Group A composition and granite sample with a composition similar to Group A are also plotted on the Qtz-Ab-Or ternary. The low LOI (0.6%) from the XRF analysis of the obsidian sample indicates that the nearly 1:1 Na/K ratio is representative of the true, original Na/K ratio of Group A magma. Thus, all Na/K ratios are adjusted to 1:1 for all other Groups and plotted on the Qtz-Ab-Or ternary. Results from the Qtz-Ab-Or geobarometer are compared to results from the clinopyroxene geobarometer (top right) for each HSR Group. The Qtz-Ab-Or pressures for Groups D (∼500 MPa) E (∼600 MPa) are excluded from the graph, because they are considered erroneously high.
The clinopyroxene “cpx no liquid” geobarometer from Jorgenson et al. (2021) was used to calculate storage pressures for Groups B–E, because these Groups contained clinopyroxene (Figure 9). Clinopyroxene compositions come from INAA of 100–300 grains by Streck and Grunder (1997). Group B clinopyroxenes had a calculated pressure of 175 MPa (∼6.13 km depth), 217 MPa (∼7.52 km depth) for Group C, and 200 MPa (∼7.00 km depth) for Groups D and E.
4 Discussion
4.1 Understanding Crystallization and Storage Conditions
Detailed compositional analysis (XRF and ICP-MS) of RST HSRs and subsequent statistical analysis in this study confirms the compositional Groups and compositional gaps first proposed by Streck and Grunder (1997). There is little evidence for mixing among these Groups observed in the geochemical data, which agrees with the conclusion of Streck and Grunder (1995) that these banded pumices represent distinct magmas that erupted together during the same eruption.
We consider all calculated storage temperatures between 700°C and 1,000°C to be valid, and thus, only temperatures within this range are included when calculating the average storage temperatures for each Group (Table 3). The significantly high clinopyroxene-titanomagnetite and albite-titanomagnetite temperatures of about 1,166°C and 1,300°C, respectfully, for Group E reflect the erroneously high δ18O titanomagnetite value for Group E. Temperatures from thermometers that involve albite vary widely and produce unrealistically low temperatures like 600°C and unrealistically high temperatures like 1,135°C for Group C. These erroneous temperatures are likely related to these thermometers from Chiba et al. (1989) being calibrated for high-pressure conditions. Additionally, Chiba et al. (1989) does not provide thermometers for Na-sanidine or anorthoclase feldspars. Albite thermometers were used because it was the closest composition to feldspars within the RST HSRs. However, this could also explain the wide range of calculated temperatures. Other calculated temperatures for Group D and E indicate similar storage temperatures, so it is assumed that the quartz-titanomagnetite and albite-titanomagnetite temperatures for Group E would likely be similar to Group D. Thus, when calculating the average storage temperature for Group E assumes the same albite-clinopyroxene and albite-titanomagnetite temperatures of Group D. The average calculated storage temperature for Group A is 805 ± 38°C, Group B is 826 ± 42°C, Group C is 877 ± 60°C, Group D is 880 ± 63°C, and Group E is 895 ± 73°C (Table 3).
All calculated storage temperatures using phase-liquid equations from Putirka (2008) suggest a broad increase of ∼805°C to ∼895°C from Group A to Group E. This agrees with estimated temperatures from Streck and Grunder (1995; 1997) ranging from ∼800 to 880°C. The Jorgenson et al. (2021) clinopyroxene no-liquid geothermometer results for Groups B-E are comparatively low, which may be due to the general increase in Fe at lower temperatures and the significance of Fe concentration in the pressure calculation.
Assuming this overall temperature increase from Group A to Group E is accurate, then wet liquidus temperatures would parallel this trend at greater water contents (≥3 wt% H2O), implying either that all RST HSR magmas contained a minimum of 3 wt% H2O or that water content must decrease from Group A to Group E. Combining wet liquidus temperatures with storage temperatures, Group E magma is the hottest, and magmas get progressively slightly cooler to Group A magmas.
Various geobarometers (Holtz et al., 1992; Jorgenson et al., 2021) show a slight increase in pressures from Group A to Group E, where Group A was stored at ∼6.1 km depth and Group E was stored at a ∼7 km depth. With calculated temperatures varying among different geobarometers, it can be generalized that these magmas were generated and stored at approximately similar depths of ∼6.5 km.
Melt densities for each HSR magma were calculated to further understand how these magmas would reside together in the crust (Figure 10). Melt densities are expected to increase with increasing Fe content, so a decrease in density is expected from Group E with the highest average FeO* content (∼2 wt%) to Group A with the lowest average FeO* content (∼0.8 wt%). Keeping temperature, pressure, and water content consistent among all Groups (800°C; 200 MPa; 3 wt% H2O), calculated melt densities for adjusted and pre-adjusted Na/K ratios differed only slightly (∼0.005–0.008 g/cm3). Restoring the Na/K ratio to 1:1 (to make up for a slight Na-K exchange during glass hydration, cf. Streck and Grunder, 1997) resulted in a slight decrease in densities that ranged from ∼2.269 to 2.246 g/cm3 from Groups E–A. Continuing to use the compositions with the restored Na/K ratio, densities calculated at 800°C, 3 wt% H2O, and decreasing 245–125 MPa from Groups E-A displayed an overall decrease (∼2.284–2.251 g/cm3) that highlights the decrease of density at lower pressures, particularly with Groups A and B. Densities calculated at 200 MPa, 3 wt% H2O, and average storage temperatures for each Group (from Group E at 895°C and Group A at 805°C) also showed little variation compared to conditions where temperatures among Groups were consistently at 800°C. However, as expected, increasing temperature decreased the density of these magmas, so the calculated range of densities between less evolved (Group E) and more evolved (Group A) magmas becomes slightly muted (∼2.271–2.259 g/cm3). Keeping temperature (800°C) and pressure (200 MPa) consistent among Groups but increasing the water content from 2–4 wt% H2O from Group E to Group A resulted in a drastic difference in calculated melt densities, where densities decreased from Group E (∼2.318 g/cm3) to Group A (∼2.227 g/cm3). These results show that water content is the most significant variable influencing melt densities of these HSR Groups. However, since increasing water content and temperature can have opposite effects on density, densities were also calculated where all three parameters were adjusted using our new pressure, temperature, and water content estimates. When using average storage temperatures for each Group, increasing pressure 125–245 MPa from Groups A-E, and decreasing water contents 2-4 wt% form Groups A-E, the overall trend was similar to when only varying water contents among Groups, but densities for each Group were slightly lower, ranging from ∼2.217 g/cm3 for Group A and ∼2.310 g/cm3 for Group E. These calculations underscore the significance of water content on the densities of RST HSRs.
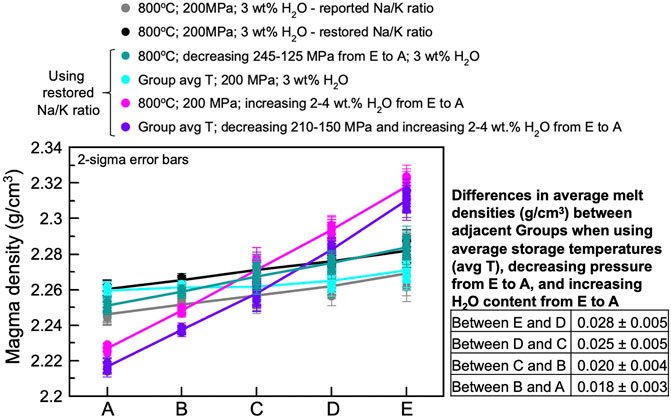
FIGURE 10. Melt densities of average Rattlesnake Tuff Group compositions calculated when altering pressure, temperature, and water content conditions using the DensityX calculator by Iacovino and Till (2019). Lines connect the average density among each Group in the given conditions to highlight the overall trend between all Groups. Black and grey data represent Group densities calculated given the same pressure, temperature, and water content conditions, but grey data use the originally reported Na2O and K2O values, and black data use compositions with the restored (1:1) Na/K ratios. Purple data represent calculated densities using all the available pressure, temperature, and water content data, and are thus considered the most accurate densities for all Groups.
If water content does, in fact, increase 2-4 wt% from Group E to Group A and we assume storage pressures of 200 MPa for all Groups, then calculated wet liquidus temperatures also show an overall increase of ∼115°C: ∼905°C for Group E, ∼870°C for Group D, ∼835°C for Group C, ∼821°C for Group B, and ∼798°C for Group A (Figure 11). These temperatures are approximately within the range of calculated storage temperatures for each Group (Figure 8).
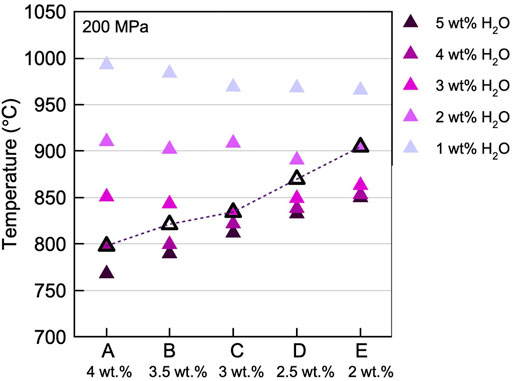
FIGURE 11. Wet liquidus temperatures calculated from average Rattlesnake Tuff high-silica rhyolite Group compositions at 200 MPa (as seen in Figure 8), that now highlights wet liquidus temperatures if water content decreased from 4-2wt% H2O from Group A to Group E (black triangles), using the same water contents estimated when calculating melt densities (Figure 10).
4.2 Evaluating Evidence for Magma Configurations
Combining the plethora of previously acquired data and data from this study provides a wealth of information on magma storage conditions that can be useful in deciphering the magma storage configuration of the RST. However, it is apparent that the RST is derived from a complex system. From here, we synthesize all data to propose the most likely magma storage configuration of the RST.
4.2.1 Evidence Supporting HSR Storage in a Single Holding Zone
Streck and Grunder (1997) and Streck (2002) presented detailed geochemical and modeling evidence that Group E is a product of melting of mafic crust, and subsequent, increasingly more evolved Groups are a result of fractionation from the HSR preceding it (e.g., Group D is a product of fractionation of Group E magma, Group C is a product of fractionation of D magma, etc.). Compositional trends, particularly among FeO, TiO2, Al2O3, La, Zr, and Ba, agree more with a fractional crystallization scenario than magma mixing (Figure 7). The phenomena that are difficult to reconcile with a model of crystal fractionation concentrated occurring primarily on the roof of the chamber are the presence of the compositional gaps between HSR Groups and the physical aspect of melt extraction along a crystallizing roof mush zone.
Systems comprised of multiple crystal-rich and crystal-poor magma lenses seem plausible in a scenario where multiple distinct rhyolite compositions are erupting from the same conduit simultaneously (e.g., Cashman and Giordano, 2014; Szynamowski et al., 2019). Arakawa et al. (2019) used differences in An content and Mg# to estimate storage pressures (200–350 MPa or ∼7.0–12 km depth) of the four different types of rhyolite that erupted from three different volcanoes within the Taupo Volcanic Zone, New Zealand, over the last ∼100 ka, and they concluded that each rhyolite was generated within a separate, shallow reservoir. Previous work on Snake River Plains rhyolites by Ellis and Wolff (2012) ascribed variations in trace element compositions and presence of two pyroxene compositions to magmas being physically separated in two adjacent magma bodies, and they concluded that crystal aggregates found within the rhyolites represented the crystallizing rinds of these magma bodies. RST HSRs are notorious for their subtle differences in major element oxides but striking progressive variability in trace element compositions and considerable variations in mineral compositions among comparable mineral assemblages (Streck and Grunder, 1997; 2008). If there was any solid interface or crystal mush lenses between HSR magma chambers or crystal-poor lenses, one would expect to find greater abundance of granitic crystal-rich lithic fragments or crystal-rich inclusions within these HSRs, or at least one would need to see variable and high phenocryst content rather than near 1% or less throughout. There is no evidence for any of this (Streck and Grunder 1995; 1997; 1999) aside from the one granite lithic fragment found in the outcrop of interest in this study. In other words, although fractional crystallization trends support melt separation from some crystal framework between HSRs, draw-up during the eruption of the RST did not reach any marginal mush zone that must have existed based on available evidence.
From a structural standpoint, magma reservoirs separated by a sufficient volume of solid or mush interface to inhibit mixing is difficult to reconcile in the context of a single caldera eruption. If eruption is driving magmas to finally come in contact in a common conduit, this type of model is lacking an evacuating-reservoir into which the overlying crust can subside.
There is currently work in progress (Grunder et al., 2021) also using banded pumices from this study to assess RST magma ascent rates by calculating diffusion rates. According to Grunder et al. (2021), diffusion times range from 2 to 40 min, and in one case, 300 min, implying a minimum magma ascent rate of 0.2 m/s, assuming the travel distance from chamber to surface is ∼3 km. Data from this study suggest HSR magmas were stored at greater depths, so this rate may be an underestimate. Grunder et al. (2021) also stated that preliminary results display a trend where diffusion was slightly greater between less evolved, hotter magmas (i.e., D and E) than more evolved, cooler magmas (i.e., B and A). This trend supports a model where the earliest, less evolved magmas like Groups D and E were in contact for slightly longer than later, more evolved magmas like B and A, suggesting that D and E ascended from greater depth than A and B, implying different times of magma juxtaposition to one another during mingling as eruption initiated.
A range of calculated storage depths (∼6.1–7.0 km) and average storage temperatures increasing from Group A to Group E (∼805–895°C) support HSR magmas being stored in a single holding zone, where Group E magma is nearest to the heat source. This parallels findings from Streck and Grunder (1995; 1997; 1999; 2008) regarding the RST magma system and configuration with respect to the mafic magmas that were drawn up during the eruption as well. However, if these magmas develop and reside in a single holding zone as originally suggested by Streck and Grunder (1995; 1997), there must be a parameter inhibiting mixing of these magmas.
Turning to well-studied and observable liquid systems, Boehrer and Schultze (2008) state that a body of water is considered meromictic when it remains permanently stratified, and the pycnocline is the boundary between the two layers that will not mix because of a notable variation in density. If the density difference is greater than ∼0.004 g/cm3, then convection will occur within a single layer but not between layers to cause mixing (Boehrer and Schultze, 2008). When densities are calculated by adjusting only one variable and keeping others constant (pressure, temperature, or water content) among each HSR, decreasing pressure from E to A results in little density variation, and the same observation is made with increasing temperature from E to A (Figure 10). Variations in water content most significantly impact magma density. When using the average storage temperature for each HSR Group, a pressure of 200 MPa, and increasing water content from 2–4 wt% H2O from Group E to Group A, density differences range from 0.018 to 0.025 g/cm3. Increasing water content has the opposite effect on density as decreasing temperature (Wallace and Anderson, 2015), so it is useful to calculate HSR densities when these two contrasting parameters are influencing the result. It should be noted that no precise water contents have been reported for each RST HSR, and the water contents chosen are based on new and previous temperature and compositional data. If the phenomena of meromixis can be applied to high-silica melts within a magma body, then our calculations indicate that it is possible for density differences to hinder mixing between HSR Groups, and thus, variations in water content among HSR Groups may play an important role in the dynamics of the magma storage system.
Christiansen (2005) explained the significance of viscosity and water content with respect to magma chamber dynamics and the development of compositionally distinct silicic magmas. Hot, water-poor, crystal-poor rhyolites with a low enough viscosity (<106 Pa s) can allow for uninhibited crystal-liquid separation to occur, where differentiation is primarily focused on the floor and sides of the magma chamber (Christiansen, 2005). Christiansen (2005) explains that this sidewall crystallization and rise of less-dense magma can result in a large, vertically zoned chamber, and the parameters necessary typically occur within A-type silicic magmas generally associated with hotspots. The RST is an A-type, crystal-poor rhyolite (Streck and Grunder, 1995; 1997). Applying the model for viscosity of volatile-bearing melts developed by Giordano et al. (2008) to RST HSRs under the same temperature (800°C) conditions and water contents (3 wt% H2O), there is little variability among HSRs (Figure 12). However, when altering water content from 2–4 wt% from Group E to Group A, melt viscosities significantly increase from Group A (105.45 Pa s) to Group E (106.60 Pa s). When viscosities are calculated using average storage temperatures for each Group and increasing water content 2–4 wt% from Group E to Group A, viscosities increase overall from Group A (105.40 Pa s) to Group E (105.60 Pa s), and all viscosities are <106 Pa s. However, Group C has the lowest viscosity of 105.29 Pa s. Additionally, like water content, increased concentrations of fluorine will decrease magma viscosity (Wallace and Anderson, 2015). Streck and Grunder (1997) report high fluorine concentrations in several biotite grains found in Groups B, D, and E. Though the source of these sparse biotite grains is not certain, if they are part of the magma system and were not inherited during eruption, elevated fluorine contents in these biotites would reflect elevated fluorine contents of the magma, corroborating the low viscosities calculated for RST HSRs. No fluorine concentrations have been reported for RST HSR magmas, so we do not enter any fluorine contents in our viscosity calculations. These parameters further validate a model like that proposed by Streck and Grunder (1995; 1997), where crystallization can occur around all margins of the magma chamber, and a model still seems plausible where each HSR develops from one another primarily through crystal fractionation, and density differences result in convection occurring within and not between compositional layers in a single magma chamber (Figure 13). This model would also agree with the lack of country rock and granitic lithic fragments found within the RST.
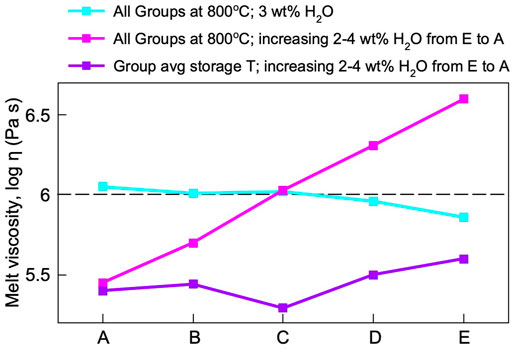
FIGURE 12. Melt viscosity modeling at various temperatures and water contents for Rattlesnake Tuff (RST) high-silica rhyolites (HSRs) and the viscosity calculator by Giordano et al. (2008). Viscosities calculated using Group average storage temperatures and decreasing water content from 4-2wt% H2O from Group A to Group E are interpreted as the most accurate viscosity estimates. The dashed line represents 106 Pascals, which is the estimated limit of viscosities for large-volume, high-temperature, crystal-poor rhyolites to experience uninhibited crystal-melt segregation in the process of fractional crystallization.
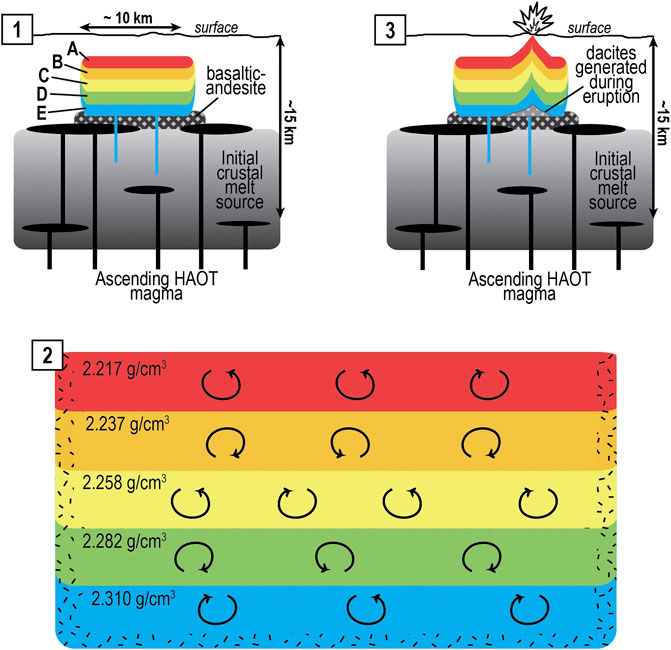
FIGURE 13. A single, density-stratified, meromictic magma chamber to consider for the Rattlesnake Tuff magma configuration, a similar model to the one proposed by Streck and Grunder (1995; 1997; 1999; 2008). (1) RST HSR Group E forms from partial melting of regional mafic crust. Other HSR Group magmas develop through episodes of crystal fractionation, where one more evolved rhyolite develops from the fractionated product of the less evolved rhyolite before it. (2) HSR magma layers convect within layers but remain unmixed between compositional layers due to sufficient density differences. (3) These density boundaries are disturbed during eruption, where all HSR Groups erupt together, and dacite magmas are likely generated from mixing of Group E and underplated enriched basaltic andesite. Labeled densities are those calculated using average storage temperatures (Figure 8), decreasing storage pressure 210–150 MPa from Group E to Group A, and increasing water content 2–4 wt% from Group E to Group A.
Studies such as Grunder et al. (1987) have calculated Rayleigh numbers to determine whether a compositionally heterogeneous magma chamber will convect based on parameters like thickness, density, and viscosity of the different magmas. Grunder et al. (1987) states that convection will occur within magma layers when the Rayleigh number exceeds the critical value of 2000 (Sleep and Langen, 1981; Christiansen, 1985). Rayleigh numbers were calculated for Groups A, B, C, and D using our calculated densities, temperatures, and viscosities, and using the thermal diffusivity value for high-silica rhyolites of 6.55 × 10⁻⁷ m2/s from Romine et al. (2012). Rayleigh numbers were >2000 when thicknesses exceeded 1.1 m. Inferring a magma chamber diameter of 15 km and chamber volume of 300 km3 from Streck and Grunder (1995), the thickness of the entire chamber would be ∼1.7 km or ∼1700 m. If assuming all five HSR magma layers are the same thickness, each layer would be ∼340 m thick. These calculations imply that convection must have occurred within the RST magma system. If the magmas lie juxtaposed within the same storage zone, convection would have had to occur within each layer and not between layers to produce the banded HSR pumices shortly prior to and during eruption.
In this model similar to Streck and Grunder (1995; 1997) where RST magmas are residing in a single storage zone (Figure 13), all HSR magmas are drawn up together during eruption. Boundaries between HSR Group magmas are disturbed, but magmas only mingle with little to no physical mixing. Magmas erupting through ring fractures allowed for simultaneous evacuation of all magma compositions, resulting in the observed range of homogeneous, single-composition pumices to pumices with multiple band compositions in a variety of arrangements.
4.2.2 Alternatives to Consider
Hildreth (2004) described several crystal-poor HSRs of the southeastern cluster of Long Valley Caldera that erupted over a span of ∼75 kyr as more likely a product of extraction from a felsic, crystal-rich mush, because of the euhedral nature of the small, sparse phenocrysts and the lack of xenocrysts or any signs of resorption textures. Similarly, effusive, compositionally distinct rhyolites at Yellowstone have erupted over a period 100–200 kyr within the earlier caldera (Girard and Stix, 2010). Rhyolite centers can erupt distinct rhyolites over short periods within a restricted area, and it is known that complex ignimbrites can preserve evidence for evacuating multiple magmatic systems including distinct rhyolites that were tapped from different parts of the caldera (Swallow et al., 2019).
So, we must consider the possibility that the compositional trend of RST HSRs is not a liquid line as a result of fractionation, but instead, each HSR is generated independently and that smooth compositional trends of the HSR are fortuitous, yet solely due to different sources. For example, Metz and Mahood (1991) ascribe significant trace element variability among rhyolite lava compositions from Glass Mountain and the Long Valley Caldera magma system to rhyolites developing with variable degrees of crystal fractionation and partial melts of upper crust. We have modeled what batch melting would produce from various compositions known to reside in the regional crust (Figure 14). Batch melting of Oligocene dacites, Hunter Creek Basalt, or Upper Steens Basalt can produce Group A compositions. Batch melting of Oligocene dacites can possibly produce Group B (F = 25–30%), C (F = 30–45%), D (F = 30–50%), and E (F = 40–60%). Batch melting of Hunter Creek basalt can possibly produce Groups B (F = 50–55%) and C (F = 55–65%), but not Groups D and E. Batch melting of Upper Steens Basalt can possibly produce Groups C (F = 40–45%), D (F = 40–50%), and E (Streck, 2002), but not B. Batch melting of various types of crustal and terrane rocks can produce Group A (F = 10–30%), B (F = 10–40%), C (F = 40–50%), and D (F = 15–45%), but it is difficult to produce Group E from batch melting of any of these crustal rocks. Overall, these results suggest, from a mathematical standpoint, that HSR Groups can develop independently from each other, and it lends to the possibility that the most evolved RST HSRs can come from fractional crystallization of a granitic mush (as potentially represented by the felsic crust in Figure 15).
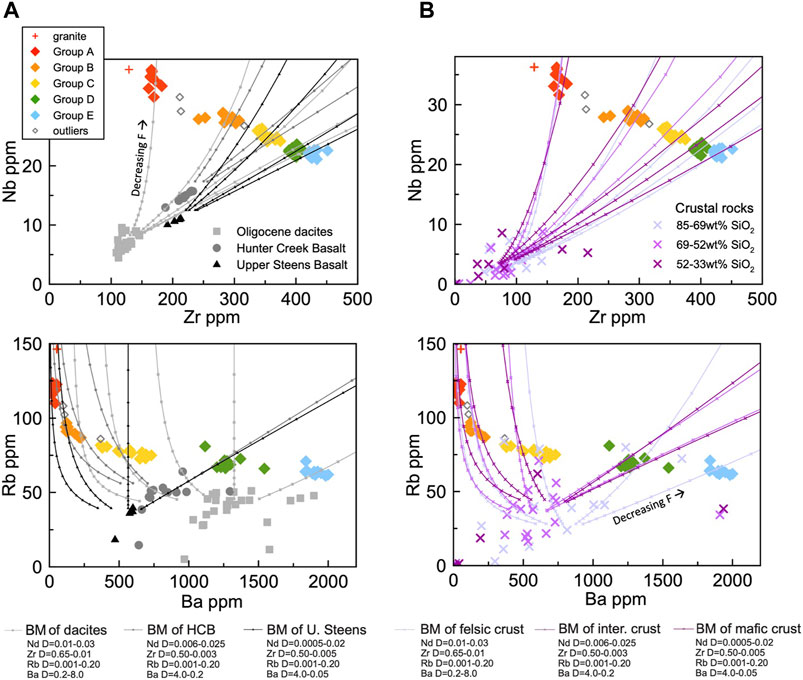
FIGURE 14. Batch melting modeling of various rocks that reside within the crust around the Rattlesnake Tuff magma storage system to determine whether individual high-silica rhyolite Groups can form independently from each other rather than as a liquid line. D values for each element were manipulated until a composition of a HSR Group was achieved. Melt fraction (F) for each model ranges from 0.85 to 0.05 in increments of 0.05. (A) Batch melting of regional Oligocene dacites (Isom and Streck, 2016; Cruz and Streck, 2017; Streck, unpub. data), Hunter Creek Basalt (Webb et al., 2018), and Upper Steens Basalt (Moore et al., 2018). (B) Batch melting of various regional crustal and terrane rocks, divided by felsic, intermediate, and mafic (Steiner and Streck, 2013; Streck, unpub. data).
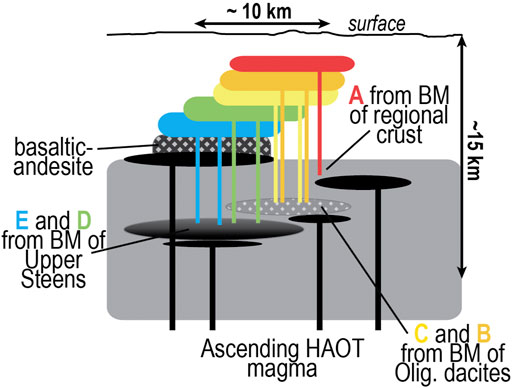
FIGURE 15. A magma configuration model to generate the Rattlesnake Tuff (RST) high-silica rhyolite (HSR) Groups where each HSR magma is generated independently from one another, based on potential batch melting or crystal fractionation sources. In this scenario, Group E and D magmas come from batch melting of Upper Steens Basalts, Group C and B magmas come from batch melting of Oligocene dacites, and Group A magma comes from batch melting of felsic regional crust. Density differences would be great enough to allow one more evolved, higher-silica magma to buoyantly ascend through a less evolved, lower-silica magma. Density differences allow these HSR magmas to reside juxtaposed to one another in the crust and continue to fractionate without mixing between layers, and compositional boundaries are disturbed during eruption.
If these magmas can be produced from various sources in the crust, one must explain how they become arranged in order to remain compositionally isolated but eventually erupt together. Considering the possible potential sources of each HSR from batch melt modeling, we have put forth an alternative model where rhyolites develop independently from one another based on known variabilities within the regional crust during this time (Figure 15). In this scenario Group E and D magmas come from batch melting of Upper Steens Basalt, Group C and B magmas could come from batch melting of Oligocene dacites, and Group A magma comes from batch melting of felsic regional crust. Eventually, we would still need a single density-stratified magma chamber that was assembled by HSR originating from their respective source likely in sequence but where density differences allow these HSR magmas to reside juxtaposed to one another in the crust and continue to crystallize the equilibrium mineral assemblage that we observe without mixing between layers. This model would involve magmas eventually residing in a single holding zone with compositional boundaries mainly disturbed during eruption. In this alternative model, the focus is not the feasibility of generating each rhyolite from a distinct source but what conditions keep rhyolite magmas from erupting and instead favoring them to assemble into a contiguous crystal-poor magma reservoir.
As in the model where RST HSRs reside within a single storage zone prior to eruption, these alternative models must also involve boundaries between HSR Groups mingling with little to no physical mixing. Evacuation of all HSRs through the caldera ring fractures rather than a single vent during eruption would allow for ejection of homogeneous magmas and multiple magmas in different portions of the vent structure, as observed by Streck and Grunder (1995; 1997).
5 Conclusion
Geochemical and statistical analysis from this study confirms the Rattlesnake Tuff (RST) high-silica rhyolite (HSR) is composed of five compositionally distinct, increasingly evolved HSR magmas that compose the RST, with compositional gaps between Groups, as stated in Streck and Grunder (1995; 1997), and that the most significant parameters in distinguishing these Groups are variations in Ba, Eu/Eu*, Eu, FeO*, Hf, and Zr. We have also verified conclusions from Streck and Grunder (1995; 1997) that intermediate Groups are not a result of mixing of endmember Groups.
Individual banded pumices can contain up to four different Group compositions, and compositions are sometimes not consecutive (e.g., A, C, and E). Calculated wet-liquidus temperatures, storage temperatures, and storage pressures indicate that these HSRs were stored in similar conditions (∼6.1–7.5 km depth; ∼805–869°C).
Crystal fractionation trends, similar storage temperatures and pressures, and lack of crystal-rich inclusions, granitic inclusions, or country rock corroborate existing models for RST HSRs that involve a single, density-stratified magma chamber more so than models where HSR magmas are separated by country rock or multiple crystal-rich frameworks. When temperature and pressure decrease and water content increases from Groups E-A, the density difference between adjacent Groups is significant enough to prevent convection between layers of different HSRs in a single chamber. RST HSR magma viscosities are low enough to allow for uninhibited crystal-liquid separation, where differentiation can be primarily focused on the floor and sides of the magma chamber. Density and compositional boundaries would be disturbed during eruption, allowing magmas to mingle with minimal mixing during eruption to produce both the homogeneous and banded pumices that contain multiple HSR compositions.
Alternatively, if HSRs do not represent a liquid line, it is possible to generate RST HSRs through batch melting of older plutonic material and other types of country rock within the regional crust. In this scenario, Group E and D magmas come from batch melting of Upper Steens Basalts, Group C and B magmas come from batch melting of Oligocene dacites, and Group A magma comes from batch melting of felsic regional crust. Density differences would be great enough to allow one more evolved, higher-silica magma to buoyantly ascend through a less evolved, lower-silica magma. Density differences allow these HSR magmas to reside juxtaposed to one another in the crust and continue to fractionate without mixing between layers, and compositional boundaries would be disturbed during eruption, generating the observed banded HSR pumices.
Whether these rhyolites are generated primarily via crystal fractionation from one another, are batch melts from different sources within the regional crust, or are some combination of both processes, these data suggest that a feasible magma configuration for RST HSRs must ultimately involve the five HSRs becoming juxtaposed in the same storage zone prior to eruption. Water content and density variations are clearly a critical component in keeping these HSR magmas from mixing prior to eruption.
Data Availability Statement
The original contributions presented in the study are included in the article/Supplementary Material, further inquiries can be directed to the corresponding author.
Author Contributions
VS was the primary author of this manuscript and developed all figures, tables, and supplemental information. VS prepared all new samples for analyses and performed all calculations and statistical analyses. MS provided samples and data from Streck and Grunder (1997), and MS helped VS conduct fieldwork to find new samples for this study. MS reviewed and provided feedback for writing done by VS.
Funding
This work was supported through National Science Foundation grant EAR-1220676 to Streck and internal funding from the Portland State University Geology Department.
Conflict of Interest
The authors declare that the research was conducted in the absence of any commercial or financial relationships that could be construed as a potential conflict of interest.
Publisher’s Note
All claims expressed in this article are solely those of the authors and do not necessarily represent those of their affiliated organizations, or those of the publisher, the editors and the reviewers. Any product that may be evaluated in this article, or claim that may be made by its manufacturer, is not guaranteed or endorsed by the publisher.
Acknowledgments
Thank you to editor Victoria Smith and two reviewers for their helpful feedback. We are grateful to Anita Grunder for valuable insight and feedback for this project. Thank you to data scientist Daniel Pearl for help with coding on R Studio for statistical analyses and to Ilya Bindemann and the lab at University of Oregon for the quick turnaround of δ18O results. Publication of this article in an open access journal was funded by the Portland State University Library's Open Access Fund.
Supplementary Material
The Supplementary Material for this article can be found online at: https://www.frontiersin.org/articles/10.3389/feart.2022.841279/full#supplementary-material
References
Arakawa, Y., Endo, D., Oshika, J., Shinmura, T., and Ikehata, K. (2019). High-silica Rhyolites of Niijima Volcano in the Northern Izu-Bonin Arc, Japan: Petrological and Geochemical Constraints on Magma Generation and Supply. Lithos 330-331, 223–237. doi:10.1016/j.lithos.2019.02.014
Bachmann, O., and Bergantz, G. W. (2004). On the Origin of Crystal-Poor Rhyolites: Extracted from Batholithic Crystal Mushes. J. Petrology 45, 1565–1582. doi:10.1093/petrology/egh019
Bégué, F., Deering, C. D., Gravley, D. M., Kennedy, B. M., Chambefort, I., Gualda, G. A. R., et al. (2014). Extraction, Storage and Eruption of Multiple Isolated Magma Batches in the Paired Mamaku and Ohakuri Eruption, Taupo Volcanic Zone, New Zealand. J. Pet. 55, 1653–1684. doi:10.1093/petrology/egu038
Bindeman, I. N., Ponomareva, V. V., Bailey, J. C., and Valley, J. W. (2004). Volcanic Arc of Kamchatka: A Province With High-δ18O Magma Sources and Large-Scale 18O/16O Depletion of the Upper Crust. Geochimica et Cosmochimica Acta 68, 841–865. doi:10.1016/j.gca.2003.07.009
Boehrer, B., and Schultze, M. (2008). Stratification of Lakes. Rev. Geophys. 46, 1–27. doi:10.1029/2006RG000210
Bolte, T., Holtz, F., Almeev, R., and Nash, B. (2015). The Blacktail Creek Tuff: an Analytical and Experimental Study of Rhyolites from the Heise Volcanic Field, Yellowstone Hotspot System. Contrib. Mineral. Pet. 169, 1–24. doi:10.1007/s00410-015-1112-0
Camp, V. E. (2019). Plume-modified Mantle Flow in the Northern Basin and Range and Southern Cascadia Back-Arc Region since Ca. 12 Ma. Geology 47, 695–699. doi:10.1130/g46144.1
Camp, V. E., Ross, M. E., and Hanson, W. E. (2003). Genesis of Flood Basalts and Basin and Range Volcanic Rocks from Steens Mountain to the Malheur River Gorge, Oregon. Geol. Soc. Am. Bull. 115, 105–128. doi:10.1130/0016-7606(2003)115<0105:gofbab>2.0.co;2
Camp, V. E., and Ross, M. E. (2004). Mantle Dynamics and Genesis of Mafic Magmatism in the Intermontane Pacific Northwest. J. Geophys. Res. 109, 1–14. doi:10.1029/2003JB002838
Caricchi, L., Annen, C., Blundy, J., Simpson, G., and Pinel, V. (2014). Frequency and Magnitude of Volcanic Eruptions Controlled by Magma Injection and Buoyancy. Nat. Geosci. 7, 126–130. doi:10.1038/ngeo2041
Cashman, K. V., and Giordano, G. (2014). Calderas and Magma Reservoirs. J. Volcanol. Geotherm. Res. 288, 28–45. doi:10.1016/j.jvolgeores.2014.09.007
Chiba, H., Chacko, T., Clayton, R. N., and Goldsmith, J. R. (1989). Oxygen Isotope Fractionations Involving Diopside, Forsterite, Magnetite, and Calcite: Application to Geothermometry. Geochimica Cosmochimica Acta 53, 2985–2995. doi:10.1016/0016-7037(89)90174-9
Christensen, U. R. (1985). Thermal Evolution Models for the Earth. J. Geophys. Res. 90, 2995–3008. doi:10.1029/jb090ib04p02995
Christiansen, E. H. (2005). Contrasting Processes in Silicic Magma Chambers: Evidence from Very Large Volume Ignimbrites. Geol. Mag. 142, 669–681. doi:10.1017/S0016756805001445
Christiansen, R. L., Foulger, G. R., and Evans, J. R. (2002). Upper-mantle Origin of the Yellowstone Hotspot. Geol. Soc. Am. Bull. 114, 1245–1256. doi:10.1130/0016-7606(2002)114<1245:umooty>2.0.co;2
Cooper, G. F., Wilson, C. J. N., Millet, M.-A., Baker, J. A., and Smith, E. G. C. (2012). Systematic Tapping of Independent Magma Chambers during the 1Ma Kidnappers Supereruption. Earth Planet. Sci. Lett. 313-314, 23–33. doi:10.1016/j.epsl.2011.11.006
Cooper, G. F., Wilson, C. J. N., Millet, M. A., and Baker, J. A. (2016). Generation and Rejuvenation of a Supervolcanic Magmatic System: A Case Study From Mangakino Volcanic Centre, New Zealand. J. Petrol. 57, 1135–1170. doi:10.1093/petrology/egw035
Cruz, M. A., and Streck, M. J. (2017). Geologic Map of the Calamity Butte Quadrangle. Oregon: USGS EDMAP project. Available at: https://ngmdb.usgs.gov/Prodesc/proddesc_109645.htm.
Ellis, B. S., and Wolff, J. A. (2012). Complex Storage of Rhyolite in the Central Snake River Plain. J. Volcanol. Geotherm. Res. 211-212, 1–11. doi:10.1016/j.jvolgeores.2011.10.002
Ford, M. T., Grunder, A. L., and Duncan, R. A. (2013). Bimodal Volcanism of the High Lava Plains and Northwestern Basin and Range of Oregon: Distribution and Tectonic Implications of Age-Progressive Rhyolites. Geochem. Geophys. Geosyst. 14, 2836–2857. doi:10.1002/ggge.20175
Giordano, D., Russell, J. K., and Dingwell, D. B. (2008). Viscosity of Magmatic Liquids: A Model. Earth Planet. Sci. Lett. 271, 123–134. doi:10.1016/j.epsl.2008.03.038
Girard, G., and Stix, J. (2010). Rapid Extraction of Discrete Magma Batches from a Large Differentiating Magma Chamber: The Central Plateau Member Rhyolites, Yellowstone Caldera, Wyoming. Contrib. Mineral. Pet. 160, 441–465. doi:10.1007/s00410-009-0487-1
Gregg, P. M., De Silva, S. L., Grosfils, E. B., and Parmigiani, J. P. (2012). Catastrophic Caldera-Forming Eruptions: Thermomechanics and Implications for Eruption Triggering and Maximum Caldera Dimensions on Earth. J. Volcanol. Geotherm. Res. 241-242, 1–12. doi:10.1016/j.jvolgeores.2012.06.009
Gregg, P. M., Grosfils, E. B., and de Silva, S. L. (2015). Catastrophic Caldera-Forming Eruptions II: The Subordinate Role of Magma Buoyancy as an Eruption Trigger. J. Volcanol. Geotherm. Res. 305, 100–113. doi:10.1016/j.jvolgeores.2015.09.022
Grunder, A. L., Shamloo, H., and Pendergast, K. (2021). “Ignimbrite Magma Ascent Rate in the Conduit Determined by Diffusion in Banded Pumice: American Geophysical Union Abstracts, No. V33B-08,” in American Geophysical Union Annual Conference, 2021, New Orleans, LA, USA.
Grunder, A. L., Thompson, J. M., and Hildreth, W. (1987). The Hydrothermal System of the Calabozos Caldera, Central Chilean Andes. J. Volcanol. Geotherm. Res. 32, 287–298. doi:10.1016/0377-0273(87)90080-1
Gualda, G. A. R., Ghiorso, M. S., Lemons, R. V., and Carley, T. L. (2012). Rhyolite-MELTS: A Modified Calibration of MELTS Optimized for Silica-Rich, Fluid-Bearing Magmatic Systems. J. Petrology 53, 875–890. doi:10.1093/petrology/egr080
Hart, W. K., Aronson, J. L., and Mertzman, S. A. (1984). Areal Distribution and Age of Low-K, High Alumina Olivine Tholeiitic Magmatism in the Northwestern Great Basin. Geol. Soc. Am. Bull. 95, 185–195. doi:10.1130/0016-7606(1984)95<186:adaaol>2.0.co;2
Hawley, W. B., and Allen, R. M. (2019). The Fragmented Death of the Farallon Plate. Geoph. Res. Let. 46, 7386. doi:10.1029/2019GL083437
Hildreth, W. (2004). Volcanological Perspectives on Long Valley, Mammoth Mountain, and Mono Craters: Several Contiguous but Discrete Systems. J. Volcanol. Geotherm. Res. 136, 169–198. doi:10.1016/j.jvolgeores.2004.05.019
Hildreth, W., and Wilson, C. J. N. (2007). Compositional Zoning of the Bishop Tuff. J. Pet. 48, 951–999. doi:10.1093/petrology/egm007
Holtz, F., Pichavant, M., Barbey, P., and Johannes, W. (1992). Effects of H2O on Liquidus Phase Relations in the Haplogranite System at 2 and 5 Kbar. Am. Mineral. 77, 1223–1241.
Hooper, P. R., Binger, G. B., and Lees, K. R. (2002). Ages of the Steens and Columbia River Flood Basalts and Their Relationship to Extension-Related Calc-Alkalic Volcanism in Eastern Oregon. Geol. Soc. Am. Bull. 114, 43–50. doi:10.1130/0016-7606(2002)114<0043:aotsac>2.0.co;2
Iacovino, K., and Till, C. B. (2019). DensityX: A Program for Calculating the Densities of Magmatic Liquids up to 1,627 C and 30 kbar. Volcanica 2, 1–10. doi:10.30909/vol.02.01.0110
Isom, S. I., and Streck, M. J. (2016). Geologic Map of the Telephone Butte Quadrangle. Oregon: USGS EDMAP project. Available at: https://ngmdb.usgs.gov/Prodesc/proddesc_109646.htm.
Isom, S. L. (2017). Compositional and Physical Gradients in the Magmas of the Devine Canyon Tuff, Eastern Oregon: Constraints for Evolution Models of Voluminous High-Silica Rhyolites. MS Thesis (Portland, OR: Portland State University).
Johnson, D., Hooper, P., and Conrey, R. (1999). XRF Method XRF Analysis of Rocks and Minerals for Major and Trace Elements on a Single Low Dilution Li-Tetraborate Fused Bead. Adv. X-ray Analysis 41, 843–867.
Johnson, J. A., and Grunder, A. L. (2000). The Making of Intermediate Composition Magma in a Bimodal Suite: Duck Butte Eruptive Center, Oregon, USA. J. Volcanol. Geotherm. Res. 95, 175–195. doi:10.1016/s0377-0273(99)00125-0
Jordan, B. T. (2002). Basaltic Volcanism and Tectonics of the High Lava Plains, Southeastern Oregon. PhD Dissertation (Corvallis: Oregon State University), 235.
Jordan, B. T., Grunder, A. L., Duncan, R. A., and Deino, A. L. (2004). Geochronology of Age-Progressive Volcanism of the Oregon High Lava Plains: Implications for the Plume Interpretation of Yellowstone: Journal of Geophysical Research. Solid earth. 109, 1–19. doi:10.1029/2003jb002776
Jorgenson, C., Higgins, O. J., Petrelli, M., Bégué, F., and Caricchi, L. (2021). A Machine Learning Based Approach to Clinopyroxene Thermobarometry: Model Optimization and Distribution for Use in Earth Sciences. J. Geophys. Res. Solid Earth 127, e2021JB022904. doi:10.1029/2021JB022904
Lees, K. R. (1994). Magmatic and Tectonic Changes through Time in the Neogene Volcanic Rocks of the Vale Area, Oregon, Northwestern USA. Ph.D. dissert. (Milton Keynes, UK: Open University), 284.
Loewen, M. W., and Bindeman, I. N. (2015). Oxygen Isotope and Trace Element Evidence for Three-Stage Petrogenesis of the Youngest Episode (260–79 ka) of Yellowstone Rhyolitic Volcanism. Contrib. Mineral. Petrol. 170, 1–25. doi:10.1007/s00410-015-1189-5
MacLean, J. W. (1994). Geology and Geochemistry of Juniper Ridge, Horsehead Mountain and Burns Butte: Implications for the Petrogenesis of Silicic Magma on the High Lava Plains, Southeastern Oregon. M.S. Thesis (Corvallis: Oregon State University), 153.
MacLeod, N. S., Walker, G. W., and McKee, E. H. (1976). Geothermal Significance of Eastward Increase in Age of Upper Cenozoic Rhyolitic Domes in Southeastern Oregon. USGS Numbered Ser. 1, 465–474. doi:10.3133/ofr75348
McKee, E. H., and Walker, G. W. (1976). Potassium-argon Ages of Late Cenozoic Silicic Volcanic Rocks, Southeastern Oregon. Isochron. West 15, 37–41.
Metz, J. M., and Mahood, G. A. (1991). Development of the Long Valley, California, Magma Chamber Recorded in Precaldera Rhyolite Lavas of Glass Mountain. Contr Mineral. Pet. 106, 379–397. doi:10.1007/bf00324565
Moore, N. E., Grunder, A. L., and Bohrson, W. A. (2018). The Three-Stage Petrochemical Evolution of the Steens Basalt (Southeast Oregon, USA) Compared to Large Igneous Provinces and Layered Mafic Intrusions. Geosphere 14, 2505–2532. doi:10.1130/ges01665.1
Pierce, K. L., Morgan, L. A., and Saltus, R. W. (2002). “Yellowstone Plume Head: Postulated Tectonic Relations to the Vancouver Slab, Continental Boundaries, and Climate,” in Tectonic and Magmatic Evolution of the Snake River Plain Province. Idaho Geological Survey Bulletin. Editor B. Bonnichsen, 30, 5–33.
Putirka, K. D. (2008). 3. Thermometers and Barometers for Volcanic Systems. Rev. Min. Geochem. 69, 61–120. doi:10.1515/9781501508486-004
Romine, W. L., Whittington, A. G., Nabelek, P. I., and Hofmeister, A. M. (2012). Thermal Diffusivity of Rhyolitic Glasses and Melts: Effects of Temperature, Crystals and Dissolved Water. Bull. Volcanol. 74, 2273–2287. doi:10.1007/s00445-012-0661-6
Sales, H. J. (2018). The Wildcat Creek Tuff, Eastern Oregon: Co-eruption of Crystal-poor Rhyolite and Fe-Rich Andesite with Implication for Mafic Underpinnings to Voluminous A-type Rhyolites. MS Thesis (Portland: Portland State University), 151.
Shane, P., Nairn, I. A., Martin, S. B., and Smith, V. C. (2008). Compositional Heterogeneity in Tephra Deposits Resulting from the Eruption of Multiple Magma Bodies: Implications for Tephrochronology. Quat. Int. 178, 44–53. doi:10.1016/j.quaint.2006.11.014
Sleep, N. H., and Langan, R. T. (1981). Thermal Evolution of the Earth: Some Recent Developments. Adv. Geophys. 23, 1–23. doi:10.1016/s0065-2687(08)60329-5
Steiner, A., and Streck, M. J. (2013). The Strawberry Volcanics: Generation of 'orogenic' Andesites from Tholeiite within an Intra-continental Volcanic Suite Centred on the Columbia River Flood Basalt Province, USA. Geol. Soc. Lond. Spec. Publ. 385, 281–302. doi:10.1144/SP385.12
Streck, M. J., and Grunder, A. L. (1995). Crystallization and Welding Variations in a Widespread Ignimbrite Sheet; the Rattlesnake Tuff, Eastern Oregon, USA. Bull. Volcanol. 57, 151–169. doi:10.1007/BF00265035
Streck, M. J., and Grunder, A. L. (1997). Compositional Gradients and Gaps in High-Silica Rhyolites of the Rattlesnake Tuff, Oregon. J. Petrol. 38, 133–163. doi:10.1093/petrology/38.1.133
Streck, M. J., and Grunder, A. L. (1999). Enrichment of Basalt and Mixing of Dacite in the Rootzone of a Large Rhyolite Chamber: Inclusions and Pumices from the Rattlesnake Tuff, Oregon. Contributions Mineralogy Petrology 136, 193–212. doi:10.1007/s004100050532
Streck, M. J., and Grunder, A. L. (2008). Phenocryst-poor Rhyolites of Bimodal, Tholeiitic Provinces: The Rattlesnake Tuff and Implications for Mush Extraction Models. Bull. Volcanol. 70, 385–401. doi:10.1007/s00445-007-0144-3
Streck, M. J. (2002). Partial Melting to Produce High-Silica Rhyolites of a Young Bimodal Suite: Compositional Constraints Among Rhyolites, Basalts, and Metamorphic Xenoliths from the Harney Basin, Oregon. Int. J. Earth Sci. Geol. Rundsch) 91, 583–593. doi:10.1007/s00531-001-0246-7
Swallow, E. J., Wilson, C. J. N., Charlier, B. L. A., and Gamble, J. A. (2019). The Huckleberry Ridge Tuff, Yellowstone: Evacuation of Multiple Magmatic Systems in a Complex Episodic Eruption. J. Pet. 60, 1371–1426. doi:10.1093/petrology/egz034
Swenton, , and Streck, (Forthcoming 2022). Filling Critical Gaps in the Space-Time Record of High Lava Plains and Co-Columbia River Basalt Group Rhyolite Volcanism. Geol. Soc. Am. Bull..
Szymanowski, D., Ellis, B. S., Wotzlaw, J.-F., and Bachmann, O. (2019). Maturation and Rejuvenation of a Silicic Magma Reservoir: High-Resolution Chronology of the Kneeling Nun Tuff. Earth Planet. Sci. Lett. 510, 103–115. doi:10.1016/j.epsl.2019.01.007
Trench, D., Meigs, A., and Grunder, A. (2013). Corrigendum to “Termination of the Northwestern Basin and Range Province into a Clockwise Rotating Region of Transtension and Volcanism, Southeast Oregon” [Journal of Structural Geology. J. Struct. Geol. 3948, 52162–65163. doi:10.1016/j.jsg.2012.12.002
Trench, D., Meigs, A., and Grunder, A. (2012). Termination of the Northwestern Basin and Range Province into a Clockwise Rotating Region of Transtension and Volcanism, Southeast Oregon. J. Struct. Geol. 39, 52–65. doi:10.1016/j.jsg.2012.03.007
Ukstins Peate, I., Kent, A. J. R., Baker, J. A., and Menzies, M. A. (2008). Extreme Geochemical Heterogeneity in Afro-Arabian Oligocene Tephras: Preserving Fractional Crystallization and Mafic Recharge Processes in Silicic Magma Chambers. Lithos 102, 260–278. doi:10.1016/j.lithos.2007.08.015
Walker, G. W. (1974). Some Implications of Late Cenozoic Volcanism to Geothermal Potential in the High Lava Plains of South-Central Oregon. Ore Bin. 36, 109–119. doi:10.3133/ofr741121
Wallace, P., and Anderson, A. T. (2015). “Volatiles in Magmas,” in Encyclopedia of Volcanoes. Editor H. Sigurdsson (Cambridge, MA, USA: Academic Press), 149–154.
Keywords: high-silica rhyolite, large silicic magma reservoir, caldera, heterogeneous ignimbrite, magma storage, magma configurations
Citation: Swenton VM and Streck MJ (2022) Pre-Eruptive Magma Configurations and Petrogenetic Relationships of the Rattlesnake Tuff, Oregon–Insights From Spectacularly Banded High-Silica Rhyolite Pumices. Front. Earth Sci. 10:841279. doi: 10.3389/feart.2022.841279
Received: 22 December 2021; Accepted: 19 April 2022;
Published: 09 May 2022.
Edited by:
Victoria C. Smith, University of Oxford, United KingdomReviewed by:
Phil Shane, The University of Auckland, New ZealandPaul Anthony Wallace, Université libre de Bruxelles, Belgium
Copyright © 2022 Swenton and Streck. This is an open-access article distributed under the terms of the Creative Commons Attribution License (CC BY). The use, distribution or reproduction in other forums is permitted, provided the original author(s) and the copyright owner(s) are credited and that the original publication in this journal is cited, in accordance with accepted academic practice. No use, distribution or reproduction is permitted which does not comply with these terms.
*Correspondence: Vanessa M. Swenton, dnN3ZW50b25AcGR4LmVkdQ==
 Vanessa M. Swenton
 Martin J. Streck