 Wenbiao Zhang
 Zhiliang He1,2*
95% of researchers rate our articles as excellent or good
Learn more about the work of our research integrity team to safeguard the quality of each article we publish.
Find out more
ORIGINAL RESEARCH article
Front. Earth Sci. , 03 February 2022
Sec. Structural Geology and Tectonics
Volume 10 - 2022 | https://doi.org/10.3389/feart.2022.840661
This article is part of the Research Topic Advances in the Study of Natural Fractures in Deep and Unconventional Reservoirs View all 29 articles
As a special type of fracture-cavity carbonate reservoir, fault/fracture-controlled paleokarsts are affected by large strike-slip faults with various storage spaces, irregular geometry, and stochastic spatial distribution, which brings new challenges to their 3D quantitative characterization and geological modeling. Based on multi-scale research data, a hierarchical scheme of a fault-controlled paleokarst is established for the Tahe oilfield, and then a hierarchical modeling method for the paleokarst is proposed based on the principles of hierarchical constraint and genetic control. The results show that the fault-controlled paleokarst hierarchy is divided into four levels according to genesis and scale. These are the strike-slip fault impact zone, the fault-controlled external paleokarst envelope, the fault-controlled internal paleokarst architecture, and the internal karst cave fillings. The strike-slip fault impact zone model is established using deterministic data of the main fault, secondary fault, envelope range, and key geological horizons obtained from seismic interpretation. Based on the seismic FL (Fault Likelihood) attribute, the external envelope model of the fault-controlled paleokarst is established using the deterministic method through automatic attribute segmentation and drilling calibration. With the constraint of the external envelope, the internal architectural elements are classified and modeled. A large-scale karst cave model and mesoscale discrete fracture distribution model are established using the deterministic method based on the seismic texture property and seismic ant property truncation. Taking well data as conditional data and seismic-geological probability cubes as constraint data, the sequential indication simulation and object-based marked point process simulation methods are used to obtain the model of the dissolution pores distribution and the model of the discrete small-scale fractures distribution, respectively. Finally, a typical fault-controlled paleokarst reservoir in the TP area of the Tahe oilfield is taken as an example to test the above modeling method; the 3D integrated model developed in this study can reflect the spatial hierarchy of the fault-controlled paleokarst carbonate reservoir.
Fault-controlled paleokarst reservoirs are a special type of fractured-cavernous reservoirs, in which the caverns and faults/fractures provide the main reservoir space. Unlike porous and fractured carbonate reservoirs, fractured-cavernous reservoirs are more complex, heterogeneous, and stochastic, which makes them difficult to characterize (Loucks, 1999; Loucks et al., 2004; Gong et al., 2021). The exploration and development of the Tahe Oilfield in recent years have confirmed the presence of this kind of reservoir. About 75% of the high-yield wells in the Tahe area are distributed along the large faults that controls the paleokarst reservoirs (Chen et al., 2010; Gong et al., 2019).
Three-dimensional geological modeling is a key link in the characterization of oil and gas reservoirs, and accurate geological models are the basis for the effective management of these reservoirs. Current geological modeling technology is relatively mature for its application to conventional clastic rock reservoirs and porous carbonate reservoirs. However, the fractured-cavernous type of carbonate reservoirs is affected by strong reformation in the later stage. Multi-scale discrete pore types are mixed distributed, and the heterogeneity is extremely strong. The modeling of this type of reservoir is still in the development stage. However, because of the presence of the unique geological conditions of the Tahe oilfield reservoir in China, the modeling of carbonate fracture-cavity reservoirs began early in China. Many scholars have achieved valuable modeling results after more than 10 years of research. Some of the models of carbonate fracture-cavity reservoirs proposed include seismic-based reservoir classification modeling (Hou et al., 2012; Hou et al., 2013; Ma et al., 2013), multi-constrained random modeling (Hu et al., 2013; Lv et al., 2017; Liu et al., 2018), combined deterministic and random modeling under karst model constraints (Zhang et al., 2007; Zhao et al., 2008; Liu and Wang, 2012; Lu et al., 2012; Li et al., 2016; Li et al., 2016), and multi-point geostatistical modeling with seismic facies or large-scale caverns as training images (Zeng et al., 2010; Zhao et al., 2011; Zeng et al., 2013). The above models have almost accurately modeled the distribution and fusion of multi-type and multi-scale reservoirs from different perspectives; karst landforms and karst belt constraints have been introduced, and models of the epigenetic karst fractured-cavernous reservoirs in the main area of the Tahe Oilfield have been developed. The concept model has incorporated geological constraints and achieved good results.
Like the fracture-cavity reservoirs in the main Tahe area, fault-controlled paleokarst reservoirs are also affected by multi-phase tectonic movements and multi-phase karstification, and there are multiple types of these reservoirs. The difference with epigenetic karst fractured-cavernous is that the main controlling factors of fault-controlled paleokarsts are large-scale strike-slip faults. However, from the perspective of “genetic modeling,” few studies have been performed to model fault-controlled fractured-cavernous reservoirs. This study aims to create a new geomodeling approach to reveal the strong 3D heterogeneity within fault-controlled paleokarst reservoirs. Taking the TP block in the southern Tahe oilfield as an example, this study establishes three-dimensional geological modeling methods for the fault-controlled paleokarst carbonate reservoir in the study area and creates a 3D model of the reservoir by using outcrop observations, core samples, well logging data, and high-quality 3D seismic data to better reveal the heterogeneity of this type of reservoir. The results are significant for the future exploitation of similar reservoirs in the Tarim Basin.
Located in the Tarim Basin in northwestern China, the Tahe oilfield is the largest marine carbonate oil and gas field in China. The main target formation of this oilfield is Ordovician strata that have a buried depth of more than 5,500 m. The Tahe oilfield is situated on the southwestern slope of the Akekule Arch. The Akekule Arch is located within the Shaya Uplift of the Tarim Basin, which is south of the Kuche Depression, west of the Caohu Sag, and north of the Shuntuo Lower Uplift and the Manjiaer Depression. The Akekule Arch has undergone multiple stages of tectonic movements, including Caledonian, Hercynian, Yanshanian, and Himalayan movements (Figure 1; Yu et al., 2011).
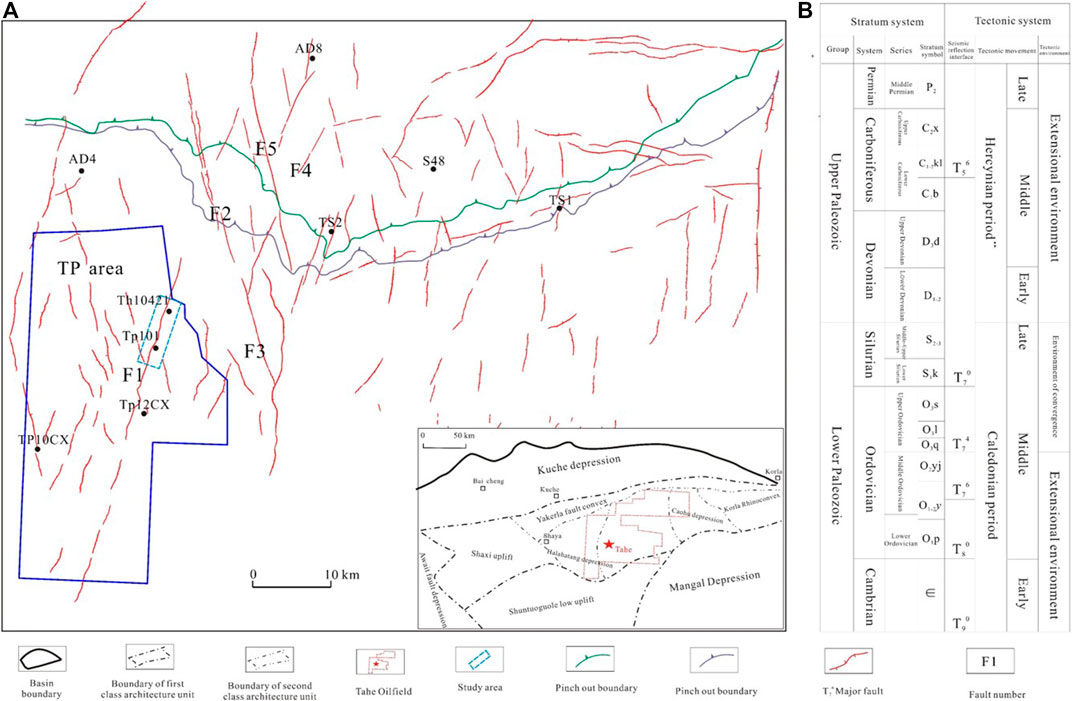
FIGURE 1. Location of study area and comprehensive stratigraphic column. P2—Middle Permian; C2x—Upper Carboniferous Xiaohaizi Formation; C1kl—Lower Carboniferous Karasayi Formation; C1b—Lower Carboniferous Bachu Formation; D3d—Upper Devonian Donghetang Formation; D1-2— Middle-Lower Devonian; S2-3—Middle-Upper Silurian; S1k—Lower Silurian Kepingtag Formation; O3s—Upper Ordovician Sangtam Formation; O3l—Upper Ordovician Lianglitage Formation; O3q—Upper Ordovician Qalbak Formation; O2yj—Middle Ordovician Yijianfang Formation; O1-2y—Middle and Lower Ordovician Yingshan Formation; O1p—Lower Ordovician Penglaiba Formation; ∈—Cambrian; T65—The reflection wave interface of the Carboniferous standard limestone (bimodal limestone) top; T7 0—the reflection wave interface of the Ordovician top; T74—the reflection wave interface of the unconformity caused by the mid-Caledonian tectonic movement; T8 0—the reflection wave interface of the Cambrian top; T9 0-the reflection wave interface of the Sinian top; F1-TP12CX fault; F2-S99 fault; F3-Langa fault; F4-T708 fault; F5-T707 fault. (A) Structural location map of Tahe oilfield; (B) comprehensive stratigraphic histogram of Tarim Basin.
Within this oilfield, hydrocarbon reservoirs have been identified in Triassic, Carboniferous, Devonian, and Ordovician strata, and oil production from Ordovician paleokarst reservoirs accounts for approximately 73% of the total oil production from this oilfield (Dou, 2014). From the bottom to the top, these Ordovician strata are divided into the Penglaiba Formation (O1p, which is predominantly dolomite), the Yingshan Formation (O1-2ys, limestone), the Yijianfang Formation (O2yj, predominantly limestone), the Querbake Formation (O3q, knotty limestone containing mud), the Lianglitage Formation (O3l, argillaceous limestone and grainstone), and the Sangtamu Formation (O3s, mudstone and limestone) (Chen et al., 2010; Qi et al., 2010).
The Akekule Arch also underwent a series of erosional episodes and many NE or NW trending large-scale deep-seated faults were formed during the Caledonian and Hercynian movements. This caused the remaining Ordovician formations to become uneven and established an unconformity interface (T74) between the Middle–Lower Ordovician strata and the upper strata. Meanwhile, these events established the morphological diversity of the karstic cavernous systems and created ancient large-scale karst reservoirs, which form the current highly fault-controlled karst reservoirs in the southern region of the Tahe oilfield (Figure 1).
The TP block is located in the southwest of the Tahe Oilfield. There are multiple sets of NNW-NNE trending “X” fault systems of different scales in the area with the TP12CX strike-slip fault being the largest. The TP12CX fault runs through the entire TP block along the NNE direction and extends over 50 km. Typical fault-controlled paleokarst reservoirs are developed and are divided into different segments according to the fault zone and the dynamic production characteristics. Along the TP12CX fault zone, the TP101 unit is selected in this study for modeling (Figure 1).
The case study area (unit TP101) is a typical fault-controlled paleokarst reservoir located along the TP12CX strike-slip fault zone of the TP Block (Figure 1). Over more than 15 years of hydrocarbon exploitation, nearly 40 wells have been drilled in this unit, where the main target zones are the Yijianfang and Yingshan Formations (burial depth of >5,500 m). Imaging logging data (FMI), conventional logging data, a lot of production data, and some core samples have been obtained from individual wells and can be used to characterize the faulted karstic reservoirs. When these data are combined with high-precision 3D seismic data, the delineation of the 3D distribution of the karst reservoir can be effectively determined.
A total length of 70 m of cores was obtained from three representative wells in the study area. These samples were observed and described in detail, with special attention given to the karstic fractures or caverns found to be developing around faults. The field outcrops in the Bachu area underwent similar karstification events during the Caledonian–Hercynian periods as the deeply buried Ordovician paleokarst reservoir within the study area. Studying these outcrops can contribute to a better understanding of the characteristics of fractured caverns. Furthermore, by investigating the karstic development process from typical outcrops, it is possible to qualitatively understand their fault/fracture control relationships and establish a fault-controlled karstic geologic model of the TP Block in the southern Tahe oilfield.
Well data, also called “hard data,” includes descriptions of the cavern type and intervals as well as other physical information. Paleokarst elements and their surrounding host rocks can be analyzed based on their different geophysical features. Using conventional well-logging data (i.e., radioactivity, density, resistivity, and acoustic velocity) calibrated by cores, it is possible to recognize the characteristics of the architecture of paleokarst reservoir elements. In this study, conventional well-logging data obtained from 40 wells were used to identify paleokarst reservoirs, especially large-scale paleokarst reservoirs formed around faults. However, when a well-trajectory intersects with an unfilled cavern, serious leak-off and circulation-loss may lead to early well completion; thus, as a result, only the upper depth of the cavern interval may be recorded.
Three-dimensional seismic datasets play a key role in characterizing the distribution of paleokarst reservoirs. The seismic data used in this study encompasses the entire TP Block, with a bin size of 25 m × 25 m and a sampling interval of 2 ms. The frequency spectra extracted from the target zone ranged from 14 to 37 Hz (average of ∼24 Hz). Consequently, the vertical resolution of the reservoir section was approximately 33 m for the pre-stack seismic processing techniques. Scale measurements of paleokarst reservoirs record strong differences in amplitude (and/or other energy attributes) relative to those of the host rocks. In this study, we introduced the seismic texture attribute to identify the location of the karstic reservoir due to the advantage of its sensitivity to anomalous geological reflections. Large-scale paleokarst reservoirs are displayed as so-called “bright spots” in seismic images; the size of these “bright spots” correlates positively with the scale of the paleokarst reservoir. This information can be used to directly identify large-scale paleokarst reservoirs between single wells.
In the study area, the presence of fault zones and related fractures are key factors affecting the formation of karstic reservoir “sweet spots.” Most tectonic activity here is represented by strike-slip faults, which are difficult to interpret in deeply buried strata. However, by using seismic event breaks and seismic attributes (e.g., coherent and ant tracking attributes), it was possible to analyze the strike-slip faults in detail via manual interpretation and automatic fault-patch extraction. These faults were interpreted using a density of 2 × 2 lines, and the process was also guided by the planes and profile characteristics of the strike-slip faults. Besides, the strata penetrated by deep-seated faults were also key factors for analyzing the fault-controlled karst system, and the typical stratigraphic interfaces (e.g., T74, T76, T78, T80, and T81) were interpreted manually based on seismic amplitude reflections.
Previous studies have demonstrated the applicability of fracture-vuggy reservoir modeling principles (Hou et al., 2013), that is, the isochronous principle does not apply to fracture-vuggy reservoirs, while genetic modeling and hierarchical modeling principles can still be used as important guidance methods. The formation of fault-controlled paleokarsts is related to paleo morphology, ancient structure, and karst water conditions (Loucks, 1999; Zhou et al., 2011; Han et al., 2016; Wen et al., 2017; Lu et al., 2018; Wang et al., 2019). Especially for the genetic mechanism of fault-control, establishing a genetic model that accords with the characteristics of fault solutions is very important.
The geological origin control idea determines the division of architectural levels, and a fault -controlled karst is the result of the comprehensive action of faults and dissolution that influence each other. Relevant scholars have also summarized the development mode of fault-controlled solutions (Wu et al., 2017; Wang et al., 2019) by mainly considering the geometric shape difference caused by different positions of fault zones, while further hierarchical relationships about fault-controlled paleokarsts need to be elaborated systematically. This study starts from the faulting and dissolution process, considers faults and the dissolution degree of carbonate rocks as key factors, and divides the dissolution system into several grades (Figure 2). A hierarchical division is a prerequisite for hierarchical constraint modeling. Considering the scale and hierarchy of paleokarst elements, four architectural levels are divided (Figure 3).
1) The first level is called the strike-slip fault impact zone (Figure 3A), which mainly includes the main faults, secondary faults, derived micro-fractures, and the main scopes affected by the in-situ stress in the process of cracking from the perspective of tectonics. The strike-slip fracture zone is essentially the comprehensive influence range of strike-slip faults, and its storage performance is better than that of tight limestone. The plane has a certain width, and the scale ranges from about 100 m to kilometers; the vertical scale has a large extension height, even breaking through the base (T90), and the scale varies from hundreds of meters to several kilometers. The cross-sectional shape is differentiated according to the difference in stress, usually including flower-shaped faults (positive or negative); the horizontal extension is also large—tens of meters to hundreds are common—and the segmented features appear alternately.
2) Level two is called the fault-controlled external karst reservoir envelope (Figure 3B). Obviously, it is constrained by level one. The internal stress difference in the strike-slip fault zone will inevitably which is affected by the degree of rock fragmentation, which focuses on the parts with high fragmentation concentration, dense cracks, and increasingly concentrated dissolution of carbonate rocks. It is defined as the external geometry of the fault-controlled external karst reservoir, which is often controlled by the range of the strike-slip faults, and the scale is usually slightly smaller than the range of the strike-slip fracture zone.
3) Level three is called the fault-controlled internal karst elements and it is inside the fault-controlled external karst reservoir envelope (Figure 3C). As the name suggests, it is controlled by the external geometry of Level two. The internal fracture-cavity zone is composed of different elements formed by different solution degrees; it includes large-scale caves, dissolved vugs, and a crack-intensive zone. There are combination rules among different elements. Usually, there are more dissolved vugs around large-scale caves, and the crack-intensive areas are mainly distributed around the cavities or vugs. The scale of the internal structural elements is around 10 m to hundred meters. There is no fixed shape for the cavity and vugs in the three-dimensional space, and their differences in scale and shape are large.
4) Level four is called the cave internal filling zone (Figure 3D), which is the smallest level of this hierarchical division. The information of filling degree and filling lithology types inside caves is mainly from the analysis of field outcrops, cores and drilling, and logging. When a cave is completely filled, the filling lithology sequence and vertical scale can usually be analyzed through outcrops or logging. Its three-dimensional spatial form, internal contact relationships, and combination forms often have multiple forms, which are difficult to characterize, and a challenge for geological modeling. The scale of the internal filling elements is constrained by the scale of the large cave, and the scale ranges from decimeters to meters.
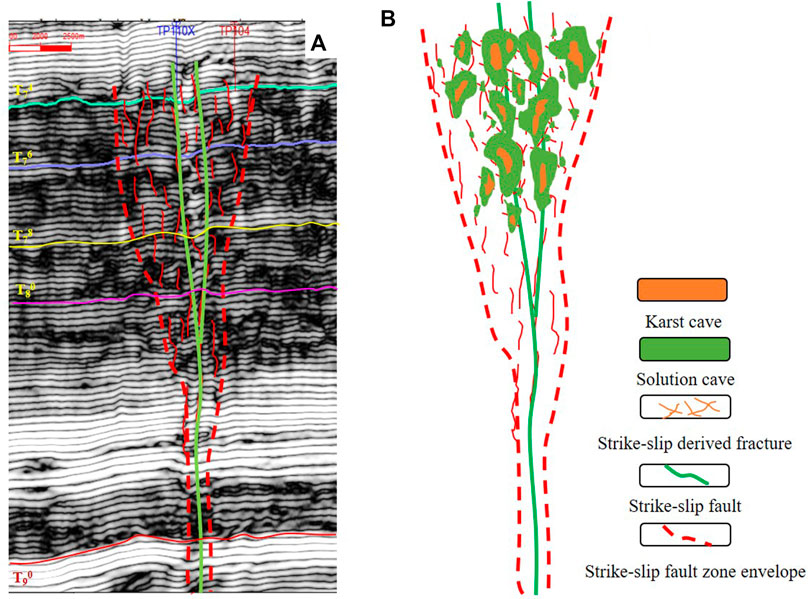
FIGURE 2. Three-dimensional geological conceptual model of fault-controlled paleokarst model. (A) Integrated of well and seismic data for geological analysis; (B) Schematic diagram of geological conceptual model.
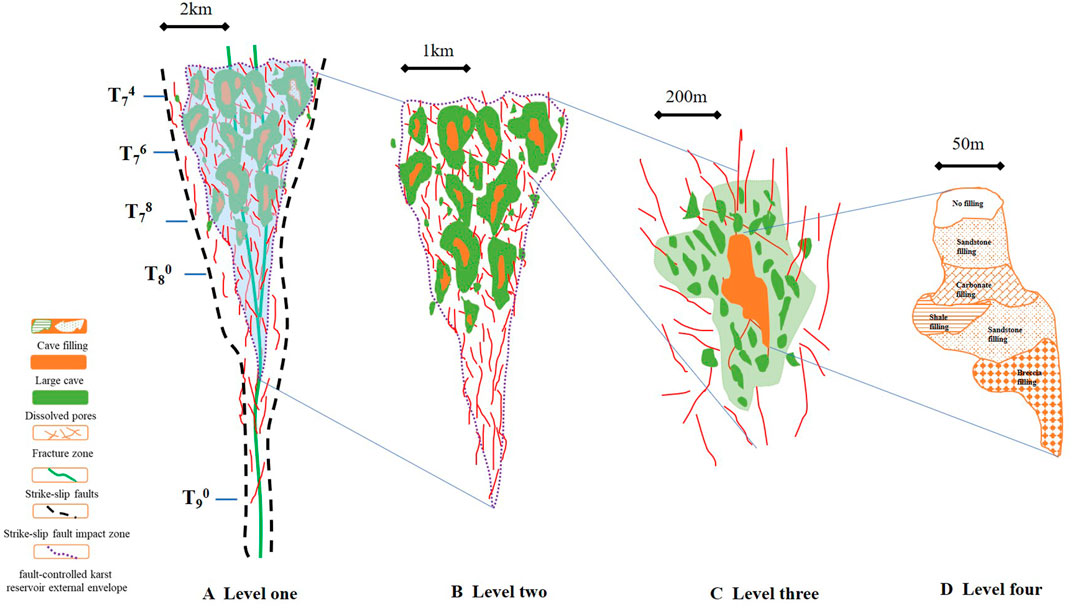
FIGURE 3. Fault-controlled paleokarst hierarchy scheme. (A) strike-slip fault impact zone; (B) fault-controlled external karst reservoir envelope; (C) fault-controlled internal karst elements; (D) cave internal filling zone. Remarks: T74: Top of the Yijianfang Formation, T76: Top of the lower member of the Yingshan Formation, T78: Top of the Penglaiba Formation, T80: Top of the Cambrian, T90: Bottom of the Lower Cambrian.
Since a surface karst fracture-vuggy reservoir is a special type of carbonate fracture-vuggy reservoir, some technical ideas, such as multi-type, multi-scale, and multi-constraint characteristics, are still applicable to a certain extent. The big difference of method is that using a different concept karst model adjusts the “hierarchical modeling.”
The principle of hierarchical modeling is that the high-level sub-elements constrain the modeling process of the low-level sub-elements, that is, the high-level sub-elements provide the constraints. The process of constraining considers geological origin, that is, genetic control. The idea of step modeling is step-by-step modeling. Therefore, the idea of hierarchical modeling of fault-controlled karst systems used in this study involves “hierarchical constraint, genetic control, and step-by-step modeling”.
The method of modeling the hierarchical constraints of fault-controlled paleokarst reservoirs needs to clarify the correspondence between the different architectural elements. A fault-controlled paleokarst, as a strongly reformed kind of reservoir, loses its original sedimentary layered isochronism, but from the perspective of the fault dissolution reformation process, there are still certain processes to consider while modeling it, especially the strike-slip fault zone which is its biggest controlling factor. Fault-controlled paleokarst have experienced multiple periods of tectonic activities (Wen et al., 2008); the superposition of multiple movements has formed faults or fractures of different scales, and the hierarchical relationship of fractures is more obvious from the perspective of scale. The karst process occurs in coordination with fault activity, the formation of caves, and the dissolution of pores of different scales, and these also have a certain hierarchical relationship with each other.
The modeling of a fault-controlled paleokarst reservoir based on genetic control needs to specify the controlling factors. The geological genesis is usually represented by the geological model. Therefore, the geological model of each level of karst reservoirs needs to be clarified after the level is divided. For the strike-slip fault zones, the distribution pattern of the main faults from the perspective of tectonics needs to be clarified. For the external envelop and the internal texture of fracture-caves, specific models need to be established from the perspective of fault-controlled karsts. For the filling of large caves, the filling rules in the cave and the filling pattern need to be established. Each level of the karst reservoir elements has corresponding concept geological modes for quantitative guidance, which helps to achieve the purpose of genetic control modeling.
The step-by-step modeling of the dissolution system needs to optimize the applicable modeling algorithm according to the characteristics of each level. Firstly, a large-scale strike-slip fault stratigraphic framework was established in this study according to the strike-slip fault zone model, and then the outer envelope model of the fault-controlled fracture-cavities was further established inside the framework; then, the classification and fusion modeling of the large caves, dissolved pores, and fracture zones inside the envelope were carried out to achieve the Nested modeling of each level.
Based on the foregoing information, the hierarchical modeling method of the fault-controlled paleokarst reservoir was further developed in detail, specifically according to the four levels of the divided zones (strike-slip fault impact zone, fault-controlled external karst reservoir envelope, fault-controlled internal karst elements, and internal cave filling) (Figure 4).
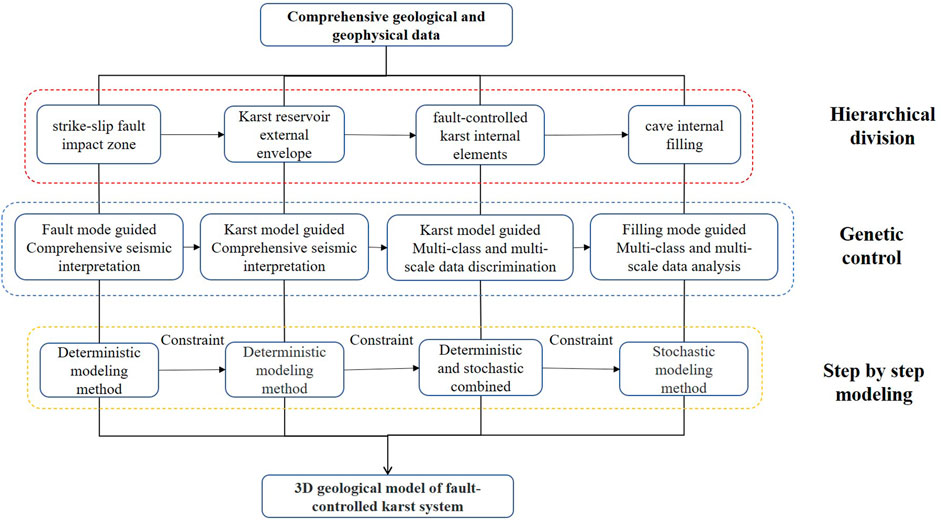
FIGURE 4. Hierarchical modeling chart of the fault-controlled paleokarst reservoir.
The modeling of the strike-slip fault impact zone is mainly based on the fine processing of seismic coherence attributes. Guided by the development model of a fault-controlled paleokarst reservoir, the main faults and the envelope of the strike-slip zone were artificially interpreted, and a strike-slip fault impact model was established by a deterministic method. The specific process includes the following steps:
Three-dimensional analysis of the strike-slip fault impact zone based on seismic information. Using the method of structural analysis and based on high-precision three-dimensional coherent data, three-dimensional interpretations of the main strike-slip faults, secondary faults, and key geological horizons were carried out. This analysis focused on the Ordovician paleokarst reservoirs in the study area. Through the interpretation of seismic survey lines, the main faults and branch faults were spatially combined. The sections usually show single-branch and flower-like patterns. Among them, the flower-like structure section has obvious characteristics of the combination of the main and branch faults. The main faults break through the basement, while the branch fractures are divergent, converging to the bottom and merging into a certain stratum, resulting in a strong degree of fragmentation of the shallower stratum. Obviously, it has the characteristics of being wide at the top and narrow at the bottom. In addition to fault analysis, stratigraphic horizons are also important factors because many strike-slip faults cut through them. Therefore, important three-dimensional stratigraphic horizons were also interpreted (T74, T76, T78, T80, T81, etc.).
Realization of the three-dimensional model of the strike-slip fault impact zone. Due to the large scale of the strike-slip faults, the main input data for this level of modeling relies on the aforementioned 3D seismic interpretation and fault pattern recognition. Using the Petrel software platform, the outer envelope of the strike-slip fault zone was set as the model boundary, and the identified main faults, branch faults, and key geological horizons were used as the framework data; then, the strike-slip fault impact zone model was established by structural stratigraphic modeling. The modeling grid size was 30 m*30 m in the X and Y directions. A variable grid size method was adopted in the Z direction. The step is 2 m in the target Yijianfang and Upper Yingshan zones, while the step size is 5 m for the other zones. In the model (Figure 5), the main fault is distributed with good continuity and spans the entire study area along the strike with an extension length of about 15 km. The branch faults are relatively weak in continuity and are nearly parallel to the main fault or obliquely intersecting at a small angle. The faults’ impact boundary is also reflected in the seismic coherent attributes which is significantly different for the surrounding layered rock strata, making it easier to identify and interpret. The flower-like structure concept model was used as a guide in the interpretation process, reflecting the characteristics of “narrow underneath and wide on the top” (Figure 5A). Based on the characteristics of the longitudinally-crossing horizons of the main faults in the area, the key geological horizons were tracked and interpreted (Figure 5B), and the strike-slip fault impact external envelop was used as the modeling boundary to create the stratigraphic model (Figure 5C). Finally, the fault model was integrated with the stratum model, that is, the final strike-slip fault impact zone model (Figure 5D) was obtained according to the three-dimensional structural modeling method, which served as the basic framework for the fault-controlled karst reservoir modeling.
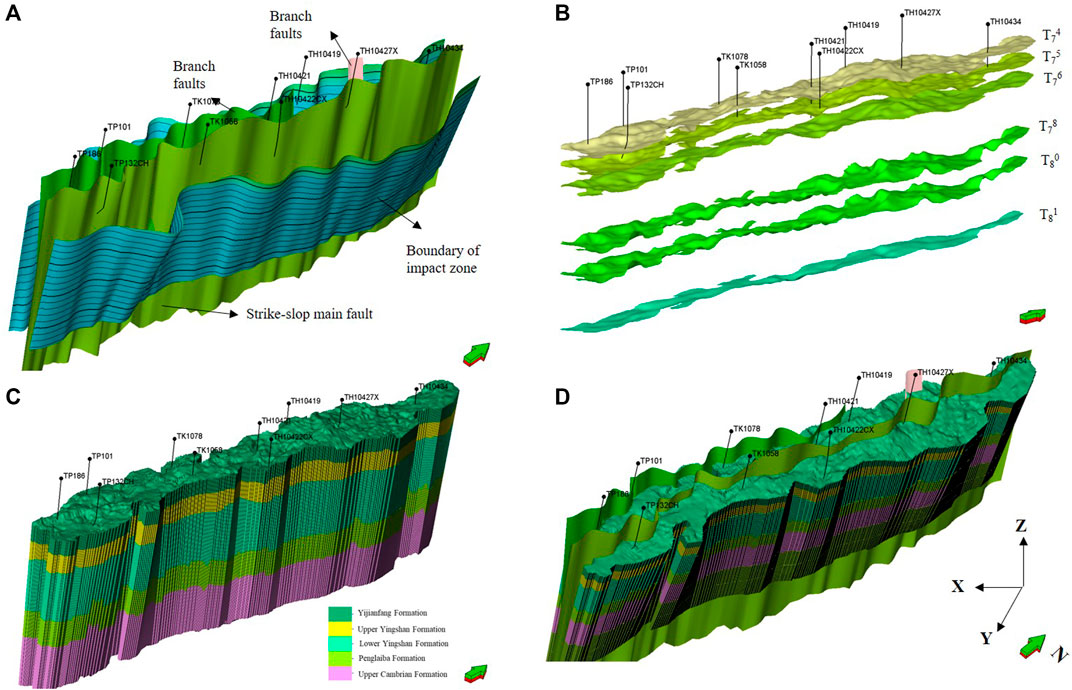
FIGURE 5. Strike-slip fault zone model in TP12CX units. (A) Main and branch faults interpretation; (B) The main target horizon; (C) Stratigraphic model; (D) Fault impact zone model Remarks: T74: Top of the Yijianfang Formation, T76: Top of the lower member of the Yingshan Formation, T78: Top of the Penglaiba Formation, T80: Top of the Cambrian, T90: Bottom of the Lower Cambrian.
In the hierarchical modeling of the fault-controlled karst system, the karst reservoir’s external envelop is constrained by the strike-slip fault impact zone, and the modeling process needs to be carried out inside the strike-slip fault impact zone model. The key steps are as follows:
Seismic prediction of the fault-controlled karst reservoir’s external envelop. The range of the karst reservoirs envelop is obviously controlled by the fault impact zone, that is, strike-slip faults are “cavity-controlling faults.” Therefore, the seismic prediction of a karst reservoir’s external envelop requires the identification of attributes that are more sensitive to fracture density. Existing studies have achieved relatively good results through the use of structure tensors or other attributes (Wen et al., 2008; Ma et al., 2018). In this study, the FL (Fault Likelihood) attribute, which is more sensitive to structure-related information, was used to describe the external envelope of the fault-controlled karst. The Likelihood attribute is a fracture imaging algorithm based on sample point processing (Ma et al., 2018); it depicts a fracture through a similarity attribute. The Likelihood attribute has a value between 0 and 1 to indicate the possibility of a fracture, and can, to a certain extent, reflect the size and range of the possible envelope. Another key problem of envelope prediction is the determination of the seismic attribute threshold. Horizontal or vertical well drilling time curves or other logging characteristics can be used as a calibration method. However, due to the absence of well log calibration data, we used an automatic segmentation technology to automatically recognize the range of the external envelope (Otsu, 1979). The technical principle is similar to image recognition. The threshold segmentation algorithm can automatically count the segmentation thresholds between different seismic attribute values in a certain data set and can ensure the largest statistical variance inter-cluster to achieve a statistically significant classification. Based on this method, the attribute cut-off value of the external envelope boundary of the fault solution was initially determined to be 0.25, that is, only an attribute with an FL higher than 0.25 were included in the envelope, while attributes lower than 0.25 were deemed to belong to the surrounding rock formation.
Realization of the fault-controlled karst reservoir’s external envelop. The modeling method adopted here was deterministic target modeling. The main realization process is to use the geological target body identified through seismic interpretation as the data input and follow the principle of adjacent optimal sampling from the seismic scale to the geological grid model. When there is a situation that is inconsistent with the well-point data or the understanding of the geological concept model, the geological target body should be manually modified appropriately. The overall model needs to reflect the characteristics of being constrained by the strike-slip fault impact zone and should have segmentation along the fault direction. Based on the above-mentioned seismic prediction results, the geological target body was extracted and incorporated into the established strike-slip fault impact zone model through deterministic target modeling. The interference of abnormal bodies outside the strike-slip fault impact zone was eliminated and the karst reservoir’s external envelope model in the study area was established. This model reflects the difference in the spatial distribution (Figure 6). The overall width near Well TP101 is large, and the vertical development is deep and continuous; however, the width near Well TK1058 is narrower and the vertical development becomes shallower with less continuity. The external envelope distribution variety along the strike also further reflect the characteristics of the strike-slip faults’ segmentation.
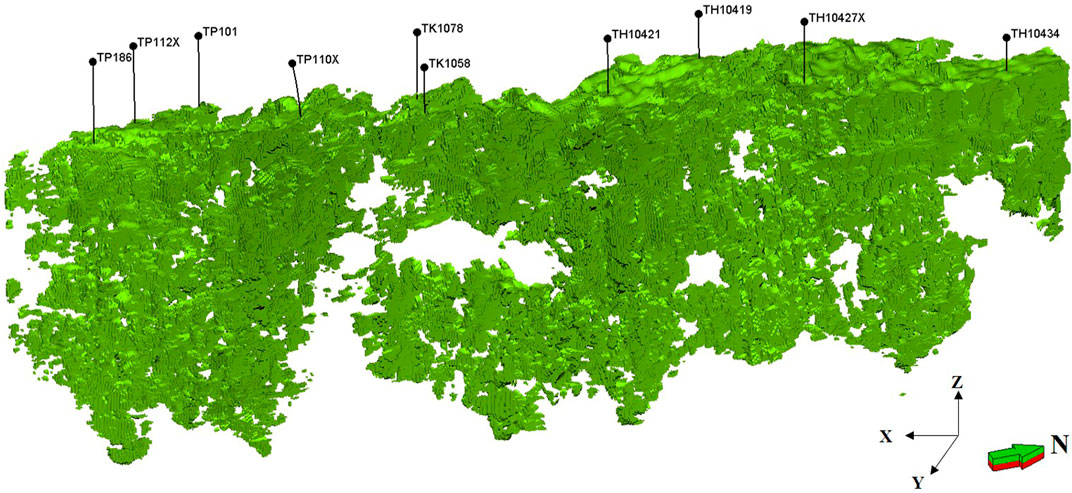
FIGURE 6. Fault-controlled paleokarst envelope model in the TP12CX units.
The fault-controlled internal karst elements, also called fracture-cavity zones, include large-scale caves, dissolved pores, and fracture-intensive zones. They have the characteristics of large differences in scale and discrete distribution. The steps to classify and model the fracture-cavity zones are as follows:
Single well identification of internal elements. Well data is usually called conditional data or hard data in geological modeling and is mainly used to constrain the model or check the rationality of the geological model. Large caves, dissolved pores, and fracture-intensive zones have certain characteristics in cores, drilling and logging data, imaging logging data, and conventional logging data. When encountering drilling tool venting, serious leakage, and a sudden drop drill stem during drilling, it is most likely to be because the caves are not filled. For filled caves, different lithologies give rise to different characteristics in conventional logging data. Core and imaging logging data can provide more accurate information on dissolved pores and they can be calibrated to have similar curve characteristics as conventional pore types in carbonate reservoirs. In this study, the fracture-intensive zone mainly refers to areas of small-scale fractures. The fracture density and other parameters were determined by core and imaging logging data. Based on statistical analysis, we established a foundation for the subsequent fracture modeling.
Establishment of the geological constraint trending model. The core of genetic controlling lies in the effective constraint of geological laws in the modeling process, and reasonable constraint conditions are essential to improve the accuracy of the model. According to the understanding of the distribution of “fault-controlled cavities,” the development of fault-controlled fractures and caves is closely related to the scale of the faults. The larger the scale and the longer the extension of the main fault, the greater is the width and depth of karstification, and the more developed are the fractures and caves. The development of fault-controlled fractures and caves is also highly related to the distance from the fault. The farther away from the main fault, the weaker the development of fractures and caves and the smaller the scale. There is a similar rule for branch and secondary faults. Based on this geological understanding, in accordance with the principle of fault-controlled fracture-cavity development with the main-controlling fault as the core, a geological probability model of the horizontal fracture-cavity development was obtained (Figure 7A); in this model, the closer to the fault, the greater is the development of the fracture-cavities. According to the preliminary understanding that the stratum along the unconformity surface is dominated by underwater seepage and dissolution, the fault-controlled karst in this area has experienced multiple tectonic ups and downs. The T74 unconformity surface at the top of the Yijianfang Group is the most obvious. Based on statistics of the development of longitudinal fractures and caves from data from multiple wells in this area, the thicker fractures and caves encountered are mainly close to the middle and upper part of the Yijianfang Group, which is closer to the T74 interface. Thinner and smaller fractures and caves are encountered downwards. Therefore, using this interface as the datum plane, the vertical development geological probability volume was obtained according to the distance relationship (Figure 7B).
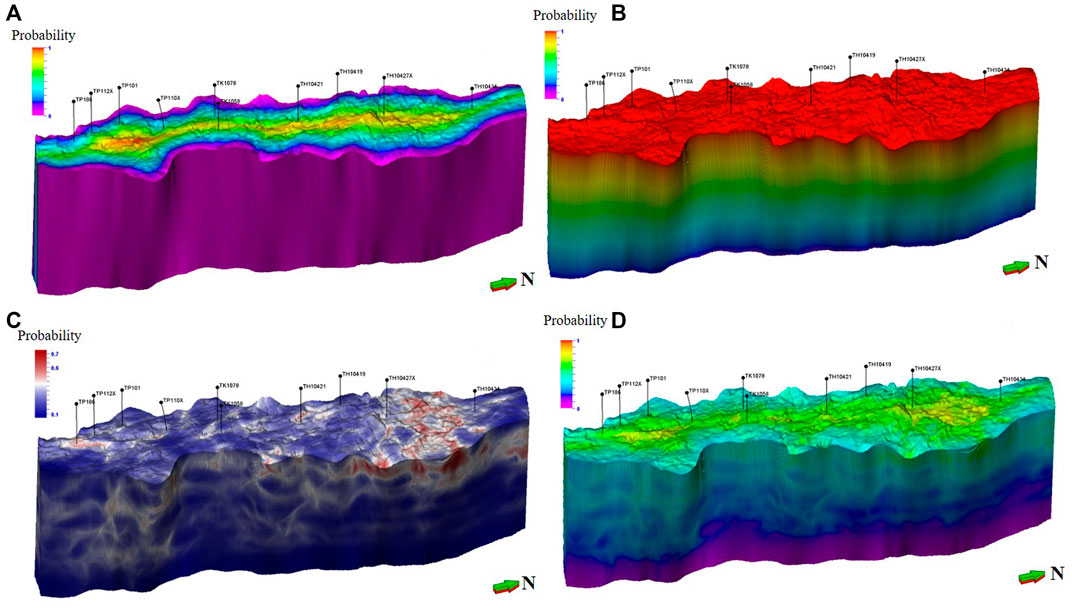
FIGURE 7. Probabilistic models used for fault-controlled internal paleokarst elements modeling in the TP12CX units. (A) Fault-controlled lateral geological probability model; (B) Erosion surface-controlled vertical geological probability model; (C) Seismic probability model; (D) Geo-seismic synthetic probability model based on linear weighting.
Establishing the seismic constraint trending model. Fracture-cavity reservoirs cause a low degree of well control, and the seismic probability volume can be used as a soft constraint to improve the accuracy of reservoir prediction. Karst cave reservoirs are characterized by bead-like characteristics in seismic reflections, and most seismic attributes have a certain response. Many scholars have calculated that seismic impedance has a good corresponding relationship with the presence of karst caves (Liu and Wang, 2012); seismic impedance, which is highly affected by the lithology and physical properties of strata and fluids, has been used to characterize the main area of the Tahe Oilfield. It is mostly used to predict the porosity in porous carbonate rocks. Fracture-cavity reservoirs are often affected by the presence of layered strata, and especially in the Ordovician strata in the study area, it is not easy to remove the interference of these layered strata solely through the use of impedance information. In view of this, we introduced the seismic Texture attributes to predict the distribution of karst caves (Gao, 2007; Gao, 2008; Gao, 2011). The Texture attributes are mainly based on seismic waveform clustering, which combines and strengthens the information of similar spatial waveform textures that are more sensitive to the reflection of karst reservoir abnormal geological bodies. It is more suitable for the detection of karst cave reservoirs and can indicate the possibility of karst cave development in the form of a detection probability with values ranging from 0 to 1. It can be used as a seismic constraint trend to predict the presence of large karst caves and corroded cavities. After denoising the seismic data in the study area, the texture data was extracted. The attribute value represents the possibility of cavity development, which is gridded into the model as the seismic probability volume (Figure 7C). Finally, in order to facilitate the use of constrained bodies, the above three probability bodies were integrated into a set of geological and comprehensive seismic probability bodies (Figure 7D) by linear merging according to an appropriate fusion ratio; these served as the trending model to support the modeling of the internal elements of the karst reservoir.
Discrete distribution model of large caves. The average diameter scale of large caves is greater than 5 m. Seismic data can basically be used to identify caves. Using the deterministic modeling method of target truncation, the Texture attributes were calibrated based on the results of multi-well cave recognition to determine the threshold value of a cave. Firstly, we established a preliminary distribution model of large caves based on the Texture threshold. Then, according to the development mode, appropriate artificial-computer interaction correction was achieved to fit all the existing data, and we obtained the large cave model. A total of 62 large caves have been drilled and identified by 40 wells in the study area. The thickness of the drilled caves ranges from 5 to 35 m. The current seismic resolution can basically identify the location of caves with a main frequency of about 25 HZ. The texture data volume that reflects the characteristics of the waveform was extracted and it was resampled into the geological grid; then, the calibrated Texture attribute value was truncated using logging and dynamic data. Through the artificial-computer interaction correction, the deterministic method was used to establish the large-scale cave geological model (Figure 8A). From the distribution characteristics of large-scale caves, the law of fault-controlled is very obvious (Figure 9), and large-scale caves are distributed shallower than the unconformity surface T74. The caves distributed in the upper part are more developed than the deeper part.
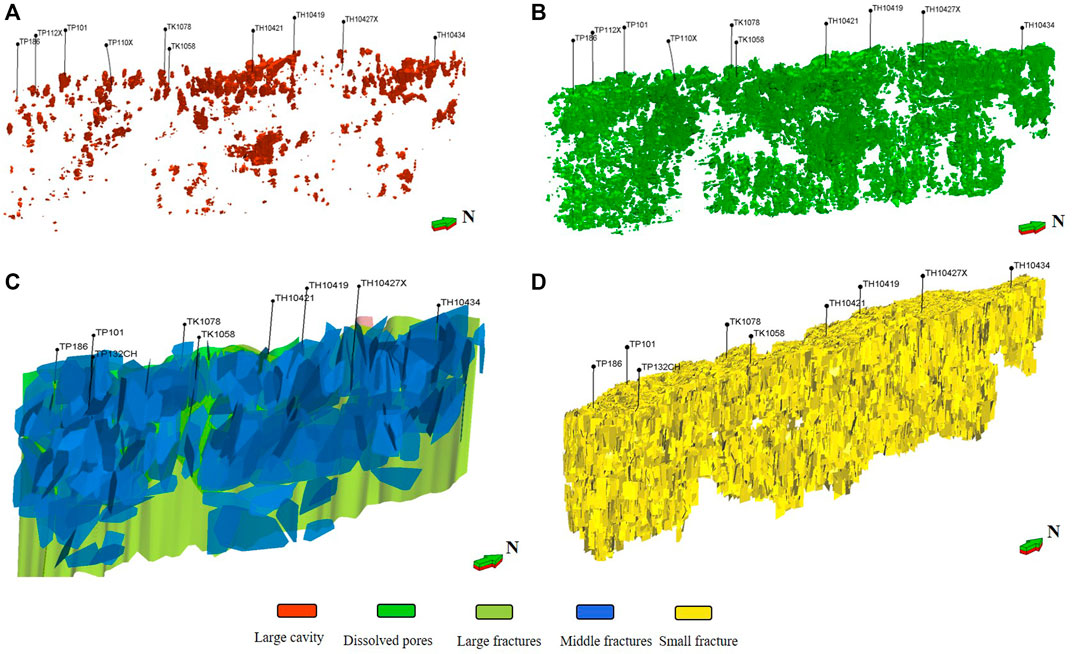
FIGURE 8. Fault-controlled paleokarst internal elements models in the TP12CX units. (A) Three-dimensional model of large caves; (B) Three-dimensional model of dissolved pores; (C) Large and medium fracture model; (D) Small fracture model.
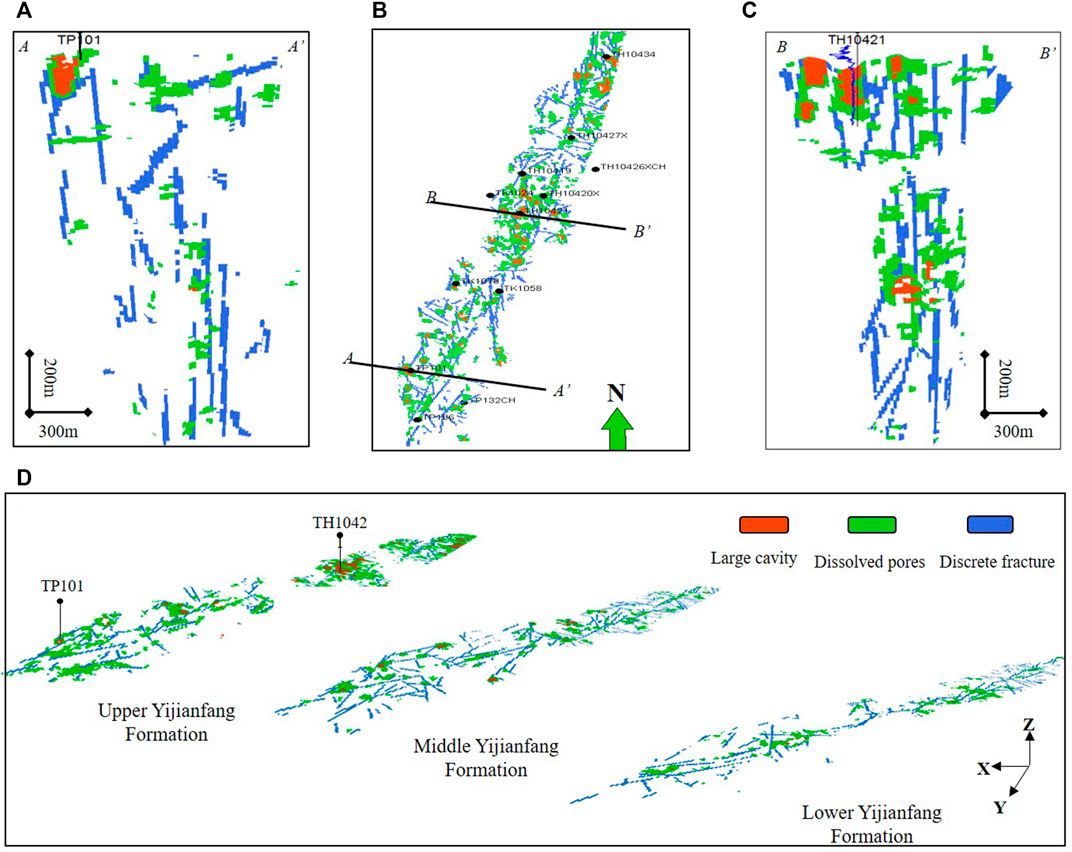
FIGURE 9. Fault-controlled paleokarst internal elements models in the TP12CX units. (A) The model profile of the TP101 well; (B) The results of the plane distribution of fracture-cavities; (C) The model profile of the Th10421 well; (D) Evolution of fracture-cavities.
Dissolved pores distribution model. Dissolved pores have some characteristics of conventional pore-type carbonate reservoirs, and they have a certain degree of randomness. However, according to their genetic relationship with large fault-controlled caves, their modeling is mainly performed through sequential indicator simulation methods with multi-trend constraints. The multi-trends specifically include the aforementioned geological probability volume along the main faults and the seismic probability volume reflecting the possibility of karst pores distribution. The established large-scale cave model is used as the “facies control” constraint. After adjusting the variation variogram, we finally get the discrete distribution model of the dissolved pores. Taking the dissolved pores results identified from 40 wells in the study area as the hard data for modeling, the comprehensive probability volume obtained above (Figure 6D) was used as the inter-well constraint, and the sequential indicator simulation method was used to establish the three-dimensional distribution model of the dissolved pores (Figure 8B). The dissolved pores model reflects the same distribution characteristics as the large-scale karst caves model (Figure 9); further, the segmentation and longitudinal distribution of dissolved pores reflect the characteristics of genetic control.
Discrete multi-scale fractures distribution model. The hierarchical fractures of different scales are obvious. The hierarchical fracture network model was established step by step at the large, medium, and small scales. The large fractures are equivalent to the main strike-slip faults and were already incorporated in the strike-slip fault model. Therefore, here we mainly focus on the simulation of the distribution of the medium-sized and small fractures. Medium-sized fractures are considered to be fractures that can be further identified by enhancing the discontinuity of seismic data, so the ant tracking technology was used to automatically track the fractures in different directions. The deterministic method was used to establish the discrete distribution model of the medium-sized fractures (Figure 8C). The results show that the strikes mainly include three directions of northeast, northwest, and east-west, with dip angles of 60–90° and extension lengths of 130–1,500 m. It is difficult to identify small fractures directly due to the seismic resolution limitation. The statistics of fracture parameters from wells combined with the characteristics of outcrops in the field show that the fracture length is about 3–130 m. Constrained by the seismic-geological probability volume of the fractures generated by the existing large faults (Figure 7), the object-based process modeling method was adopted, and we obtained the discrete model of small fractures (Figure 8D).
The internal cave filling directly determines the quality of a fracture-vuggy reservoir, which is difficult to characterize due to data limitations and the high degree of heterogeneity. Geological modeling at this level is challenging. Current research on fracture-cavity filling is mainly based on single well data (core, imaging, and conventional logging) and field outcrops. A single well can basically identify the filling lithology, physical properties, and vertical sequence characteristics of the internal cave filling (Smosna et al., 2005; Li and Fan, 2011; Tian et al., 2012). The relationship among various filling elements can be partially recognized in the outcrop, but the morphological characteristics, especially the quantitative distribution, are still poorly understood. Therefore, it is difficult to directly establish the internal model of each filling element in underground cave reservoirs. The change of physical properties can be reflected by different cavity filling lithologies. There is a good correlation between impedance properties and reservoir porosity. The difference in porosity in a cave can indirectly reflect the difference in the composition of filling elements, for example, high porosity values may indicate a filled or unfilled sandstone and low porosity values may indicate a filled breccia or a layer filled with cemented calcite. Impedance volume was used as a soft constraint, a large cave was used as the “facies control,” lithology data from wells were used as conditional data, and the sequential indication simulation method was used to obtain the internal cave filling model (Figure 10). The results show that the distribution roughly reflects the filling sequence inside the cave, and there is a certain layered constraint relationship between its distribution and impedance.
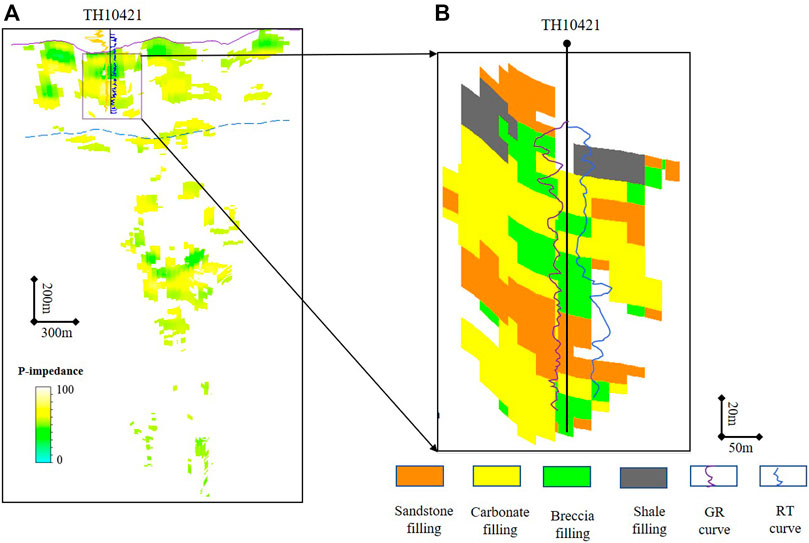
FIGURE 10. Cave filling physical model in the TP12CX units. (A) P-impedance volume model; (B) Filling textures of the big cavity.
Finally, the karst caves and fractures of different scales under the same grid system were merged, and according to the principle of facies priority (Lv et al., 2017), several different elements were assigned with different weights, which represent the priority in the merging process, and then, the multiple discrete model of the fault-controlled karst system was established (Figure 11).
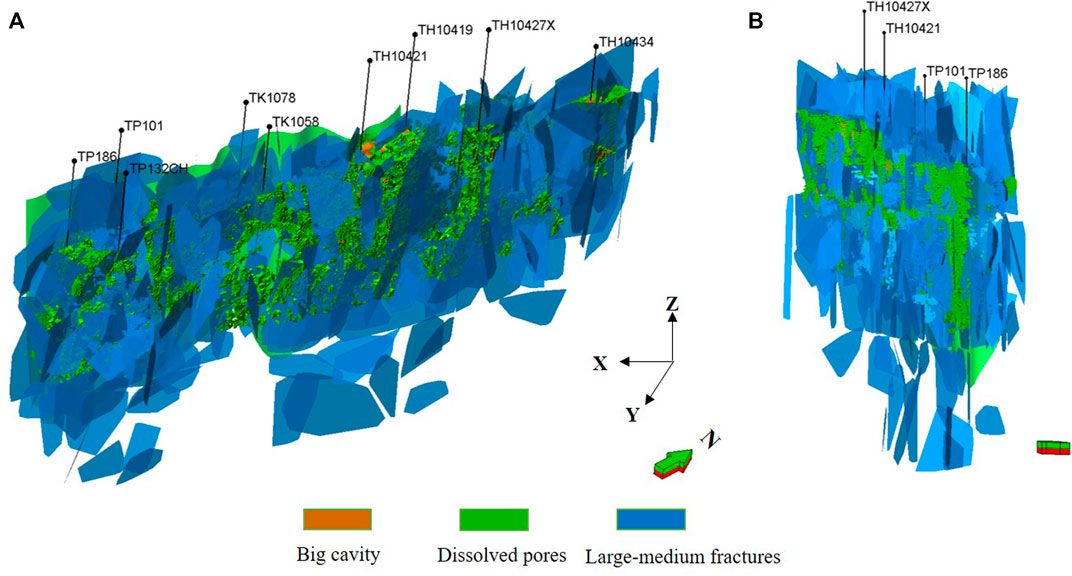
FIGURE 11. Integrated 3D fault-controlled paleokarst geological model in the TP12CX units. (A) Three dimensional from a certain angle; (B) Three dimensional from another angle.
Fault-controlled paleokarst reservoirs are highly heterogeneous due to the various types of cavern contents and the degree of filling. The characterization of these reservoirs’ internal architectural elements and the construction of robust geological models are two basic approaches to improve oilfield development. Future research regarding the characterization of the internal architecture of karst reservoirs could focus on the following aspects:
For different types of caverns, understanding the relationship between filling type and the distribution of the reservoir’s physical parameters, as well as exploring the seismic predicting methods based on physical parameters, offers an approach to more accurately characterize the heterogeneity in the physical properties of karst reservoirs.
The multiple-scale features of fault-controlled karstic reservoirs creates complex architectural elements, which increases the difficulty of geological modeling. Improving the understanding of the geological features and building a geological knowledge database are important ways to reduce the uncertainty of the geological model.
A hierarchical modeling method for fault-controlled paleokarst systems is proposed. The overall idea is “level constraints, genetic control, and step-by-step modeling.” High-level elements have hierarchical constraints on lower-level elements, and the principle of constraints is reflected by the geological genesis model, which is modeled step by step according to different levels.
The modeling techniques are optimized based on the scale and distribution characteristics of the fault-controlled paleokarst system at different levels. The deterministic modeling method is mainly used for large karst caves and faults, and the accuracy is further improved through artificial computer interaction. The sequential indicator simulation method and the trend and object-based process simulation method are used to model the dissolved pores and the small-medium fractures, respectively. In the stochastic simulation process, a geological genetic probability body is added as a constraint to make the modeling results more reliable. The filling lithologic model with the soft constraints of wave impedance reflects the filling sequence inside the cave.
The original contributions presented in the study are included in the article/Supplementary Material, further inquiries can be directed to the corresponding author.
WZ is responsible for the idea and writing of this article, and ZH, TD, ML, and HZ are responsible for the data analysis part.
This research is financially supported by China Academy of Sciences (No. XDA14010204).
WZ, ZH, TD, ML and HZ were employed by the company Petroleum Exploration and Production Research Institute, SINOPEC.
All claims expressed in this article are solely those of the authors and do not necessarily represent those of their affiliated organizations, or those of the publisher, the editors and the reviewers. Any product that may be evaluated in this article, or claim that may be made by its manufacturer, is not guaranteed or endorsed by the publisher.
Chen, W., Wu, Z. P., Hou, F., and Kong, F. (2010). Internal Structures of Fault Zones and Their Relationship with Hydrocarbon Migration and Accumulation. Acta Petrolei Sinica 31 (5), 774–780.
Gao, D. (2008). Application of Seismic Texture Model Regression to Seismic Facies Characterization and Interpretation. The Leading Edge 27 (3), 394–397. doi:10.1190/1.2896632
Gao, D. (2007). Application of Three-Dimensional Seismic Texture Analysis with Special Reference to Deep-marine Facies Discrimination and Interpretation: Offshore Angola, West Africa. Bulletin 91 (12), 1665–1683. doi:10.1306/08020706101
Gao, D. (2011). Latest Developments in Seismic Texture Analysis for Subsurface Structure, Facies, and Reservoir Characterization: A Review. Geophysics 76 (2), W1–W13. doi:10.1190/1.3553479
Gong, L., Fu, X., Wang, Z., Gao, S., Jabbari, H., Yue, W., et al. (2019). A New Approach for Characterization and Prediction of Natural Fracture Occurrence in Tight Oil Sandstones with Intense Anisotropy. Bulletin 103 (6), 1383–1400. doi:10.1306/12131818054
Gong, L., Wang, J., Gao, S., Fuc, X., Liuc, B., Miaod, F., et al. (2021). Characterization, Controlling Factors and Evolution of Fracture Effectiveness in Shale Oil Reservoirs. J. Pet. Sci. Eng. 203, 108655. doi:10.1016/j.petrol.2021.108655
Han, C. C., Lin, C. Y., Ren, L. H., Lu, X.-B., Wei, T., and Zhang, X. (2016). Characteristics of Ordovician Fault in the Block 10 of Tahe Oilfield, Tarim Basin and its Controlling Effect on Karst Reservoirs. Nat. Gas Geosci. 27, 790–798. doi:10.11764/j.issn.1672-1926.2016.05.0790
Hou, J. G., Ma, X. Q., Hu, X. Y., and Liu, Y. (2013). Key Issues of 3D Geological Modeling of Paleokarst-Cave Carbonate Reservoir. Geol. J. China Universities 19, 64–69.
Hou, J. G., Ma, X. Q., and Liu, Y. M. (2012). A Case Study of Ordovician Reservoir of 4th Block in Tahe Oilfield. Earth Sci. Front. 19 (2), 59–66.
Hu, X. Y., Li, Y., and Quan, L. S. (2013). Three-dimensional Geological Modeling of Fractured-Vuggy Carbonate Reservoirs: a Case from the Ordovician Reservoirs in Tahe-Ⅳblock, Tahe Oilfield. Oil Gas Geology. 34 (3), 383–387.
Li, Y., and Fan, Z. H. (2011). Developmental Pattern and Distribution Rule of Fracture-Cavity System of Ordovician Carbonate Reservoirs in Tahe Oilfield. Acta Petrolei Sinica 32 (1), 101–105.
Li, Y., Hou, J. G., and Li, Y. Q. (2016). Features and Classified Hierarchical Modeling of Carbonate Fracture-Cavity Reservoirs. Pet. Exploration Develop. 43 (4), 600–606. doi:10.1016/s1876-3804(16)30076-3
Li, Y. Q., Hou, J. G., and Liu, Y. M. (2016). 3D Modeling of Cave Reservoirs Based on Karst Patterns. J. China Univ. Pet. (Edition Nat. Science) 40 (5), 43–50.
Liu, X. L., and Wang, Y. (2012). Multi-point Geostatistical Approach to Model Karst Facies of Fracture-Cavity Reservoir in Tahe Oilfield. J. Southwest Pet. Univ. (Science Technol. Edition) 34 (6), 53–58.
Liu, Y. M., Hou, J. G., and Li, Y. Q. (2018). A Multi-Constrained Modeling Method for Paleokarst Carbonate Reservoirs: An Application to the Ordovician Reservoir in the Tahe Oilfield. Pet. Sci. Bull. 02, 125–133.
Loucks, R. G., Mescher, P. K., and Mcmechan, G. A. (2004). Three-dimensional Architecture of a Coalesced, Collapsed-Paleocave System in the Lower Ordovician Ellenburger Group, central Texas. Bulletin 88 (5), 545–564. doi:10.1306/12220303072
Loucks, R. G. (1999). Paleocave Carbonate Reservoirs: Origins, Burial-Depth Modifications, Spatial Complexity, and Reservoir Implications. AAPG Bull. 83 (3), 1795–1834. doi:10.1306/e4fd426f-1732-11d7-8645000102c1865d
Lu, X. B., Yang, M., and Wang, Y. (2018). Geological Characteristics of ‘strata-Bound’ and ‘fault-Controlled’ Reservoirs in the Northern Tarim Basin: Taking the Ordovician Reservoirs in the Tahe Oil Field as an Example. Pet. Geology. Exp. 40 (4), 461–469.
Lu, X. B., Zhao, M., and Hu, X. Y. (2012). Studies of 3D Reservoir Modeling: Taking Ordovician Carbonate Fractured-Vuggy Reservoirs in Tahe Oilfield as an Example. Pet. Geology. Exp. 34 (2), 193–198.
Lv, X. R., Li, H. K., and Wei, H. H. (2017). Classification and Characterization Method for Multi-Scale Fractured-Vuggy Reservoir Zones in Carbonate Reservoirs: An Example from Ordovician Reservoirs in Tahe Oilfield S80 Unit. Oil Gas Geology. 38 (4), 813–821.
Ma, D., Zhao, Y. M., and Zhang, Y. T. (2018). Application of Maximum Likelihood Attribute to Fault Identification: A Case Study of Rewapu Block in Halahatang Area, Tarim Basin, NW China. Nat. Gas Geosci. 29 (6), 817–825.
Ma, X. Q., Hou, J. G., and Hu, X. Y. (2013). Discussion on 3D Geological Modeling of Palaeokarst Cave Reservoir: A Case Study on Ordovician Reservoir of the 4th Block in the Tahe Oilfield. Geol. Rev. 59 (02), 315–324.
Otsu, N. (1979). A Threshold Selection Method from gray-level Histograms. IEEE Trans. Syst. Man. Cybern. 9 (1), 62–66. doi:10.1109/tsmc.1979.4310076
Qi, L., and Lu, Y. (2010). Development Characteristics and Main Controlling Factors of the Ordovician Carbonate Karst in Tahe Oilfield. Oil & Gas Geology 31 (1), 1–12.
Smosna, R., Bruner, K. R., and Riley, R. A. (2005). Paleokarst and Reservoir Porosity in the Ordovician Beekmantown Dolomite of the central Appalachian basin. Carbonates Evaporites 20 (1), 50–63. doi:10.1007/bf03175448
Tian, F., Jin, Q., and Li, Y. (2012). Identification of Small Fracture-Vugs and Their Fillings through Log Interpretation in Fractured-Vuggy Ordovician Reservoirs in Tahe Oilfield. Oil Gas Geology. 33 (06), 900–908.
Wang, Z., Wen, H., and Deng, G. (2019). Fault Controlled-Karst Reservoir Characterization Technology in the Tahe Oilfield, China. Geophys. Prospecting Pet. 58 (01), 149–154.
Wen, H., Deng, G., and Wang, Z. (2017). Analysis of Controlling Factors of Reservoir Development in Ordovician Reservoirs in Tahe Oilfield-3D High Precision Seismic Area in Eastern 10 Area. Unconventional Oil & Gas 74 (1), 37–42.
Wen, Z., Wang, H. M., and Qi, L. X. (2008). Research on the Prediction of Ordovician Carbonate Reservoir of Fissure- Cave Type in the Tahe Oilfield. Earth Sci. Front. 15 (1), 94–100.
Wu, T., Dai, S. K., and Cao, F. (2017). Strike-slip Fault System and It’s Controlling on the Formation of “Reservoir of Fault Controlling Dissolution”: A Case Study of Toufutai Area. Tahe oil fields : Adv. Geosciences 7 (5), 681–694.
Yu, Q. H., Wen, Z. G., and Tang, Y. J. (2011). Geochemical Characteristics of Ordovician Crude Oils in the Northwest of the Tahe Oil Field, Tarim Basin: Chin. J. Geochem. 30 (1), 93–98.
Zeng, L., Su, H., Tang, X., Peng, Y., and Gong, L. (2013). Fractured Tight sandstone Oil and Gas Reservoirs: A New Play Type in the Dongpu Depression, Bohai Bay Basin, China. Bulletin 97 (3), 363–377. doi:10.1306/09121212057
Zeng, L., Wang, H., Gong, L., and Liu, B. (2010). Impacts of the Tectonic Stress Field on Natural Gas Migration and Accumulation: A Case Study of the Kuqa Depression in the Tarim Basin, China. Mar. Pet. Geology. 27 (7), 1616–1627. doi:10.1016/j.marpetgeo.2010.04.010
Zhang, S. P., Chen, F. L., and Jin, Y. (2007). 3D Modeling of Ordovician Fractured-Vug Carbonate Reservoir. Tahe Oilfield: Pet. Exploration Develop. 34 (2), 175–180.
Zhao, B., Hou, J. G., and Liu, Y. M. (2011). Three Dimensional Modeling and Application of Ordovician Carbonate Cavity Reservoirs in Tahe Oilfield. J. Oil Gas Technol. 33 (5), 12–16.
Zhao, M., Kang, Z. H., and Liu, J. (2008). Modeling and Application of Fractured-Vuggy Carbonate Reservoirs. Xinjiang Pet. Geology. 29 (3), 318–320.
Keywords: fault-controlled paleokarst, fracture-cavity reservoir, carbonate reservoir, geological modeling, tahe oilfield, tarim basin
Citation: Zhang W, He Z, Duan T, Li M and Zhao H (2022) Hierarchical Modeling of Carbonate Fault-Controlled Paleokarst Systems: A Case Study of the Ordovician Reservoir in the Tahe Oilfield, Tarim Basin. Front. Earth Sci. 10:840661. doi: 10.3389/feart.2022.840661
Received: 21 December 2021; Accepted: 11 January 2022;
Published: 03 February 2022.
Edited by:
Lei Gong, Northeast Petroleum University, ChinaReviewed by:
Haiteng Zhuo, Sun Yat-sen University, ChinaCopyright © 2022 Zhang, He, Duan, Li and Zhao. This is an open-access article distributed under the terms of the Creative Commons Attribution License (CC BY). The use, distribution or reproduction in other forums is permitted, provided the original author(s) and the copyright owner(s) are credited and that the original publication in this journal is cited, in accordance with accepted academic practice. No use, distribution or reproduction is permitted which does not comply with these terms.
*Correspondence: Zhiliang He, aGV6aGlsaWFuZ0BzaW5vcGVjLmNvbQ==; Taizhong Duan, ZHVhbnR6LnN5a3lAc2lub3BlYy5jb20=
Disclaimer: All claims expressed in this article are solely those of the authors and do not necessarily represent those of their affiliated organizations, or those of the publisher, the editors and the reviewers. Any product that may be evaluated in this article or claim that may be made by its manufacturer is not guaranteed or endorsed by the publisher.
Research integrity at Frontiers
Learn more about the work of our research integrity team to safeguard the quality of each article we publish.