- 1Zijin School of Geology and Mining, Fuzhou University, Fuzhou, China
- 2Engineering Science Department, Andres Bello University, Santiago, Chile
- 3Engineering Research Center of Geological Engineering, Fuzhou University, Fuzhou, China
To study the relationship between matrix suction and conductivity in unsaturated granite residual soil and realize the matrix suction prediction of soil slope based on conductivity, laboratory and field tests are carried out on undisturbed soil at different depths of the Yandou village landslide in Sanming City, Fujian Province, China. Through physical and chemical property analysis, soil-water characteristic curves and electric parameter matrix suction prediction models for unsaturated granite residual soil at different depths of the target area are obtained. Based on the proposed model, the matrix suction distribution of on-site soil slope is predicted and the dynamic response law under the influence of artificial rainfall is studied. The results show that: (1) The transverse conductivity, average structure factor, average shape factor, and anisotropy coefficient of unsaturated soil are related to the soil saturation degree. By considering the above parameters, the comprehensive structure parameter Re is introduced and its functional relationship with matrix suction is established. (2) Under artificial simulated rainfall, the saturation, hysteresis of the conductivity parameters, and matrix suction response of the slope occurs, which is controlled by soil depth, permeability and rainfall intensity. The matrix suction is distributed in layers on the profile and its recovery rate is slower than saturation. The suction contour map shows a parabola shape with the opening downward. (3) The relationship between the conductivity parameters of the residual soil slope and matrix suction is further revealed and a new method to indirectly measure matrix suction is proposed. Its feasibility is verified based on field tests, which is of great significance to landslide monitoring and early warning.
1 Introduction
Unsaturated soil is widely distributed in nature and is involved in most of the geotechnical problems (Fredlund and Rahardjo, 1993; Lu and Likos, 2006). The suction of unsaturated soil is an important index to characterize its engineering properties (Zhang, et al., 2022). It is the basis and core concept of the unsaturated soil mechanics theory system (Van Genuchten, 1980; Lu and Griffiths, 2004). However, the quick and accurate measurement of soil suction is an urgent problem to be solved. Measurement of suction, based on laboratory tests, requires a high standard of operation, which is time-consuming, expensive, and complicated (Delage et al., 2008), and it is even harder to measure the field matrix suction.
Electrical conductivity is one of the inherent properties of soil. For unsaturated soils with similar particle composition and pore water chemical composition, the electrical conductivity mainly depends on the change of soil moisture content (Chen et al., 2006). Considering that the magnitude of suction also depends on the water content (Lu et al., 2014), there could be some connection between the matrix suction and the electrical conductivity of unsaturated soil. Previous studies have shown that certain functional relationships exist between matrix suction (or soil water potential) and electrical conductivity (or resistivity) for different unsaturated soils (Qin et al., 2020). Laboratory tests of shallow unsaturated landslide soil with volcanic ash deposits showed that there were two functional relationships among resistivity, water content, and matrix suction under different grain sizes. When the matrix suction is below 10 kPa, the matrix suction is linearly related to the electrical resistivity and thereafter exhibited a complex non-linear relationship (De Vita et al., 2012). The laboratory test of unsaturated compacted loess showed that the resistivity of the sample had a linear relationship with the matrix suction under different degrees of compaction (Zhu and Zhang, 2018). The laboratory test of unsaturated remolded kaolin showed that the relationship between resistivity of the sample with different porosity ratios and its matrix suction could be fitted with a power function and that the electrical resistivity is related to the air-entry value and the saturated state (Cardoso and Dias, 2017). The laboratory test of compacted granite residual soils showed that the resistivity value decreased with increasing water content and dry density and tended to constant at higher values (Kong, et al., 2017). However, most of the current research is performed based on remolded soil, the pore structure, and liquid phase composition of which are quite different from the in-situ soil (Zhou et al., 2009). As a result, whether the above model can accurately describe the matrix suction change law under the natural state of soil is still open to question. Therefore, it is necessary to carry out relevant tests to obtain the conductivity-matrix suction function model of in-situ soil.
Undisturbed soil samples maximize the integrity of the natural structure of the soil, so the results obtained from in-situ soil testing can reflect the properties of the in-situ soil in the field to the best extent. China is a country with frequent occurrence of landslides (Zhang, et al., 2021a; Huang, et al., 2021; Zhang Z et al., 2020; Lee, et al., 2021; Xu, et al., 2020), especially in the Fujian area where hills and mountains are developed, and granite residual soil is widely distributed. The climate in this area is humid and rainy. A large number of granite residual soil slopes fail during monsoon and rainstorm season every year, with the characteristics of sudden occurrence and wide distribution, causing a large amount of property loss and casualties (Liu, et al., 2021; Y.; Zhang et al., 2021; Shaunik and Singh, 2020; Huang and; Huang, et al., 2017; Karrech, et al., 2021; Zhang Z et al., 2020; Huang, et al., 2020; Huang F, et al., 2021). The change of matrix suction of shallow unsaturated soil slope is one of the important reasons for the instability and failure of shallow landslides (Huang F et al., 2017; McQuillan, et al., 2020; Li, et al., 2016; Raghuram and Basha, 2021). Under rainfall-induced conditions, the infiltration of rainwater leads to the reduction of matrix suction and shear strength (Zhang Y. et al., 2020; Zhang et al., 2021c), and the consequent reduction of stability coefficient, thus leading to slope instability (Bar, et al., 2020; Y.; Zhang et al., 2021b; J.; Zhang, et al., 2021; Dou, et al., 2014). Therefore, it is necessary to investigate the infiltration response and suction distribution of shallow unsaturated soil slope under rainfall conditions.
In this paper, artificial trench excavation is carried out on the landslide, artificial rainfall simulation equipment is arranged on the top edge of the trench, and the field prototype rainfall test is carried out. The relationship model between electric parameter and matrix suction is tested based on the laboratory test of undisturbed soil and the field data are used to verify and analyze the application. The dynamic response law of hydrology, conductivity and suction under shallow rainwater infiltration of unsaturated granite soil slope is obtained. The relationship between conductivity parameters and matrix suction is further revealed, and a new method for indirect measurement of matrix suction is proposed, and its feasibility is verified based on field tests. The research results are of great significance for landslide monitoring and early warning.
2 Laboratory Test
2.1 Test Material
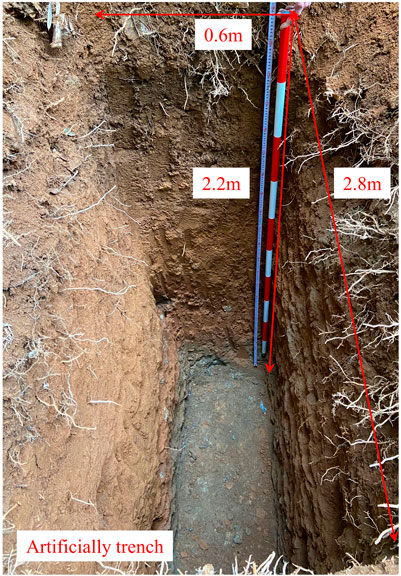
The soil samples are taken from Yandou village landslide in Sanming City, Fujian province. The specific location is shown in Figure 1. The soil samples are granite residual soil, which is yellow brown. The samples are taken at different depths of the artificial trench, the specific depths are 0.5, 1.0, 1.5 and 2.0 m, respectively. The photographs of the field artificial trench is shown in Figure 2.
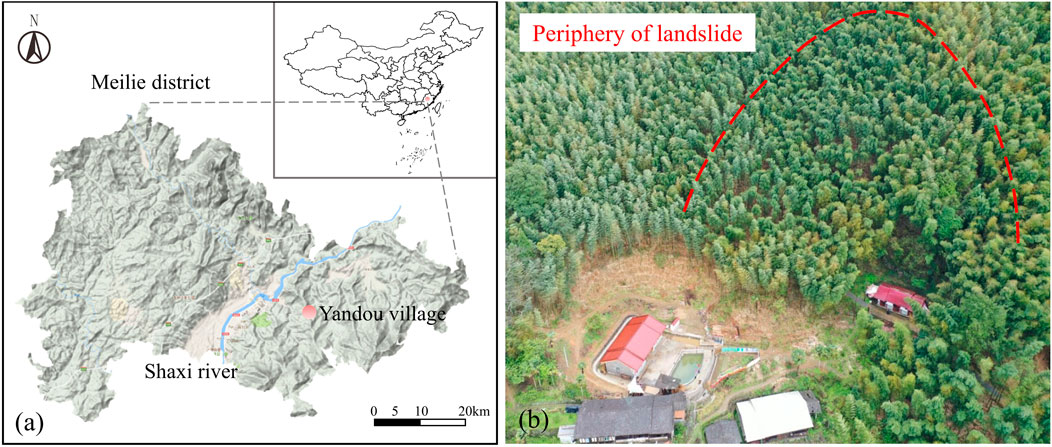
FIGURE 1. The address of test site and periphery of landslide. (A) The address of test site. (B) The periphery of landslide.
The basic physical properties of granite residual soil are listed in Table 1, and the mineral composition and physical and chemical properties are listed in Table 2. According to GBT 50123-2019 (China), the limit water content is determined by the liquid-plastic limit method. The instrument used is the GYS-2 liquid-plastic limit tester of Nanjing soil instrument factory (Li, et al., 2022). The saturated permeability coefficient is determined by the constant water head method. The instrument used is model TST-70 permeameter of the Nanjing soil instrument factory. The mineral composition is determined by Malvern Panalytical’s X'Pert³ X-ray diffractometer (Wang, et al., 2021; Ma, et al., 2021). The potential of hydrogen (pH) value is determined by the potential method. The organic content is determined by potassium dichromate method. The cation exchange capacity is determined by sodium acetate-flame photometry. The scanning electron microscope (SEM) is tested by Nova NanoSEM 230 (Fei Czech Republic S.R.O.) field emission scanning electron microscope.
Figure 3 presents the SEM microstructure of granite residual soil at different depths. It reveals that most of the minerals in the residual soil are flake kaolinite and their arrangement varies with the soil depth. As shown in Figures 3A,B, at smaller depths (0.5 and 1.0 m), the flaky kaolin is in point-to-point contact and point-to-surface contact with dispersed structure and sheet frame structure. As shown in Figures 3C,D, the flaky kaolin is in surface-to-surface contact with dispersed structure and sheet frame structure. With increasing depth, the orientation of kaolin minerals is more obvious, and the structure of residual soil is better.
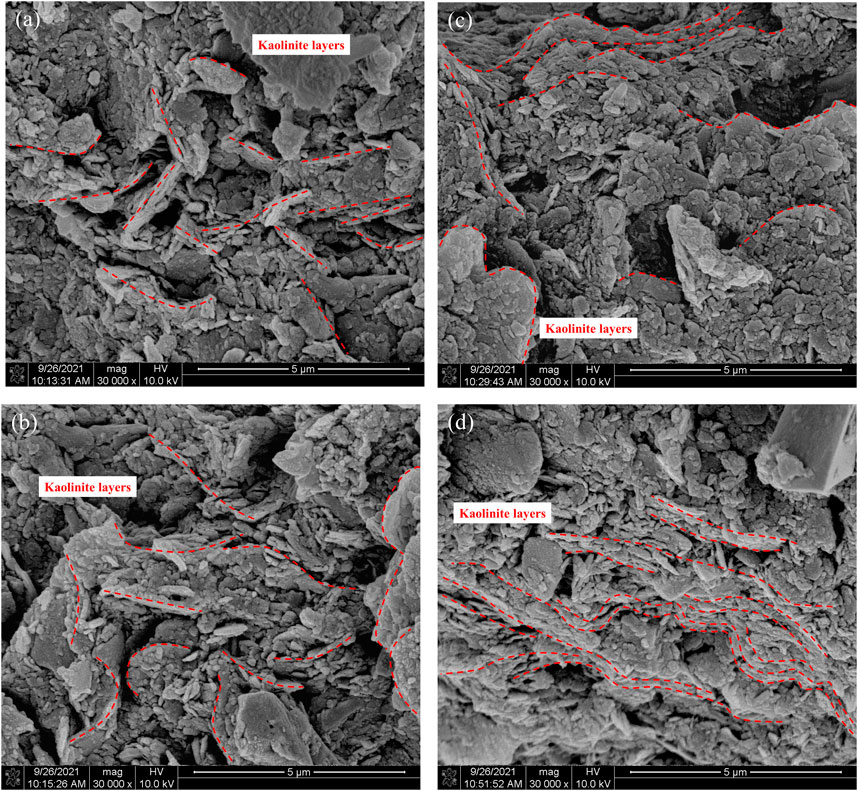
FIGURE 3. SEM micrographs of residual soil at different depths. (A) Depth=0.5 m. (B) Depth=1.0 m. (C) Depth=1.5 m. (D) Depth=2.0 m.
2.2 Test Method
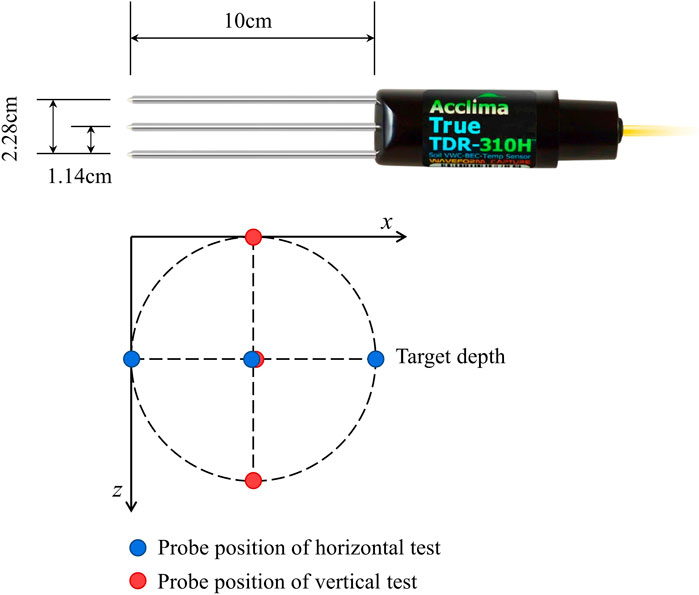
In-situ soil samples are taken at different depth points of the artificial cutting slope using a circular thin-walled soil extractor. Great care is taken during the sampling process so that the soil sample is basically undisturbed. The TRUE TDR-310H sensor probe from Acclima is used to study the electrical conductivity of soil. The specification is shown in Figure 4. The electrical conductivity of pore water, soil dielectric constant, soil volumetric water content, and soil temperature can be measured simultaneously. It is worth noting that the electrical conductivity of soil measured by the sensor probe is the conductivity value of soil mass (including soil particles and pore water) between the two probes. When the probe direction is changed, the electrical conductivity in different directions can be measured. The details are shown in Figure 4. The data logger is CR-1000 from CAMPBELL SCIENTIFIC, United States.
The conductivity values measured using the TDR-310H probe need to be corrected for temperature by the following formula:
where
The Filter paper method (Houston et al., 1994), the pressure plate method (Ma et al., 2016), the chilled mirror dewpoint method (Leong et al., 2003), and the GDS apparatus method (Gao et al., 2019) are often used to test the matrix suction of soil in the laboratory. In this work, to maintain the structure of in situ soil and obtain data over a high suction range (Raghuram, et al., 2021), the matrix suction of soil samples is tested by the filter paper method according to ASTM D5298-10. The specification of the cutting ring is Φ61.8 × 20 mm, the equilibrium time is 7 d, and the soil moisture content is controlled by the moisture absorption method. The filter paper is Whatman No. 42 from United States. The same batch of filter paper is used for soil test at different depths. Its standard calibration curve formula (Leong et al., 2003) is shown below:
where
2.3 Results Analysis
2.3.1 Analysis of Soil-Water Characteristic Curve
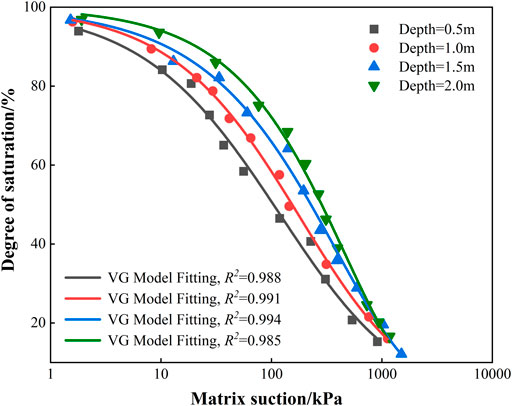
The relationship between suction and saturation (or volume water content) of unsaturated soil is called SWCC, which describes the water holding capacity of unsaturated soil under different suction conditions (Leong and Rahardjo, 1997). The SWCC of in situ soil at different depths are plotted in Figure 5.
The VG model is an effective SWCC model for fitting the soil-water characteristic curve (Van Genuchten, 1980). Considering that the residual saturation or residual matrix suction of the residual soil is difficult to determine, the VG model is modified (Chin et al., 2010) in the following form:
where S is soil saturation, a, b and c are the fitting parameters. The experimental data are fitted by Eq. 3 and the fitting result is shown in Figure 5.
Figure 5 reveals that the SWCC curves of soil samples from different depths are not identical. This may be caused by the difference of stress, structure, and physical and chemical properties of soil. Combining with the analysis of Figure 3, with the increase of depth, the overlying soil stress increases, and the soil structure becomes more complete. The pore structure in soil has certain orientation, and the soil particles and clay minerals are arranged in a certain direction. As a result, the soil has an increasing air-entry value and an increasing water-holding capacity. The mineral composition of the soil varies at different depths. Combining with the analysis of Table 2, as the depth increases, the proportional content of quartz decreases and the proportional content of clay minerals increases. When the clay content increases, the water-holding capacity of the soil is stronger, and the dehumidification rate is smaller. This is in accordance with the experimental results in Figure 5. The above analysis confirms the reliability of the filter paper method for measuring matrix suction and the VG modified model.
2.3.2 Analysis of Conductivity-Related Structural Parameters
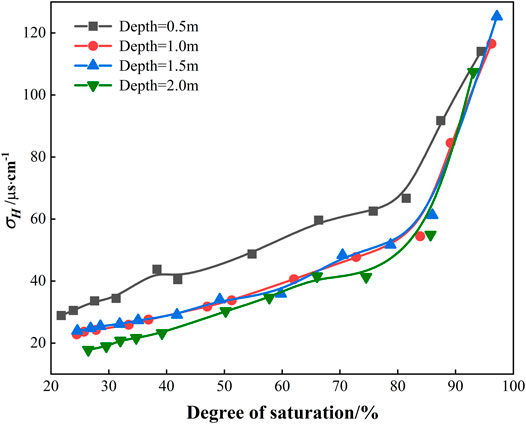
Figure 6 shows the experimental relationship between the horizontal electric conductivity and soil saturation. The following rules can be found from the diagram: (1) The horizontal electric conductivity of soil increases with the increase of saturation degree. (2) With increasing saturation, a smaller saturation increment can lead to a large increase in horizontal conductivity.
When the saturation reached a certain value (in this test, about 80%), the horizontal conductivity increased rapidly with the increase of the saturation. The direct consequence of the increase of soil saturation is the enhancement of the conductivity of soil pores. This results in an increase in the thickness of electric double layer on the surface of soil particles, which enhances the surface conductivity of soil particles. The increase of saturation can significantly improve the connectivity of pore water, which improves the electrical conductivity of soil pore water and thus increases the overall electrical conductivity. It shows that the change of soil structure has an effect on its electric conductivity. In addition, the values of the horizontal conductivity of the soil at different depths with same saturation are different. The electrical conductivity of the shallow soil (z = 0.5 m) is obviously larger than that of the deeper soil. Combined with the analysis of soil’s physical and chemical properties in Table 2, it suggests the development of shallow roots and the retention of plant nutrients may cause high soil organic matter content and cation exchange capacity, leading to the higher electrical conductivity of shallow soil.
Archie (1942) first applied the theory of electrical conductivity to the study of soil microstructure and proposed the concept of structure factor F to reflect the microstructure characteristics of soil (Archie, 1942). The structure factor F is defined as the ratio of the total resistivity of porous media to the resistivity of its pore liquid and the structure factor is mainly related to the porosity and pore structure. Based on Archie’s research results, three basic conductivity structure parameters by measuring the horizontal, vertical, and pore water conductivity were proposed (Arulanandan and Muraleetharan, 1988). The physical meaning of conductivity structure parameters were clearly defined.
The average structure factor
where
where
The average shape factor
where n is the porosity of soil.
The anisotropy coefficient A reflects the anisotropy of soil and quantifies the directional arrangement of soil particles and its specific formula is:
Based on the results of laboratory tests and the above formulas, the conductivity-related structural parameters of in situ soil with different depth and saturation degree are calculated. The conductivity-related structural parameters include average structure factor
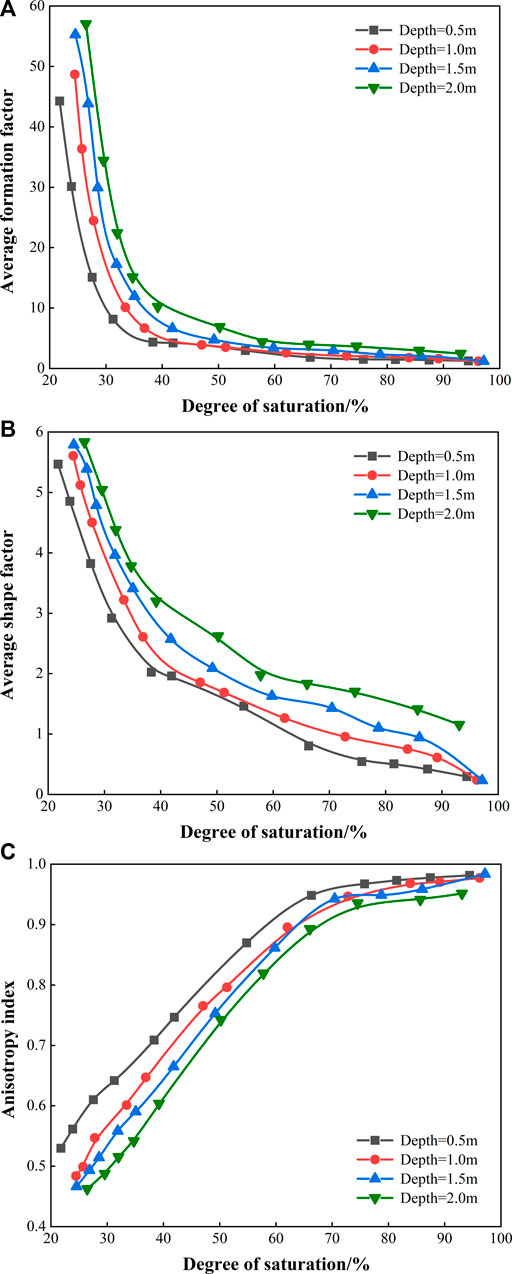
FIGURE 7. (A) Relationship between the conductivity-related structural parameters and soil saturation. (B) Relationship between average shape factor and degree of saturation. (C) Relationship between anisotropy index and degree of saturation.
2.3.3 Analysis of Conductivity-Matrix Suction Prediction Model
For unsaturated soil, the electrical conductivity and matrix suction are closely related to the soil saturation, which are the comprehensive reflection of the microstructure of unsaturated soil. Therefore, there must be an essential relationship between the conductivity-related structural parameters and its matrix suction. The conductivity-related structural parameters can be used to describe the suction of unsaturated soil and its change law. However, neither of them can individually and accurately describe the variation of matrix suction in soils. Matrix suction in unsaturated soils is the result of the combined effect of soil structure, particle composition, particle arrangement, saturation, and other factors. Zha et al. (2010) proposed a new method to characterize the matrix suction by the comprehensive structural parameter Re (Zha et al., 2010) and its formula is:
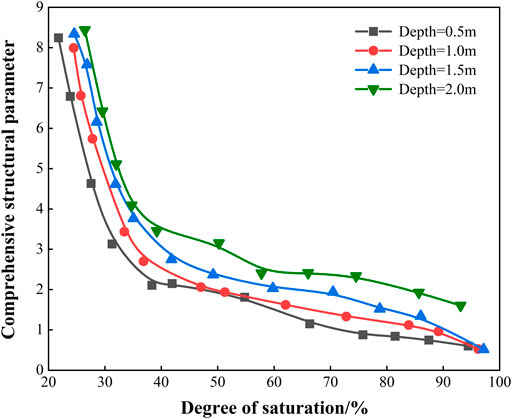
Figure 8 shows the relationship between comprehensive structural parameter and soil saturation. It can be seen from the diagram that there is a good correlation between the parameter Re and the saturation. When the soil saturation is high, the comprehensive parameter Re is small, and the influence of saturation it is minimal. When the saturation is low (<35%), the change of the saturation has a great influence on the comprehensive parameter. A slight decrease of saturation leads to a dramatic increase of the comprehensive parameter Re.
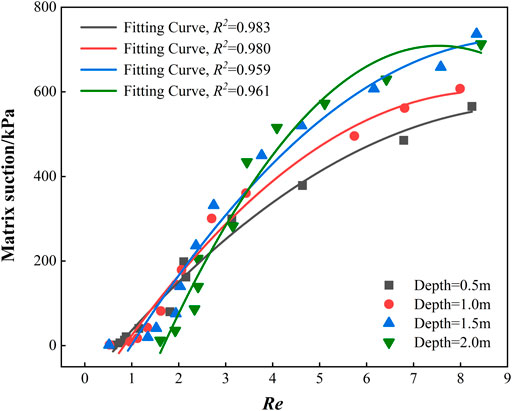
Figure 9 shows the relationship between comprehensive structural parameter and matrix suction. It indicates that there is a parabola relationship between the parameter Re and the matrix suction. The matrix suction of unsaturated soil increases with the increase of parameter Re. In this way, a simple parabola equation between matrix suction and comprehensive structural parameter (Re) can be established and the Re can be used to predict the matrix suction.
Based on the test results in Figure 9, a general functional relationship between matrix suction and comprehensive structural parameter of unsaturated soils is established:
where
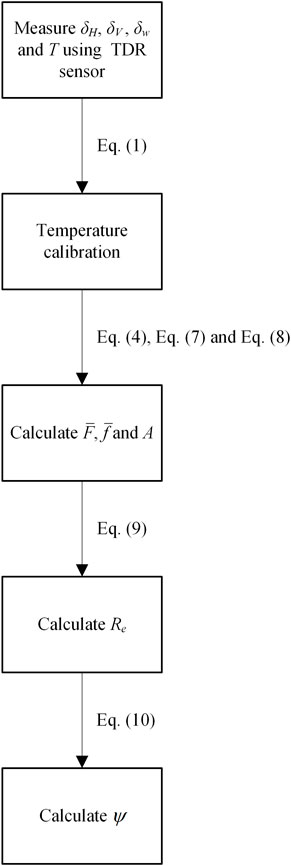
Finally, the matrix suction is obtained by this prediction model. The procedure of this method is summarized using a flowchart in Figure 10, which can be divided into five steps: (1) measurement of horizontal conductivity, vertical conductivity and pore water conductivity of unsaturated soil using TDR-310H sensor; (2) the temperature calibration of the electrical conductivity using Eq. 1; (3) calculation of the conductivity-related structural parameters (
It should be noted that the prediction model is established in the condition that Re is in the range of 0–8 and the matrix suction is in the range of 0–800 kPa. The vertex of the quadratic function is about to be reached when Re = 8. There is a negative correlation between Re and matrix suction in the range of Re > 8. Accordingly, the prediction model may be invalid when Re > 8.
3 In-situ Verification
3.1 Test Scheme
3.1.1 In-situ Instrumentation
A conductivity-matrix suction prediction model was established for shallow unsaturated soil samples in laboratory tests. An artificially simulated rainfall test was carried out on Yandou landslide to verify this model. Once the model was proven to be effective, the response of matrix suction of soil samples at different slope depths to rainfall infiltration were investigated.
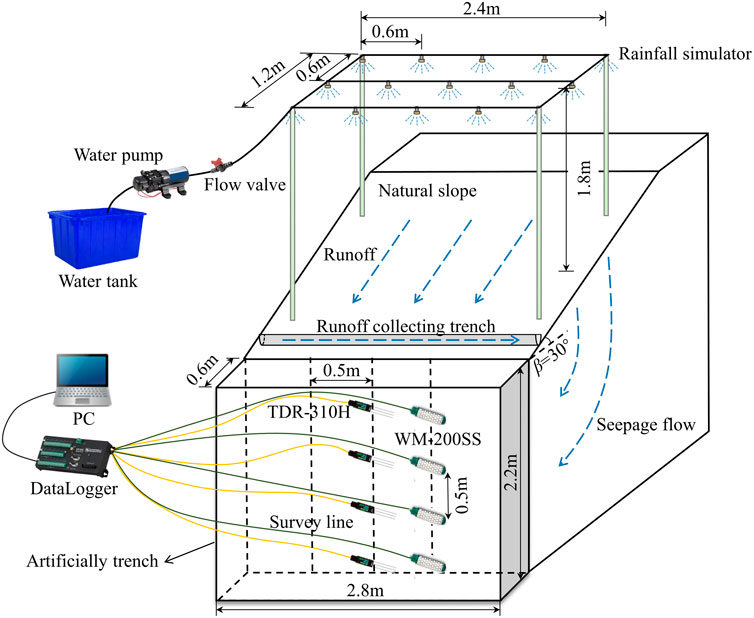
The height H of the artificial trench was 2.2 m, the width B was 2.8 m (see Figure 2). A monitoring point was arranged every 0.5 m on the trench surface, and a vertical monitoring line was formed by four monitoring points from top to bottom. Three monitoring lines were successively arranged on the trench surface, with an interval of 0.5 m for each line. The rainfall simulation device was arranged on the natural surface (trench edge). The length of device l was 2.4 m, the width b was 1.2 m, the distance between each rainfall nozzle d was 0.6 m, the average height of nozzle from ground h was 1.8 m. A PVC pipe was buried at the top of the edge of the trench as a runoff collecting trench. Water was stored in a water tank and supplied by a water pump. The flow valve was used to regulate the rainfall intensity. The monitoring instruments were TDR-310H sensor probe and WATERMARK-200SS matrix suction sensor probe (Irrometer Company). The data logger was CR-1000 from Campbell Scientific Company. The data collection interval was 10 min. For the problem of rainfall-induced shallow slope instability, the intensity of rainfall must be large enough and exceed the saturation permeability coefficient of the surface soil of the slope (De Vita et al., 2012). For this reason, the rainfall intensity I of 20 mm/h and the rainfall duration T of 6 h were selected for the site rainfall in this work. Simulated rainfall started at 8:00 a.m. The duration of data acquisition was 48 h. The detailed site diagram is shown in Figure 11.
3.1.2 Calibration of Matrix Suction Sensor
WATERMARK-200SS matrix suction sensor is a granular matrix sensor. The resistance Rx of sensor is measured by a known built-in voltage divider circuit and the matrix suction of the soil is determined by the calibration equation. The default calibration equation for the sensor was developed by Clinton Shock in 1998 (Shock et al., 1998), as shown in Eq. 11:
where
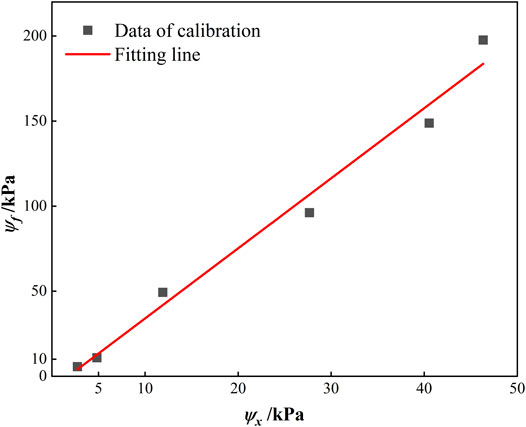
The calibration equation of Eq. 11 is only applicable in the range of 10–100 kPa matrix suction. Beyond this range, the sensor automatically uses linear extrapolation to determine matrix suction, resulting in calculation error. In addition, the calibration equation is proposed for Owyhee silt loam soil, and the characteristics of granite residual soil in this work are quite different, so the calibration equation itself may have a deviation. It is known that if the value of the matrix suction signal from the WATERMARK sensor is directly used as the final experimental result, it may result in large error. To reduce the experimental error and modify the calibration equation so that it can be applied to the soil sample in this test, the calibration test is carried out in the laboratory. The matrix suction measured by the filter paper method is used as the reference value in the calibration test. Six calibration points are selected, which are at 5.7, 10.9, 49.3, 96.2, 148.8 and 197.6 kPa, respectively. The matrix suction signal values at different calibration points are measured for the same batch of soil samples. The test results are shown in Figure 12.
The calibration point of Figure 12 is fitted by linear equation and the calibration curve of the WATERMARK matrix suction sensor is obtained as follows:
3.2 Result Analysis
3.2.1 Accuracy Analysis of Prediction Model
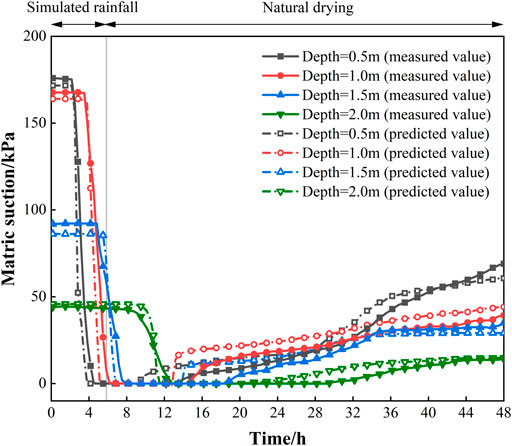
The data collected by the WATERMARK matrix suction sensor and the data calculated by the prediction model are presented together in Figure 13. The former is the measured value and the latter is the predicted value.
In the moisture absorption stage, the relative error of the initial value is -5.83–2.67%. When the matrix suction begins to decline rapidly, the prediction model shows a high agreement. In the dehumidification stage, it can be found that the prediction model for matrix suction recovery is advanced. Compared with the measured values, the predicted matrix suction recovered earlier and the matrix suction at the same time point is larger. There may exist an hysteresis effect in the process of moisture absorption and dehumidification of unsaturated soil, which results in two kinds of soil-water characteristic curves (wetting curve and drying curve), and it shows that this model cannot reflect the hysteresis of suction recovery. However, as the dehumidification process continues, the matrix suction increases, the error caused by hysteresis decreases gradually, and the relative error can still be controlled within 10% in the late dehumidification stage. Overall, the relative error of the prediction model is controllable and the accuracy is good. The field test further proves the feasibility of indirectly measuring the matrix suction of unsaturated soil by the composite structure parameters of electrical conductivity.
3.2.2 Time-History Analysis of Infiltration Rate
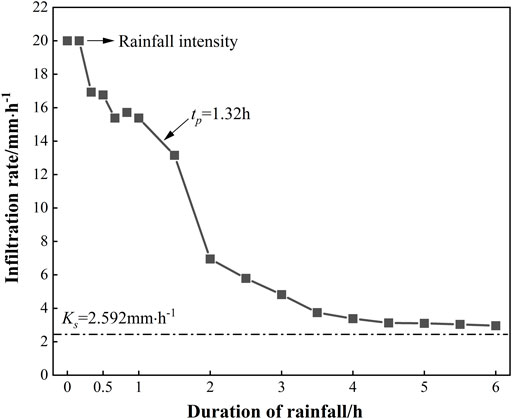
During the simulated rainfall, the flow rate at the outlet of the runoff gathering pit was measured with a measuring cylinder. Testing was done every 10 min before the occurrence of slope runoff and every 30 min after the occurrence of slope runoff. Based on the inverse calculation of the infiltration rate, the calculated results are plotted as the infiltration rate time-history curve, as shown in Figure 14.
Figure 14 indicates that during the first 20 min of rainfall, all the rainwater seeped into the soil, and the infiltration rate is equal to the rainfall intensity. With the development of rainfall, the rainfall cannot penetrate the slope completely because of the effect of rainwater dripping and the vegetation barrier, and part of it remains on the slope temporarily and cannot form runoff. At t = 1.32 h, the field observation found that stranded runoff started to appear on the slope. After that, the infiltration rate gradually decreased with the duration of rainfall. When t > 4h, the change of infiltration rate gradually slowed down and finally stabilized at about 3.26 mm/h, which is slightly larger than the permeability coefficient Ks = 7.2 × 10⁻⁵ cm/s = 2.592 mm/h.
3.2.3 Analysis of Time History Curve of Central Line
The central measurement line was selected as the main measurement line for this monitoring and the time variation curves of infiltration response of saturation, structural parameters, and matrix suction on the main measurement line are plotted sequentially in Figure 15.
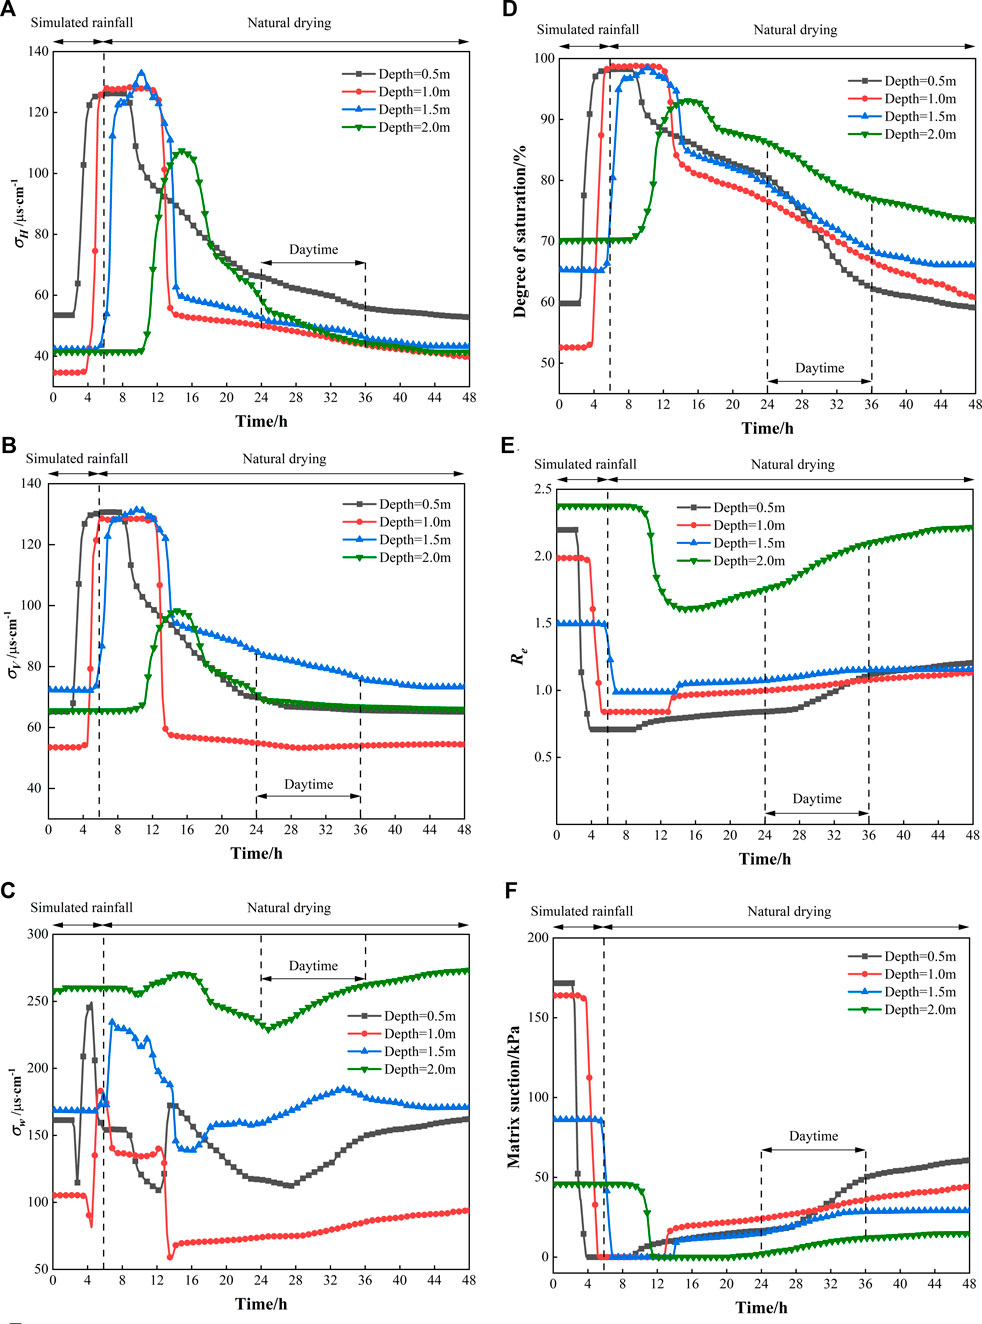
FIGURE 15. (A) Time-history curve of the horizontal electric conductivity. (B) Time-history curve of the vertical electric conductivity. (C) Time-history curve of the conductivity of pore water. (D) Time-history curve of soil saturation. (E) Time-history curve of comprehensive structural parameters. (F) Time-history curve of matrix suction.
Figure 15A shows that the horizontal electric conductivity increases rapidly with the wetting front after rainfall. It illustrates that there is a positive correlation between the horizontal electric conductivity and saturation. Moreover, a similar trend of the vertical electric conductivity is shown in Figure 15B. The magnitude of the vertical electric conductivity is slightly larger than that of the horizontal electric conductivity. The penetrated channel in the vertical direction caused by rainwater during the rainfall may lead to the increase in the electric conductivity. Figure 15C is the time-history curve of the conductivity of pore water. It indicates that there is no consistent trend for the change of the conductivity of pore water. The conductivity of pore water fluctuated sharply in z < 1.5 m while is fluctuated slightly at z = 2.0 m.
Figure 15D illustrates that: (1) The initial saturation of soil shows an upward trend from top to bottom, which is 59.81, 52.57, 65.31 and 70.14%, respectively. At z = 0.5 m, the soil saturation is slightly higher. This may be attributed to the root reinforcement near the surface, which results in a higher water-holding capacity of the soil at this location. (2) Soil infiltration response has a lag that lasts longer at a larger depth. The response time of the wetting front from top to bottom is 1.74, 3.92, 5.68 and 9.50 h, respectively. At z = 2.0 m, the response is the slowest, the rising rate is the slowest, and the range of saturation is the smallest. A similar pattern is observed during the period of natural dehumidification after the rain stopped. (3) During 24 h < t < 36 h, the decrease trend of saturation is accelerated, and the trend is the most obvious at 0.5 m. This is because during daytime the temperature of slope surface rises under the sunlight and the evaporation rate speeds up, which leads to a larger water loss.
Figure 15E shows that the change trend of comprehensive structural parameter (Re) is opposite to the change trend of saturation (S). The Re decreases rapidly during the simulated rainfall period but increases slowly during the natural drying period. As can be seen from Figure 15F: (1) The initial matrix suction decreases from top to bottom, the shallow depth makes the suction larger, and the deep depth makes the suction smaller, which is 171.64, 163.95, 86.15 and 45.82 kPa, respectively. Combined with the analysis of Figure 15D, it can be concluded that in the initial stage, with the increase of depth, the soil saturation gradually increases, and the matrix suction gradually decreases. (2) The response time of matrix suction is synchronized with the hydrological response. When the wetting front reaches the corresponding depth, the matrix suction decreases rapidly to zero. The time to reach zero suction is 3.83, 5.16, 6.5 and 11.83 h, respectively, and the duration in the zero suction state is 5.33, 7.67, 7.00 and 8.33 h, respectively. (3) There is no significant correlation between the recovery rate of matrix suction and depth during natural drying period. During 24 h < t < 36 h, the recovery rate of matrix suction increased significantly at z = 0.5 m, which is related to the decrease of soil saturation. During the rest of the dehumidification period, the recovery rates are similar. At the end state (t = 48 h), the matrix suction distribution is the same as the original state, but the corresponding values have been decreased to 60.66, 44.17, 29.10 and 14.79 kPa, respectively. Compared with the monitoring results of the saturation in Figure 15D at the same time, the results show that although the saturation is almost the same as the initial state, the matrix suction decreases greatly. This indicates that the recovery of matrix suction has a greater lag than the saturation. Namely, the recovery time of matrix suction to the initial state is longer than that of saturation.
3.2.4 Analysis of Matrix Suction Distribution on Slope at Different Time
To analyze the distribution of substrate suction on the artificially cut slope more intuitively, the monitoring data at typical moments on the three measurement lines are selected and plotted as a substrate suction contour map (Figure 16). The data between the actual points are generated by interpolation of the cubic spline curve and extrapolated at the boundary to a range of 20 cm.
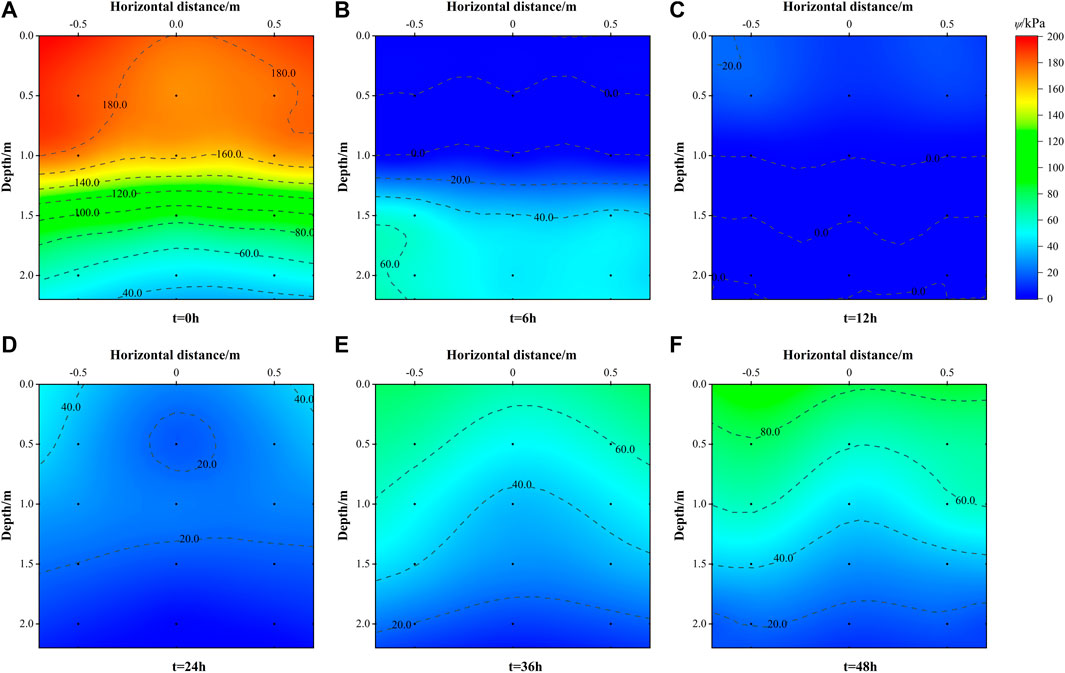
FIGURE 16. The isolines of matrix suction on section at different times. (A) t = 0 h (B) t = 6 h (C) t = 12 h (D) t = 24 h (E) t = 36 h (F) t = 48 h.
Figure 16 shows that at the initial state (t = 0 h), the overall matrix suction force on the slope is large on the top and small on the bottom, the suction force on the left side of the profile above 1.2 m is slightly larger than that on the right side, the suction force on the profile below 1.2 m is roughly distributed in horizontal layers, and the suction force value decreases layer by layer. At t = 6 h (when the simulated rainfall stops), the wetting front reaches about z = 1.1 m due to the lag of rainfall infiltration, and the depth range (z ≤ 1.1) is saturated, which shows the matrix suction
4 Conclusion
Laboratory and field tests on unsaturated undisturbed soil at different depths of Yandoucun landslide in Meilie District, Sanming City, Fujian Province were carried out in this paper. Through the use of physical and chemical property analysis, scanning electron microscope test, filter paper method test, comprehensive structural parameter test of electrical conductivity, in-situ simulated rainfall test, and SWCC curve, we obtained the electric parameter matrix suction prediction model for unsaturated granite residual soil at different depths in this area. The model is verified by the prototype rainfall experiment. Based on this model, the matrix suction distribution of in-situ artificial trench was predicted. The dynamic response law under the influence of artificial rainfall was studied. The following conclusions were obtained:
1) With the increase of depth within 2.0 m, the content of clay minerals in soil increases, the weathering decreases, the structure of soil particle is better, the content of organic matter decreases, the amount of cation exchange decreases, and the dehumidification rate is smaller.
2) There is a good correlation between the structural parameters of electrical conductivity and saturation of soil samples at different depths. The average structure factor (
3) In-site verification test shows that the relative error of the model is -5.83–2.67% in the moisture absorption stage, the prediction accuracy of the model in the dehumidification stage is advanced, the relative error can be controlled within 10%, and the accuracy of the model is good and feasible.
4) The in-situ rainfall simulation test on cut slope shows that the infiltration rate decreases in hyperbolic shape with time, it gradually approaches the saturated permeability coefficient of soil at the later stage of rainfall, and the response of soil saturation and matrix suction has hysteresis that lasts longer at a larger depth. During the daytime, the natural dehumidification of saturation and the recovery of matrix suction are faster and it takes more time for matrix suction to recover to its initial state.
5) Initially, the overall distribution of matrix suction on the slope is stratified with a large top and a small bottom, the wetting front gradually moves down with rainfall, and the matrix suction drops to 0 in the saturation zone. The matrix suction gradually recovers during natural drying, the recovery rate is slow in the middle and fast on both sides, and the contour distribution shows a parabolic pattern with downward opening.
Data Availability Statement
The raw data supporting the conclusion of this article will be made available by the authors, without undue reservation.
Author Contributions
RC: experiment design, scientific analysis and manuscript writing. YL: data collection. QL and HD: orginal draft preparation. WJ and LR: project management, review and editing. All authors contributed to the article and approved the submitted version.
Funding
This work was funded by the National Natural Science Foundation of China (NSFC-CONICYT, 41861134011; U2005205).
Conflict of Interest
The authors declare that the research was conducted in the absence of any commercial or financial relationships that could be construed as a potential conflict of interest.
Publisher’s Note
All claims expressed in this article are solely those of the authors and do not necessarily represent those of their affiliated organizations, or those of the publisher, the editors, and the reviewers. Any product that may be evaluated in this article, or claim that may be made by its manufacturer, is not guaranteed or endorsed by the publisher.
Acknowledgments
Thanks to Guangdong Zhong of Fujian Geological Testing Research Center for his support to the physical and chemical properties test in this paper, and thanks to Jianhang Lin of Fuzhou University Testing Center for his support to the XRD and SEM tests in this paper.
References
Archie, G. E. (1942). The Electrical Resistivity Log as an Aid in Determining Some Reservoir Characteristics. Trans. AIME 146 (01), 54–62. doi:10.2118/942054-g
Arulanandan, K., and Muraleetharan, K. K. (1988). Level Ground Soil‐Liquefaction Analysis Using In Situ Properties: I. J. Geotechnical Eng. 114 (7), 753–770. doi:10.1061/(asce)0733-9410(1988)114:7(753)
Bar, N., Kostadinovski, M., Tucker, M., Byng, G., Rachmatullah, R., Maldonado, A., et al. (2020). Rapid and Robust Slope Failure Appraisal Using Aerial Photogrammetry and 3D Slope Stability Models. Int. J. Mining Sci. Tech. 30 (5), 651–658. doi:10.1016/j.ijmst.2020.05.013
Cardoso, R., and Dias, A. S. (2017). Study of the Electrical Resistivity of Compacted Kaolin Based on Water Potential. Eng. Geology. 226, 1–11. doi:10.1016/j.enggeo.2017.04.007
Chen, Z., Sun, S., Fang, X., Zhou, H., and Xie, Y. (2006). Recent Advances of the Measuring Technology for Unsaturated Soils and Special Soils. Yantu Gongcheng Xuebao(Chinese J. Geotechnical Engineering) 28 (2), 147–169.
Chin, K.-B., Leong, E.-C., and Rahardjo, H. (2010). A Simplified Method to Estimate the Soil-Water Characteristic Curve. Can. Geotech. J. 47 (12), 1382–1400. doi:10.1139/t10-033
De Vita, P., Di Maio, R., and Piegari, E. (2012). A Study of the Correlation between Electrical Resistivity and Matric Suction for Unsaturated Ash-Fall Pyroclastic Soils in the Campania Region (Southern Italy). Environ. Earth Sci. 67 (3), 787–798. doi:10.1007/s12665-012-1531-4
Delage, P., Romero, E., and Tarantino, A. (2008). Recent Developments in the Techniques of Controlling and Measuring Suction in Unsaturated Soils, in Unsaturated Soils. Adv. Geo-Engineering 2008, 33–52. doi:10.1201/9780203884430-6
Dou, H.-q., Han, T.-c., Gong, X.-n., and Zhang, J. (2014). Probabilistic Slope Stability Analysis Considering the Variability of Hydraulic Conductivity under Rainfall Infiltration-Redistribution Conditions. Eng. Geology. 183, 1–13. doi:10.1016/j.enggeo.2014.09.005
Fredlund, D. G., and Rahardjo, H. (1993). Soil Mechanics for Unsaturated Soils. New York: John Wiley & Sons Inc.
Gao, Y., Sun, D. a., Zhu, Z., and Xu, Y. (2019). Hydromechanical Behavior of Unsaturated Soil with Different Initial Densities over a Wide Suction Range. Acta Geotech. 14 (2), 417–428. doi:10.1007/s11440-018-0662-5
Houston, S. L., Houston, W. N., and Wagner, A. (1994). Laboratory Filter Paper Suction Measurements. Geotechnical Test. J. 17 (2), 185–194.
Huang F, F., Yin, K., Huang, J., Gui, L., and Wang, P. (2017). Landslide Susceptibility Mapping Based on Self-Organizing-Map Network and Extreme Learning Machine. Eng. Geology. 223, 11–22. doi:10.1016/j.enggeo.2017.04.013
Huang, F., Yan, J., Fan, X., Yao, C., Huang, J., Chen, W., et al. (2021). Uncertainty Pattern in Landslide Susceptibility Prediction Modelling: Effects of Different Landslide Boundaries and Spatial Shape Expressions. Geosci. Front. 13, 101317 doi:10.1016/j.gsf.2021.101317
Huang, F., Cao, Z., Jiang, S.-H., Zhou, C., Huang, J., and Guo, Z. (2020). Landslide Susceptibility Prediction Based on a Semi-supervised Multiple-Layer Perceptron Model. Landslides 17 (12), 2919–2930. doi:10.1007/s10346-020-01473-9
Huang, F., Huang, J., Jiang, S., and Zhou, C. (2017). Landslide Displacement Prediction Based on Multivariate Chaotic Model and Extreme Learning Machine. Eng. Geology. 218, 173–186. doi:10.1016/j.enggeo.2017.01.016
Huang, F., Tao, S., Chang, Z., Huang, J., Fan, X., Jiang, S.-H., et al. (2021). Efficient and Automatic Extraction of Slope Units Based on Multi-Scale Segmentation Method for Landslide Assessments. Landslides 18 (11), 3715–3731. doi:10.1007/s10346-021-01756-9
Karrech, A., Dong, X., Elchalakani, M., Basarir, H., Shahin, M., and Regenauer-Lieb, K. (2021). Limit Analysis for the Seismic Stability of Three-Dimensional Rock Slopes Using the Generalized Hoek-Brown Criterion. Int. J. Mining Sci. Tech.. doi:10.1016/j.ijmst.2021.10.005
Kong, L., Sayem, H. M., Zhang, X., and Yin, S. (2017). Relationship between Electrical Resistivity and Matric Suction of Compacted Granite Residual Soil. in PanAm Unsaturated Soils 2017 2017, 430–439. doi:10.1061/9780784481707.043
Lee, K., Suk, J., Kim, H., and Jeong, S. (2021). Modeling of Rainfall-Induced Landslides Using a Full-Scale Flume Test. Landslides 18 (3), 1153–1162. doi:10.1007/s10346-020-01563-8
Leong, E.-C., Tripathy, S., and Rahardjo, H. (2003). Total Suction Measurement of Unsaturated Soils with a Device Using the Chilled-Mirror Dew-point Technique. Géotechnique 53 (2), 173–182. doi:10.1680/geot.2003.53.2.173
Leong, E. C., and Rahardjo, H. (1997). Review of Soil-Water Characteristic Curve Equations. J. Geotechnical Geoenvironmental Eng. 123 (12), 1106–1117. doi:10.1061/(asce)1090-0241(1997)123:12(1106)
Li, L., Zheng, M., Liu, X., Wu, W., Liu, H., Hesham El Naggar, M., et al. (2022). Numerical Analysis of the Cyclic Loading Behavior of Monopile and Hybrid Pile Foundation. Comput. Geotechnics 144 (6), 104635. doi:10.1016/j.compgeo.2022.104635
Li, W., Liu, C., Hong, Y., Saharia, M., Sun, W., Yao, D., et al. (2016). Rainstorm-induced Shallow Landslides Process and Evaluation - a Case Study from Three Hot Spots, China. Geomatics, Nat. Hazards Risk 7 (6), 1908–1918. doi:10.1080/19475705.2016.1179685
Liu, Q., Jian, W., and Nie, W. (2021). Rainstorm-induced Landslides Early Warning System in Mountainous Cities Based on Groundwater Level Change Fast Prediction. Sust. Cities Soc. 69, 102817. doi:10.1016/j.scs.2021.102817
Lu, N., and Griffiths, D. V. (2004). Profiles of Steady-State Suction Stress in Unsaturated Soils. J. Geotechnical Geoenvironmental Eng. 130 (10). doi:10.1061/(asce)1090-0241(2004)130:10(1063)
Lu, N., Kaya, M., and Godt, J. W. (2014). Interrelations Among the Soil-Water Retention, Hydraulic Conductivity, and Suction-Stress Characteristic Curves. J. Geotechnical Geoenvironmental Eng. 140 (5), 4014007. doi:10.1061/(asce)gt.1943-5606.0001085
Lu, N., and Likos, W. J. (2006). Suction Stress Characteristic Curve for Unsaturated Soil. J. Geotech. Geoenviron. Eng. 132 (2), 131–142. doi:10.1061/(asce)1090-0241(2006)132:2(131)
Ma, J., Li, X., Wang, J., Tao, Z., Zuo, T., Li, Q., et al. (2021). Experimental Study on Vibration Reduction Technology of Hole-By-Hole Presplitting Blasting. Geofluids 2021, 10. doi:10.1155/2021/5403969
Ma, T., Wei, C., Wei, H., and Li, W. (2016). Hydraulic and Mechanical Behavior of Unsaturated silt: Experimental and Theoretical Characterization. Int. J. Geomechanics 16 (6), D4015007. doi:10.1061/(asce)gm.1943-5622.0000576
McQuillan, A., Canbulat, I., and Oh, J. (2020). Methods Applied in Australian Industry to Evaluate Coal Mine Slope Stability. Int. J. Mining Sci. Tech. 30 (2), 151–155. doi:10.1016/j.ijmst.2019.11.001
Qin, P., Liu, Y., Song, Z., Ma, F., Wang, Y., Zhang, X., et al. (2020). An Electrical Resistivity Method of Characterizing Hydromechanical and Structural Properties of Compacted Loess during Constant Rate of Strain Compression. Sensors 20 (17), 4783. doi:10.3390/s20174783
Raghuram, A. S. S., Basha, B. M., and Raviteja, K. (2021). Variability Characterization of SWCC for clay and silt and its Application to Infinite Slope Reliability. J. Mater. Civil Eng. 33 (8), 4021180. doi:10.1061/(asce)mt.1943-5533.0003809
Raghuram, A. S. S., and Basha, B. M. (2021). Second-Order Reliability-Based Design of Unsaturated Infinite Soil Slopes. Int. J. Geomechanics 21 (4), 4021024. doi:10.1061/(asce)gm.1943-5622.0001954
Shaunik, D., and Singh, M. (2020). Bearing Capacity of Foundations on Rock Slopes Intersected by Non-persistent Discontinuity. Int. J. Mining Sci. Tech. 30 (5), 669–674. doi:10.1016/j.ijmst.2020.03.018
Shock, C. C., Barnum, J. M., and Seddigh, M. (1998). Calibration of Watermark Soil Moisture Sensors for Irrigation Management.
Van Genuchten, M. T. (1980). A Closed-form Equation for Predicting the Hydraulic Conductivity of Unsaturated Soils. Soil Sci. Soc. America J. 44 (5), 892–898. doi:10.2136/sssaj1980.03615995004400050002x
Wang, J., Zuo, T., Li, X., Tao, Z., and Ma, J. (2021). Study on the Fractal Characteristics of the Pomegranate Biotite Schist under Impact Loading. London, United Kingdom: Geofluids.
Xu, X., Jian, W., Wu, N., Xu, X., and Shao, L. (2020). Void Ratio–dependent Water Retention Model for a Deformable Residual clay. Int. J. Geomechanics 20 (8), 4020131. doi:10.1061/(asce)gm.1943-5622.0001773
Zha, F., Liu, S., and Du, Y. (2010). Prediction of Matric Suction of Unsaturated Soil Based on Electrical Resistivit. Rock Soil Mech. 31 (3), 1003–1008.
Zhang J, J., Luo, Y., Zhou, Z., Victor, C., and Duan, M. (2021). Research on the Rainfall-Induced Regional Slope Failures along the Yangtze River of Anhui, China. Landslides 18 (5), 1801–1821. doi:10.1007/s10346-021-01623-7
Zhang, Y. G., Tang, J., Cheng, Y. M., Huang, L., Guo, F., Yin, X. J., et al. (2022). Prediction of Landslide Displacement with Dynamic Features Using Intelligent Approaches. Int. J. Min. Sci. Tech. 2 (1), 1–11. doi:10.1016/j.ijmst.2022.02.004
Zhang, Y., Zhu, S., Tan, J., Li, L., and Yin, X. (2020). The Influence of Water Level Fluctuation on the Stability of Landslide in the Three Gorges Reservoir. Arabian J. Geosciences 13 (17), 1–10. doi:10.1007/s12517-020-05828-3
Zhang, Y.-g., Chen, X.-q., Liao, R.-p., Wan, J.-l., He, Z.-y., Zhao, Z.-x., et al. (2021c). Research on Displacement Prediction of Step-type Landslide under the Influence of Various Environmental Factors Based on Intelligent WCA-ELM in the Three Gorges Reservoir Area. Nat. Hazards 107 (2), 1709–1729. doi:10.1007/s11069-021-04655-3
Zhang, Y.-g., Tang, J., He, Z.-y., Tan, J., and Li, C. (2021a). A Novel Displacement Prediction Method Using Gated Recurrent Unit Model with Time Series Analysis in the Erdaohe Landslide. Nat. Hazards 105 (1), 783–813. doi:10.1007/s11069-020-04337-6
Zhang, Y.-g., Tang, J., Liao, R.-p., Zhang, M.-f., Zhang, Y., Wang, X.-m., et al. (2021b). Application of an Enhanced BP Neural Network Model with Water Cycle Algorithm on Landslide Prediction. Stoch Environ. Res. Risk Assess. 35 (6), 1273–1291. doi:10.1007/s00477-020-01920-y
Zhang, Z., Huang, X., Liu, W., Wang, L., and Xiao, M. (2020). Study on the Hydraulic Parameters of Woshaxi Landslide Soils during Water Level Drawdown of Three Gorges Reservoir. Geofluids 2020 (1), 1–14. doi:10.1155/2020/6283791
Zhou, Z., Wang, H.-g., Fu, H.-l., and Liu, B.-c. (2009). Influences of Rainfall Infiltration on Stability of Accumulation Slope by In-Situ Monitoring Test. J. Cent. South. Univ. Technol. 16 (2), 297–302. doi:10.1007/s11771-009-0051-1
Keywords: electric conductivity, matrix suction, unsaturated soil, artificial rainfall, experimental investigation
Citation: Chen R, Lin Y, Liu Q, Dou H, Robledo LF and Jian W (2022) Prediction of Matrix Suction of Unsaturated Granite Residual Soil Slope Based on Electrical Conductivity. Front. Earth Sci. 10:840506. doi: 10.3389/feart.2022.840506
Received: 21 December 2021; Accepted: 31 January 2022;
Published: 21 March 2022.
Edited by:
Faming Huang, Nanchang University, ChinaReviewed by:
Sesha Sai Raghuram Ammavajjala, Indian Institute of Technology Bombay, IndiaXiaoqin Lei, Institute of Mountain Hazards and Environment (CAS), China
Copyright © 2022 Chen, Lin, Liu, Dou, Robledo and Jian. This is an open-access article distributed under the terms of the Creative Commons Attribution License (CC BY). The use, distribution or reproduction in other forums is permitted, provided the original author(s) and the copyright owner(s) are credited and that the original publication in this journal is cited, in accordance with accepted academic practice. No use, distribution or reproduction is permitted which does not comply with these terms.
*Correspondence: Wenbin Jian, andiQGZ6dS5lZHUuY24=
 Ruimin Chen
 Yunzhao Lin1