 Yujie Wang
 Yizhou Yin
 Lianchun Song
95% of researchers rate our articles as excellent or good
Learn more about the work of our research integrity team to safeguard the quality of each article we publish.
Find out more
ORIGINAL RESEARCH article
Front. Earth Sci. , 11 March 2022
Sec. Atmospheric Science
Volume 10 - 2022 | https://doi.org/10.3389/feart.2022.839733
This article is part of the Research Topic Landfalling Tropical Cyclones: Physical Processes, Forecasting and Impacts View all 26 articles
The typhoon disaster chain is one of the leading climate risks in constructing the Guangdong–Hong Kong–Macau Greater Bay Area (GBA). In this study, the risks of the typhoon disaster chains including typhoon-induced gales, rainstorms, and storm surges in the GBA, as well as the comprehensive risk of typhoon disaster, are investigated at county level by comprehensively analyzing the hazard, exposure, and vulnerability. The results show that the high- and very-high-risk areas of typhoon–gale disaster chain are located in Zhuhai, Zhongshan, Foshan, Dongguan, central-southern Jiangmen, southern Shenzhen, and parts of Huizhou. The high- and very high-risk areas of typhoon–rainstorm disaster chain include Zhuhai, Zhongshan, Shenzhen, central-southern Foshan, northern Dongguan, central Jiangmen, and central Huizhou. Regarding the typhoon–storm surge disaster chain, the areas at high and very high risk are located in Zhuhai, eastern Zhongshan, and the coastal areas of the Pearl River Estuary. In addition, the comprehensive risk of typhoon disaster is very high in Zhuhai and high in Zhongshan, Jiangmen, Dongguan, and Shenzhen. By verifying the spatial correlation between typhoon disaster risk indexes and actual losses, it is found that the comprehensive risk index of typhoon disaster constructed in this study can better reflect the actual losses. Overall, the findings of this study can provide a scientific basis for typhoon disaster prevention and mitigation in the GBA, and it can also serve as a reference for typhoon disaster risk research in other areas.
The typhoon disaster chain is a series of disaster phenomena caused by typhoons, and it is composed of gales, rainstorms, and storm surges, as well as a series of secondary disasters induced by them. The spatiotemporal chain reactions of typhoon disaster chains can amplify disaster situations (Shi et al., 1991; Shi et al., 2010; Yu et al., 2014; Shi et al., 2014). In the context of global warming, the intensity and destructiveness of typhoons have increased significantly, and the proportion of super typhoon has grown remarkably (Webster et al., 2005; Emanuel, 2005; Mendelsohn et al., 2012; IPCC 2013), resulting in more frequent catastrophic events. With population growth, urbanization, and climate change in the past decades, the losses of life and property caused by typhoon disaster chains have risen noticeably (Pielke et al., 2005; Pielke et al., 2008; Fengjin and Ziniu, 2010; Fischer et al., 2015; Chen et al., 2021).
The coastal areas of China have developed economies and dense population. On average, about seven typhoons landed in China per year in recent 30 years. From 2004 to 2015, the direct economic losses and fatalities caused by typhoon disasters respectively accounted for 18.3% and 50.2% of those caused by all meteorological disasters (Wang Y. et al., 2016). Approximately 6.3% of the coastal areas in China have a high-risk level of typhoon-induced disasters, and they mainly concentrate in coastal river delta regions (Yin et al., 2013). Guangdong Province has the longest coastline in China, and its coastal cities have developed socioeconomic and a significantly larger population than other provinces. Simultaneously, it is also one of the provinces suffering from the most severe typhoon disasters in China (Wang R. et al., 2016; Luo et al., 2018). The Guangdong–Hong Kong–Macau Greater Bay Area (GBA), located in the central coastal area of Guangdong, is the most economically developed and densely populated region of Guangdong and is also the region with the highest risk level of typhoon disaster (Yin et al., 2012; Xu et al., 2015). In the past 10 years, the number and intensity of super typhoons affecting the GBA have increased significantly (Wang et al., 2021a). For example, in August 2017, two typhoons directly attacked Jinwan District, Zhuhai City of the GBA during just 4 days. The short time interval of the two typhoons and the high overlap of their landing location set new meteorological records. Specifically, the strong typhoon “Hato (2017)” was one of the most serious typhoons affecting Zhuhai in history, leading to serious economic losses. In summary, the typhoon disaster is one of the main climate risks in the construction of GBA in the future.
Previous studies on typhoons in China mainly focused on the characteristics, causes, and the impacts of typhoon-induced gale and heavy rainfall (Fengjin and Ziniu, 2010; Yin et al., 2013; Deng et al., 2015). Chou et al. (2020) pointed out that the direct economic losses caused by typhoons in China showed a remarkable interdecadal increasing trend, and the losses gradually transferred from the primary industry to the secondary and tertiary industries. In recent years, the disasters caused by typhoons have attracted more and more concerns. Scholars assessed the hazard, vulnerability, exposure, and the risks of typhoon disasters in coastal areas of China (Niu et al., 2011; Ye et al., 2019). Some studies proposed a classification system of typhoon disaster chains, mainly including typhoon–gale chain (a series of disaster phenomena caused by typhoon wind force), typhoon–rainstorm chain (a series of disaster phenomena caused by typhoon rainstorm), and typhoon–storm surge chain (a series of disaster phenomena caused by typhoon storm surge), and they statistically derived the regional characteristics of disaster intensity and types (Chen et al., 2011; Shuai et al., 2012; Wang R. et al., 2016; Shih et al., 2018; Yu et al., 2019; Ye et al., 2014, 2020). In addition, they found that typhoon disasters are related to the track of landing typhoon, and rainstorm is the main factor causing typhoon disasters. Moreover, some scholars used the geographical information system technology to assess typhoon disaster risk and discussed the causes and laws of typhoon disaster chains at city level of Guangdong (Pan et al., 2002; Tang and Liang, 2006; Zhang et al., 2017). However, these studies did not systematically analyze the influence mechanisms of hazard factors and disaster-pregnant environments for different typhoon disaster chains. Meanwhile, the researches on typhoon disaster risk at county level are insufficient (Gemmer et al., 2011).
Therefore, in this study, based on the disaster data and observation data of typhoons from 2009 to 2020, the hazard, exposure, vulnerability, and the related mechanisms on typhoon disaster chains are analyzed at county level in the GBA. Moreover, the risks of typhoon–gale, typhoon–rainstorm, and typhoon–storm surge disaster chains, as well as the typhoon comprehensive risk, are studied in detail. We hope our results can provide scientific support for typhoon disaster prevention and mitigation in the GBA.
The remainder of this article is organized as follows. Section 2 briefly introduces the study area, various data and methods used in this study. The results are presented in Section 3. Finally, Section 4 provides the conclusions and discussion.
The GBA is one of the regions with the highest degree of openness and the strongest economic vitality in China, which is located in the subtropical region of South China and composed of nine cities in the Pearl River Delta (Guangzhou, Shenzhen, Zhuhai, Foshan, Huizhou, Dongguan, Zhongshan, Jiangmen, and Zhaoqing) and two Special Administrative Regions (Hong Kong and Macau). The GBA includes 48 counties (districts), with a total area of 56,000 km2. By the end of 2020, the permanent resident population in the GBA exceeded 72 million, and the gross domestic product (GDP) was more than 11 trillion yuan.
The GBA is adjacent to the Western Pacific and suffers from great impact of landfall typhoons (Wang et al., 2021a). The river systems in this region are numerous, complex, and staggered, and the river network is densely distributed. Therefore, when superimposed with the flood peaks of rivers, the heavy rainfall brought by typhoons is prone to cause floods and mountain torrents (Zhang et al., 2017). The terrain of GBA is high in the north and low in the south, surrounded by hilly mountains in the west, north, and east. Thus, in the GBA, the geological disasters such as landslide and debris flow often occur under the influence of heavy typhoon rainfall (Zhao et al., 2014). The central-southern GBA is mainly composed of alluvial plains, which are distributed in the main cities in the GBA. Hence, heavy rainfall in this area can easily cause urban waterlogging (Chen et al., 2017). The topography of the GBA plain areas is low and flat, with an average altitude of approximately only 50 m, so the GBA lacks a natural barrier against typhoon-induced gales (Yin et al., 2012). In addition, there are many trumpet-shaped estuaries near shore in the GBA, which exacerbates the impact of storm surge in estuaries and ports. Once superimposed with the astronomical spring tides, the storm surge disasters may aggravate (Pang et al., 2020).
Because of the lack of daily meteorological observation data and typhoon disaster data for Hong Kong and Macau, the study area of this research is mainly the Chinese mainland of GBA. The daily (from previous 20:00 to current 20:00 China Standard Time) precipitation and daily maximum wind speed data from 29 meteorological stations used in this study (Figure 1) are obtained from the Daily Meteorological Dataset of Basic Meteorological Elements of China National Surface Weather Station released by the National Meteorological Information Center of the China Meteorological Administration (China Meteorological Administration, 1991-2018; Ren et al., 2012). The daily values of meteorological observation since the establishment of the meteorological station are included in this dataset. Daily maximum wind speed is the maximum average wind speed of 10 min in 1 day. The historical typhoon data are from the Tropical Cyclone Best Track Dataset issued by the Shanghai Typhoon Institute, CMA, including the longitude, latitude, wind speed, and intensity of the typhoon center every 6 h (Ying et al., 2014). According to the national standard (GB/T 19,201-2006; grade of tropical cyclones) issued by the China Meteorological Administration, 2006, based on the maximum average wind speed of 2 min at the low level near the tropical cyclone center (Vc), tropical cyclones are classified into six grades: tropical depression (10.8 m s−1 ≤ Vc ≤ 17.1 m s−1), tropical storm (17.2 m s−1 ≤ Vc ≤ 24.4 m s−1), severe tropical storm (24.5 m s−1 ≤ Vc ≤ 32.6 m s−1), typhoon (32.7 m s−1 ≤ Vc ≤ 41.4 m s−1), severe typhoon (41.5 m s−1 ≤ Vc ≤ 50.9 m s−1), and super typhoon (Vc ≥ 51.0 m s−1).
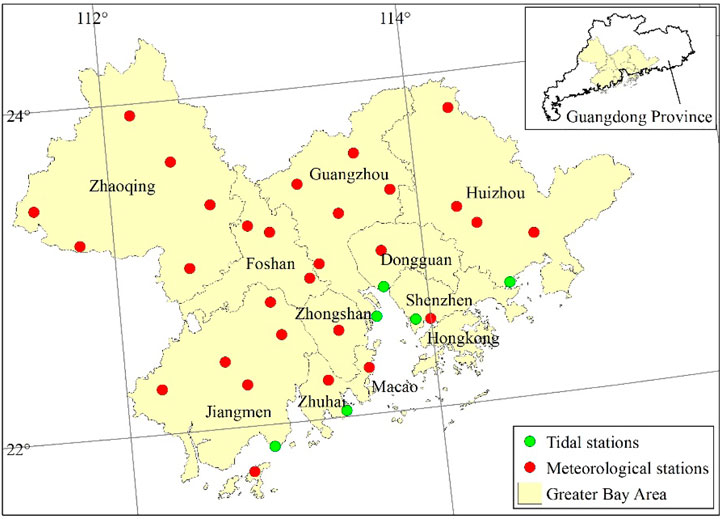
FIGURE 1. Locations of the Guangdong–Hong Kong–Macau Greater Bay Area, meteorological stations, and tidal stations.
The storm surge data used in this study are derived from the Bulletin of China Marine Disaster (2009–2020) released annually by the Ministry of Natural Resources, 2009–2020, including the daily peak surge (PS) and ultrawarning tidal level (UWT) from five tidal stations, that is, Taishan, Sanzao, Hengmen, Chiwan, and Huizhou stations. UWT refers to the tide level when the warning threshold is exceeded.
The typhoon disaster data are from the annual climate assessment report (2009–2020) released by the National Climate Center, including disaster-affected population, death tolls, missing persons, disaster-affected area, collapsed buildings, and direct economic losses. The economic losses are converted based on the price in 2020. The conversion coefficient is the quotient of the 2020 retail price index and the current year’s index. The population and GDP grid data with a resolution of 1 km in 2015 are from the Resource and Environment Science and Data Center of the Institute of Geographic Sciences and Natural Resources Research, Chinese Academy of Sciences (http://www.resdc.cn/Default.aspx). The digital elevation model and river data of disaster-pregnant environment with the resolution of 1 km in 2015 are obtained from the 1:250,000 scale topographic database of the National Geomatic Center of China (Wang et al., 2001). The land use data (1-km resolution) in 2015 are obtained from the Institute of Geographic Sciences and Natural Resources Research, Chinese Academy of Sciences (Xu and Gong, 2018). The vegetation coverage in 2015 is calculated based on the Normalized Difference Vegetation Index product (1-km resolution) from the Moderate Resolution Imaging Spectroradiometer (Didan 2015).
The standardization method of elements is as follows (Eq. 1).
where Di denotes the standardized value of the ith element, Ai is the ith element value, mini is the minimum of the ith element, and maxi is the maximum of the ith element.
The maximum value of the daily maximum wind speed (MW) during a typhoon process is used as the hazard factor of the typhoon–gale disaster chain. The accumulated precipitation (AP) and maximum daily precipitation (MP) during the process are considered as the hazard factors of the typhoon–rainstorm disaster chain.
In this study, the equation for calculating the hazard of typhoon–gale and typhoon–rainstorm disaster chains is as follows (Eq. 2).
where H denotes the hazard factor, l
where δ is the diffusion coefficient, which can be determined according to the maximum value b, minimum value a, and the number of samples m in the sample set. The calculation equation of δ is as follows (Eq. 4). The number of samples required to participate in the calculation must be 5 or more. If it is fewer than 5, the final probability value will be 0.
The occurrence probability of uj is as follows (Eq. 5).
where
The cumulative probability Pl in each level interval is obtained by accumulating P (uj) in the corresponding level interval of a hazard factor.
In this study, one typhoon that brings negative effect to the GBA and leads to disasters is defined as a disaster-causing typhoon. Once a typhoon disaster occurs in a county, a disaster-causing typhoon is recorded in that county. Thus, a total of 186 disaster-causing typhoon samples in all counties of the GBA from 2009 to 2020 are obtained. The MW, AP, and MP values of these samples are extracted to calculate the mean value and standard deviation of the MW, AP, and MP sequences. Typhoons sometimes have a beneficial impact, such as alleviating drought. In order to avoid the “good typhoon” in the risk assessment, we define the assessment starting point, which is similar to the hazard threshold. In this study, disaster-causing typhoons are used to determine the assessment starting point. Based on the difference between the mean value and standard deviation, the starting points of the assessment for the MW, AP, and MP are 13.5 m s−1, 65 and 50 mm, respectively. As long as the values of wind speed and precipitation exceed the assessment starting point, typhoons are regarded as samples of hazard index calculation in the county, even if there is no economic loss. According to different wind speed and precipitation, the MW, AP, and MP can be divided into five levels, as shown in Table 1 (Zhu et al., 2018).
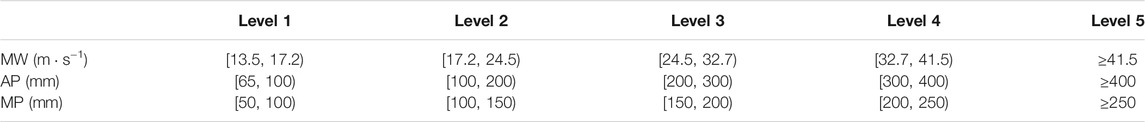
TABLE 1. Level intervals of the maximum value of daily maximum wind speed (MW), accumulated precipitation (AP), and maximum daily precipitation (MP).
We apply the inverse distance weighted interpolation technique to estimate MW, AP, and MP in 48 counties based on their values at 29 meteorological stations. The linear relationships of the MW, AP, and MP with direct economic losses are shown in Table 2. Taking the MW as an example, the step size is set to 1 m s−1, and the fitting values of the losses corresponding to each interval between 13 and 41 m s−1 are calculated based on the linear relationship shown in Table 2. The mean values of the MW fitting values in the first four intervals (rounded) are 5,650, 15,126, 26,971, and 40,395, respectively (Table 1). The proportions of these mean values to the sum of the first four intervals are 0.064, 0.172, 0.306, and 0.458, respectively, which are defined as the weighting coefficients of these four intervals. In addition, the weighting coefficient of the fifth interval is set to 1.
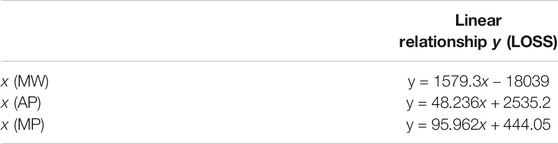
TABLE 2. Linear relationships of hazard factors for typhoon–gale and typhoon–rainstorm disaster chains with direct economic losses.
Similarly, the weighting coefficients of the AP and MP in each interval are obtained, as shown in Table 3. These weighting coefficients are substituted into Eq. 2 to obtain disaster-causing dangerousness of MW, AP, and MP. The disaster-causing dangerousness of MW is standardized according to Eq. 1 to obtain the hazard index of typhoon–gale disaster chain (Hw). The standardized dangerousness of AP and MP is added with the equal weight to obtain the typhoon–rainstorm hazard index (Hr).
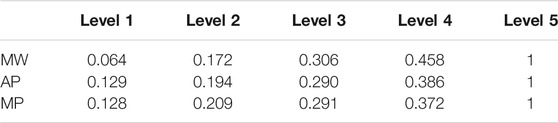
TABLE 3. Weighting coefficients of each hazard factor in different intervals.
The daily PS and UWT are chosen as the hazard factors of typhoon–storm surge disaster chain. According to Yu et al. (2016), the hazard index of typhoon–storm surge disaster chain (Hs) is obtained by using the following:
where I'PS and I'UWT are the standardized IPS (Eq. 8) and IUWT (Eq. 9), respectively.
where N1 indicates the frequency of the PS or UWT in the first interval at a tidal station during a certain statistical period, N2, N3, N4, and N5, respectively for the second to fifth intervals. The level intervals of PS and UWT are shown in Table 4 (China National Standards GB/T 39,418-2020, Grades of Storm Surge).
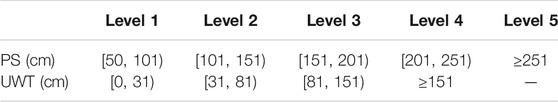
TABLE 4. Level intervals of the daily peak surge (PS) and ultra-warning tidal level (UWT).
The exposure is generally represented by the GDP and population per unit area. After standardizing the population and GDP data of the GBA in 2015 based on Eq. 1, the socioeconomic exposure index (E) is calculated by the following:
where POP and GDP are the population and GDP at 1-km grid, respectively. According to the expert scoring method, the weighting coefficients of POP and GDP are equal (Wang et al., 2021b). The expert scoring method is mainly based on the results of questionnaires to determine the weight of each evaluation index through the hundred-mark system (He et al., 2016).
The terrain (T), river network (R), and vegetation coverage (C) are selected as the factors of vulnerability index (Vr) for the typhoon–rainstorm disaster chain in the GBA (Wang et al., 2021b). We considered elevation and slope as terrain factors affecting typhoon–rainstorm disasters (Meraj et al., 2015). The degree of topography and flatness is expressed by absolute elevation and the elevation standard deviation at 1 × 1-km grids, respectively. T is assigned according to the different combinations of elevation and elevation standard deviation graded by the National Climate Center of China Meteorological Administration, 2009. The lower the elevation, the smaller the elevation standard deviation is; the greater the T, the more sensitive it is to rainstorm disasters. In terms of the Standard DB33/T 2025-2017 (Zhejiang Meteorological Observatory, 2017), the combinations of total length of the river within 1 km and the distance to the water body are used to characterize the river network (National Climate Center of China Meteorological Administration, 2009). The place that has greater drainage density and is closer to water body has a higher risk of suffering from typhoon–rainstorm disasters (Sun et al., 2020). Because vegetation has a strong function of water and soil conservation, greater vegetation coverage means lower risk of typhoon–rainstorm disaster. The vegetation coverage index (C) is calculated according to the meteorological standard QX/T394-2019 (China Meteorological Administration, 2012). After the standardization of T, R, and C (Eq. 1), Vr can be calculated by Eq. 11. Then, the spatial distribution of the vulnerability index of the disaster-pregnant environment for the typhoon–rainstorm disaster chain at 1-km grid spacing in the GBA in 2015 is obtained.
Some studies have pointed out that the lower the elevation and the flatter the terrain, the slower the wind speed weakens, and the more likely to form wind disasters. Conversely, under the same conditions, the higher the vegetation coverage, the greater the corresponding surface roughness, and the smaller the wind speed near the surface (Shuai et al., 2012). In this study, based on the previous research and the topography in the GBA, the terrain and vegetation coverage are regarded as the vulnerability factors for the typhoon–gale disaster chain. After the standardization of the terrain data and vegetation coverage (Eq. 1), the vulnerability index (Vw) of the disaster-pregnant environment at 1-km grid in the GBA in 2015 can be calculated according to Eq. 12. Note that the weighting coefficients are determined by the expert scoring method (He et al., 2016).
Referring to previous studies (Yang, 1997; Yu et al., 2016; Pang 2020), the terrain elevation data and inland distance from shoreline are taken as the vulnerability factors for the typhoon–storm surge disaster chain. The values of vulnerability index (Vs) for the typhoon–storm surge disaster chain are shown in Table 5.
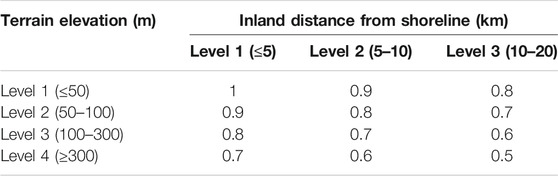
TABLE 5. Values of the vulnerability index for the typhoon–storm surge disaster chain.
According to the disaster risk management framework from the Intergovernmental Panel on Climate Change Fifth Assessment Report (IPCC, 2014), the gridded risk of typhoon disaster chains can be calculated based on hazard, exposure, and vulnerability. The specific calculation formulas are as follows (Eqs. 13–15). All elements are standardized with Eq. 1 before they are combined.
The risk index of typhoon–gale disaster chain:
The risk index of typhoon–rainstorm disaster chain:
The risk index of typhoon–storm surge disaster chain:
The above risk indexes are all standardized. The typhoon comprehensive risk index (RISKc) is composed of three disaster chain risks, i.e., typhoon–gale, typhoon–rainstorm and typhoon–storm surge disaster chains. The weight coefficients of each disaster chain risk should be assigned according to their contribution to RISKc. We calculate the correlation coefficients between economic losses and typhoon–gale risk index, typhoon–rainstorm risk index and typhoon–storm surge risk index at county level, and the correlation coefficients are 0.56, 0.55 and 0.50, respectively (p < 0.01). The proportions of the three disaster chain correlation coefficients to the sum are 0.35, 0.34, and 0.31, respectively, and they are the weight coefficients of RISKc. The RISKc is then calculated by the weighted average (Eq. 16), and the result values are normalized to the range between 0.5 and 1.
The natural breakpoint method in ArcGIS is used to classify the risk of typhoon disaster chains. It identifies classification intervals based on the natural grouping inherent in the data, allows for the most appropriate grouping of similar values, and maximizes differences between classes. In this study, we classify the risk of typhoon disaster chains into five levels, including very low risk (level 1), low risk (level 2), moderate risk (level 3), high risk (level 4), and very high risk (level 5). The ranges of risk values at each level are shown in Table 6.
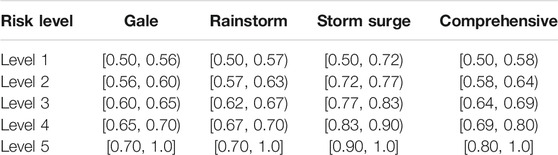
TABLE 6. The risk levels of typhoon disaster chains.
The typhoon risk index for an administrative region is the average of the risk indexes at all grids in this region.
In this study, as long as one of MW, AP, and MP exceeds the assessment starting point in anyone of the 29 meteorological stations during the period of typhoon influence, the typhoon is considered to be an influencing typhoon. From 2009 to 2020, there were 38 influencing typhoons in the GBA, which were regarded as the samples of hazard index calculation in the county. Among them, there were 31 disaster-causing typhoons, with an average of 2.6 per year. Specifically, the largest number of annual disaster-causing typhoons was 6 in 2009, and the fewest was 1 in 2013 (Figure 2A). In terms of the monthly distribution, 31 disaster-causing typhoons occurred from June to October, with relatively more in August and September (9 each month) and relatively fewer (5 or fewer each month) in other months (Figure 2B).
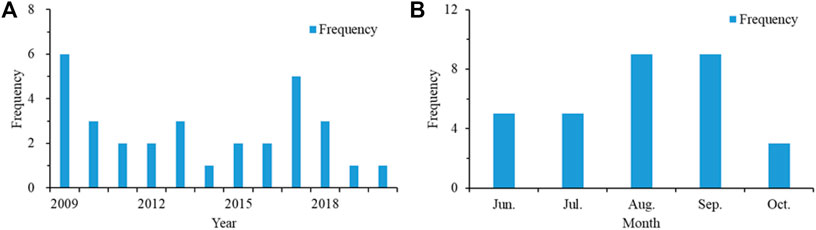
FIGURE 2. (A) Annual frequency and (B) monthly frequency of disaster-causing typhoons in the GBA from 2009 to 2020.
Among the 31 disaster-causing typhoons, 11 landed in the GBA (Figure 3A) and 13 landed in other places of Guangdong Province (Figure 3B). These typhoons mainly moved westward. Four typhoons landed in Taiwan or Fujian and went westward through Guangdong after landing (Figure 3C). Three typhoons made landfall in Hainan with westward-moving tracks and influenced the GBA (Figure 3D).
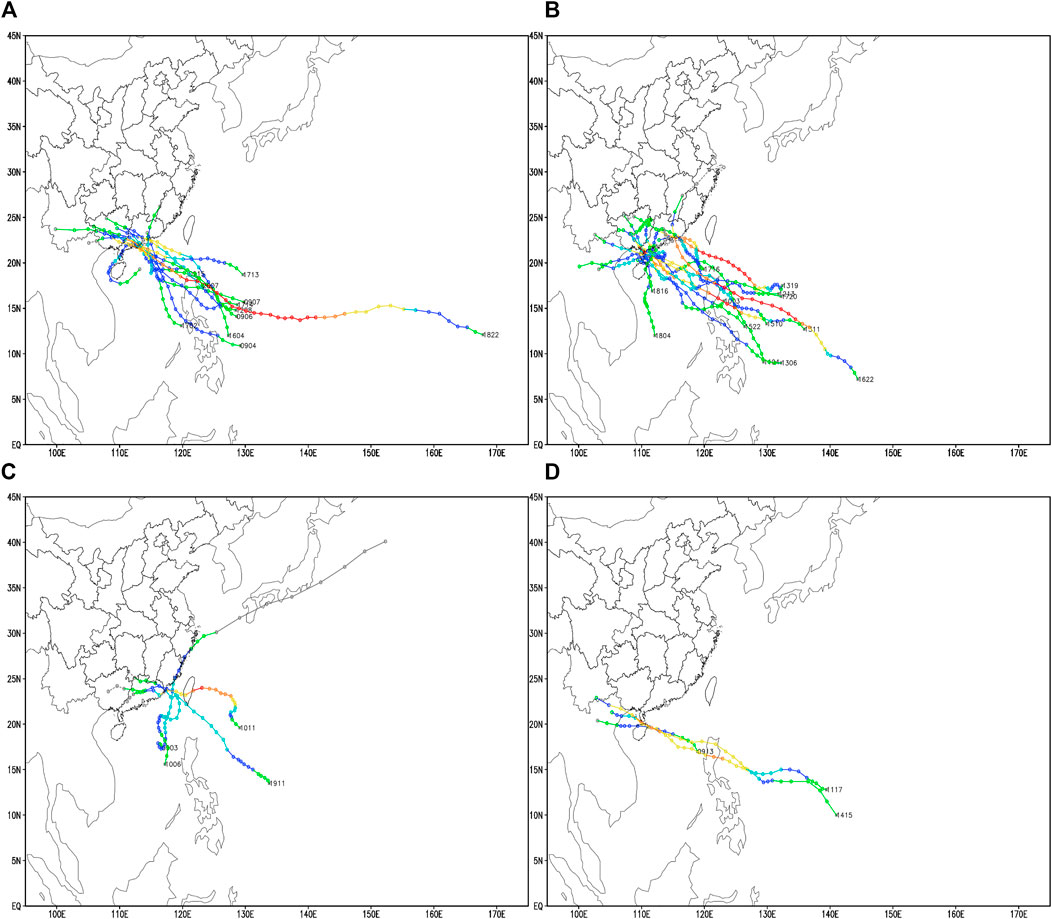
FIGURE 3. Tracks of disaster-causing typhoons in GBA (A) landfall in GBA; (B) landfall in other places of Guangdong; (C) landfall in Taiwan or Fujian; (D) landfall in Hainan. The colors represent different typhoon levels. Gray means below the intensity of tropical depression, green means tropical depression, blue means tropical storm, cyan means severe tropical storm, yellow means typhoon, orange means strong typhoon, and red means super typhoon. The number indicates the typhoon serial number.
For the regional distribution of 31 disaster-causing typhoons, the cumulative number of disaster-causing typhoons in Zhaoqing was the largest (24), followed by Jiangmen (15) and Zhuhai (12), and the least in Shenzhen (6), as shown in Table 9. Although Zhaoqing is located in the inland area of the central and western parts of Guangdong Province, typhoons landing in Guangdong, Fujian, and Hainan may affect Guangning County of Zhaoqing, resulting in more disaster-causing typhoons (Zhou et al., 2015). Guangning County is located in the northwest of the GBA, and typhoons can affect Guangning County after making landfall from the east and west sides of the GBA.
Figure 4 shows the spatial distribution of 186 disaster-causing typhoon samples at county level in the GBA from 2009 to 2020. The results suggest that there are 47 counties (districts) that suffered from disaster-causing typhoons except the Luogang District of Guangzhou. The Guangning County of Zhaoqing experienced the most (16) disaster-causing typhoons, followed by Taishan City of Jiangmeng (15) and Fengkai County of Zhaoqing (14). Liwan, Yuexiu, Haizhu, and Tianhe Districts of Guangzhou and Luohu and Baoan Districts of Shenzhen have experienced only 1 disaster-causing typhoon.
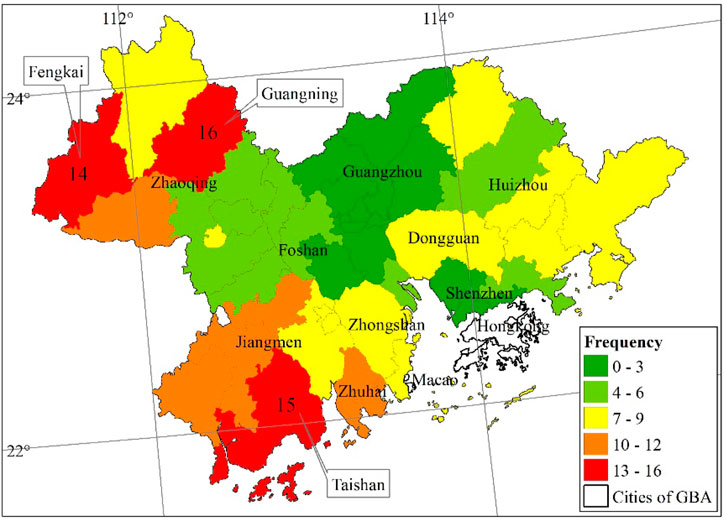
FIGURE 4. Frequency distribution of total disaster-causing typhoons at county level in the GBA from 2009 to 2020.
The hazard indexes of typhoon–gale, typhoon–rainstorm, and typhoon–storm surge disaster chains in the GBA from 2009 to 2020 are calculated. The ranges of Hw, Hr, and Hs are 0.91–5.0, 1.07–4.96, and 36.8–116.4, respectively. The standardized results are shown in Figure 5.
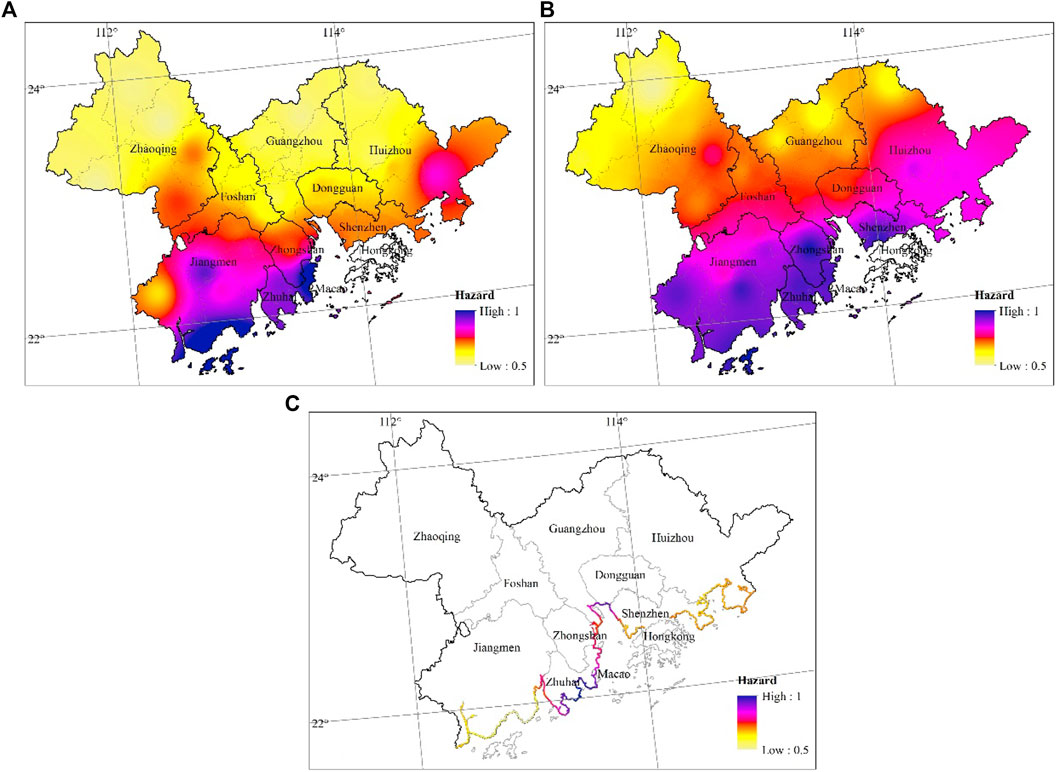
FIGURE 5. Spatial distributions of hazard indexes of (A) typhoon–gale, (B) typhoon–rainstorm, and (C) typhoon–storm surge disaster chains in the GBA from 2009 to 2020.
For the typhoon–gale disaster chain, the areas with high and relatively high hazard index are mainly located in Zhuhai, central-southern Jiangmen, southern Zhongshan, and southeastern Huizhou, whereas the hazard index in the central-northern Zhaoqing, northern Foshan, central-northern Guangzhou, and northern Huizhou is low and relatively low (Figure 5A). At county level, the hazard index in Xiangzhou, Jinwan, and Doumen Districts of Zhuhai and Taishan District of Jiangmen is the highest, exceeding 0.7. The hazard index in Fengkai, Guangning and Huaiji Counties of Zhaoqing and Conghua District of Guangzhou is the lowest (<0.53).
In terms of the typhoon–rainstorm disaster chain, the areas with higher hazard index are mainly concentrated in Zhuhai, Zhongshan, Shenzhen, Dongguan, Jiangmen, southern Foshan, and southern Huizhou, whereas areas with lower hazard index are mainly distributed in northern Zhaoqing, northern Guangzhou, and northwestern Huizhou (Figure 5B). At county level, the hazard index in Futian and Nanshan Districts of Shenzhen, Doumen, Xiangzhou and Jinwan Districts of Zhuhai, and Taishan District of Jiangmen is the highest, exceeding 0.94.
Moreover, for the typhoon–storm surge disaster chain, the areas with higher hazard index are distributed in the coastal regions from eastern Jiangmen to northwestern Shenzhen, where the highest hazard index is in the coastal areas of the central Zhuhai and Dongguan (Figure 5C). The index in Dongguan and Zhuhai exceeds 0.85.
In order to verify the rationality of the hazard indexes of typhoon–gale and typhoon–rainstorm, we calculate the cumulative number of typhoon gale days, rainstorm days, and precipitation from 2009 to 2020 as shown in Figure 6. It can be found that the spatial distributions of gale days (Figure 6A) and typhoon–gale hazard index (Figure 5A) are relatively consistent. The spatial correlation coefficient between them reaches 0.98 (p < 0.01). The spatial distributions of accumulated rainstorm days (Figure 6B), accumulated precipitation (Figure 6C), and typhoon–rainstorm hazard index (Figure 5B) are also relatively consistent. The spatial correlation coefficients between accumulated rainstorm days and typhoon–rainstorm hazard index, accumulated precipitation, and typhoon–rainstorm hazard index reach 0.96 and 0.98 (p < 0.01), respectively.
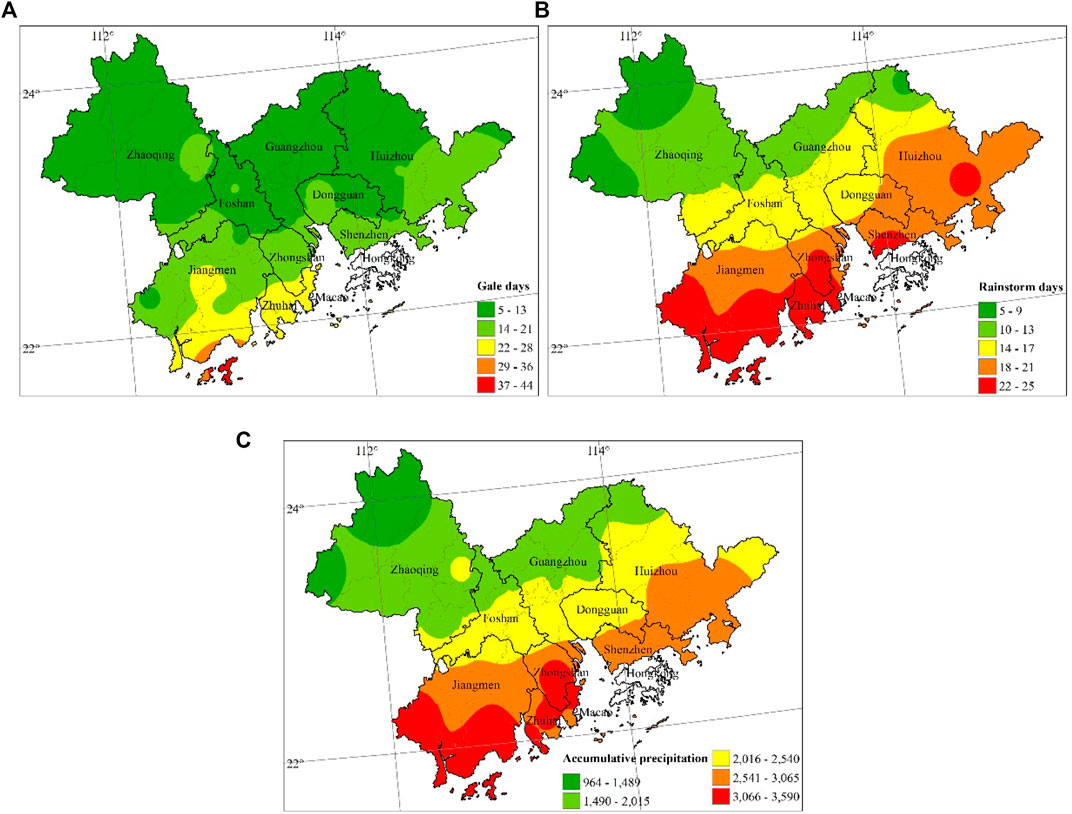
FIGURE 6. Cumulative typhoon (A) gale days, (B) rainstorm days, and (C) precipitation in the GBA during 2009–2020.
Figure 7 shows the exposure index with a resolution of 1 km in the GBA in 2015. The range of exposure index is 0.5–1.0 in this study. The areas with higher exposure index are the highly populated and economically dense areas of the GBA, especially the central part of Guangzhou, central part of Foshan, and southern part of Shenzhen. For example, the statistics show that the population density of Yuexiu District (34,225 people/km2), Haizhu District (17,851 people/km2), Tianhe District (16,046 people/km2), and Liwan District (15,596 people/km2) is much higher than the average of other districts in Guangzhou (1,526 people/km2). Similarly, the GDP per square kilometer in Yuexiu District (7,987 million yuan), Tianhe District (3,569 million yuan), Liwan District (1719 million yuan), and Haizhu District (1,574 million yuan) is much higher than the average of other districts in Guangzhou (203 million yuan) (http://112.94.72.17/portal/queryInfo/statisticsYearbook/index). The exposure index in Huizhou, Zhuhai, Jiangmen, and Zhaoqing is relatively lower.
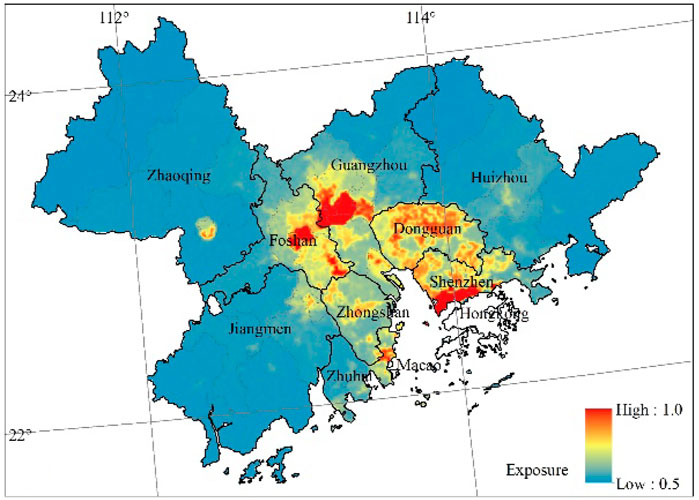
FIGURE 7. Exposure index distribution of economic society in the GBA in 2015.
Based on Eqs. 11 and 12 and Table 5, we calculated Vw, Vr, and Vs, and their ranges are 0.003–0.42, 0.04–0.59, and 0.5–1.0 before standardization, respectively. In terms of the typhoon–gale disaster chain, the vulnerable areas are mainly located in Foshan, Dongguan, northern Zhongshan, central Zhuhai, central Jiangmen, central Shenzhen, and southern Guangzhou (Figure 8A). For the typhoon–rainstorm disaster chain, the vulnerable areas are mainly distributed in Foshan, northern Dongguan, northern Zhongshan, eastern Zhuhai, southern Guangzhou, central Huizhou, and Zhaoqing along the West River (Figure 8B). Figure 8C presents the vulnerability for the typhoon–storm surge disaster chain. It is indicated that the vulnerability gradually decreases from coastal areas to the boundaries of the buffer zone 20 km away from the coastal lines (Figure 8C). Because of the relatively low altitude and being close to the coastlines, most coastal areas have the relatively high vulnerability against the typhoon-induced storm surge. On the contrary, the vulnerability in coastal areas of eastern Shenzhen and southeastern Jiangmen is relatively low because they are mostly hilly areas.
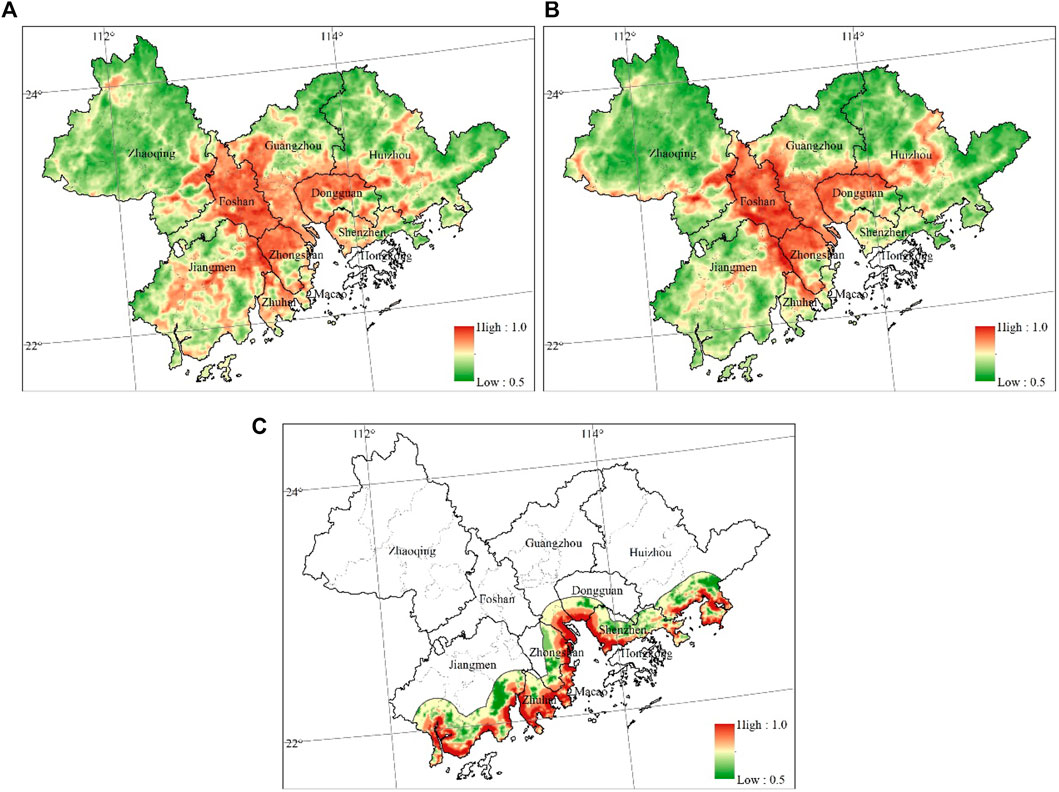
FIGURE 8. Vulnerability for (A) typhoon–gale, (B) typhoon–rainstorm, and (C) typhoon–storm surge disaster chains in the GBA in 2015.
When the hazard of typhoon disaster is similar, the higher the vulnerability, the higher the typhoon disaster risk. We compare the average vulnerability and comprehensive disaster loss at city level to verify the rationality of vulnerability index. The vulnerability in Dongguan is obviously higher than that in Huizhou, which results in greater typhoon disaster loss (Table 7), whereas they almost have the same hazard index. The same situation happens in Zhongshan and Jiangmen; the higher the vulnerability, the greater the typhoon disaster risk in Zhongshan compared with Jiangmen. Therefore, the vulnerability index constructed in the study is relatively reasonable.
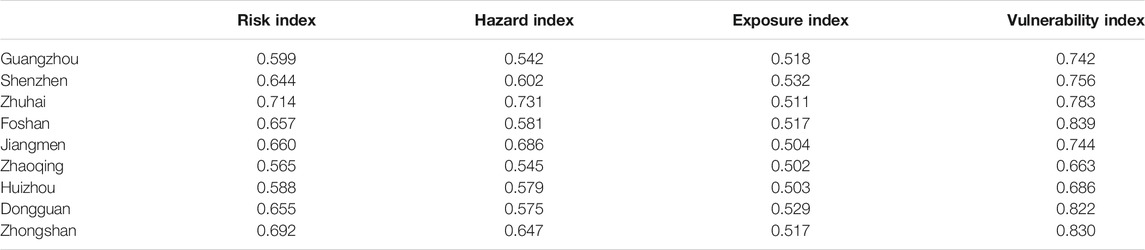
TABLE 7. Risk, hazard, exposure, and vulnerability of typhoon–gale disaster chain in cities of the GBA.
The risks of typhoon–gale, typhoon–rainstorm, and typhoon–storm surge disaster chains are calculated based on Eqs. 13–15 and are classified into five levels according to Table 6. For the typhoon–gale disaster chain, there are 10, 11, 13, 8, and 6 districts or counties with the risk of level 5, level 4, level 3, level, 2 and level 1, respectively. Level 5 is found in Xiangzhou, Doumen and Jinwan Districts of Zhuhai, Pengjiang and Jianghai Districts of Jiangmen, Chancheng District of Foshan, Futian District of Shenzhen, and Liwan, Yuexiu and Haizhu Districts of Guangzhou. Level 1 is found in only six districts or counties, that is, Conghua of Guangzhou, Guangning, Huaiji, Fengkai and Deqing of Zhaoqing, and Longmen of Huizhou (Figure 9A). At city level, the top three highest-risk cities are Zhuhai, Zhongshan, and Jiangmen (Table 7). The highest hazard index may result in the highest risk in Zhuhai, although its exposure and vulnerability are not too high compared with other cities. Because the vulnerability index in Zhongshan is higher despite lower hazard index than Jiangmen, its risk is higher than that of Jiangmen.
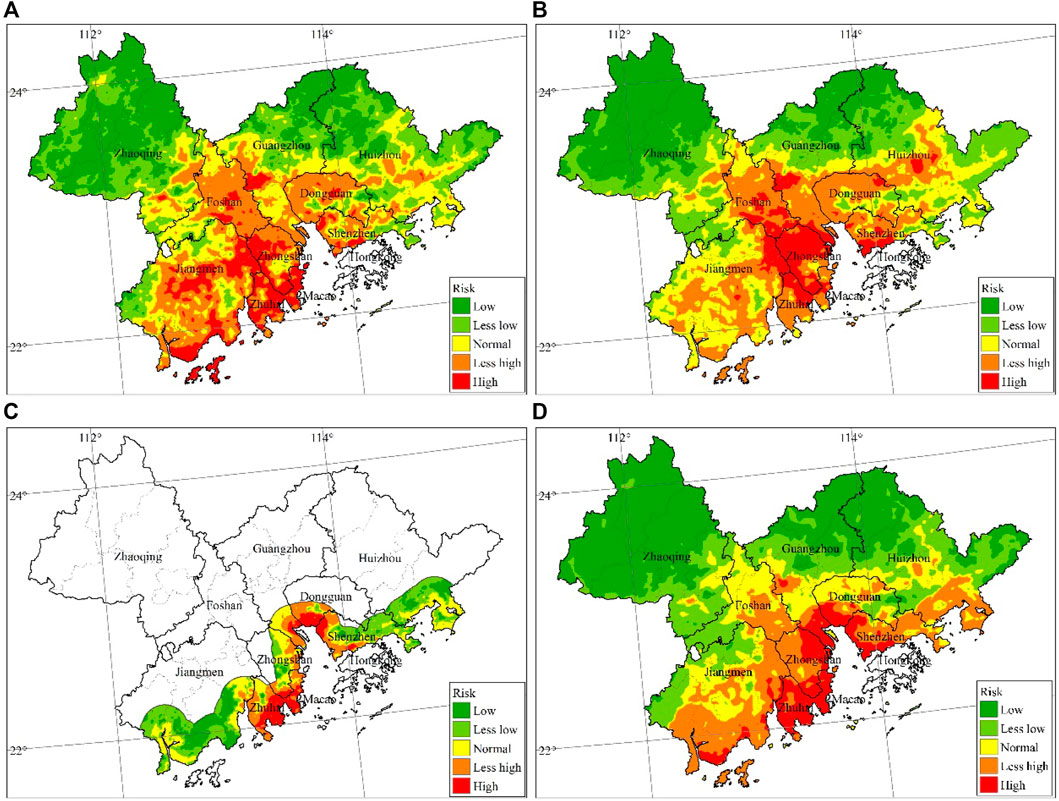
FIGURE 9. Risk distributions of (A) typhoon–gale, (B) typhoon–rainstorm, (C) typhoon–storm surge disaster chains, and (D) typhoon comprehensive risk in the GBA from 2009 to 2020.
For the typhoon–rainstorm disaster chain, there are 9, 15, 12, 6, and 6 districts or counties with level 5, level 4, level 3 level, 2 and level 1, respectively. Level 5 is found in Doumen District of Zhuhai, Pengjiang, and Jianghai Districts of Jiangmen, Chancheng District of Foshan, Futian District of Shenzhen, and Liwan, Yuexiu, and Haizhu Districts of Guangzhou and Zhongshan. Level 1 is found in six districts or counties, that is, Conghua District of Guangzhou, Guangning, Huaiji, Fengkai, and Deqing Counties of Zhaoqing and Longmen County of Huizhou (Figure 9B). At city level, the average risk index in Zhongshan and Zhuhai ranks top two in the GBA because the hazard index in the two cities is greater than 0.9, although their exposure and vulnerability indexes are not too high (Table 8). It can also be seen that the higher risk index in Zhongshan is mainly determined by its higher hazard and vulnerability index. Although the hazard in Jiangmen is relatively high, its exposure and vulnerability are not too high, leading to its low risk.
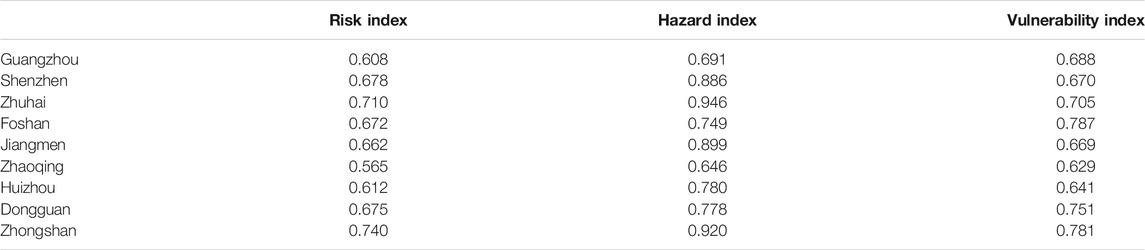
TABLE 8. Risk, hazard, and vulnerability of typhoon–rainstorm disaster chain in cities of the GBA.
In terms of the typhoon–storm surge disaster chain, the areas with risk level being high or above are mainly distributed in Zhuhai, eastern Zhongshan, and coastal areas surrounding the Pearl River Estuary (Figure 9C). Moreover, the risk level in Xiangzhou and Jinwan Districts of Zhuhai is the highest, reaching level 5. At county level, the risk levels of typhoon–gale and typhoon–rainstorm disaster chains are comparable, except for the coastal areas where the risk of the typhoon–storm surge disaster chain is relatively higher.
The typhoon comprehensive risk index is calculated based on Eq. 16, as shown in Figure 9D. It can be found that the comprehensive risk level reaches level 4 or above in southern Jiangmen, Zhuhai, Zhongshan, Shenzhen, southern Dongguan, southern Foshan, southwestern Guangzhou, and coastal areas of Huizhou, whereas the risk level is level 2 or below in Zhaoqing, northern Guangzhou, and northern Huizhou. At county level, seven districts have the risk of level 5, including Doumen, Xiangzhou, and Jinwan Districts of Zhuhai, Futian, and Nanshan Districts of Shenzhen and Yuexiu and Nansha Districts of Guangzhou.
Table 9 presents the risk distributions of typhoon disaster chains at city level. For the typhoon–gale disaster chain, the average risk index is level 5 in Zhuhai; level 4 in Foshan, Jiangmen, Dongguan, and Zhongshan; and level 2 in Guangzhou, Zhaoqing and Huizhou. The average risk index of typhoon–rainstorm disaster chain is level 5 in Zhuhai and Zhongshan; level 4 in Foshan, Dongguan, and Shenzhen; and level 1 in Zhaoqing. In terms of the typhoon–storm surge disaster chain, the average risk index is level 4 in Zhuhai, Zhongshan, and Dongguan and level 1 in Guangzhou, Zhaoqing, and Foshan, because they are far away from the coastlines. For the typhoon comprehensive risk of each city, it can be found that the risk is level 5 in Zhuhai; level 4 in Zhongshan, Jiangmen, Dongguan, and Shenzhen; level 3 in Foshan; level 2 in Guangzhou and Huizhou; and level 1 in Zhaoqing.
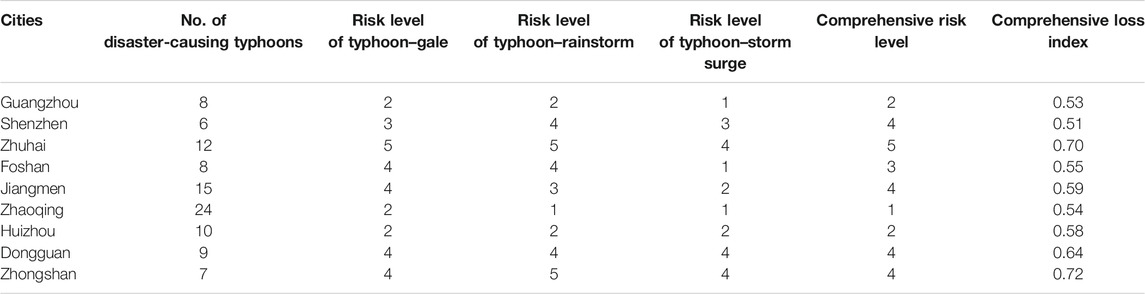
TABLE 9. The number of disaster-causing typhoons, disaster risk level, and comprehensive loss index in each city of the GBA from 2009 to 2020.
The disaster-affected population, casualties and missing persons, disaster-affected crop area, collapsed buildings, and direct economic losses are selected as typhoon disaster indicators, and their distributions in the GBA are shown in Figure 10. From 2009 to 2020, because of typhoon disasters, there were 5.91 million people affected, 39 deaths, and direct economic losses of 50.93 billion yuan in the GBA. The area with the most disaster-affected population was Jiangmen City (2.037 million people). This is because Jiangmen City is located in the southeast coastal area of GBA, which suffered from more disaster-causing typhoons (15) and had a comprehensive risk level 4. The disaster prevention and mitigation capacity of Jiangmen City is relatively weak (Zhang et al., 2018). Also, the largest disaster-affected crop area was in Jiangmen City (278,000 ha), which is related to the fact that Jiangmen is the main agricultural base of the GBA. The city with the most collapsed buildings was Zhaoqing City (37,000 buildings), which was associated with mountain torrents and geological disasters caused by the typhoon–rainstorm disaster chain in the mountain areas of Zhaoqing (https://www.sohu.com/a/153196981_741455). The most direct economic loss was in Zhuhai City (22.91 billion yuan). This is because the comprehensive risk and the risk of typhoon–gale, typhoon–rainstorm, and typhoon–storm surge disaster chains in Zhuhai are the highest among the nine cities.
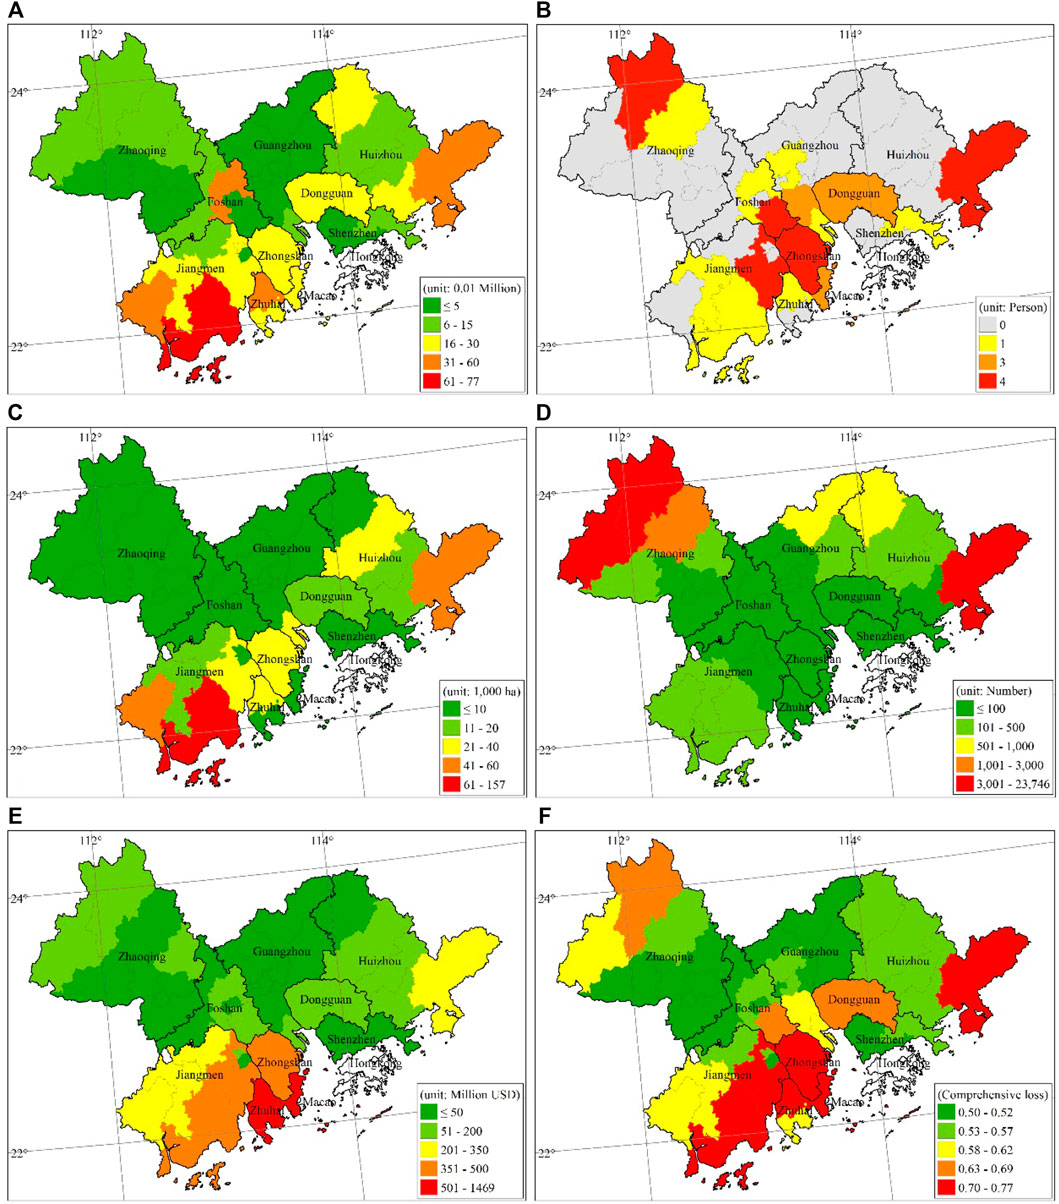
FIGURE 10. (A) Disaster-affected population, (B) casualties and missing persons, (C) disaster-affected crop area, (D) collapsed buildings, (E) direct economic losses, and (F) comprehensive loss caused by typhoons in the GBA from 2009 to 2020.
The typhoon disaster indicators are standardized according to Eq. 1. Based on the expert scoring method, the weight coefficients of disaster-affected population, casualties and missing population, disaster-affected crop area, collapsed buildings, and direct economic losses are determined as 0.1, 0.35, 0.1, 0.1, and 0.35, respectively. The typhoon comprehensive loss index can be obtained through the weighted average of the disaster indicators above (Figure 10F). The results suggest that the comprehensive loss index is the highest in Xiangzhou and Doumen Districts of Zhuhai, Xinhui District of Jiangmen, and Zhongshan City, exceeding 0.7. After calculating the average of comprehensive loss index at all counties (districts) in each city (Table 9), we find the largest value is in Zhongshan City, followed by Zhuhai. This situation is related to the high comprehensive risk level in the two cities. Although the comprehensive risk in Shenzhen is level 4, the loss is the lowest, which may be related to the developed economy and the strong capacity of typhoon disaster prevention and mitigation in Shenzhen. The spatial correlation coefficient between the comprehensive risk index and the comprehensive loss index at county level passes the significance test at 99.9% confidence level, indicating that the typhoon comprehensive risk index constructed in this study can well reflect the potential impact of typhoon disasters.
In this study, we developed an objective typhoon risk index from the view of disaster chains. This study is a pioneer to assess typhoon–gale, typhoon–rainstorm, and typhoon–storm surge disaster chains at county level of the GBA. The zoning of typhoon disasters chains can help policy-makers better understand typhoon risks in GBA. The main conclusions are as follows.
For the typhoon–gale disaster chain, the areas with risk of level 4 or above are mainly located in Zhuhai, Zhongshan, Foshan, Dongguan, central and southern Jiangmen, southern Shenzhen, and parts of Huizhou. In terms of the typhoon–rainstorm disaster chain, the areas with risk of level 4 or greater are mainly concentrated in Zhuhai, Zhongshan, Shenzhen, central-southern Foshan, northern Dongguan, central Jiangmen, and central Huizhou. Moreover, for the typhoon–storm surge disaster chain, the areas with risk of level 4 or greater are mainly distributed in Zhuhai, eastern Zhongshan and coastal areas surrounding the Pearl River Estuary. In addition, the typhoon comprehensive risk is level 4 or greater in southern Jiangmen, Zhuhai, Zhongshan, Shenzhen, southern Dongguan, southern Foshan, southwestern Guangzhou, and coastal areas of Huizhou.
At city level, the typhoon comprehensive risk reaches level 5 in Zhuhai and level 4 in Zhongshan Jiangmen, Dongguan, and Shenzhen. At county level, Doumen, Xiangzhou, and Jinwan Districts of Zhuhai, Futian and Nanshan Districts of Shenzhen, and Yuexiu and Nansha Districts of Guangzhou are the areas with very high typhoon comprehensive risk.
Moreover, the validation results of the spatial correlation between the typhoon comprehensive risk index and the comprehensive loss demonstrate that the typhoon comprehensive risk index constructed in this study can better reflect the possible impacts of typhoon disasters.
In this study, the risk indexes of typhoon disaster chains in GBA were constructed based on hazard, exposure, and vulnerability. Because of the numerous and complex factors affecting typhoon disaster risk, the selected indicators have certain subjectivity and may not be comprehensive enough. For the hazard index, we adopted the historical observation data of 29 meteorological stations in GBA, and the disadvantage was the spatial resolution limitation. For the exposure index, we need to try the path polygons approach to recognize regional exposure affected by the typhoon as a whole. To summarize, the exposure values for each census block within the county could be more reasonable (https://www.fema.gov/sites/default/files/documents). In the assessment of vulnerability, the weights were mainly to indicate the relative importance of terrain, river network, and vegetation coverage, which could affect the results of vulnerability and risk index. In this study, some weight coefficients were determined by the expert scoring method. Although the invited experts have rich experiences in typhoon disaster assessment, which can help us get relatively reasonable results, it was not an objective method as it depends on each expert’s subjective understanding. In order to overcome the subjectivity of the weight coefficients, we need to collect more typhoon disaster samples and determine the weight coefficient based on the actual disaster losses in the future. For the typhoon risk index, we adopted the natural breakpoint method in ArcGIS to classify risk levels, whereas the level interval could affect the risks. For now, it is difficult to find all specific quantifiable factors to evaluate typhoon risk, but it should be considered in future researches.
Under the background of global warming, the severe typhoon and its potential destructive power increased in the Northwest Pacific during the past few decades (Li et al., 2017; Knutson et al., 2019). The increasing trends in rainy days, total precipitation, and maximum 1-h precipitation of per typhoon indicate an enhanced influence of typhoons in South China (Ying et al., 2012). Moreover, sea level rise leads to higher typhoon storm surges along the coast, which can cause severe damage to the GBA. Therefore, climate change detection and attribution for typhoon activity should be further investigated to assist in better understanding of the typhoon disaster risk in the GBA (Lee et al., 2020).
The results of this study have a positive reference for local governments to improve the pertinence of the strategies for the regional typhoon disaster prevention and mitigation. This study reveals that the comprehensive risk of typhoon disaster is very high in Zhuhai and high in Zhongshan, Jiangmen, Dongguan, and Shenzhen. Improving the level of defense against typhoon through engineering measures, increasing green space, and arranging reasonable spatial patterns of impervious surfaces would provide useful ways to mitigate typhoon disasters in these areas. Meanwhile, different typhoon-resistant strategies should be made based on the typhoon disaster chains, the disaster-pregnant environment and the different characteristics of development planning, so as to improve the disaster prevention and mitigation capacity of cities.
Publicly available datasets were analyzed in this study. This data can be found here: http://www.resdc.cn/Default.aspx.
YJ and YZ contributed to conception and design of the study. YJ wrote the first draft of the article. YZ and LC performed the statistical analysis. YZ and LC revised the article. All authors contributed to manuscript revision, read, and approved the submitted version.
This work was funded by the National Key Research and Development Program of China (2019YFC1510400).
The authors declare that the research was conducted in the absence of any commercial or financial relationships that could be construed as a potential conflict of interest.
All claims expressed in this article are solely those of the authors and do not necessarily represent those of their affiliated organizations, or those of the publisher, the editors, and the reviewers. Any product that may be evaluated in this article, or claim that may be made by its manufacturer, is not guaranteed or endorsed by the publisher.
We thank the editor and three reviewers who all made very valuable suggestions for improvement of this manuscript. We thank Nanjing Hurricane Translation for reviewing the English language quality of this paper.
Chen, F., Jia, H., Du, E., Wang, L., Wang, N., and Yang, A. (2021). Spatiotemporal Variations and Risk Analysis of Chinese Typhoon Disasters. Sustainability 13, 2278. doi:10.3390/su13042278
Chen, W., Xu, W., and Shi, P. (2011). Risk Assessment of Typhoon Disaster at County Level in the Yangtze River Delta of China. J. Nat. Disasters 20 (4), 77–83. (in Chinese with English abstract). doi:10.13577/j.jnd.2012.0306
Chen, Y., Qin, J., Dong, L., and Zhang, T. (2017). The Formation Regularity and Control Measures of Urban Pluvial Floods in Guangzhou City. China Flood&Drought Management 27 (5), 72–76.
China Meteorological Administration (CMA) (1991-2018). Annual Bulletin of Meteorological Disasters in China. Beijing: China Meteorological Press.
China Meteorological Administration (CMA) (2006). GBT 19201-2006, Grade of Tropic Cyclones. Beijing: China Standards Press.
China Meteorological Administration (CMA) (2012). Grade of Precipitation (GB/T 28592—2012). Beijing: Science Press.
Chou, J., Dong, W., Tu, G., and Xu, Y. (2020). Spatiotemporal Distribution of landing Tropical Cyclones and Disaster Impact Analysis in Coastal China during 1990–2016. Phys. Chem. Earth 115, 102830. doi:10.1016/j.pce.2019.102830
Deng, Z., Xun, H., Zhou, M., Jiang, B., Wang, S., Guo, Q., et al. (2015). Impacts of Tropical Cyclones and Accompanying Precipitation on Infectious Diarrhea in Cyclone Landing Areas of Zhejiang Province, China. Ijerph 12 (2), 1054–1068. doi:10.3390/ijerph120201054
Didan, K. (2015). MOD13A1 MODIS/Terra Vegetation Indices 16-Day L3 Global 500m SIN Grid V006 [Data Set]. NASA EOSDIS LP DAAC. doi:10.5067/MODIS/MOD13A1.006
Emanuel, K. (2005). Increasing Destructiveness of Tropical Cyclones over the Past 30 Years. Nature 436 (7051), 686–688. doi:10.1038/nature03906
Fengjin, X., and Ziniu, X. (2010). Characteristics of Tropical Cyclones in China and Their Impacts Analysis. Nat. Hazards. 54, 827–837. doi:10.1007/s11069-010-9508-7
Fischer, T., Su, B., and Wen, S. (2015). Spatio-Temporal Analysis of Economic Losses from Tropical Cyclones in Affected Provinces of China for the Last 30 Years (1984-2013). Nat. Hazards Rev. 16, 04015010. doi:10.1061/(asce)nh.1527-6996.0000186
Gemmer, M., Yin, Y., Luo, Y., and Fischer, T. (2011). Tropical Cyclones in China: County-Based Analysis of Landfalls and Economic Losses in Fujian Province. Quat. Int. 244, 169–177. doi:10.1016/j.quaint.2011.03.021
He, C., Li, M., Li, T. T., Peng, X., Li, J., and Zhao, J. (2016). Comparison and Analysis of the Four Methods of Determining Weights in Multi-Objective Comprehensive Evaluation. J. Hubei Univ. (Natural Science) 38 (2), 172–178.
Huang, C. (2005). Risk Assessment of Natural Disaster Theory & Practice. Beijing: Science Press, 45–94. (in Chinese).
IPCC (2013). “Climate Change 2013,” in The Physical Science Basis (Cambridge, UK: Cambridge University Press).
IPCC (2014). “Climate Change 2014,” in Impacts, Adaptation, and Vulnerability. Part A: Global and Sectoral Aspects. Contribution of Working Group II to the Fifth Assessment Report of the Intergovernmental Panel on Climate Change (Cambridge: Cambridge University Press), 535–612.
Knutson, T., Camargo, S. J., Chan, J. C. L., Emanuel, K., Ho, C.-H., Kossin, J., et al. (2019). Tropical Cyclones and Climate Change Assessment: Part I: Detection and Attribution. Bull Amer Meteorol. Soc 100, 1987–2007. doi:10.1175/BAMS-D-18-0189.1
Lee, T.-C., Knutson, T. R., Nakaegawa, T., Ying, M., and Cha, E. J. (2020). Third Assessment on Impacts of Climate Change on Tropical Cyclones in the Typhoon Committee Region - Part I: Observed Changes, Detection and Attribution. Trop. Cyclone Res. Rev. 9 (1), 1–22. doi:10.1016/j.tcrr.2020.03.001
Li, R. C. Y., Zhou, W., Shun, C. M., and Lee, T. C. (2017). Change in Destructiveness of Landfalling Tropical Cyclones over China in Recent Decades. J. Clim. 30, 3367–3379. doi:10.1175/JCLI-D-16-0258.1
Luo, W., Hou, M., Liu, X., Huang, S., Chao, H., Zhang, R., et al. (2018). Geological and Geochemical Characteristics of marine-continental Transitional Shale from the Upper Permian Longtan Formation, Northwestern Guizhou, China. Mar. Pet. Geology. 89 (4), 58–67. doi:10.1016/j.marpetgeo.2017.06.029
Mendelsohn, R., Emanuel, K., Chonabayashi, S., and Bakkensen, L. (2012). The Impact of Climate Change on Global Tropical Cyclone Damage. Nat. Clim Change 2, 205–209. doi:10.1038/nclimate1357
Meraj, G., Romshoo, S. A., Yousuf, A. R., Altaf, S., and Altaf, F. (2015). Assessing the Influence of Watershed Characteristics on the Flood Vulnerability of Jhelum Basin in Kashmir Himalaya. Nat. Hazards. 77, 153–175. doi:10.1007/s11069-015-1605-1
National Climate Center of China Meteorological Administration (NCC) (2009). Technical Specification for Risk Zoning of Rainstorm and Flood Disaster.
Niu, H., Liu, M., Lu, M., Quan, R., Wang, J., and Zong, N. (2011). Risk Assessment of Typhoon Disasters in china Coastal Area during Last 20 Years. Sci. Geogr. Sin 31 (6), 764–768. (in Chinese with English abstract).
Pan, A., Tang, X., and Liu, H. (2002). Preliminary Research into the Typhoon Disaster Chain in Guangdong Coastal Area. J. Guangzhou University(Natural Sci. Edition). 1 (3), 55–61. (in Chinese with English abstract).
Pang, G., Huang, Y., He, J., Li, W., and Zhang, L. (2020). Analysis and Assessment of the Characteristics of Typhoon Induced Storm Surge in Zhuhai. J. Trop. Meteorology 36 (1), 42–50. (in Chinese with English abstract). doi:10.16032/j.issn.1004-4965.2020.005
Pielke, R. A., Gratz, J., Landsea, C. W., Collins, D., Saunders, M. A., and Musulin, R. (2008). Normalized Hurricane Damage in the United States: 1900-2005. Nat. Hazards Rev. 9, 29–42. doi:10.1061/(asce)1527-6988(2008)9:1(29)
Pielke, R. A., Landsea, C., Mayfield, M., Layer, J., and Pasch, R. (2005). Hurricanes and Global Warming. Bull. Amer. Meteorol. Soc. 86 (11), 1571–1576. doi:10.1175//BAMS-86-11-157110.1175/bams-86-11-1571
Ren, Z., Yu, Y., Zou, F., and Xu, Y. (2012). Quality Detection of Surface Historical Basic Meteorological Data. J. Appl. Meteorol. Sci. 23 (6), 739–747. (in Chinese with English abstract).
Shi, P., Lu, L., Wang, M., and Wang, J. (2014). Disaster System: Disaster Cluster, Disaster Chain and Disaster Compound. J. Nat. Disaster 23 (6), 1–12. doi:10.11821/dlyj201605003
Shi, P. (1991). On the Theory of Disaster Research and its Practice. J. Nanjing Univ. Nat. Sci. Res. Nat. Disasters album, 37–42. (in Chinese with English abstract).
Shi, P., Shuai, J., Chen, W., and Liu, L. (2010). Study on Large-Scale Disaster Risk Assessment and Risk Transfer Models. Int. J. Disaster Risk Sci. 1 (2), 1–8. doi:10.3974/j.issn.2095-0055.2010.02.001
Shih, H.-J., Chen, H., Liang, T.-Y., Fu, H.-S., Chang, C.-H., Chen, W.-B., et al. (2018). Generating Potential Risk Maps for Typhoon-Induced Waves along the Coast of Taiwan. Ocean Eng. 163, 1–14. doi:10.1016/j.oceaneng.2018.05.045
Shuai, J., Xu, W., and Shi, P. (2012). Characteristic Analysis of Typhoon Disaster Chains in the Yangtze River Delta Region of China. J. Nat. Disasters 21 (3), 36–42. doi:10.13577/j.jnd.2012.0306
Sun, S., Zhai, J., Li, Y., Huang, D., and Wang, G. (2020). Urban Waterlogging Risk Assessment in Well-Developed Region of Eastern China. Phys. Chem. Earth, Parts A/B/C 115, 102824. doi:10.1016/j.pce.2019.102824
Tang, X., and Liang, M. (2006). The Tropical Cyclones Landed in Guangdong and its Disaster Chains. J. Catastrophology 21 (3), 47–53. (in Chinese with English abstract).
Wang, D., Liu, J., Shan, Y., Ji, J., and Song, H. (2001). The Design and Establishment of 1:250000 Digital Elevation Model of China. Bull. Surv. Mapp. 10, 27–29.
Wang, R., Lian, F., Yu, H., Shi, P., and Wang, J. (2016b). Classification and Regional Features Analysis of Global Typhoon Disaster Chains Based on hazard-formative Environment. Geographical Res. 35 (5), 836–850. doi:10.11821/dlyj201605003
Wang, Y., Wen, S., LiThomas, X. F., Thomas, F., Su, B., Wang, R., et al. (2016a). Spatiotemporal Distributions of Influential Tropical Cyclones and Associated Economic Losses in China in 1984-2015. Nat. Hazards 84, 2009–2030. doi:10.1007/s11069-016-2531-6
Wang, Y., Yin, Y., and Song, L. (2021a). Characteristics and Diagnosis of the Landfalling Tropical Cyclones in the Guangdong-Hong Kong-Macao Greater Bay Area of China during 1981-2018. J. Trop. Meteorology 27 (3), 246–258. doi:10.46267/j.1006-8775.2021.22
Wang, Y., Zhai, J., and Song, L. (2021b). Waterlogging Risk Assessment of the Beijing-Tianjin-Hebei Urban Agglomeration in the Past 60 Years. Theor. Appl. Climatol 145, 1039–1051. doi:10.1007/s00704-021-03670-5
Webster, P. J., Holland, G. J., Curry, J. A., and Chang, H.-R. (20052005). Changes in Tropical Cyclone Number, Duration, and Intensity in a Warming Environment. Science 309 (5742), 1844–1846. doi:10.1126/science.1116448
Xu, N., and Gong, P. (2018). Significant Coastline Changes in China during 1991-2015 Tracked by Landsat Data. Sci. Bull. 63, 883–886. doi:10.1016/j.scib.2018.05.032
Xu, X., Sun, D., and Guo, T. (2015). A Systemic Analysis of Typhoon Risk across China. Nat. Hazards 77 (1), 461–477. doi:10.1007/s11069-015-1586-0
Yang, G. (1997). The Coastal Environments Change and Regional Responses to it in China. Naijing: Nanjing Institute of Geography and Limnology, Chinese Academy of Sciences.
Ye, J., Lin, G., Zhang, M., and Gao, L. (2020). Hazard Analysis of Typhoon Disaster-Causing Factors Based on Different landing Paths: a Case Study of Fujian Province, China. Nat. Hazards 100 (2), 811828. doi:10.1007/s11069-019-03843-6
Ye, J., Lin, G., and Zhang, M. (2014). Spatial Characteristics of Typhoon Disaster Chains in Fujian Province. J. Fujian Normal Univ. (Natural Sci. Edition) 30 (2), 99–106. (in Chinese with English abstract).
Ye, J., Wang, S., and Ding, F. (2019). Analysis of Typhoon Disaster Exposure in Coastal Areas of China Based on Geospatial Parameters. J. Inst. Disaster Prev. 21 (1), 82–88. (in Chinese with English abstract).
Yin, J., Wu, S., and Dai, E. (2012). Assessment of Economic Damage Risks from Typhoon Disasters in Guangdong, China. J. Resour. Ecol. 3 (2), 144–150. doi:10.5814/j.issn.1674-764x.2012.02.006
Yin, J., Yin, Z., and Xu, S. (2013). Composite Risk Assessment of Typhoon-Induced Disaster for China's Coastal Area. Nat. Hazards 69, 1423–1434. doi:10.1007/s11069-013-0755-2
Ying, M., Chen, B., and Wu, G. (2011). Climate Trends in Tropical Cyclone-Induced Wind and Precipitation over mainland China. Geophys. Res. Lett. 38, a–n. doi:10.1029/2010GL045729
Ying, M., Zhang, W., Yu, H., Lu, X., Feng, J., Fan, Y., et al. (2014). An Overview of the China Meteorological Administration Tropical Cyclone Database. J. Atmos. Ocean. Technol. 31, 287–301. doi:10.1175/jtech-d-12-00119.1
Yu, F., Dong, J., and Xu, F. (2016). Marine Disasters in the Offshore Seas of China. Beijing: Maritime Press, 46–48.
Yu, H., Wang, J., Chai, M., and Shi, P. (2014). Review on Research Methods of Disaster Loss Accumulation and Amplification of Disaster Chains. Prog. Geogr. 33 (11), 1498–1511. (in Chinese with English abstract). doi:10.11820/dlkxjz.2014.11.007
Yu, Y.-C., Chen, H., Shih, H.-J., Chang, C.-H., Hsiao, S.-C., Chen, W.-B., et al. (2019). Assessing the Potential Highest Storm Tide hazard in Taiwan Based on 40-year Historical Typhoon Surge Hindcasting. Atmosphere 10 (6), 346. doi:10.3390/atmos10060346
Zhang, X., Wei, B., Yang, H., and He, X. (2018). Risk Assessment of Typhoon Disaster in Guangdong Province Based on GIS. J. Trop. Meteorology 34 (6), 783–790. (in Chinese with English abstract).
Zhang, Y., Li, S., and Chen, H. (2017). Evaluation of Typhoon Disaster Risk in Guangdong Province. J. Trop. Meteorol. 33 (2), 281–288. doi:10.16032/j.issn.1004-4965.2017.02.015
Zhao, H., Liu, X., Yu, C., and Shang, Z. (2014). Risk Assessment and Temporal-Spatial Changes of Collapse, Landslide and Debris Flow in Guangdong. Trop. Geogr. 34 (6), 804–813. (in Chinese with English abstract).
Zhejiang Meteorological Observatory (2017). Assessment Technical Specification for the Risk Level of Rainstorm Processes. DB33/T 2025-2017.
Zhou, J., Zhou, Y., Li, H., and Weng, J. (2015). Statistical Analysis of Tropical Cyclones Affecting the Zhaoqing Prefecture over the Past 15 Years. Guangdong Meteorology 37 (2), 45–47. (in Chinese with English abstract).
Keywords: typhoon, disaster chain, risk, guangdong–Hong Kong–Macau Greater Bay Area, hazard
Citation: Wang Y, Yin Y and Song L (2022) Risk Assessment of Typhoon Disaster Chains in the Guangdong–Hong Kong–Macau Greater Bay Area, China. Front. Earth Sci. 10:839733. doi: 10.3389/feart.2022.839733
Received: 20 December 2021; Accepted: 08 February 2022;
Published: 11 March 2022.
Edited by:
Yihong Duan, Chinese Academy of Meteorological Sciences, ChinaReviewed by:
Shibin Xu, Ocean University of China, ChinaCopyright © 2022 Wang, Yin and Song. This is an open-access article distributed under the terms of the Creative Commons Attribution License (CC BY). The use, distribution or reproduction in other forums is permitted, provided the original author(s) and the copyright owner(s) are credited and that the original publication in this journal is cited, in accordance with accepted academic practice. No use, distribution or reproduction is permitted which does not comply with these terms.
*Correspondence: Yizhou Yin, eWluX3lpemhvdUBmb3htYWlsLmNvbQ==
Disclaimer: All claims expressed in this article are solely those of the authors and do not necessarily represent those of their affiliated organizations, or those of the publisher, the editors and the reviewers. Any product that may be evaluated in this article or claim that may be made by its manufacturer is not guaranteed or endorsed by the publisher.
Research integrity at Frontiers
Learn more about the work of our research integrity team to safeguard the quality of each article we publish.