 Kai Cao
 Hongtao Mai1
 Marie-Luce Chevalier
- 1Hubei Key Laboratory of Critical Zone Evolution, School of Earth Sciences, China University of Geosciences, Wuhan, China
- 2Center for Global Tectonics, State Key Laboratory of Geological Processes and Mineral Resources, China University of Geosciences, Wuhan, China
- 3Key Laboratory of Deep-Earth Dynamics of Ministry of Natural Resources, Institute of Geology, Chinese Academy of Geological Sciences, Beijing, China
- 4Southern Marine Science and Engineering Guangdong Laboratory (Guangzhou), Guangzhou, China
The Kongur Shan and Muztaghata massifs, bounded by the Kongur Shan extensional system (KES), represent tectonic and topographic anomalies in the eastern Pamir region. They are ideal examples to study how normal faulting and surface erosion influence Quaternary exhumation of the dome system. We apply multiple geomorphic parameters, including hypsometric integral, stream length-gradient index, drainage basin shape, drainage basin asymmetry and ratio of valley floor width to valley height, for the catchments on both sides of the range. We first evaluated the validity of various indices and chose three active tectonic-sensitive indices to establish a newly-integrated parameter (Iat) that is used to measure relative intensities of tectonic activity in active orogens. Results suggest stronger tectonic activity west of the domes along the Kongur Shan normal fault (KSF) and Muji dextral strike-slip fault, compared to the eastern side, along the Ghez and Kalagile faults. This first-order observation reflects tectonic control on the topographic development of the domal structure, consistent with eastward crustal tilting, attested by older thermochronology ages to the east. On the western flank of the range, stronger tectonic activity occurs mostly on the Muji fault, Kingata Tagh - Kongur Shan fault segment, as well as along the western and southern Muztaghata segments of the Kongur Shan fault. This is consistent with field investigations of Quaternary offsets of landforms, which suggest continuous activity of the Muji fault and KSF since the late Miocene. Average basin-wide erosion rates derived from stream power models are highest near the Kongur Shan dome, and gradually decrease southwards and northwards, in agreement with the spatial pattern of long-term exhumation rates in the footwall of the KSF obtained by low-temperature thermochronology data. Positive correlation between exhumation/erosion rates and extensional rates along the active faults located west of the domes indicates that extensional deformation likely plays a dominant role in controlling focused dome exhumation/erosion. However, considering peaked exhumation/erosion rates, stronger rock resistivity and steeper glacial landforms, attest to the important role of glacial buzz-saw in reshaping the recent dome’s landscape.
Introduction
The interaction between tectonics, climate, and surface processes in actively deforming orogens remain poorly understood at various timescales, despite the fact that mountain topography results from the interplay between tectonics and surface erosion. Tectonic activity raises the Earth’s surface through rock uplift, while surface erosional agents (e.g., fluvial, glacial, and landslide) modulate the landscape through bedrock removal. In active convergent mountain belts (e.g., Himalayas, Alaska, Southern Alps), the coincidence of localized rapid exhumation/erosion with abundant glacier cover and precipitation indicates that bedrock removal has a significant impact on rheological conditions of the crust hence on regional tectonics (e.g., Beaumont et al., 2001; Zeitler et al., 2001; Koons et al., 2002; Berger et al., 2008). Major debates remain regarding which forcing factor dominates focused exhumation/erosion in tectonically active orogens. Some studies suggest that tectonics plays a major role in controlling bedrock exhumation/erosion in high-relief mountains (e.g., Montgomery and Brandon, 2002; Burbank et al., 2003; Robert et al., 2009; Liu-Zeng et al., 2011; Bermúdez et al., 2012; Replumaz et al., 2020), while others argue that the increase in mountainous exhumation/erosion rates largely results from surface erosion linked to climate change (e.g., Zhang et al., 2001; Reiners et al., 2003; Molnar, 2004; Thiede et al., 2004; Herman et al., 2013). Therefore, distinguishing the relative importance of tectonics and climate on exhumation/erosion in active orogens is essential, although challenging (e.g., Molnar, 2003; Burbank, 2005; Whipple, 2009). Addressing the above issue requires independent estimates of tectonic activity and erosion rates in the orogen at various spatial and temporal scales.
The Kongur Shan (7,719 m) and Muztaghata (7,546 m) domes stand out high above the Pamir plateau (Figure 1), representing tectonic and topographic anomalies within a convergent tectonic regime. They are ideal structures to quantitatively assess the relative contribution of tectonics vs. erosion to focused domal exhumation in tectonically active mountain orogens. These massifs are capped by extensive glaciers and form the core of the eastern Pamir range, which is bounded to the west by the active Kongur Shan extensional system (KES; Figure 1; Chevalier et al., 2011, 2015; Li et al., 2019). Numerous thermochronology ages available in the region allow to constrain footwall exhumation rates of the KES (e.g., Arnaud et al., 1993; Robinson et al., 2004, Robinson et al., 2007, Robinson et al., 2010; Sobel et al., 2011; Cao et al., 2013a; Thiede et al., 2013). Focused Quaternary exhumation/erosion of these domal structures, derived from detrital zircon fission track (ZFT) ages, records abundant information about the feedback between tectonics and climate-related surface erosion that operates on the topographic evolution of the dome system (Cao et al., 2013b). While previous studies indicate variations in the magnitude and long-term extension rates along the western flank of the domes since the late Cenozoic (Robinson et al., 2004; Robinson et al., 2007, Robinson et al., 2010), shorter-term (late Quaternary) data are still sparse (Chevalier et al., 2011; Chevalier et al., 2015; Li et al., 2019). In addition, while exhumation of the domes is dominantly controlled by the KES, surface erosion also plays an important role, with the domal landscape being sculpted by glacial and/or fluvial processes (e.g., Cao et al., 2013a; Schoenbohm et al., 2014; Seong et al., 2009a, Seong et al., 2009b). In contrast to long-term exhumation along the domes, shorter-term (Quaternary) exhumation/erosion rates remain poorly constrained.
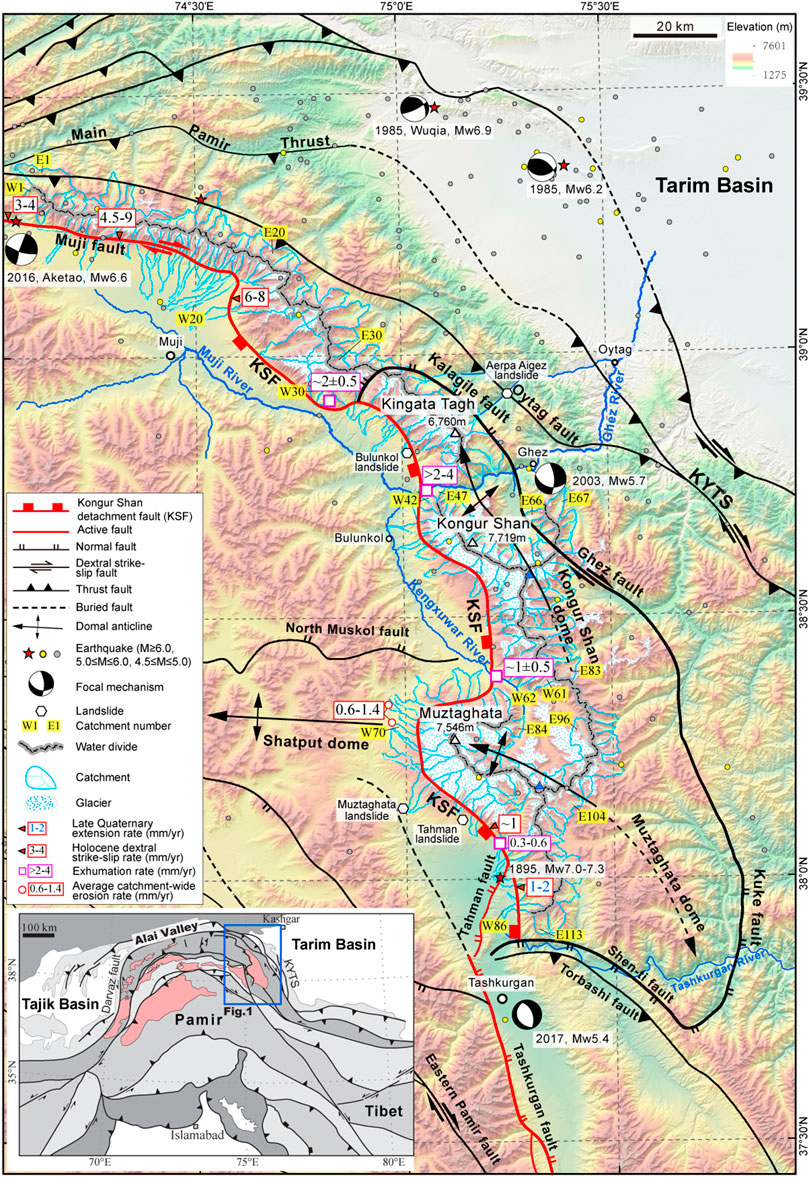
FIGURE 1. Topography of eastern Pamir and southwestern Tarim basin with main Cenozoic faults, earthquakes (from the USGS), mountain peaks and drainage basins (W = west and E = east). Inset shows location of study area in central Asia with Cenozoic gneiss domes in pink, modified from Cowgill (2010), Robinson et al. (2007), Schmidt et al. (2011), and Schwab et al. (2004). Holocene extension rates and strike-slip rates are from Chevalier et al. (2011), Chevalier et al. (2015) and Li et al. (2019). Long-term exhumation rates of the domes are from Arnaud et al. (1993), Cao et al. (2013a), Robinson et al. (2010), and Thiede et al. (2013). Average basin-wide erosion rates are from Seong et al. (2009a). The hexagons show the location of landslides reported by Yuan et al. (2013). KSF: Kongur Shan normalfault; KYTS: Kashgar-Yecheng transfer system.
In this study, we use a variety of geomorphic indices along the eastern Pamir domes in order to assess the relative importance of active tectonics, determined by an index of relative active tectonics (Iat) along the KES. We also use the stream power model combined with existing thermochronology data to predict average basin-wide erosion rates for 199 drainage basins located on both sides of the range. The spatial comparison of average basin-wide erosion rates and long-term exhumation rates with related tectonic activity and lithology, may help evaluate the relative contribution of tectonics and glacial/fluvial erosion on Quaternary exhumation and topographic evolution of the domes in the eastern Pamir region.
Background
Cenozoic Tectonic Evolution of the Pamir Region
The Pamir Mountains, located between the Tarim and Tajik basins to the east and west, respectively, stand as an orographic highland at the northwestern end of the Tibetan Plateau, shaped as a northward convex orogen (Figure 1) resulting from the northward indentation of the Pamir salient over the Tajik basin following the India-Asia collision (e.g., Burtman and Molnar, 1993; Sobel and Dumitru, 1997; Arrowsmith and Strecker, 1999; Coutand et al., 2002; Zubovich et al., 2010; Chapman et al., 2017; Chen et al., 2018; Li et al., 2020). Consequent shortening during the Cenozoic has driven lateral extrusion through extension and exhumation as well as tectonic denudation (e.g., Cao et al., 2013a; Stübner et al., 2013; Thiede et al., 2013; Rutte et al., 2017a, Rutte et al., 2017b; Worthington et al., 2020). Such large-scale deformation is characterized by compressional and transpressional structures along the western (Darvaz fault), northern (Main Pamir Thrust: MPT), and eastern (Kashgar-Yecheng transfer system: KYTS) Pamir, and metamorphic crystalline basement domes bounded by extensional faults emplaced in the interior (Figure 1). In the Pamir interior, large areas of metamorphic domes exhumed at the surface have experienced high-grade metamorphism since the Oligo-Miocene as well as continued exhumation, facilitated by extension until the late Miocene (e.g., Robinson et al., 2004; Robinson et al., 2007; Robinson et al., 2010; Cao et al., 2013a; Cao et al., 2013b; Stübner et al., 2013; Cai et al., 2017; Rutte et al., 2017a, Rutte et al., 2017b; Worthington et al., 2020).
Eastern Pamir Domes and Kongur Shan Extensional System
In the eastern Pamir, the Kongur Shan and Muztaghata domes mostly consist of Triassic granite, gneiss and schist within their core and some slivers of Paleozoic meta-sedimentary rocks in the north and east, which are bounded by the KES (Figures 1, 2). The KES includes the right-lateral/normal Muji fault to the NW, the Kalagile and Kuke normal faults and Ghez dextral fault to the east, as well as the Kongur Shan detachment fault (KSF), Taheman and Tashkurgan normal faults to the west, and the Shen-ti normal fault to the south (Figure 1). In addition, grade of metamorphism, magnitude of E-W extension, and exhumation rates in the rocks exposed in their footwalls (e.g., Robinson et al., 2004; Robinson et al., 2007; Robinson et al., 2010; Thiede et al., 2013) vary along the different fault segments.
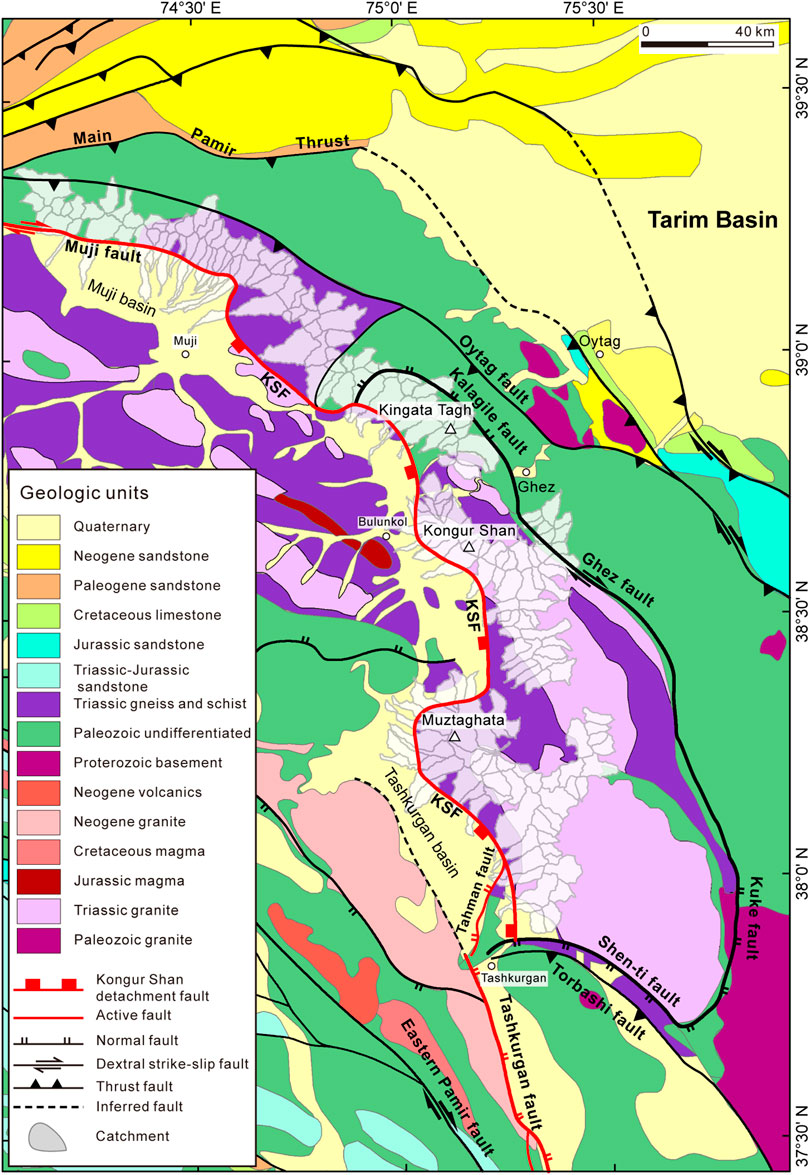
FIGURE 2. Simplified geological map of the eastern Pamir region, modified after Cao et al. (2013a), Cowgill (2010), and Robinson et al. (2007), with major lithologic units.
The Muztaghata dome is a south-vergent, northwest-to-west-plunging antiform, bounded by the steeply east-dipping Kuke normal fault to the east, south-dipping Shen-ti normal fault to the south and north-dipping North Muskol normal fault to the north (Figure 1; Robinson et al., 2007). This dome is interpreted as the eastward continuation of the west-plunging Shatput dome in the central Pamir (e.g., Robinson et al., 2007; Sobel et al., 2011; Rutte et al., 2017a, Rutte et al., 2017b). Th-Pb and U-Pb dating on monazites and zircons reveal peak metamorphism of the Muztaghata dome in the late Oligo-Miocene (Robinson et al., 2007; Cai et al., 2017). Multiple thermochronometers with different closure systems, including mica and biotite 40Ar/39Ar and apatite and zircon fission track, record rapid exhumation of the antiform at ∼12–8 Ma (Robinson et al., 2007; Sobel et al., 2011; Cao et al., 2013a; Cai et al., 2017), interpreted to result from doming accommodated by shearing along the Kuke, Shen-ti and North Muskol faults (Robinson et al., 2007; Sobel et al., 2011; Rutte et al., 2017a; Cai et al., 2017). Dome exhumation has continued until the Pliocene, possibly related to EW-oriented initial extension along the KSF and Taheman normal fault (Cao et al., 2013a; Thiede et al., 2013). Low-temperature thermochronology data input into one-dimension thermal modeling yields decreasing footwall exhumation rates from ∼1 to ∼0.4–0.5 ± 0.1 mm/yr from north to south of the Muztaghata dome since the Pliocene (Thiede et al., 2013). Average basin-wide erosion rates during the last glacial cycle, derived from 10Be cosmogenic nuclides, range from 0.6 to 1.4 mm/yr on the western flank of the dome (Seong et al., 2009a).
To the north, the Kongur Shan is defined as a NW-trending, NNW-plunging dome (Figure 1; Robinson et al., 2004). It is structurally continuous with the Muztaghata and Kingata Tagh massifs to the south and north, respectively, and is limited by the east-dipping Ghez dextral fault to the east, the low-angle west-dipping KSF to the west, and the north-dipping Kalagile normal fault to the north (Figure 1; Cao et al., 2013a; Cao et al., 2013b; Robinson et al., 2004, Robinson et al., 2007). The dome has experienced peak metamorphism at ∼9.3 Ma dated by Th-Pb monazite (Robinson et al., 2004). Dome exhumation initiated in the late Miocene and lasted until present due to extension along the KSF (Arnaud et al., 1993; Brunel et al., 1994; Robinson et al., 2004; Robinson et al., 2007; Robinson et al., 2010; Cao et al., 2013a, 2013b; Thiede et al., 2013). One-dimension thermal models with mica and biotite 40Ar/39Ar, apatite fission track and zircon (U-Th)/He data yield footwall exhumation rates of >2.5 ± 1.0 and ∼2 ± 0.5 mm/yr just north of the Kongur Shan massif, as well as in the NW Kingata Tagh massif, respectively (Thiede et al., 2013). Unlike the crosscutting relationship between the KSF and the Muztaghata dome, the Kongur Shan dome formation is interpreted to mostly be synchronous with EW-extension along the KSF taking place since the late Miocene (Arnaud et al., 1993; Brunel et al., 1994; Robinson et al., 2004; Cao et al., 2013a; Thiede et al., 2013). In summary, thermochronology ages suggest that the Kongur Shan and Muztaghata domes have undergone focused exhumation since the late Miocene (Cao et al., 2013a; 2013b), with maximum rates near the domes, decreasing northwards and southwards (Thiede et al., 2013). Despite a significant component of rock exhumation triggered by extension along the KES, prominent topographic relief in the core of the domes carved by glaciers and rivers indicates a significant contribution of glacial/fluvial erosion to domal exhumation, which remains poorly constrained (Cao et al., 2013b; Thiede et al., 2013; Schoenbohm et al., 2014).
The KES represents the most prominent tectonic structure in the eastern Pamir. As part of this extensional system, the ∼250 km-long KSF is the most striking low-angle normal fault (Robinson et al., 2004; Robinson et al., 2007). It bounds the western flank of the Kongur Shan and Muztaghata domes and controls the development of an intermontane basin named the Muji-Tashkurgan basin in its hanging wall (Figures 1, 2). The onset timing and magnitude of extension on the KSF is well constrained compared to other regional fault segments. At the northern end of the KSF, rapid cooling at ∼8–7 Ma in the footwall is interpreted to date the fault onset with an inferred ∼30 km of total E-W extension (Robinson et al., 2004). In the Kongur Shan massif, two-dimension thermo-kinematic modeling results based on mica and biotite 40Ar/39Ar ages suggest that the activity of the KSF started at ∼7 Ma and continued until recently at a constant exhumation rate of ∼4 mm/yr, hence a minimum E-W extension of ∼34 km (Robinson et al., 2004; Robinson et al., 2010). By contrast, the southern portion of the KSF may have initiated later, at ∼5–6 Ma, as recorded by overlapping apatite fission track and zircon U-Th/He cooling ages in the footwall (Cao et al., 2013a; Thiede et al., 2013), synchronous with initiation of normal faulting along the Tashkurgan fault that was constrained by accelerated exhumation in the footwall at 6–5 Ma recorded by zircon and apatite U-Th/He data (Chen and Chen, 2020). Together with extensive 5–6 Ma peak ages from detrital zircon fission track from modern glacial and river sediments at the base of the domes, this argues for roughly synchronous onset of E-W extension along the entire length of the KSF at ∼6–5 Ma (Cao et al., 2013a; Thiede et al., 2013). Accordingly, onset of extension along the southern segment of the KSF at ∼5–6 Ma would postdate the Muztaghata doming at 12–6 Ma (Robinson et al., 2007; Sobel et al., 2011; Cao et al., 2013a), suggesting that it would then have been mostly accommodated by extension along the Shen-ti and Kuke normal faults farther south and east. The magnitude of late Miocene E-W extension is estimated to be ∼20 km in the Muztaghata dome region, and to decrease dramatically to ∼3 km along the Tashkurgan fault to the south, with no clear offset along the Tahman fault (Robinson et al., 2007).
The KES is an active fault system that triggered large earthquakes, such as, the 2016 Aketao Ms 6.6 earthquake (e.g., Li et al., 2019) along the Muji fault, and the 1895 Ms 7–7.3 Tashkorgan earthquake along the Tahman and Tashkurgan faults (Li et al., 2011; USGS) (Figure 1). In general, late Quaternary E-W extension rates similarly decrease from north to south. While the dextral slip rate along the EW-striking Muji fault was determined as 4.5–9 mm/yr over ∼10 ka (Chevalier et al., 2011; Li et al., 2019), no rate estimate yet exists on active faults bounding the Kongur Shan and Muztaghata domes. Farther south, E-W extension rates are ∼1–2 mm/yr just south of the Muztaghata dome (Chevalier et al., 2015). This southward rate decrease is consistent with late Miocene footwall exhumation rates, which confirms faster extension along the KES in the north than in the south (Chevalier et al., 2011).
Climate and Surface Erosion
The present-day climatic patterns in the eastern Pamir region are dominated by the mid-latitude Westerlies that come from the Mediterranean, Black and Caspian seas (e.g., Aizen and Aizen, 1997). The Kongur Shan and Muztaghata domes are mostly semi-arid, with annual average precipitation of 70, 128 and 300 mm recorded at Tashkurgan, Bulunkol and Muztaghata stations (Figure 1), respectively (1956–2005, Duan et al., 2007; Seong et al., 2009a), which feeds glaciers and rivers.
The domal structures are extensively glaciated with >60% occupied by glaciers or glacial sediments. A variety of glacial landforms are identified in the valleys and the Muji-Tashkurgan basin, including U-shaped valleys, horn, arête, cirque, moraines, glacio-fluvial fans, debris flow and alluvial fans. Recent glacial morphology investigations suggested pronounced asymmetry in glacial area, debris cover, and headwall relief: less extensive glaciers, less debris cover and gentler headwall relief on the western (downwind) side of the range compared to the eastern side, interpreted to reflect the complex interplay between lithology, tectonics and climate (Schoenbohm et al., 2014). Glacial geology and 10Be cosmogenic dating of moraine boulders revealed that glaciers advanced westward from the Kongur Shan and Muztaghata massifs at least 12 times during the last two glacial cycles since ∼300 ka (Seong et al., 2009b; Owen et al., 2012), including 10 minor glacial advances since the Last Glacial Maximum (LGM ∼20 ka), hence suggesting a correlation with Northern Hemisphere climate oscillations (Seong et al., 2009b). The extent of glaciation varies along the range with limited glacier extent in the Muji-Tashkurgan basin since at least 43 ka, in contrast to extensive glaciation near the high domes since the LGM (Owen et al., 2012; Schoenbohm et al., 2014; Seong et al., 2009a; Seong et al., 2009b).
The gneiss domes are mainly incised by two tributary rivers, the Ghez and Tashkurgan Rivers, which are both fed by glacier meltwater and ultimately flow into the Tarim basin to the east (Figure 1). The Ghez River, which collects water from the Muji and Kengxuwar Rivers, cut across the Kingata Tagh, Kongur Shan and Muztaghata massifs, yielding a remarkable relief of ∼3,600 m (Ghez valley), which creates a prominent knickpoint where the river meets the KSF (Seong et al., 2009a). Some of the former glacier valleys may be reshaped by glacier meltwaters along the drainage divide, evident by river terraces located at the valley outlets (Schoenbohm et al., 2014). Farther south, the Tashkurgan River cuts across the southern Muztaghata dome, creating a topographic relief of >2,000 m along the river course.
Geomorphic Approaches
Based on ASTER GDEM of 30-m pixel resolution (https://lpdaac.usgs.gov/products/astgtmv003/), we calculated geomorphic parameters along two swath profiles, for a total of 199 drainage basins along the eastern Pamir range, with 113 and 86 basins located on the eastern and western sides of the water divide, respectively (Figure 1). Tectonic activity and erosion rates for each basin have been estimated by using the index of relative active tectonics (Iat) and the stream power model. Results allow to discuss the relative contribution of tectonics and surface erosion on focused Quaternary exhumation of the dome system.
Index of Relative Active Tectonics
The Iat index is an integrated parameter that measures relative active tectonics taking into account multiple geomorphic indices: hypsometric integral (HI), stream length-gradient index (SL), drainage basin shape (Bs), drainage basin asymmetry (Af-50), ratio of valley-floor width to valley height (Vf), and mountain front sinuosity (Smf), partially based on the determination of the basin’s mean elevation and slope (El Hamdouni et al., 2008; Pérez-Peña et al., 2009; Alipoor et al., 2011). The multiple geomorphic indices were extracted from the 30-m resolution DEM. The geomorphic index values listed above can be divided into three classes from high to low tectonic activity. The combination of these indices, called Iat index, averages the different classes of geomorphic indices, and values can be divided into four classes which provide quantitative information of relative tectonic activity from strong to weak. In this study, we apply a revised Iat index that does not consider the mountain front sinuosity (Smf) because mountain fronts of catchments along the KSF are relatively straight at larger-scale, due to uplift along the normal faults.
Hypsometric Integral Index
The hypsometric integral (HI) index is defined as the area below the hypsometric curve that relates the horizontal cross-sectional area of a drainage basin to the relative elevation above the basin outlet. It represents the relative volume that has not been eroded in the topography (Strahler, 1952). Therefore, drainage basin evolution can be divided into young, mature, and old stages for high, medium, and low HI values, corresponding to convex, S-shaped, and concave hypsometric curves, respectively. The curve shapes and HI values have usually been used to assess relative tectonic activity in various geologic and geomorphic settings (e.g., Strahler, 1952; Lifton and Chase, 1992; Kirkbride and Matthews, 1997; Chen et al., 2003; Brocklehurst and Whipple, 2004; Pérez-Peña et al., 2009).
The formula for the HI index is:
where Hmax, Hmean, and Hmin represent maximum, mean and minimum elevations of a given drainage basin, respectively.
Stream Length-Gradient Index
The stream length-gradient (SL) index has been widely applied to quantify the geometry of drainage networks. The changes in river longitudinal gradients are indicated by the SL index that is sensitive to changes in stream power or rock competence, which possibly corresponds to tectonics, climate change and lithologic contrast along the river course (Hack, 1973; Flint, 1974; Whittaker et al., 2008). Abnormally high SL values indicate significant structural variations in the drainage basins (Pérez-Peña et al., 2009). In general, river segments with high SL values correspond to zones of more intense tectonic activity or resistant bedrock, and vice versa (Hack, 1973; Flint, 1974; Whittaker et al., 2008).
The formula for the SL index is:
where ΔH/ΔL is the local gradient of the estimated stream segment, and L is the channel length from the water divide to the midpoint of the river reach.
Drainage Basin Shape
The shape of a drainage basin (Bs) is sensitive to tectonic activity and thus, can be used to indicate active deformation. Elongated drainage basins typically correlate with greater Bs values, indicative of stronger tectonic activity. By contrast, rounded catchments yield lower Bs values that are likely related to weak tectonic activity (Bull and Mcfadden, 1977; Ramírez-Herrera, 1998).
The formula for the Bs index is:
where Bl is the distance from the drainage mouth to its headwaters and Bw is the maximum width of the catchment.
Asymmetric Factor
Tectonic activity can lead to tectonic tilting in catchment areas. The asymmetric factor of basins (Af) is a useful geomorphic indicator of the existence of active deformation and the degree of tilting of the crust at basin scale (Keller and Pinter, 2001; Pérez-Peña et al., 2009). An Af value close to 50 means that the basin has little or no tilting, while an Af value greater or smaller than 50 indicates basin tilting resulting from tectonic activity. Therefore, absolute values of Af-50 are often used to evaluate basin asymmetry that may reflect relative tectonic activity along active faults (Keller and Pinter, 2001; El Hamdouni et al., 2008; Pérez-Peña et al., 2009).
The formula for the Af index is:
where Ar is the area of the catchment on the right bank of the stream, and At is the total surface area of the basin.
Ratio of Valley-Floor Width to Valley Height
The Vf index is defined as the ratio of the valley floor’s width to the valley’s average height (Bull and Mcfadden, 1977). The Vf values positively correlate with the longitudinal valley shapes: narrow, V-shaped valleys usually have low Vf values, associated with high rates of uplift or incision. By contrast, broad, U-shaped valleys have relatively high Vf values indicative of lower rates of uplift or incision (Bull and Mcfadden, 1977; Keller and Pinter, 2001). Vf is measured at a given distance from the basin mouth upstream for easy comparison among different channels (Pérez-Peña et al., 2009). Here, we set the valley cross-sections and calculate Vf values at distances of 3.0–4.0 km upstream from the drainage mouth depending on the size of the drainage basins.
The formula for the Vf index is:
where Vfw is the width of the valley floor; Eld is the elevation on the left bank of the valley; Erd is the elevation on the right bank; and Esc is the average elevation of the valley floor.
Index of Relative Active Tectonics
In order to assess relative active tectonic activity in a given region, a comprehensive index Iat is introduced by summing and averaging classes of various geomorphic indices (El Hamdouni et al., 2008; Pérez-Peña et al., 2009; Alipoor et al., 2011) as described above.
The formula for the Iat index is:
where S is the sum of each class values and n is the number of the indices applied.
Stream Power Model
Average erosion rates of a drainage basin can be expressed as a function of stream gradient and drainage area that includes the temporal river channel change in elevation (Dietrich et al., 1994; Hack, 1973; Flint, 1974; Howard and Kerby, 1983; Whipple and Tucker, 1999; Snyder et al., 2000). In the eastern Pamir region, most of the selected drainage basins show typical features of river valleys because of their concave and convex hypsometric curves (Strahler, 1952; Figure 3). This is reflected by the presence of fluvial terraces along the Muji fault and KSF (Schoenbohm et al., 2014). Few of them have S-shaped hypsometric curves in glaciated drainage basins, that was interpreted as resulting from progressive glacial modification on initial fluvial landscape (Brocklehurst and Whipple, 2004; Figure 3). Therefore, it is plausible to use the stream power model to simulate average basin-wide erosion rates.
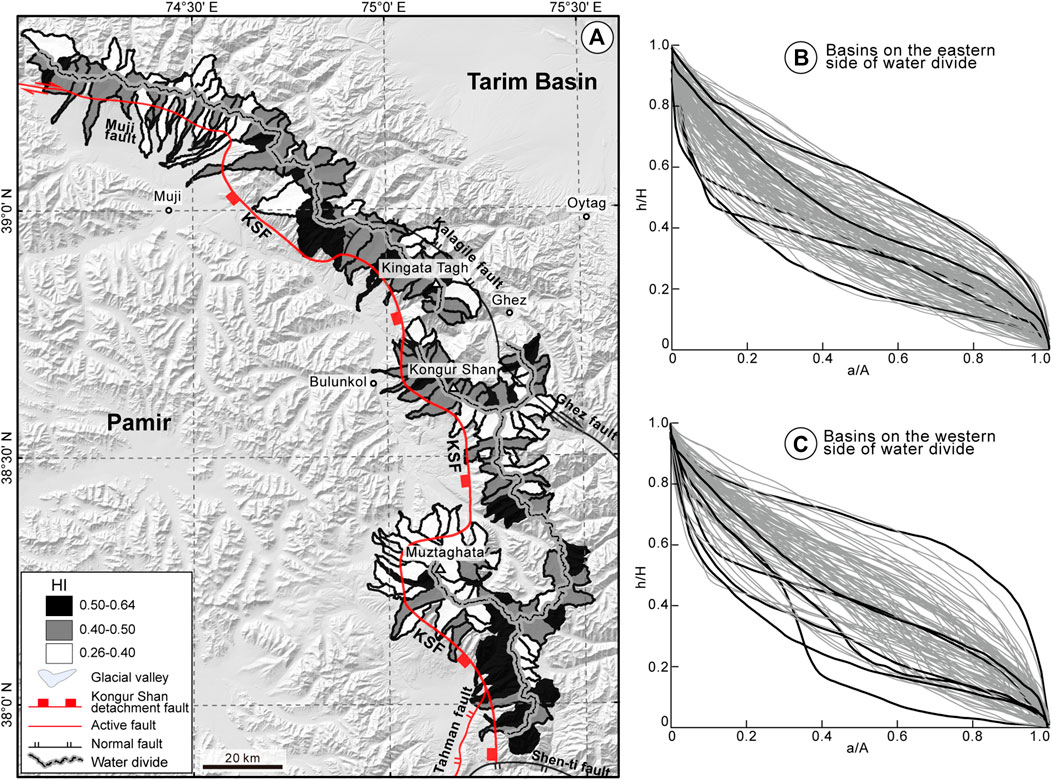
FIGURE 3. Spatial distribution of HI values and hypsometric curves in eastern Pamir domes region. (A) Spatial map of HI values along water divide; (B,C) Hypsometric curves on eastern and western sides of divide, with typical curves in bold.
The stream power model can be expressed as below:
where z is elevation of the river profile; U is the rock uplift rate; A is the upstream drainage area; S is the local channel gradient; K is the erodibility coefficient related to tectonics, lithology, and climate; and m and n are positive constants reflecting basin hydrology, geometry, and erosion processes (Dietrich et al., 1994; Whipple and Tucker, 1999). At steady state, river channel erosion rate is equal to rock uplift rate (E = U), and channel erosion does not change through time (dz/dt = 0), Eq. 7 can be deduced as equilibrium channel gradient (Se):
Where, in the case of uniform U, K, m and n, Ks=(U/K)1/n and θ = -m/n (0.4<θ < 0.6) are channel steepness indices and intrinsic channel concavity indices, respectively (Flint, 1974; Snyder et al., 2000; Kirby and Whipple, 2001; Brocklehurst and Whipple, 2002; Wobus et al., 2006; Brocklehurst and Whipple, 2007; Kirby and Whipple, 2012). In various geologic settings, the power-law relation in Eq. 8 can be defined as:
where S is the local channel gradient. At steady state, river channel erosion rate is equal to rock uplift rate (E = U). Using slope-area analysis (Kirby and Whipple, 2001; Wobus et al., 2006; Kirby and Whipple, 2012), a linear regression of the logarithm slope-area relationship can be obtained, so that the slope and intercept indicate θ and log(Ks).
Alternatively, the stream power parameters can be derived from an integral approach for steady state rivers (Perron and Royden, 2013). The transformed profile ‘χ plots’ can be described as:
where xb is the elevation of the river outlet that is usually set to zero; A0 is the reference drainage area that is set to 1 km2. The channel steepness (Ksn) is determined directly from the slope of χ plots.
Reference Concavity Index
In order to compare the channel steepness in different drainage basins, the reference concavity index (θref = -m/n), which influences the channel steepness (Perron and Royden, 2013), is introduced based on the channel steepness pattern (Ksn; Whipple, 2004). The values of θ, m and n are empirical constants that vary with changes in tectonics, lithology, and climate. Based on numerical simulations and field observations, the concavity index normally ranges from 0.3 to 0.6 and θ = 0.45 is often used for channels in the most active orogens (Whipple, 2004). For glacier-dominated channels, θ is ∼0.4 (Brocklehurst and Whipple, 2007). Variations in slope exponent n, generally ranging from 2/3 to 7/3 (Whipple and Tucker, 1999; Kirby and Whipple, 2001; Tucker and Whipple, 2002; Kirby and Whipple, 2012), strongly influence river channel evolution because it plays an important role in determining the functional relationship between channel steepness, incision rate and erosion coefficient.
Erodibility Coefficient
The erodibility coefficient (K) represents the resistance of a river-bed to erosion. This parameter varies with a set of factors in active orogens, such as lithology, rock uplift, and climate (Stock and Montgomery, 1999; Sklar and Dietrich, 2001; Perron and Royden, 2013), as well as sediment load (Howard et al., 1994; Whipple and Tucker, 1999) and channel width and runoff (Finnegan et al., 2005). K values (given m = 0.4, n = 1) widely range from 10–2 to 10–7 m0.2/a depending on the lithology and rock uplift rates (Stock and Montgomery, 1999).
The relationship between channel steepness (Ks), erosion coefficient (K), and river erosion rate (E) can be deduced from Eqs 9, 10 as follows:
Given the spatial variations of exhumation rates along the KSF footwall (Thiede et al., 2013), the eastern Pamir domes are accordingly divided into three segments: northwest of Kingata Tagh, Kongur Shan, and Muztaghata. Assuming a topographic steady state, we use the classic linear model (n = 1, θref = 0.45). Therefore, solving Eqs 11, 12 yields average erodibility coefficients for the three segments, of 7.31 × 10⁻⁶, 1.86 × 10⁻⁵ and 5.77 × 10⁻⁶ m0.1/a, respectively (Table 1).
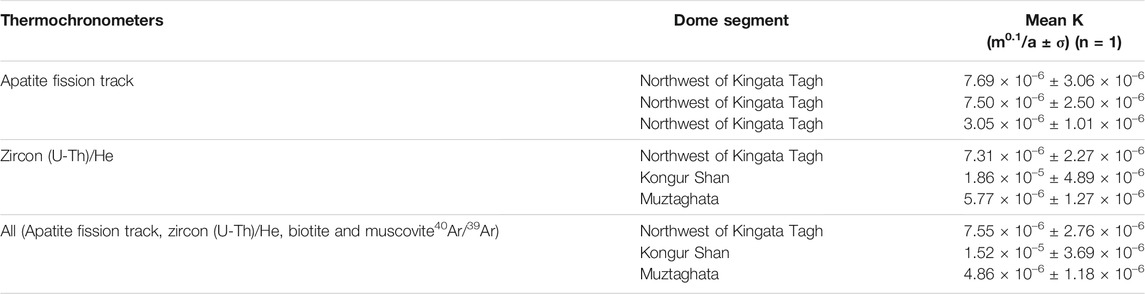
TABLE 1. Average erodibility coefficient (K) for northern Kingata Tagh, Kongur Shan, and Muztaghata massifs. Thermochronology data and exhumation rates are from Thiede et al. (2013).
Channel Steepness
The standardized channel steepness index (Ksn) is calculated using a unified reference concavity (θ). It is not only a useful parameter in quantifying erosion efficiency of fluvial valleys (Whipple, 2004), but it is also potentially useful to assess the relative efficiency of fluvial and glacial erosion (Brocklehurst and Whipple, 2004, Brocklehurst and Whipple, 2006; Brocklehurst and Whipple, 2007). Here, given a linear stream power model (n = 1, θref = 0.45), Ksn values can be calculated by an integral approach (Perron and Royden, 2013) and mostly range from 20 to 300 for drainage basins along the KSF (Figure 4; Supplementary Table S1). Average Ksn values for basins 87, 57 and 55 in the northern Kingata Tagh, Kongur Shan, and Muztaghata massifs are 147.4, 206.7, and 122.3 m0.9, respectively. The greatest Ksn values appear in the southern Kingata Tagh and Kongur Shan massifs and decrease to the north and south on both sides of the water divide (Figure 4). This pattern correlates well with spatial variations in exhumation rates of footwall rocks along the KSF (Figure 4), especially for small-to medium-sized (4–74 km2) glacier basins. Note that there is no clear correlation between Ksn values and rock resistance to erosion (Figure 4).
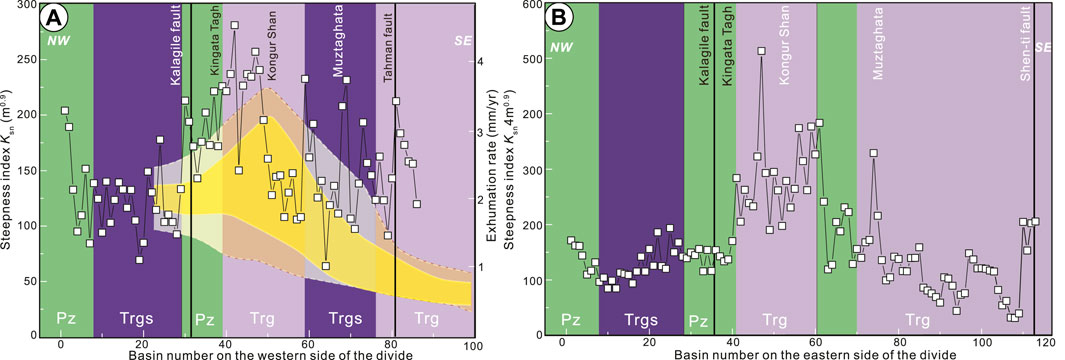
FIGURE 4. Spatial distribution of Ksn values and footwall exhumation rates with respect to variable lithology on the western (A) and eastern (B) side of the divide along the KSF. Exhumation rates are from Thiede et al. (2013).
Results
Geomorphic Indices
Geomorphic index values are listed in Supplementary Table S1. For comparison, the various indices sensitive to tectonic activity were arbitrarily divided into three classes, with Classes one and three indicating high and low activity, respectively. The limit between classes was determined using the Natural Breaks (Jenks) method in ArcGis 10.2, which generally agrees with changes in the range of values for the various indices.
Topographic Relief and Slope
We generated relief and slope maps covering the targeted drainage basins along the range (Figure 5). For comparison, we plotted the mean elevations and slopes along two 4 km-wide swath profiles on each side of the divide, roughly parallel to the mountain crests (Figure 5C). In general, elevations along the western swath profile are higher (average of 4,889 m) than those to the east (average of 4,219 m), with peaks at the Kongur Shan and Muztaghata massifs although the slopes roughly overlap with each other, indicative of similar roughness with average values of <30° on each side. In addition, basin-wide geomorphic parameters have been extracted, including basin area, perimeter, elevation, relief, and slope (Supplementary Table S1). In general, basin relief is highest around the Kongur Shan and Muztaghata domes on both sides of the range, with average basin relief on the western side that are much higher (2,270 m) than those on the eastern side (961 m) (Figure 5D; Supplementary Table S1). By contrast, the average slope of the western basins (22.7°) is slightly smaller than that of the eastern ones (27°) (Figure 5E).
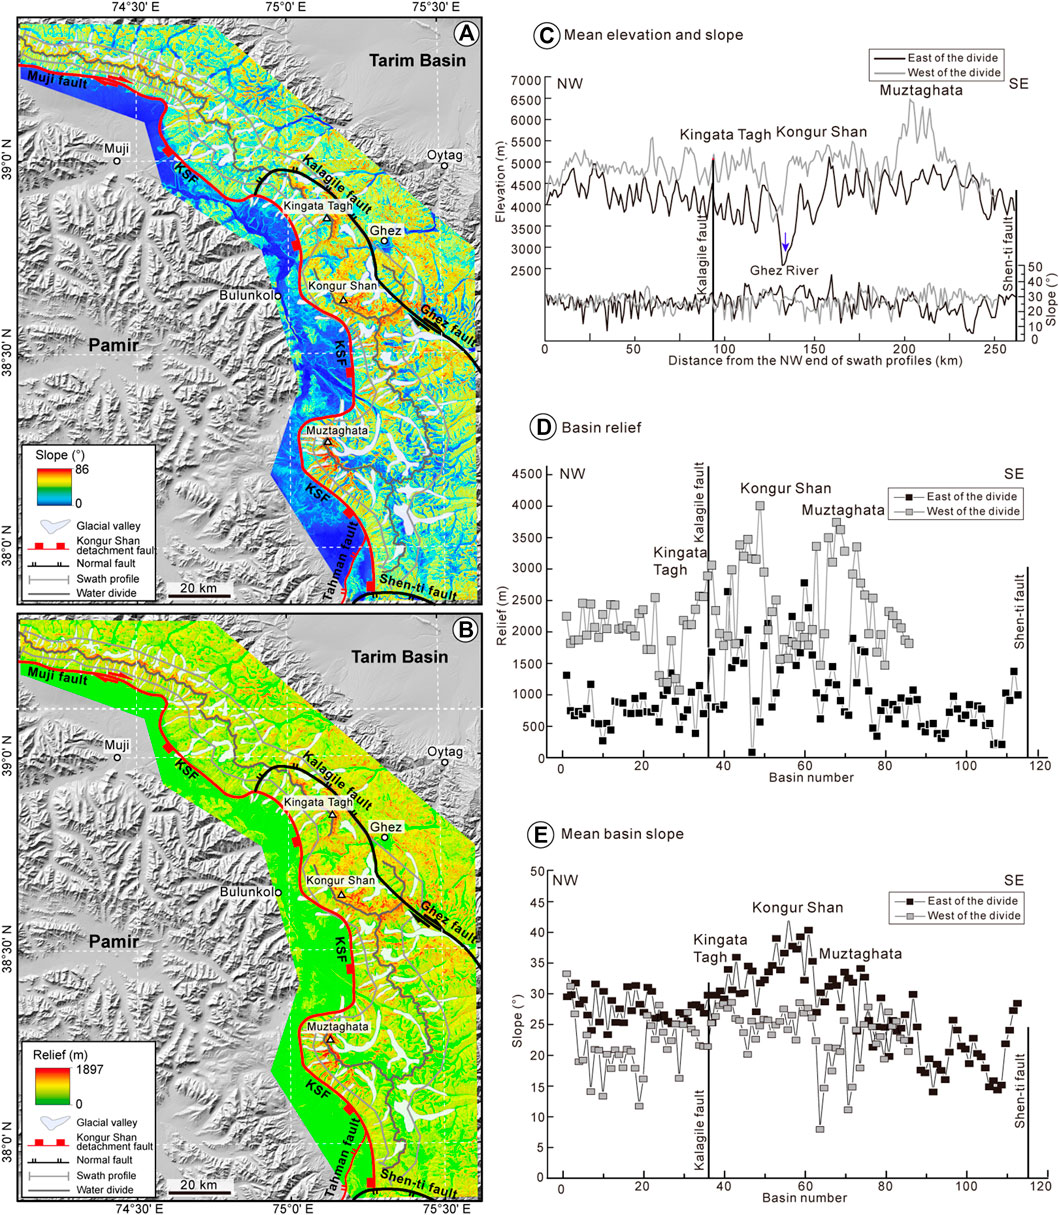
FIGURE 5. Spatial distribution of morphometric parameters along water divide. Topographic slope (A) and relief (B). (C) Mean elevation and slope envelops along two swath profiles. Relief (D) and slope (E) of basins on each side of divide.
Hypsometric Integral
HI values range from 0.257 to 0.642 with an average of 0.428 (Figure 3A; Supplementary Table S1). On the eastern side of the range, HI values vary between 0.272–0.561 with an average of 0.417 while on the western side, the basins have a slightly wider range of 0.257–0.642, with a higher average of 0.444. The HI values have been divided into three groups indicating the relative tectonic activity of the KSF: 1) class 1: 0.5 < HI < 0.64: strong tectonic activity; 2) class 2: 0.4 ≤ HI ≤ 0.5: moderate; 3) class 3: 0.26 < HI < 0.4: weak, with classes 1 and 2 focusing on fault segments on the western side of the Kingata Tagh, Kongur Shan, and southern Muztaghata massifs. Drainage basins on the western side of the divide generally have concave, S-shaped and convex hypsometric curves (Figure 3B), the latter with higher HI values indicating young landscapes related to recent normal faulting. By contrast, basins on the eastern side show mostly concave and S-shaped curves that represent mature landscapes (Figure 3C).
Stream Length-Gradient Index
SL values for the 199 basins range from 42 to 1,559 and were naturally categorized into three classes of tectonic activity (Figure 6A): 1) class 1 with SL ≥ 914: strong tectonic activity; 2) class 2 with 530 < SL < 914: moderate; 3) class 3 with SL ≤ 530: relatively weak. SL values on the western side of the divide fall into classes 1 and 2 and are clearly higher than those on the eastern side, which mostly belong to class 3. This trend reflects a significant control of the KSF on the drainage basins, with higher SL values on the southern and western sides of the Kingata Tagh, Kongur Shan, and Muztaghata massifs (Figure 6A).
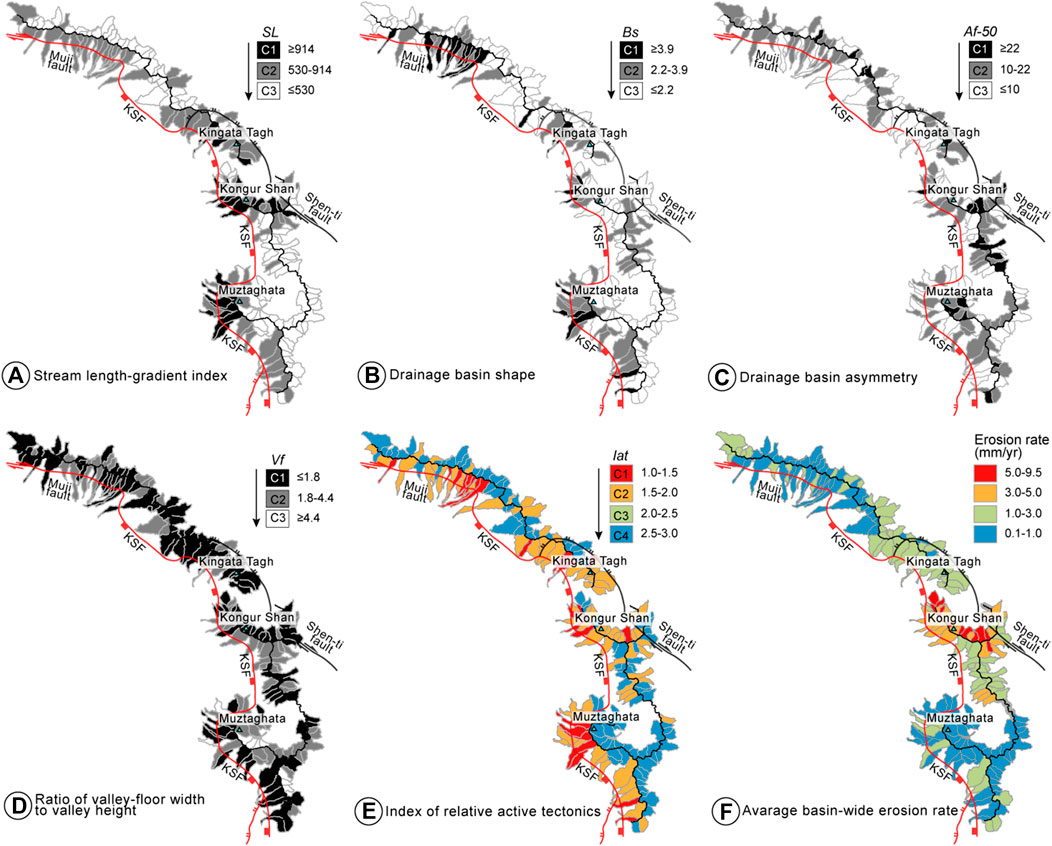
FIGURE 6. Spatial distribution of various morphometric indices for basins along eastern Pamir range. (A) SL, (B) Bs, (C) Af-50, (D) Vf, (E) Iat, and (F) average basin-wide erosion rates. Arrows point to intensity of tectonic activity from relatively strong to weak.
Drainage Basin Shape
The Bs values range between 0.7 and 9.8 and can be sorted into three classes of tectonic activity (Figure 6B): 1) class 1: Bs ≥ 3.9: strong tectonic activity; 2) class 2: 2.2 < Bs < 3.9: moderate; 3) class 3: Bs ≤ 2.2: relatively weak. The spatial distribution of the Bs values and classes roughly shares the same pattern with the SL index but also shows high Bs values along the Muji fault (Figure 6B).
Asymmetric Factor
The absolute values of Af-50 varying from 0.1 to 49.8 can be classified into three classes of tectonic activity (Figure 6C): 1) class 1 with |Af-50|≥22: strong tectonic activity; 2) class 2 with 10<|Af-50|<22: moderate: 3) class 3 with |Af-50|≤10: relatively weak. The class distribution of Af-50 appears random and thus does not show similar spatial pattern with SL and Bs that can be used to indicate relative active tectonics.
Ratio of Valley-Floor Width to Valley Height
Vf values ranging from 0.2 to 8.7 are classified into three classes of relative tectonic activity (Figure 6D): 1) class 1: Vf ≤ 1.8: strong tectonic activity; 2) class 2: 1.8 < Vf < 4.4: moderate; 3) class 3: Vf ≥ 4.4: relatively weak. Class 1 is mostly limited to the glacier-melt river valleys of the Muji fault, Kingata Tagh-Kongur Shan, and Muztaghata massifs. Most of the drainage basins yield Vf values of 1.8–4.4 in class 2, indicative of relatively moderate tectonic activity in the entire region.
Index of Relative Tectonic Activity
The Iat index was calculated based on the quantification of three morphometric parameters (SL, Bs, and Vf). While spatial distribution of classes for these three indices are broadly consistent with each other, Af-50 shows a large discrepancy (also see discussion below). In general, Iat values can be divided into four groups that correspond to four classes of relative tectonic activity (Figure 6E): 1) class 1 (1.0 ≤ Iat < 1.5): very strong tectonic activity; 2) class 2 (1.5 ≤ Iat < 2.0): strong; 3) class 3 (2.0 ≤ Iat < 2.5): moderate; 4) class 4 (2.5 ≤ Iat < 3.0): very weak. Very strong tectonic activity is localized along the Muji fault and on two segments of the KSF on the western flank of Kingata Tagh–Kongur Shan, and western and southern Muztaghata dome. Overall, Iat values are clearly higher on the western side of the range compared to the eastern side (Figure 6E), consistent with the presence of the KES to the west.
Modeled Erosion Rates
The long-term exhumation of the domes derived from low-temperature thermochronology data (Table 1) were interpolated to the average basin-wide exhumation/erosion rates during the Quaternary by stream power model. Average basin-wide erosion rates were calculated based on topographic parameters (n = 1, θref = 0.45, Kking = 7.31 × 10⁻⁶ m0.1/a; Kkongur = 1.86 × 10⁻⁵ m0.1/a; Kmuztagh = 5.77 × 10⁻⁶ m0.1/a) for the region northwest of the Kingata Tagh, Kongur Shan, and Muztaghata massifs, respectively, by solving Eq. 5 (Figure 6F; Supplementary Table S1). In general, the modeled erosion rates peak in the Kongur Shan area and decrease northwestward and southward. The average basin-wide erosion rates in the Kongur Shan area are ∼3.84 ± 1.0 mm/yr, consistent with footwall exhumation rates of >2.5 ± 1.0 and ∼4 ± 1.0 mm/yr derived from thermochronology data (Robinson et al., 2010; Thiede et al., 2013). Northwest of Kingata Tagh, basin erosion rates are <0.5–2 mm/yr and are lowest at the northwestern end, with not much difference between basins on the eastern and western sides. In the Muztaghata region, erosion rates range from 0.1 to 1 mm/yr, with little difference between both sides of the range. The average erosion rate is 2.0 ± 0.5 mm/yr for all basins on the eastern side, slightly higher than that (1.5 ± 0.4 mm/yr) on the western side.
Discussion
Sensitivity of Various Morphometric Indices to Active Tectonics
Previous studies applied a combination of two indices (e.g., Vf and Smf) to determine the relative degree of tectonic activity (Bull and Mcfadden, 1977; Silva et al., 2003) and recurrence intervals of surface ruptures related to earthquakes along mountain fronts (Silva et al., 2003). More geomorphic indices (e.g., SL, Bs, Af-50, and HI) were later introduced to evaluate regional tectonics (Ramírez-Herrera, 1998; El Hamdouni et al., 2008; Pérez-Peña et al., 2009; Alipoor et al., 2011; Bhat et al., 2020). These parameters were averaged to generate an integrated index of relative active tectonics (Iat) (El Hamdouni et al., 2008); however, the validity of various morphologic indices has not yet been quantitatively evaluated despite the fact that inconsistent indices have been artificially excluded in the calculation (El Hamdouni et al., 2008).
In this study, we attempt to assess the sensitivity of various geomorphic indices to active tectonics that were used to generate the Iat index, by examining correlations between the values of Iat and SL, Bs, Af-50, Vf and HI, respectively (Figure 7). Our best-fit solution shows negative correlation between Iat values and SL and Bs, and positive correlation between Iat and Vf values, with much higher correlation coefficients than with Af-50 and HI values (Figures 7A–D). This suggests that SL, Bs, and Vf indices are more sensitive to tectonic activity than Af-50 and HI in the eastern Pamir domes. Accordingly, we only use the average classes of SL, Bs, and Vf to produce a new Iat index (Supplementary Table S1), which is consistent with the presence of active faults on the western side of the divide (Figure 6E). As such, we suggest that the validity of multiple geomorphic indices should be evaluated by correlation test and active fault mapping before being integrated as a reliable index of relative active tectonics.
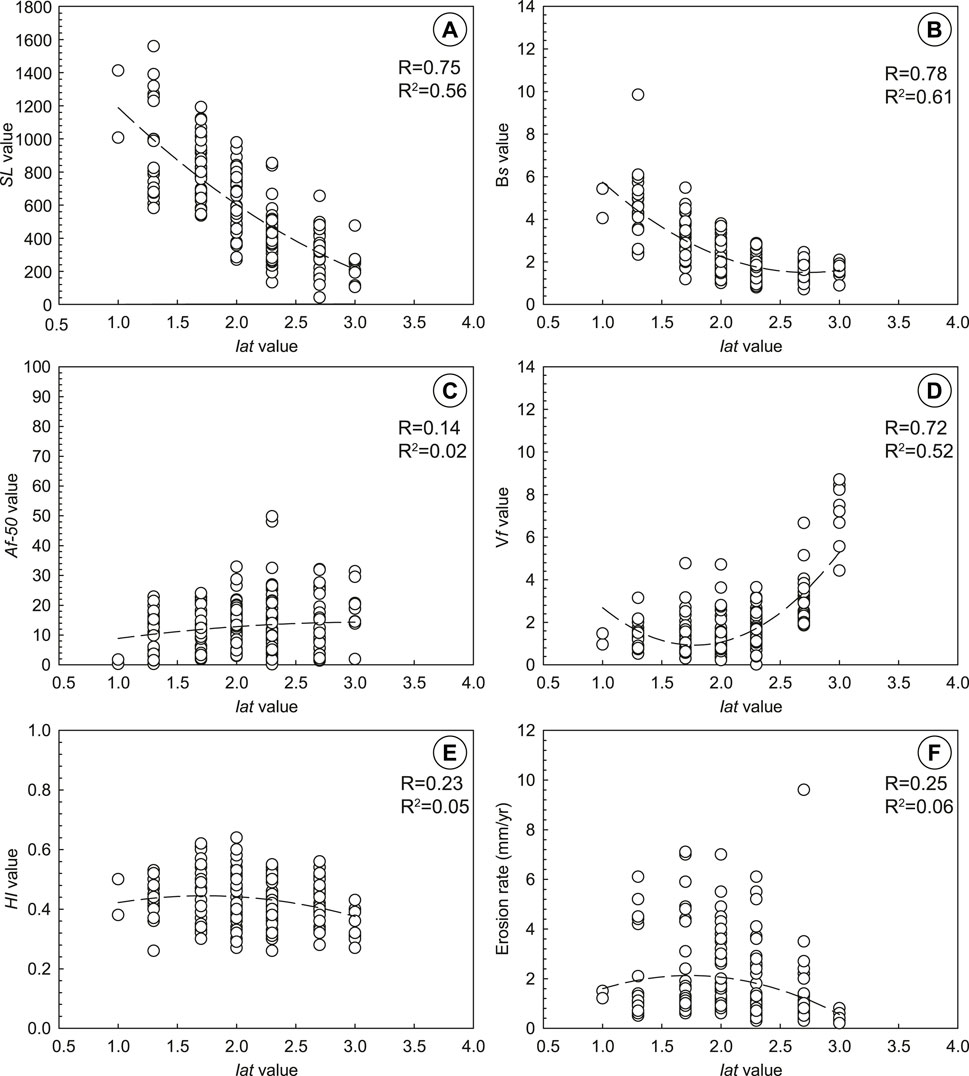
FIGURE 7. Correlation of Iat values with multiple morphologic parameters using polynomial, quadratic dynamic fitting in Sigmaplot. Best-fit solutions (R and R2) for correlation between Iat values and (A) stream length-gradient index (SL), (B) drainage basin shape (Bs), (C) asymmetric factor (Af-50), (D) ratio of valley-floor width to valley height (Vf), (E) hypsometric integral (HI) and (F) erosion rate.
Quaternary Tectonic Activity and Exhumation Along the KES
Field investigation on the late Quaternary vertical and horizontal slip rates of the KSF and Muji fault have been undertaken (Chevalier et al., 2011, Chevalier et al., 2015; Li et al., 2019), but along-strike variations in tectonic activity as well as footwall exhumation along the KES have not been fully resolved yet. Whether the southern end of the KSF presents intense recent activity remains debated (Robinson et al., 2007; Yuan et al., 2013). In Figure 6E, Iat values suggest relatively strong normal faulting along the KSF on the western side of the divide compared to the Ghez and Kalagile faults to the east, consistent with eastward crustal tilting as revealed by low temperature thermochronology ages across the domal structures along the Ghez and Tashkurgan rivers (Sobel et al., 2011; Cao et al., 2013a; Thiede et al., 2013).
Interestingly, relatively intense tectonic activity concentrates on three segments of the western KES: the right-lateral Muji fault and the KSF bounding the Kingata Tagh—Kongur Shan, and the western and southern Muztaghata domes (Figure 6E), as supported by field observations. For example, numerous clear right-lateral (along segments oriented ∼ EW to WNW-ESE) and vertical offsets of Quaternary moraines and alluvial fans exist along the Muji fault and KSF, with Holocene horizontal rates of >4.5–9 mm/yr on the former (Chevalier et al., 2011; Li et al., 2019) and of ∼1 mm/yr on the latter at the base of the Muztaghata massif (Chevalier et al., 2015). Likewise, clear vertical offsets and triangular facets all along the KSF bounding the Kongur Shan massif reflect strong tectonic activity (Arnaud et al., 1993; Robinson et al., 2004; Cao et al., 2013a; Chevalier et al., 2015), with late Miocene exhumation of domal rocks at rates of >2–4 mm/yr (Cao et al., 2013a, Cao et al., 2013b; Thiede et al., 2013). Despite the fact that both extension rates and magnitude significantly decrease to the south (Robinson et al., 2007; Chevalier et al., 2011; Chevalier et al., 2015; Li et al., 2019), the KSF still shows evidence of clear tectonic activity immediately south of the Muztaghata massif, reflected by Quaternary vertical offsets of alluvial fans with throw rates of ∼1.7 mm/yr (Chevalier et al., 2015). In addition, two large landslides along the western Muztaghata dome have been interpreted to have been triggered by large earthquakes (Yuan et al., 2013) although the influence of glaciers or bedrock fractures cannot be excluded (Seong et al., 2009a). Therefore, we consider that the tectonic activity along the southern end of the KSF exists since its initiation at ∼5–6 Ma (Cao et al., 2013a; Thiede et al., 2013). Tectonic activity along the KES may shift drainage basins from mature to immature states, currently reflected by convex and S-shaped hypsometric curves on the KSF-controlled (western) side, in contrast to concave and S-shaped curves on the eastern side, indicative of greater mass loss due to glacial excavation, as suggested by the presence of larger glaciers (Schoenbohm et al., 2014).
Unlike the relative intensity of tectonic activity along the KES (Figure 6E), modeled average basin-wide erosion rates clearly differ: highest in the Kongur Shan dome area, and gradually decreasing to the north and south (Figure 6F). This trend in along-strike variations in the magnitude of basin-wide erosion rates broadly coincides with late Miocene exhumation rates in the footwall of the KSF, determined by low-temperature thermochronology (Thiede et al., 2013; Figure 8). While no clear correlation exists between Iat values and erosion rates for all catchments (Figure 7F), spatial coincidence of high erosion rates and strong active tectonics (low Iat) around the Kingata Tagh—Kongur Shan massifs indicates complex feedback between glacial/fluvial erosion and tectonics, as discussed in the next section. Interestingly, average erosion rates are also comparable to millennial-scale basin-wide erosion rates (Figure 1, Figure 6F). For the drainage basins W69, W70, and W71 located on the western flank of the Muztaghata dome for example, modeled average basin-wide erosion rates of 0.6 ± 0.1 to 1.3 ± 0.3 mm/yr (Supplementary Table S1) overlap well with average basin-wide erosion rates of ∼0.6–1.4 mm/yr in the Holocene determined by 10Be cosmogenic dating (Seong et al., 2009a). In addition, our results constrain for the first time, erosion rates <1.5 mm/yr in the footwall of the Muji fault, i.e., almost half that of the exhumation/erosion rates of 2–4 mm/yr in the footwall of the KSF near the Kongur Shan massif (Thiede et al., 2013). This trend most likely reflects the smaller vertical component along the mainly strike-slip Muji fault (Chevalier et al., 2011; Chevalier et al., 2015; Li et al., 2019), in contrast to the KSF to the south, even though less extensive glacial coverage has been suggested to influence such trend (Schoenbohm et al., 2014).
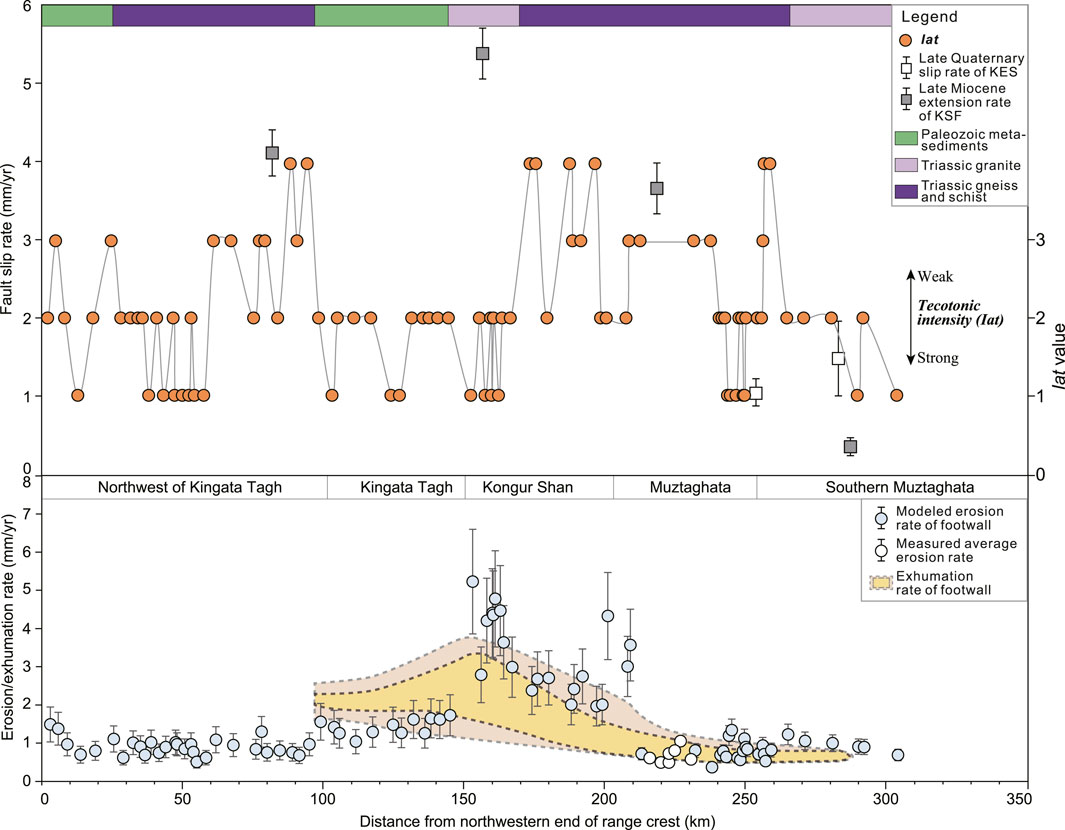
FIGURE 8. Spatial correlation between average basin-wide erosion rates, footwall exhumation rates, extension rates along the KSF, as well as Iat values and lithology on the western side of the range. Exhumation rates are modified from Thiede et al. (2013) and shown as orange shaded areas bounded by black dashed lines for 1σ and 2σ of modeled data. Late Miocene and Holocene extension rates along KSF are from Robinson et al. (2004), Robinson et al. (2007), Robinson et al. (2010) and Chevalier et al. (2015), respectively. Measured average basin-wide erosion rate are from Seong et al. (2009a). Note the starting point 0 km (NW end of divide line between E1 and W1) in Figure 1.
Mechanisms for Quaternary Dome Exhumation/Erosion
Detrital zircon fission-track data from modern glacial and river sediments reveal focused Quaternary exhumation of the domes (Cao et al., 2013b), but mechanisms for this episode of exhumation/erosion remains uncertain. In the Kongur Shan massif area, accelerated exhumation rates since 2 Ma were interpreted to be due to rapid, recent cooling (Arnaud et al., 1993). However, two-dimension thermal models suggested that this apparent increase in cooling rates may be explained by advection of isotherms resulting from rapid dome exhumation from ∼7 Ma to present at a constant rate of 4.2–6.5 mm/yr (Robinson et al., 2010). In the southern Muztaghata dome, a few apatite fission track ages of <3 Ma were suggested to record exhumation related to continued doming (Sobel et al., 2011). Alternatively, focused denudation of the dome system may be explained by positive feedback of extension along the KES in response to unloading of glacial/fluvial erosion (Cao et al., 2013b), since significant Quaternary exhumation is inevitably accomplished by glacial/fluvial erosion, as shown by the prominent topographic relief in the Kingata Tagh, Kongur Shan, and Muztaghata domes (Seong et al., 2009a; Thiede et al., 2013; Schoenbohm et al., 2014). More importantly, along-strike changes in average basin-wide erosion rates and footwall exhumation rates may be explained by other mechanisms including factors such as lithology, tectonics, and/or glacial/fluvial erosion, having the most control on the exhumation/erosion of the dome system during the Quaternary.
First, lithology is not a major factor controlling along-strike changes in Quaternary exhumation/erosion rates of the domes, although rock resistivity clearly influences surface erosion processes (Sklar and Dietrich, 2001; Korup and Schlunegger, 2009; Schoenbohm et al., 2014). In fact, the maximum exhumation/erosion rates coincide with the location of strong Triassic granite and gneiss in the Kongur Shan area, while weaker Paleozoic meta-sedimentary rocks correlate with reduced exhumation/erosion rates in the Kingata Tagh massif area (Korup and Schlunegger, 2009; Figure 6F, Figure 7). However, the fact that the Muztaghata dome has similar rock resistivity as that of the Kongur Shan dome, but yields much lower exhumation/erosion rates, suggests limited lithologic influence on the change in magnitude of exhumation/erosion rates along the range.
Second, E-W extension along the KSF likely plays a dominant role in controlling dome exhumation/erosion at long-term timescales. Thermochronology data combined with estimated magnitudes of extension yield long-term extension rates along the KSF of: 1) 3.8–4.3 mm/yr (∼30 km since ∼8–7 Ma) in the northern Kingata Tagh (Robinson et al., 2004); 2) >4.9 mm/yr (>34 km since ∼7 Ma) in the Kongur Shan area (Robinson et al., 2004; Robinson et al., 2010); 3) 3.3–4.0 mm/yr (∼20 km since 6–5 Ma) in the Muztaghata area (Robinson et al., 2007; Cao et al., 2013a); and 4) <0.5 mm/yr (<3 km since 6–5 Ma) south of the Muztaghata massif (Robinson et al., 2007; Cao et al., 2013a). Similar late Quaternary dextral rates of >4.5–9 mm/yr have been determined NW of Kingata Tagh along the Muji fault (Chevalier et al., 2011; Li et al., 2019), and ∼EW extension rates of 1.3–2 mm/yr immediately south of Muztaghata (throw rates of 1.1–1.7 mm/yr with KSF dip angle of 35–45°; Chevalier et al., 2015). Along-strike variations in both long-term exhumation rates and average basin-wide erosion rates in the footwall of the KSF positively correlate with extension rates along the fault since the late Miocene (Figure 8), suggesting that extensional tectonics impacts exhumation/erosion patterns along the domes at long-term timescales.
By contrast, negative correlation between exhumation/erosion rates and Iat values around the Kingata Tagh and south Muztaghata massifs (Figure 8) seemingly supports the idea that tectonic activity along the KSF is not the main driver for the Quaternary dome exhumation/erosion. This is supported by an absence of clear correlation between Iat values and modeled and measured erosion rates during the late Quaternary (Figure 8). In particular, the higher-relief regions (e.g., Kongur Shan and Muztaghata) with maximum glacier debris cover (Schoenbohm et al., 2014) correlate with higher exhumation/erosion rates (Cao et al., 2013a; Robinson et al., 2007), which highlights the importance of glaciers in shaping alpine landscapes. Indeed, glacial processes such as deepening and widening of the glacial valleys as well as headwater erosion, remove large amounts of bedrock which hence enhance valley relief (MacGregor et al., 2000; Brocklehurst and Whipple, 2002; Brocklehurst and Whipple, 2006; Brocklehurst and Whipple, 2007; Shuster et al., 2011; Schoenbohm et al., 2014). This is attested by relatively lower HI values and S-shaped hypsometric curves around the summits of the Kongur Shan and Muztaghata massifs, but with steeper headwall relief (Figures 3, 5). Additionally, topographic swath profiles show greater mean basin relief and slopes on the eastern side compared to the western side of the range (Figures 5D,E). This pronounced asymmetry is consistent with contrasting glacial landforms, with larger glacier surfaces, more debris cover, and steeper headwalls on the eastern (downwind) side of the range (Schoenbohm et al., 2014).
In actively deforming orogens, the glacial buzz-saw hypothesis is believed to exert a major control on the development of alpine topography, which predicts maximum glacial erosion around and above the mean long-term equilibrium line altitude (Aizen et al., 2001; Berger et al., 2008; Brozovic et al., 1997; Egholm et al., 2009; Spotila et al., 2004; Sternai et al., 2011). Where glacial buzz-saw is efficient, glacial morphology correlates with exhumation/erosion rates so that zones of high exhumation rates correlate with those of high erosion rates (Hallet et al., 1996), where taller glacier headwalls correspond to more resistant rocks (Brocklehurst and Whipple, 2002, Brocklehurst and Whipple, 2007; Naylor and Gabet, 2007; Scherler et al., 2011). In the eastern Pamir region, we observe that high average basin-wide erosion rates indeed correlate with high exhumation rates around the Kongur Shan and Muztaghata massifs, where taller headwalls and greater basin relief and slopes are more abundant than anywhere else along the range (Figures 5, 7; Schoenbohm et al., 2014; this study). Triassic igneous and metamorphic rocks that make up these two domes are indeed more resistant than the meta-sedimentary rocks to the north. The coupling of higher exhumation rates, higher erosion rates, stronger rock resistivity, and steeper glacial landforms supports the glacial buzz-saw mechanism in modulating the recent landscape of the eastern Pamir domes. Nevertheless, the summits of the Kongur Shan and Muztaghata domes rising much higher than the regional equilibrium line altitude (Seong et al., 2009a) imply that their formation may escape the effect of the glacial buzz-saw (Schoenbohm et al., 2014) and may be protected by glaciers (Thomson et al., 2010). However, the feedback between exhumation of deep-seated metamorphic rocks in response to surface glacial erosion through change of strain field remains unclear and merits further work.
Conclusion
We calculated multiple morphometric indices, including hypsometric integral (HI), stream length-gradient index (SL), drainage basin shape (Bs), drainage basin asymmetry (Af-50), and ratio of valley-floor width to valley height (Vf) for 199 basins on both sides of the eastern Pamir range, where the high Kongur Shan and Muztaghata domes are located. Integration of three tectonic-sensitive indices of SL, Bs, and Vf, defined by the index of relative active tectonics (Iat), allows to assess the relative importance of tectonics versus climate along the Kongur Shan extensional fault system (KES) that bounds the domes to the west. Combined with published footwall exhumation rates, magnitude of extension, as well as glacial geology, morphology, and chronology, modeled basin-wide erosion rates derived from stream power laws allow to evaluate the relative contribution of tectonics, glacial/fluvial erosion, and lithology to focused exhumation of the dome system. We found that:
1) Iat values show stronger tectonic activity along the KES west of the range compared to that along the Ghez and Karagile faults to the east, suggesting that tectonic activity on the western side of the range exerts first-order control on topographic development of the domal structure. This is consistent with eastward crustal tilting since the late Miocene. Relatively stronger tectonic activity on the western side of the range is mostly located along the Muji fault and the Kingata Tagh - Kongur Shan segment of the KES, as well as along the western and southern Muztaghata segment of the KES, also supported by field investigation on Quaternary offsets of geomorphic landforms. This suggests that the Muji fault and KSF may have been active since the late Miocene.
2) Average basin-wide erosion rates derived from the stream power model peak in the Kongur Shan area and gradually decrease to the north and south, in agreement with spatial variation in long-term exhumation rates in the footwall of the Kongur Shan fault (KSF) determined by low-temperature thermochronology data. Both basin-wide erosion rates and footwall exhumation rates positively correlate with long-term extension rates along the KSF, indicating that extensional deformation likely plays a dominant role in controlling focused dome exhumation/erosion in the long term. Higher exhumation rates, higher erosion rates, stronger rock resistivity, and steeper glacial landforms together support the glacial buzz-saw process in shaping the recent landscape of the Kongur Shan and Muztaghata domes.
3) The efficiency of various geomorphic indices should be evaluated by correlation test and detailed mapping of active faults before averaging them as a real index of relative active tectonics.
Data Availability Statement
The original contributions presented in the study are included in the article/Supplementary Material, further inquiries can be directed to the corresponding author.
Author Contributions
KC and GW conceived the idea and provided the funding. KC, GW, and M-LC conducted the field work. KC and HM performed the geomorphological analysis. KC and HM wrote the manuscript. All authors discussed and commented on the manuscript.
Funding
This study was funded by the National Natural Science Foundation of China (Nos. 42172245, 91755213, 41202144), the Fundamental Research Funds for the Central Universities, China University of Geosciences (No. G1323511641) and China Scholarship Council (No. 201606415003).
Conflict of Interest
The authors declare that the research was conducted in the absence of any commercial or financial relationships that could be construed as a potential conflict of interest.
Publisher’s Note
All claims expressed in this article are solely those of the authors and do not necessarily represent those of their affiliated organizations, or those of the publisher, the editors and the reviewers. Any product that may be evaluated in this article, or claim that may be made by its manufacturer, is not guaranteed or endorsed by the publisher.
Acknowledgments
We thank An Wang for enlightening discussion. We thank two reviewers for their constructive comments and guest editor for handling with the manuscript.
Supplementary Material
The Supplementary Material for this article can be found online at: https://www.frontiersin.org/articles/10.3389/feart.2022.839203/full#supplementary-material
References
Aizen, E. M., Aizen, V. B., Melack, J. M., Nakamura, T., and Ohta, T. (2001). Precipitation and Atmospheric Circulation Patterns at Mid-latitudes of Asia. Int. J. Climatol. 21 (5), 535–556. doi:10.1002/joc.626
Aizen, V., and Aizen, E. (1997). Hydrological Cycles on the north and South Peripheries of Mountain-Glacial Basins of central Asia. Hydrol. Process. 11 (5), 451–469. doi:10.1002/(sici)1099-1085(199704)11:5<451:aid-hyp448>3.0.co;2-m
Alipoor, R., Poorkermani, M., Zare, M., and El Hamdouni, R. (2011). Active Tectonic Assessment Around Rudbar Lorestan Dam Site, High Zagros Belt (SW of Iran). Geomorphology. 128 (1-2), 1–14. doi:10.1016/j.geomorph.2010.10.014
Arnaud, N. O., Brunel, M., Cantagrel, J. M., and Tapponnier, P. (1993). High Cooling and Denudation Rates at Kongur Shan, Eastern Pamir (Xinjiang, China) Revealed by40Ar/39Ar Alkali Feldspar Thermochronology. Tectonics. 12 (6), 1335–1346. doi:10.1029/93tc00767
Arrowsmith, J. R., and Strecker, M. R. (1999). Seismotectonic Range-Front Segmentation and Mountain-belt Growth in the Pamir-Alai Region, Kyrgyzstan (India-Eurasia Collision Zone). Geol. Soc. America Bull. 111 (11), 1665–1683. doi:10.1130/0016-7606(1999)111<1665:srfsam>2.3.co;2
Beaumont, C., Jamieson, R. A., Nguyen, M. H., and Lee, B. (2001). Himalayan Tectonics Explained by Extrusion of a Low-Viscosity Crustal Channel Coupled to Focused Surface Denudation. Nature. 414 (6865), 738–742. doi:10.1038/414738a
Berger, A. L., Gulick, S. P. S., Spotila, J. A., Upton, P., Jaeger, J. M., Chapman, J. B., et al. (2008). Quaternary Tectonic Response to Intensified Glacial Erosion in an Orogenic Wedge. Nat. Geosci. 1 (11), 793–799. doi:10.1038/ngeo334
Bermúdez, M. A., van der Beek, P. A., and Bernet, M. (2012). Strong Tectonic and Weak Climatic Control on Exhumation Rates in the Venezuelan Andes. Lithosphere. 1, 3–16. doi:10.1130/L212.1
Bhat, M. A., Dar, T., and Bali, B. S. (2020). Morphotectonic Analysis of Aripal Basin in the North-Western Himalayas (India): An Evaluation of Tectonics Derived from Geomorphic Indices. Quat. Int. 568, 103–115. doi:10.1016/j.quaint.2020.10.032
Brocklehurst, S. H., and Whipple, K. X. (2002). Glacial Erosion and Relief Production in the Eastern Sierra Nevada, California. Geomorphology. 42 (1-2), 1–24. doi:10.1016/s0169-555x(01)00069-1
Brocklehurst, S. H., and Whipple, K. X. (2004). Hypsometry of Glaciated Landscapes. Earth Surf. Process. Landforms. 29 (7), 907–926. doi:10.1002/esp.1083
Brocklehurst, S. H., and Whipple, K. X. (2006). Assessing the Relative Efficiency of Fluvial and Glacial Erosion through Simulation of Fluvial Landscapes. Geomorphology. 75 (3-4), 283–299. doi:10.1016/j.geomorph.2005.07.028
Brocklehurst, S. H., and Whipple, K. X. (2007). Response of Glacial Landscapes to Spatial Variations in Rock Uplift Rate. J. Geophys. Res. 112, F02035. doi:10.1029/2006jf000667
Brozović, N., Burbank, D. W., and Meigs, A. J. (1997). Climatic Limits on Landscape Development in the Northwestern Himalaya. Science. 276 (5312), 571–574. doi:10.1126/science.276.5312.571
Brunel, M., Arnaud, N., Tapponnier, P., Pan, Y., and Wang, Y. (1994). Kongur Shan normal Fault: Type Example of Mountain Building Assisted by Extension (Karakoram Fault, Eastern Pamir). Geol. 22 (8), 707–710. doi:10.1130/0091-7613(1994)022<0707:ksnfte>2.3.co;2
Bull, W. B., and Mcfadden, L. D. (1977). “Tectonic Geomorphology north and South of the Garlock Fault, California,” in Geomorphology in Arid Regions. Proceedings of the Eighth Annual Geomorphology Symposium. Editor D. O. Doehring (Binghamton: State University of New York), 115–138.
Burbank, D. W., Blythe, A. E., Putkonen, J., Pratt-Sitaula, B., Gabet, E., Oskin, M., et al. (2003). Decoupling of Erosion and Precipitation in the Himalayas. Nature. 426 (6967), 652–655. doi:10.1038/nature02187
Burtman, V. S., and Molnar, P. (1993). Geological and Geophysical Evidence for Deep Subduction of Continental Crust beneath the Pamir. Geol. Soc. America Spec. Paper. 281, 1–76. doi:10.1130/spe281-p1
Cai, Z., Xu, Z., Cao, H., Robinson, A. C., Li, G., and Xu, X. (2017). Miocene Exhumation of Northeast Pamir: Deformation and Geo/Thermochronological Evidence from Western Muztaghata Shear Zone and Kuke Ductile Shear Zone. J. Struct. Geology. 102, 130–146. doi:10.1016/j.jsg.2017.07.010
Cao, K., Wang, G.-C., van der Beek, P., Bernet, M., and Zhang, K.-X. (2013a). Cenozoic Thermo-Tectonic Evolution of the Northeastern Pamir Revealed by Zircon and Apatite Fission-Track Thermochronology. Tectonophysics. 589, 17–32. doi:10.1016/j.tecto.2012.12.038
Cao, K., Bernet, M., Wang, G.-C., van der Beek, P., Wang, A., Zhang, K.-X., et al. (2013b). Focused Pliocene-Quaternary Exhumation of the Eastern Pamir Domes, Western China. Earth Planet. Sci. Lett. 363, 16–26. doi:10.1016/j.epsl.2012.12.023
Chapman, J. B., Carrapa, B., Ballato, P., DeCelles, P. G., Worthington, J., Oimahmadov, I., et al. (2017). Intracontinental Subduction beneath the Pamir Mountains: Constraints from Thermokinematic Modeling of Shortening in the Tajik Fold-And-Thrust belt. Geol. Soc. America Bull. 129 (11-12), 1450. doi:10.1130/b31730.1
Chen, S., and Chen, H. (2020). Late Cenozoic Activity of the Tashkurgan Normal Fault and Implications for the Origin of the Kongur Shan Extensional System, Eastern Pamir. J. Earth Sci. 31 (4), 723–734. doi:10.1007/s12583-020-1282-1
Chen, X., Chen, H., Lin, X., Cheng, X., Yang, R., Ding, W., et al. (2018). Arcuate Pamir in the Paleogene? Insights from a Review of Stratigraphy and Sedimentology of the basin Fills in the Foreland of NE Chinese Pamir, Western Tarim Basin. Earth-Science Rev. 180, 1–16. doi:10.1016/j.earscirev.2018.03.003
Chen, Y., Sung, Q., and Cheng, K. (2003). Along-strike Variations of Morphotectonic Features in the Western Foothills of Taiwan: Tectonic Implications Based on Stream-Gradient and Hypsometric Analysis. Geomorphology. 56 (1-2), 109–137. doi:10.1016/s0169-555x(03)00059-x
Chevalier, M.-L., Pan, J., Li, H., Liu, D., and Wang, M. (2015). Quantification of Both normal and Right-Lateral Late Quaternary Activity along the Kongur Shan Extensional System, Chinese Pamir. Terra Nova. 27 (5), 379–391. doi:10.1111/ter.12170
Chevalier, M., Li, H., Pan, J., Pei, J., Wu, F., Xu, W., et al. (2011). Fast Slip-Rate along the Northern End of the Karakorum Fault System, Western Tibet. Geophys. Res. Lett. 38 (22), L22309. doi:10.1029/2011gl049921
Coutand, I., Strecker, M. R., Arrowsmith, J. R., Hilley, G., Thiede, R. C., Korjenkov, A., et al. (2002). Late Cenozoic Tectonic Development of the Intramontane Alai Valley, (Pamir-Tien Shan Region, central Asia): An Example of Intracontinental Deformation Due to the Indo-Eurasia Collision. Tectonics. 21 (6), 1053. doi:10.1029/2002tc001358
Cowgill, E. (2010). Cenozoic Right-Slip Faulting along the Eastern Margin of the Pamir Salient, Northwestern China. Geol. Soc. America Bull. 122 (1-2), 145–161. doi:10.1130/b26520.1
Dietrich, W. E., Seidl, M. A., and Howard, A. D. (1994). Modeling Fluvial Erosion on Regional to continental Scales. J. Geophys. Res. Solid Earth 99 (B7), 13971–13986. doi:10.1029/94JB00744
Duan, K., Yao, T., Wang, N., Tian, L., Xu, B., and Wu, G. (2007). Records of Precipitation in the Muztag Ata Ice Core and its Climate Significance to Glacier Water Resources. J. Glaciology Geocryology. 5, 680–684. doi:10.1631/jzus.2007.A1858 (in Chinese with English abstract)
Egholm, D. L., Nielsen, S. B., Pedersen, V. K., and Lesemann, J.-E. (2009). Glacial Effects Limiting Mountain Height. Nature 460 (7257), 884–887. doi:10.1038/nature08263
El Hamdouni, R., Irigaray, C., Fernández, T., Chacón, J., and Keller, E. A. (2008). Assessment of Relative Active Tectonics, Southwest Border of the Sierra Nevada (Southern Spain). Geomorphology 96 (1-2), 150–173. doi:10.1016/j.geomorph.2007.08.004
Finnegan, N. J., Roe, G., Montgomery, D. R., and Hallet, B. (2005). Controls on the Channel Width of Rivers: Implications for Modeling Fluvial Incision of Bedrock. Geol 33 (3), 229. doi:10.1130/g21171.1
Flint, J. J. (1974). Stream Gradient as a Function of Order, Magnitude, and Discharge. Water Resour. Res. 10 (5), 969–973. doi:10.1029/wr010i005p00969
Hack, J. T. (1973). Stream-profile Analysis and Stream-Gradient index. J. Res. U. S. Geol. Surv. 1 (4), 421–429.
Hallet, B., Hunter, L., and Bogen, J. (1996). Rates of Erosion and Sediment Evacuation by Glaciers: A Review of Field Data and Their Implications. Glob. Planet. Change 12 (1-4), 213–235. doi:10.1016/0921-8181(95)00021-6
Herman, F., Seward, D., Valla, P. G., Carter, A., Kohn, B., Willett, S. D., et al. (2013). Worldwide Acceleration of Mountain Erosion under a Cooling Climate. Nature 504 (7480), 423–426. doi:10.1038/nature12877
Howard, A. D., Dietrich, W. E., and Seidl, M. A. (1994). Modeling Fluvial Erosion on Regional to continental Scales. J. Geophys. Res. 99 (B7), 13971–13986. doi:10.1029/94jb00744
Howard, A. D., and Kerby, G. (1983). Channel Changes in Badlands. Geol. Soc. America Bull. 94 (6), 739–752. doi:10.1130/0016-7606(1983)94<739:ccib>2.0.co;2
Keller, E. A., and Pinter, N. (2001). Active Tectonics: Earthquakes, Uplift, and Landscape. New Jersey: Prentice-Hall Pearson Education, 362.
Kirby, E., and Whipple, K. (2001). Quantifying Differential Rock-Uplift Rates via Stream Profile Analysis. Geol 29 (5), 415–418. doi:10.1130/0091-7613(2001)029<0415:qdrurv>2.0.co;2
Kirby, E., and Whipple, K. X. (2012). Expression of Active Tectonics in Erosional Landscapes. J. Struct. Geology. 44 (0), 54–75. doi:10.1016/j.jsg.2012.07.009
Kirkbride, M., and Matthews, D. (1997). The Role of Fluvial and Glacial Erosion in Landscape Evolution: The Ben Ohau Range, New Zealand. Earth Surf. Process. Landforms 22 (3), 317–327. doi:10.1002/(sici)1096-9837(199703)22:3<317:aid-esp760>3.0.co;2-i
Koons, P. O., Zeitler, P. K., Chamberlain, C. P., Craw, D., and Meltzer, A. S. (2002). Mechanical Links between Erosion and Metamorphism in Nanga Parbat, Pakistan Himalaya. Am. J. Sci. 302 (9), 749–773. doi:10.2475/ajs.302.9.749
Korup, O., and Schlunegger, F. (2009). Rock-type Control on Erosion-Induced Uplift, Eastern Swiss Alps. Earth Planet. Sci. Lett. 278 (3-4), 278–285. doi:10.1016/j.epsl.2008.12.012
Li, T., Schoenbohm, L. M., Chen, J., Yuan, Z., Feng, W., Li, W., et al. (2019). Cumulative and Coseismic (During the 2016 M W 6.6 Aketao Earthquake) Deformation of the Dextral‐Slip Muji Fault, Northeastern Pamir Orogen. Tectonics 38 (11), 3975–3989. doi:10.1029/2019tc005680
Li, W., Chen, J., Yuan, Z., Huang, M., Li, T., Yu, S., et al. (2011). Coseismic Surface Ruptures of Multi Segments and Seismogenic Fault of the Tashkorgan Earthquake in Pamir,1895. Seismology Geology. 33 (02), 260–276. doi:10.3969/j.issn.0253-4967.2011.02.002 (in Chinese with English abstract)
Li, Y., Robinson, A. C., Gadoev, M., and Oimuhammadzoda, I. (2020). Was the Pamir Salient Built Along a Late Paleozoic Embayment on the Southern Asian Margin?. Earth Planet. Sci. Lett. 550, 116554. doi:10.1016/j.epsl.2020.116554
Lifton, N. A., and Chase, C. G. (1992). Tectonic, Climatic and Lithologic Influences on Landscape Fractal Dimension and Hypsometry: Implications for Landscape Evolution in the San Gabriel Mountains, California. Geomorphology 5 (1), 77–114. doi:10.1016/0169-555x(92)90059-w
Liu-Zeng, J., Wen, L., Oskin, M., and Zeng, L. (2011). Focused Modern Denudation of the Longmen Shan Margin, Eastern Tibetan Plateau. Geochem. Geophys. Geosyst. 12 (11), Q11007. doi:10.1029/2011gc003652
MacGregor, K. R., Anderson, R. S., Anderson, S. P., and Waddington, E. D. (2000). Numerical Simulations of Glacial-valley Longitudinal Profile Evolution. Geology 28 (11), 1031–1034. doi:10.1130/0091-7613(2000)028<1031:nsogvl>2.3.co;2
Molnar, P. (2004). Late Cenozoic Increase in Accumulation Rates of Terrestrial Sediment: How Might Climate Change Have Affected Erosion Rates? Annu. Rev. Earth Planet. Sci. 32 (1), 67–89. doi:10.1146/annurev.earth.32.091003.143456
Montgomery, D. R., and Brandon, M. T. (2002). Topographic Controls on Erosion Rates in Tectonically Active Mountain Ranges. Earth Planet. Sci. Lett. 201 (3), 481–489. doi:10.1016/s0012-821x(02)00725-2
Naylor, S., and Gabet, E. J. (2007). Valley Asymmetry and Glacial versus Nonglacial Erosion in the Bitterroot Range, Montana, USA. Geol 35 (4), 375–378. doi:10.1130/g23283a.1
Owen, L. A., Chen, J., Hedrick, K. A., Caffee, M. W., Robinson, A. C., Schoenbohm, L. M., et al. (2012). Quaternary Glaciation of the Tashkurgan Valley, Southeast Pamir. Quat. Sci. Rev. 47 (0), 56–72. doi:10.1016/j.quascirev.2012.04.027
Pérez-Peña, J. V., Azan, J. M., and Azor, A. (2009). CalHypso: An ArcGIS Extension to Calculate Hypsometric Curves and Their Statistical Moments. Applications to Drainage basin Analysis in SE Spain. Comput. Geosciences 35 (6), 1214–1223. doi:10.1016/j.cageo.2008.06.006
Perron, J. T., and Royden, L. (2013). An Integral Approach to Bedrock River Profile Analysis. Earth Surf. Process. Landforms 38 (6), 570–576. doi:10.1002/esp.3302
Ramírez-Herrera, M. T. (1998). Geomorphic Assessment of Active Tectonics in the Acambay Graben, Mexican Volcanic Belt. Earth Surf. Process. Landforms 23 (4), 317–332. doi:10.1002/(SICI)1096-9837(199804)23:43.3.CO;2-M
Reiners, P. W., Ehlers, T. A., Mitchell, S. G., and Montgomery, D. R. (2003). Coupled Spatial Variations in Precipitation and Long-Term Erosion Rates across the Washington Cascades. Nature 426 (6967), 645–647. doi:10.1038/nature02111
Replumaz, A., San José, M., Margirier, A., Beek, P., Gautheron, C., Leloup, P. H., et al. (2020). Tectonic Control on Rapid Late‐Miocene -Quaternary Incision of the Mekong River Knickzone, Southeast Tibetan Plateau. Tectonics 39 (2), e2019TC005782. doi:10.1029/2019tc005782
Robert, X., van der Beek, P., Braun, J., Perry, C., Dubille, M., and Mugnier, J.-L. (2009). Assessing Quaternary Reactivation of the Main Central Thrust Zone (central Nepal Himalaya): New Thermochronologic Data and Numerical Modeling. Geology 37 (8), 731–734. doi:10.1130/g25736a.1
Robinson, A. C., Yin, A., and Lovera, O. M. (2010). The Role of Footwall Deformation and Denudation in Controlling Cooling Age Patterns of Detachment Systems: An Application to the Kongur Shan Extensional System in the Eastern Pamir, China. Tectonophysics 496 (1-4), 28–43. doi:10.1016/j.tecto.2010.10.003
Robinson, A. C., Yin, A., Manning, C. E., Harrison, T. M., Zhang, S. H., and Wang, X. F. (2004). Tectonic Evolution of the Northeastern Pamir: Constraints from the Northern Portion of the Cenozoic Kongur Shan Extensional System, Western China. Geol. Soc. America Bull. 116 (7-8), 953–973. doi:10.1130/b25375.1
Robinson, A. C., Yin, A., Manning, C. E., Harrison, T. M., Zhang, S., and Wang, X. (2007). Cenozoic Evolution of the Eastern Pamir: Implications for Strain-Accommodation Mechanisms at the Western End of the Himalayan-Tibetan Orogen. Geol. Soc. America Bull. 119 (7-8), 882–896. doi:10.1130/b25981.1
Rutte, D., Ratschbacher, L., Schneider, S., Stübner, K., Stearns, M. A., Gulzar, M. A., et al. (2017a). Building the Pamir-Tibetan Plateau-Crustal Stacking, Extensional Collapse, and Lateral Extrusion in the Central Pamir: 1. Geometry and Kinematics. Tectonics 36 (3), 342–384. doi:10.1002/2016tc004293
Rutte, D., Ratschbacher, L., Khan, J., Stübner, K., Hacker, B. R., Stearns, M. A., et al. (2017b). Building the Pamir-Tibetan Plateau-Crustal Stacking, Extensional Collapse, and Lateral Extrusion in the Central Pamir: 2. Timing and Rates. Tectonics 36 (3), 385–419. doi:10.1002/2016tc004294
Scherler, D., Bookhagen, B., and Strecker, M. R. (2011). Hillslope-glacier Coupling: The Interplay of Topography and Glacial Dynamics in High Asia. J. Geophys. Res. Earth Surf. 116 (F2), F02019. doi:10.1029/2010jf001751
Schoenbohm, L. M., Chen, J., Stutz, J., Sobel, E. R., Thiede, R. C., Kirby, B., et al. (2014). Glacial Morphology in the Chinese Pamir: Connections Among Climate, Erosion, Topography, Lithology and Exhumation. Geomorphology 221, 1–17. doi:10.1016/j.geomorph.2014.05.023
Schwab, M., Ratschbacher, L., Siebel, W., McWilliams, M., Minaev, V., Lutkov, V., et al. (2004). Assembly of the Pamirs: Age and Origin of Magmatic Belts from the Southern Tien Shan to the Southern Pamirs and Their Relation to Tibet. Tectonics 23 (4), TC4002. doi:10.1029/2003tc001583
Seong, Y. B., Owen, L. A., Yi, C., Finkel, R. C., and Schoenbohm, L. (2009a). Geomorphology of Anomalously High Glaciated Mountains at the Northwestern End of Tibet: Muztag Ata and Kongur Shan. Geomorphology 103 (2), 227–250. doi:10.1016/j.geomorph.2008.04.025
Seong, Y. B., Owen, L. A., Yi, C., Finkel, R. C., Brunel, M., Arnaud, N., et al. (2009b). Quaternary Glaciation of Muztag Ata and Kongur Shan: Evidence for Glacier Response to Rapid Climate Changes throughout the Late Glacial and Holocene in Westernmost Tibet. Geol. Soc. America Bull. 121 (3-4), 348–365. doi:10.1130/b26339.1
Shuster, D. L., Cuffey, K. M., Sanders, J. W., and Balco, G. (2011). Thermochronometry Reveals Headward Propagation of Erosion in an Alpine Landscape. Science 332 (6025), 84–88. doi:10.1126/science.1198401
Sklar, L. S., and Dietrich, W. E. (2001). Sediment and Rock Strength Controls on River Incision into Bedrock. Geol 29 (12), 1087. doi:10.1130/0091-7613(2001)029<1087:sarsco>2.0.co;2
Snyder, N. P., Whipple, K. X., Tucker, G. E., and Merritts, D. J. (2000). Landscape Response to Tectonic Forcing Digital Elevation Model Analysis of Stream Profiles in the Mendocino Triple junction Region, Northern California. GSA Bull. 8 (112), 1250–1263. doi:10.1130/0016-7606(2000)112<1250:lrttfd>2.0.co;2
Sobel, E. R., Schoenbohm, L. M., Chen, J., Thiede, R., Stockli, D. F., Sudo, M., et al. (2011). Late Miocene-Pliocene Deceleration of Dextral Slip between Pamir and Tarim: Implications for Pamir Orogenesis. Earth Planet. Sci. Lett. 304 (3-4), 369–378. doi:10.1016/j.epsl.2011.02.012
Sobel, E. R., and Dumitru, T. A. (1997). Thrusting and Exhumation Around the Margins of the Western Tarim Basin during the India-Asia Collision. J. Geophys. Res. 102 (B3), 5043–5063. doi:10.1029/96jb03267
Spotila, J. A., Buscher, J. T., Meigs, A. J., and Reiners, P. W. (2004). Long-term Glacial Erosion of Active Mountain Belts: Example of the Chugach-St. Elias Range, Alaska. Geol 32 (6), 501–504. doi:10.1130/g20343.1
Stock, J. D., and Montgomery, D. R. (1999). Geologic Constraints on Bedrock River Incision Using the Stream Power Law. J. Geophys. Res. 104 (B3), 4983–4993. doi:10.1029/98jb02139
Strahler, A. N. (1952). Hypsometric (Area-altitude) Analysis of Erosional Topography. Geol. Soc. America Bull. 63 (11), 1117–1142. doi:10.1130/0016-7606(1952)63[1117:haaoet]2.0.co;2
Stübner, K., Ratschbacher, L., Rutte, D., Stanek, K., Minaev, V., Wiesinger, M., et al. (2013). The Giant Shakhdara Migmatitic Gneiss Dome, Pamir, India-Asia Collision Zone: 1. Geometry and Kinematics. Tectonics 32 (4), 948–979.
Thiede, R. C., Bookhagen, B., Arrowsmith, J. R., Sobel, E. R., and Strecker, M. R. (2004). Climatic Control on Rapid Exhumation along the Southern Himalayan Front. Earth Planet. Sci. Lett. 222 (3-4), 791–806. doi:10.1016/j.epsl.2004.03.015
Thiede, R. C., Sobel, E. R., Chen, J., Schoenbohm, L. M., Stockli, D. F., Sudo, M., et al. (2013). Late Cenozoic Extension and Crustal Doming in the India-Eurasia Collision Zone: New Thermochronologic Constraints from the NE Chinese Pamir. Tectonics 32, 1–17. doi:10.1002/tect.20050
Thomson, S. N., Brandon, M. T., Tomkin, J. H., Reiners, P. W., Vásquez, C., and Wilson, N. J. (2010). Glaciation as a Destructive and Constructive Control on Mountain Building. Nature 467 (7313), 313–317. doi:10.1038/nature09365
Tucker, G. E., and Whipple, K. X. (2002). Topographic Outcomes Predicted by Stream Erosion Models: Sensitivity Analysis and Intermodel Comparison. J. Geophys. Res. Solid Earth 107 (B9), 2179. doi:10.1029/2001jb000162
Whipple, K. X. (2004). Bedrock Rivers and the Geomorphology of Active Orogens. Annu. Rev. Earth Planet. Sci. 32, 151–185. doi:10.1146/annurev.earth.32.101802.120356
Whipple, K. X. (2009). The Influence of Climate on the Tectonic Evolution of Mountain Belts. Nat. Geosci 2 (2), 97–104. doi:10.1038/ngeo413
Whipple, K. X., and Tucker, G. E. (1999). Dynamics of the Stream-Power River Incision Model: Implications for Height Limits of Mountain Ranges, Landscape Response Timescales, and Research Needs. J. Geophys. Res. 104 (B8), 17661–17674. doi:10.1029/1999jb900120
Whittaker, A. C., Attal, M., Cowie, P. A., Tucker, G. E., and Roberts, G. (2008). Decoding Temporal and Spatial Patterns of Fault Uplift Using Transient River Long Profiles. Geomorphology 100 (3–4), 506–526. doi:10.1016/j.geomorph.2008.01.018
Wobus, C., Whipple, K. X., Kirby, E., Snyder, N., Johnson, J., Spyropolou, K., et al. (2006). Tectonics from Topography: Procedures, Promise, and Pitfalls. Geol. Soc. America Spec. Pap. 398, 55–74. doi:10.1130/2006.2398(04)
Worthington, J. R., Ratschbacher, L., Stübner, K., Khan, J., Malz, N., Schneider, S., et al. (2020). The Alichur Dome, South Pamir, Western India-Asia Collisional Zone: Detailing the Neogene Shakhdara-Alichur Syn-Collisional Gneiss-Dome Complex and Connection to Lithospheric Processes. Tectonics 39 (1), e2019TC005735. doi:10.1029/2019tc005735
Yuan, Z., Chen, J., Owen, L. A., Hedrick, K. A., Caffee, M. W., Li, W., et al. (2013). Nature and Timing of Large Landslides within an Active Orogen, Eastern Pamir, China. Geomorphology 182 (0), 49–65. doi:10.1016/j.geomorph.2012.10.028
Zeitler, P. K., Meltzer, A. S., Koons, P. O., Craw, D., Hallet, B., Chamberlain, C. P., et al. (2001). Erosion, Himalayan Geodynamics, and the Geomorphology of Metamorphism. GSA Today 11 (1), 4–9. doi:10.1130/1052-5173(2001)011<0004:ehgatg>2.0.co;2
Zhang, P., Molnar, P., and Downs, W. R. (2001). Increased Sedimentation Rates and Grain Sizes 2-4 Myr Ago Due to the Influence of Climate Change on Erosion Rates. Nature 410 (6831), 891–897. doi:10.1038/35073504
Keywords: Pamir, gneiss dome, Kongur Shan extensional system, geomorphic indices, active tectonics, stream power erosion model
Citation: Cao K, Mai H, Chevalier M-L and Wang G (2022) Tectonic and Climatic Control on Quaternary Exhumation in the Eastern Pamir Domes, Western China: Insights From Geomorphic Approaches. Front. Earth Sci. 10:839203. doi: 10.3389/feart.2022.839203
Received: 19 December 2021; Accepted: 28 January 2022;
Published: 17 February 2022.
Edited by:
Yunfa Miao, Northwest Institute of Eco-Environment and Resources (CAS), ChinaCopyright © 2022 Cao, Mai, Chevalier and Wang. This is an open-access article distributed under the terms of the Creative Commons Attribution License (CC BY). The use, distribution or reproduction in other forums is permitted, provided the original author(s) and the copyright owner(s) are credited and that the original publication in this journal is cited, in accordance with accepted academic practice. No use, distribution or reproduction is permitted which does not comply with these terms.
*Correspondence: Kai Cao, a2FpLmNhb0BjdWcuZWR1LmNu